Article

Application of Industrial Internet for Equipment Asset Management in Social Digitalization Platform Based on System Engineering Using Fuzzy DEMATEL-TOPSIS

1
Institute of Industrial Engineering and Management, School of Mechanical Engineering, Shanghai Jiao Tong University, Shanghai 200240, China
2
SJTUSME-COSMOPlat Joint Research Center for New Generation Industrial Intelligent Technology, School of Mechanical Engineering, Shanghai Jiao Tong University, Shanghai 200240, China
*
Author to whom correspondence should be addressed.
Machines 2022, 10(12), 1137; https://doi.org/10.3390/machines10121137
Submission received: 29 September 2022 / Revised: 17 November 2022 / Accepted: 20 November 2022 / Published: 29 November 2022
(This article belongs to the Special Issue Social Manufacturing on Industrial Internet)

Abstract

:
In any industry, Equipment Asset Management (EAM) is at the core of the production activities. With the rapid development of Industrial Internet technologies and platforms, the EAM based on the Industrial Internet has become an important development trend. Meanwhile, the paradigm of EAM is changing, from a single machine to integrated systems, from the phase of using them to the end of their lifecycle, from breakdown maintenance to predictive maintenance, and from local decision-making to collaborative optimization. However, because of the lack of a unified understanding of the Industrial Internet platforms (IIPs) and the lack of a comprehensive reference architecture and detailed implementation framework, the implementation of EAM projects will face greater risks according to special needs in different industries. Based on the method of system engineering, this study proposes a general reference model and a reference architecture of implementation for the Industrial Internet Solution for Industrial Equipment Asset Management (I3EAM). Further, to help enterprise to evaluate and select their best-fit I3EAM scheme and platform partner, we proposed a set of performance indicators of I3EAM schemes and a quantitative decision-making method based on fuzzy DEMATEL-TOPSIS. Finally, a case study for an I3EAM in automated container terminals was conducted. In the multi-criteria decision environment with complex uncertainty, the project group identified the I3EAM metrics priorities and social digitalization platforms that were more in line with the actual needs of the automated container terminal and firms. The complexity and time of the decision-making process were dramatically reduced. In terms of feasibility and validity, the decision result was positively verified by the feedback from the enterprise implementation. The given model, architecture, and method in this study can create a certain reference value for various industrial enterprises to carry out the analysis and top-level planning of their I3EAM needs and choose the partner for co-implementation. In addition, the research results of this study have the potential to support the construction of standard systems and the planning and optimization of the cross-domain social platform, etc.

1. Introduction

Smart manufacturing represents the development trend of the global industry, and the integration, construction, and application of smart factories based on cyber-physical systems are leading the change in the manufacturing paradigm. Equipment Asset Management (EAM) plays an important role in a smart factory, and it becomes a necessary guarantee of achieving reliable and efficient production [1]. With the development of Industrial Internet technologies, equipment operation and maintenance (O and M) businesses have shifted from traditional regular inspection and contingent maintenance to data-driven equipment lifecycle management and predictive maintenance [2,3,4]. In China, nearly 40% of the Industrial Internet platforms focus on applications and solutions for equipment management. Through the interconnection of machines, processes, and people, the efficiency of equipment maintenance has been improved, and the networked collaborative evolution of various production factors and business processes closely related to equipment assets has been further realized [5,6]. Since complex equipment usually has high added value, the initial ecosystem for the operation and maintenance services will gradually form around the value chain of equipment [7,8], involving the equipment owners (factories/enterprises), equipment manufacturers, module suppliers, material suppliers, service providers, etc. In addition, based on Industrial Internet platforms and technologies, many outstanding solution providers for equipment operation and maintenance have emerged, such as Siemens MindSphere, GE Predix, SANY ROOTCLOUD, etc. Third-party Industrial Internet Platforms (IIPs) have become a common option for enterprises to achieve digitalization. Industrial enterprises leverage the platform’s technical capabilities and ecosystem to accelerate business–IT alignment in different scenarios, including the EAM scenario.
However, the industry still lacks a unified understanding of the IIP [9], and only a few studies have focused on the detailed implementation framework and path for special industrial needs [10]. It is difficult for industrial enterprises to comprehensively and precisely identify the implementation needs and choose their best-fit IIP. All of the above factors will lead to them incurring the risk of EAM projects. In addition, according to our previous work [11], a systematic model and reference architecture are necessary for the collaboration platforms with various industrial enterprises across different fields. This study also conducted a comprehensive status review of the studies on the Industrial Internet-based EAM (Section 2). To our best knowledge and industrial investigations across a wide range, the current research mainly focuses on the explicit technologies of EAM schemes, while relatively few studies have focused on the comprehensive top-level framework and implementation path. It hinders the application and synergy of Industrial Internet technologies and platforms in the field of industrial EAM.
The research motivation and objective of this paper is to improve the capability of complex system awareness and decision-making for EAM projects with Industrial Internet technologies and to provide a reference for the top-level planning and effective implementation of different industrial enterprises. This study proposes a general reference model and a reference architecture of implementation for the Industrial Internet Solution for Industrial Equipment Asset Management (I3EAM). In addition, this study also develops a set of performance indicators of I3EAM and a scheme selection method by using fuzzy the DEMATEL-TOPSIS approach. A case study of its practice in an automated container terminal project demonstrates the feasibility and efficiency of the proposed model, architecture, and approach. In addition, the research results of this study have the potential to support the construction of standard systems, and the planning and optimization of cross-domain social platforms, etc.
The organization structure of this paper is arranged as follows. Section 2 conducts a status review of the studies on Industrial Internet for EAM. Section 3 introduces the main research methodology for a system analysis of I3EAM. In Section 4 and Section 5, a general reference model and a reference architecture of I3EAM in the social digitalization platform are proposed and clarified, respectively. Section 6 introduces an effective method for the evaluation and selection of the I3EAM schemes. In Section 7, a real industry case study is conducted to validate the proposed model, architecture, and method. Finally, the discussion, conclusions and future works of this study are given in Section 8.

2. Status Review for Industrial Internet and EAM

2.1. Related Concepts

2.1.1. Industrial Internet

In 2012, GE first introduced the concept of “Industrial Internet”. The Industrial Internet was defined as the third wave in the development of the technological revolution. They defined the Industrial Internet as “the convergence of the global industrial system with the power of advanced computing, analytics, low-cost sensing and new levels of connectivity permitted by the internet”. Subsequently, GE, along with Cisco, Intel, AT&T, IBM, and other companies, formed the Industrial Internet Consortium (IIC) [9]. The IIC proposed the Industrial Internet of Things (IIoT) system and defined it as “a system that connects and integrates industrial control systems with enterprise systems, business processes and analytics” [12]. From the IIC’s reference architecture [12], the Industrial Internet will serve multiple industrial sectors, covering the manufacturing, transportation, energy, health care ones, and more. In China, in 2010, the Internet Society of China proposed that they were “to take into account both consumer and production-oriented Internet”. The Alliance of Industrial Internet (AII) regards the Industrial Internet as a new industrial ecology, a key infrastructure, and a new application model. The AII proposed that the core connotation of Industrial Internet is to realize the comprehensive connection of the whole element, the whole industrial chain and the whole value chain through the comprehensive interconnection of people, machines, and things. Industrial Internet System Architecture 2.0 (China) [13], together with IIRA (USA) [12], RAMI4.0 (Germany) [14] and IVRA (Japan) [15] have become the main reference architecture worldwide that are used to guide the exploration and practice of Industrial Internet applications.

2.1.2. Equipment Asset Management (EAM)

Manufacturing companies are highly dependent on the proper operation of their equipment assets to ensure good business operations [1,5,8]. The purpose of Equipment Asset Management is to reduce the asset’s maintenance and repair costs, extend the asset’s life, and improve the asset’s utilization [1]. Asset management is defined as “a set of strategic, integrated and comprehensive processes (finance, management, engineering, operations and maintenance) to obtain maximum lifecycle efficiency, utilization and return from physical assets (production and operating equipment and structures)” [16]. An AM system can be defined as “a system that plans and controls asset-related activities and their relationships to ensure that asset performance meets the organization’s intended competitive strategy” [17]. In practice, engineering asset management systems are increasingly focused on the full lifecycle of the engineering assets [8,18,19,20]. The Asset Life Cycle Management (ALCM) approach was proposed, which originated as a design philosophy and management principle in the U.S. Department of Defense’s weapons and equipment acquisition process. The ALCM is used to address the tension between reducing the lifecycle cost of the assets and improving the asset’s utilization [19]. In general, the whole lifecycle of the equipment refers to the entire process of designing and developing, producing, using, and safeguarding the equipment until decommissioning it, and the material recovery stage [4,8,18,20]. El-Akruti et al. developed a typical representation of the major asset-related activities in an organization, which provides a comprehensive framework for fully defining the asset management system activities and the relationships between the activities [1,17].

2.1.3. Smart Product Service System (SPSS)

Product service system (PSS) is a system of products, services, collaborative networks of the stakeholders, and supporting infrastructure, which are jointly capable of creating diverse functional and non-functional value economically and sustainably for the customers (based on [21,22,23]). Tukker categorizes PSSs into three modes, i.e., product-oriented PSS, use-oriented PSS, and result-oriented PSS [22]. After three industrial technology upgrades have taken place: mechanization, electrification, and information technology, the era of intelligence will soon come [24,25]. The products become Smart Connected Products (SCPs) through advanced sensing and IoT technologies [25], such as smart machines. Based on the concept of SCPs, Valencia et al. first proposed and defined the Smart Product Service System, which is “a bundle of SCP and the generated smart services by leveraging SCP as the media and tool, which is delivered to market for satisfying personalized needs of customers as well as providing more environmental and social benefits” [26]. With a data and knowledge-driven approach, the SPSS is able to provide more powerful and flexible capabilities than a traditional PSS can, including smart sensing, smart connectivity, smart analytics, and smart delivery [27,28]. In response to the trend of the convergence of smart machines and digital platforms, the German Academy of Engineering has proposed the concept of “smart services and its ecologization” as one of the key strategic directions of Industry 4.0 [29]. Zheng defined the Smart Product Service Ecosystem (SPSE), from the system of systems perspective, whereby the SPSE consists of six components, including relationship, user experience, smart technologies, marketing, business models, and connections [30].

2.1.4. Social Digitalization Platform (SDP)

A digitalization platform is often used to describe a centralized system to help enterprises to become digital and improve the way organizations deliver value to the customers and remain competitive [31]. Technology architecture upgrades are making digitalization platforms a standalone business model that helps application companies to achieve business–IT alignment by providing IaaS (infrastructure as a service), PaaS (platform as a service), and SaaS (software as a service) solutions [31,32]. Based on the definition of platform leverage logic (PLL) defined by Tian et al. [33] and the study of the typology of “platform” in the literature [34,35,36], we extended the leverage rationale of digitalization platforms to include production rationale, transaction rationale, customization rationale, and innovation rationale. The difference between the customization rationale and the innovation rationale is whether the platform is licensed for data sharing and utilization when one is providing digitalization solutions [32,37]. In this paper, we focus on those large, cross-industry, third-party digitalization platforms, and we refer to them as social digitalization platforms (SDPs) [38]. SDPs are third-party Industrial Internet platforms that can develop and deliver enterprise digitalization solutions for different industries or domains [32]. SDPs have stronger technical resource pools, actor connectivity, and system integration capabilities [36,37,39], while the PLL of the SDPs can be defined as being “focused on building platform ecosystem based on the innovation leverage rationale, bringing together solution suppliers, developers and users around digital servitization”. For example, the “cross-industry and cross-region” Industrial Internet platforms in China [40], e.g., Siemens MindSphere, GE Predix, etc., are typical SDPs.

2.1.5. The Relationship between Industrial Internet, EAM, SPSS, and SDP

(1)
The relationship between industrial internet and EAM
Industrial Internet technologies can support various digitalization needs, including Equipment Asset Management (EAM) [41]. EAM is a typical application scenario of Industrial Internet that is used by manufacturing companies to improve their organizational performance by establishing synergy links with the reliability of the equipment assets, key business, and stakeholders [5]. Digitalization solutions based on Industrial Internet can facilitate enterprise integration, industry chain collaboration and value chain extension around complex equipment objects and EAM-related activities [4,5,41,42]. In this paper, “Industrial Internet solution for industrial equipment asset management” is the core comprehensive concept which is used to represent a digital service solution for the EAM needs of a specific enterprise (corresponding to the “digitalization service instance” in Figure 1). For convenience, it is referred to as “I3EAM”.
(2)
The relationship between Industrial Internet, EAM, and SPSS
A Smart Product Service System (SPSS) is regarded as a bundle of the business model and a delivery system of I3EAM [30,43]. Diverse SPSSs will be developed for specific EAM-related application scenarios, such as remote maintenance [43], service network configuration [44], and design optimization [42], etc. The SPSS will include smart equipment, EAM-related digital services, stakeholder collaboration networks, and supporting infrastructure [23,45]. Multiple SPSSs will gradually form a smart product service ecosystem and create organizational benefits by generating complex relationships and synergies [46].
(3)
The relationship between Industrial Internet, EAM, SPSS, and SDP
The digitalization platform uses Industrial Internet technologies to help companies to realize their vision of digital servitization [36,47]. The Industrial Internet technology system provides an open architecture for social digital platforms to build their platform ecosystem [34], and it expands the organizational boundaries of platform-based enterprises [38]. Social digitalization platforms (SDPs) focus on building their own Industrial Internet technology platforms and provide customized EAM technical solutions and SPSSs for enterprises in different industries through the use of business models such as IaaS, PaaS, and SaaS. At the same time, SDPs will utilize interaction mechanisms (such as data sharing), external innovation resource pools, strong system integration capabilities, and platform ecosystem orchestration and governance to achieve better product/service innovation [32,37,46,47].
(4)
What are the benefits of SDP for EAM?
The value of SDPs is reflected in four aspects, (1) reducing the cost of enterprise digitalization and reducing repetitive and inefficient R&D; (2) facilitating data sharing and utilization and enhancing cross-domain knowledge transfer to cope with a wide variety of complex equipment and EAM business scenarios; (3) accelerating manufacturing enterprise, industry chain and value chain integration and collaboration on the basis of reliability of equipment assets and systems; (4) focusing on gathering solution providers, developers and users to activate the innovation capability of the platform ecosystem.

2.2. Status of Key Technologies for EAM

As shown in Table 1, the advanced Industrial Internet technologies for EAM include ten main aspects, including the key technologies for PHM such as data acquisition, signal processing, fault diagnosis, health assessment, maintenance decision-making, and remote monitoring, and co-maintenance. In data acquisition, sensing technology usually involves 13 types including the vibration, temperature, current, pressure, infrared, gas, sound, strain, position, torque, image, video, and laser types, etc. Wireless transmission, large-scale low-cost access, and intelligent edge acquisition are the main technical difficulties of the current data acquisition processes. For signal processing, its main work is to improve the signal-to-noise ratio through conducting data pre-processing, thus facilitating the extraction and highlighting of fault characteristics. Around the vibration signal, a more comprehensive vibration feature parameter library has been formed, including the time domain, frequency domain, and time-frequency domain features of the vibration signal. The interpretable physical linkage between the signal processing and the feature extraction is the key technology that is used to breaking through the machine condition monitoring. For fault diagnosis, the solutions include historical data-based decision making, physical model-based decision making, and data-driven decision making. On the one hand, the threshold and physical model approaches are suitable for edge measurement time-sensitive intelligent diagnostic operations. On the other hand, a wide variety of deep and shallow neural networks are used for online fault diagnoses to explore more robust learning methods for nonlinear mapping relationships between the data and the anomalous patterns. Thus, the physics, the data, and the expert experience are moving toward convergence, together serving the accurate identification of an early fault diagnosis and generalized migration across the devices. The core objectives in health assessment mainly include the performance degradation assessment, health index (HI) construction, and residual useful life (RUL) prediction of the machines. Monitoring the initial failure time and constructing health indices by multi-sensing signal fusion are the main research directions. In addition, the difficulty of obtaining full lifecycle data of complex equipment is a key challenge in practice, and so scaling models and migration learning will be used in some application scenarios. For maintenance decision making, fixed and empirical maintenance resource management strategies need to be optimized in conjunction with new equipment condition monitoring tools, such as optimized maintenance strategies based on equipment health indices, reliability-based preventive maintenance strategies, etc. Other maintenance resource allocation strategies should also be considered, including the scientific spare parts management, multi-skilled staffing, and overhaul of critical equipment allocation. For remote monitoring and co-maintenance, new Industrial Internet technologies have been applied to equipment operation and maintenance, such as cloud-edge collaboration, digital twins, and AR, and VR.
As shown in Table 1, there are also some other important research streams in key technologies, including service network setting and optimization, knowledge sharing and privacy preservation, equipment optimization that is driven by reliability data, and business optimization that is driven by reliability data.

2.3. Status of Industrial Application for EAM

In the terms of the application object, Industrial Internet technologies have been widely used in numerous industrial fields and industrial equipment types, including the bearings and gears of general rotating machinery [6,62,63,71,72], CNC machining centers [84,89], aircraft gas turbine engines [51,105], aircraft turbofan engine [68,70,73], sea port equipment [77], complex electromechanical systems [79], train bogies [80], and wind turbines [91], etc. Aiming at the functional requirements of EAM, different industries and equipment objects show large differences, including differences in data acquisition, signal processing, fault diagnosis, health management, maintenance decisions, and collaborative operations. Therefore, it is essential to customize the technical solution according to the actual needs.
In the term of the decision support system for PHM (Prognostics and Health Management), the typical EAM technical solution suppliers include MindSphere, Predix, ROOTCLOUD, Thingswise iDOS, and so on. Currently, most Industrial Internet platforms have established their EAM-related services and solutions. Table 2 provides a brief overview of the typical Industrial Internet platforms, as well as their EAM technical solutions and industrial applications. In addition, several scholars have provided systematic insights for the development of decision support systems for PHM. Lee et al. proposed a PHM system design and implementation methodology that includes the Streamline, Smart Processing, Synchronize and See, Standardize and Sustain stages [2]. Meanwhile, the data, predictive techniques, information management with visualization tools, standards, and closed-loop management systems are considered to be key elements of the decision support systems for equipment operation and maintenance [2]. Tao et al. introduced digital twin (DT) technology for the PHM of complex equipment [91]. Based on five dimensions: physical entities, virtual models, service activities, data, and connectivity, a componentized PHM system has been designed and performed for unified management and on-demand use [91].

3. Research Methodology

3.1. Method of System Engineering Analysis

In this paper, each particular Industrial Internet Solution for Industrial Equipment Asset Management (I3EAM) is considered as a complex artificial system that helps the companies to achieve business–IT alignment in the EAM domain. The development of a generic system model and customized implementation path for I3EAM is the research goal of this paper. The I3EAM functions for a specific enterprise’s needs will be the functional subset of the generic system model, while the social digitalization platform will provide the Industrial Internet technology system support for the customized I3EAM. The system engineering analysis method can deal with the complexity and integrity of the system, involving the system’s elements, input, output, hierarchical structure, information interaction, and self-feedback mechanism, etc. To provide a multi-faceted and comprehensive description of the I3EAM system, three dimensions is defined from the Industrial Internet element (II), Industry (I), and EAM activities. The system engineering analysis was used to explore the customization-oriented implementation path.
The general steps of the systems engineering analysis approach include clearing the questions, selecting the objectives, system synthesis, system analysis, scheme establishment, making a decision, and putting it into practice. Complex systems can be built successfully by using the system engineering processes of definition, planning, assessment, implementation, and feedback in accordance with the fictitious visions and actual needs. In this paper, the seven specific steps of system engineering analysis are shown below.
(1)
Step 1: Clear the questions (from trends and visions to demands)
EAM has become an important application scenario for Industrial Internet applications and the digitalization of manufacturing companies. From a technical perspective, new decision theories and technologies around Equipment Asset Management are constantly being developed. However, there is still a lack of system framework models around EAM in the existing literature, which hinders the precise matching of the academic research results to the industrial application needs. In terms of the service scenarios, the value of asset management extends to the full lifecycle of the equipment and business decisions of the enterprise organization. Equipment interconnection, deeper multi-level system integration, and business model innovation are promoting the creation of diverse scenarios and product service systems. From an industrial application perspective, the demand for EAM in SMEs is very active, but the backward digitalization level of the SMEs cannot support the realization of the business–IT alignment. Common models and implementation paths need to develop for supporting the customization of solution, and they will facilitate the functional improvement and synergy of the Industrial Internet platforms.
(2)
Step 2: Select the objectives (from demands to goals and measurement criteria)
The objective of this paper is to develop a generic reference model and implementation architecture for the customization of I3EAM in social digitalization platforms by using the technical architecture of Industrial Internet. Our goals are focused on exploring a systematic technical solution that meets the current state and application needs of EAM, involving break throughs in the connection of heterogeneous equipment, industrial cloud platform, industrial big data engine, industrial modelling and simulation methods, information models for collaborative, and service system planning and development.
(3)
Step 3: System synthesis (from goals to investigations and plans in detail)
In order to achieve the selected objective above, we needed to investigate, review, and refine the target system’s status quo and plan in a comprehensive manner. This process is similar to the classical approach of Business Process Reengineering, where the investigation of the current situation is considered as the process of acquiring the “as-is” of the system, while the development of the detailed plan is considered as the process of acquiring the “to-be” of the system. Our research path is presented as a combination of scientific research, industrial practice, and a case study, and it consists of four phases.
  • The first stage was to summarize and analyze the existing literature on Industrial Internet-based technologies and solutions for Equipment Asset Management (Section 2.2 and Section 2.3) and deduce the application status of I3EAM in different industries.
  • The second stage was to perform a detailed on-site investigation of the digitalization platforms and enterprises in different industries and analyze the industrial demand of I3EAM to obtain its constituent elements, functional modules, and their interaction relations.
  • The third stage was to plan and design the general model and the reference architecture of co-implementation path, which leverage the research results of the system architecture of Industrial Internet. This stage is the most crucial stage, which is divided into six sub-steps as follows:
    • Sub-step 1: Planning for the resource and edge layer of I3EAM;
    • Sub-step 2: Planning for the infrastructure and platform layer of I3EAM;
    • Sub-step 3: Planning for the big data engine layer of I3EAM;
    • Sub-step 4: Planning of the modelling and simulation layer of I3EAM;
    • Sub-step 5: Planning of the information model for integration and collaboration layer of I3EAM;
    • Sub-step 6: Planning of the organization, business, and service layer of I3EAM.
  • The fourth stage was to select the representative enterprises in typical areas as a case study and verify the reference model and detailed implementation steps of I3EAM, while helping those enterprises with the digitalization solution to achieve a top-level design and platform partner selection. Finally, the customized I3EAM usually can achieve industrial profit from operation cost reductions or the expansion of service capacities.
(4)
Step 4: System analysis (from designed system to performance metrics)
The planning and design work derives a sophisticated system and a methodology for system implementation, including (1) a general reference model (Section 4) and (2) a reference architecture for the implementation path (Section 5). The system and methodology provide a comprehensive, multi-perspective overview of and guidance on the implementation of I3EAM in different industries. In addition, a set of performance metrics were established in order to evaluate the performance of the system implementation (Section 6.1).
(5)
Step 5: Scheme collection (to collect and compare the I3EAM based on different SDPs according to the needs of the special enterprise)
I3EAMs based on specific enterprise needs are the subsets of the function and instances of the general system model. SDPs differ significantly in terms of technology, service, ecosystem, and industrial application (Section 2.3). Therefore, there are multiple potential I3EAM schemes that can meet the needs of the enterprises, but they differ in terms of their performance, cost, etc. This step focused on collecting feasible solutions from these potential digital service providers and evaluating the solutions according to the metrics framework that is presented earlier in this paper.
(6)
Step 6: Make a decision (to select an SDP partner for co-implementation with a group decision-making process)
In the set of feasible solutions, the optimal feasible solution is selected based on the special needs, decision preferences, and decision constraints of the enterprise. A group decision-making process was performed for solution evaluation and partner selection, and as well as this, the methods of fuzzy DEMATEL and TOPSIS were used to analyze the correlation between the performance metrics and to find the ideal approximate solution (Section 6).
(7)
Step 7: Put it into practice (to customize and co-implement the I3EAM, and to build feedback mechanisms between the industrial practices and the reference model/architecture)
According to the results of the above decision, the plan was implemented, including:
  • A reference model of I3EAM in the marine engineering equipment industry (Section 7.1);
  • A reference architecture of implementation path for I3EAM in marine engineering (Section 7.2);
  • The selection of the SDP partner for I3EAM co-implementation in marine engineering (Section 7.3).

3.2. The System Model for the Research of I3EAM

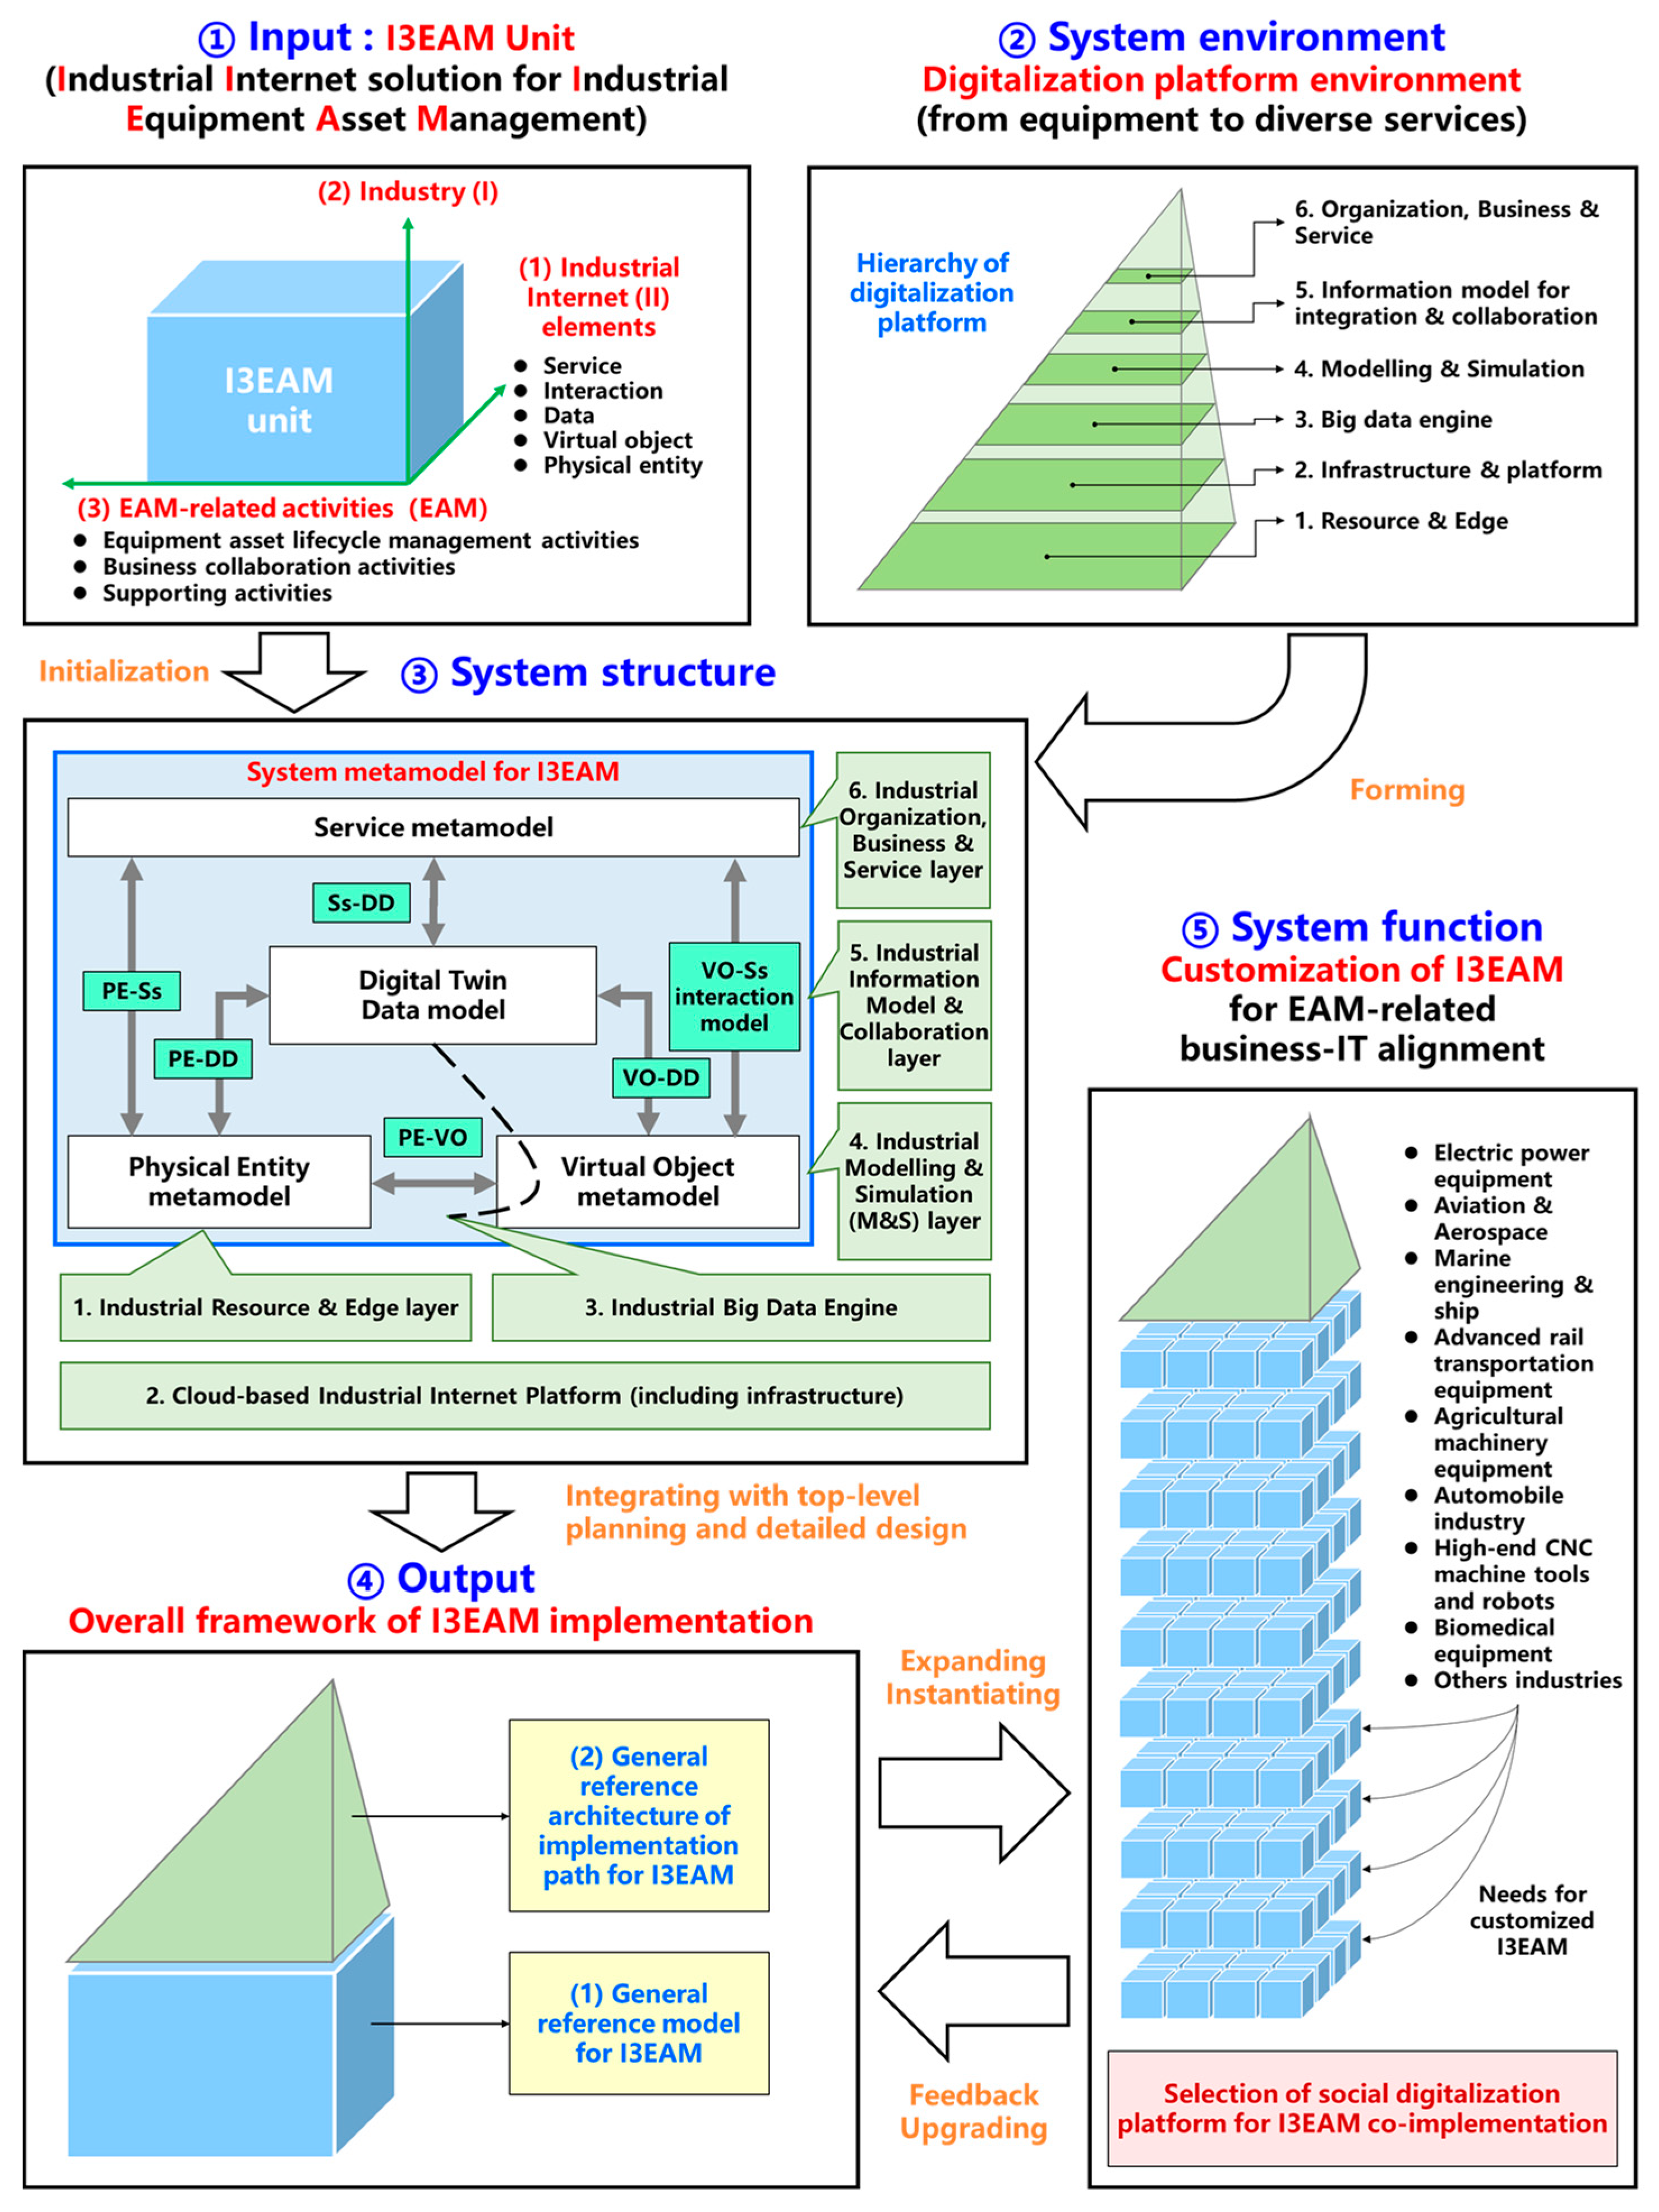
As shown in Figure 2, a system model is put forward, and it was used to conduct research of I3EAM with the support of the social digitalization platform. According to the method of system engineering above, the system model consists of the input, the system environment, the system structure, the output, and the system function.
Firstly, as the input of the whole system, the I3EAM unit is proposed with three dimensions, which are basic and independent, namely, the Industrial Internet element (II), Industry (I), and the EAM-related activities (EAM), respectively. On the basis of the Industrial Internet elements, I3EAM is designed for achieving the digitalization of the EAM-related activities following the special needs in different industries.
Secondly, the system environment I3EAM is the digitalization platform because Industrial Internet platform (IIP) provides the implementation foundation for I3EAM. Referring to Industrial Internet System Architecture 2.0 [13], the hierarchy of the IIP includes the resource and edge layer, the infrastructure and platform layer, the big data engine layer, the modelling and simulation layer, the information model layer, and the organization, business, and service layer.
Thirdly, the I3EAM unit and system environment jointly induce the system structure of I3EAM, which is mediated by a digital twin-based metamodel for complex equipment. The system metamodel is comprised of the physical entity, the virtual object, the digital twin data, the interaction, and the service. Meanwhile, the hierarchy of the Industrial Internet platform embodies the system support for five types of elements (corresponding to the system metamodel) and a unified cloud platform environment.
Next, as the output of the whole system, an overall framework of I3EAM implementation is given in a detailed manner after the system synthesis. The framework involves two parts, a general reference model for I3EAM and a general reference architecture of the implementation path for I3EAM.
Lastly, the overall framework above produces the targeted system function, to achieve the growth of the capacity of the social digitalization platforms for the customization of I3EAM and to accelerate the business–IT alignment for the special EAM-related needs in various industries. Additionally, based on a set of performance metrics, the system model can help different enterprises to select their digitalization platform partner for the co-implementation of I3EAM.t

4. A General Reference Model of I3EAM in Social Digitalization Platform

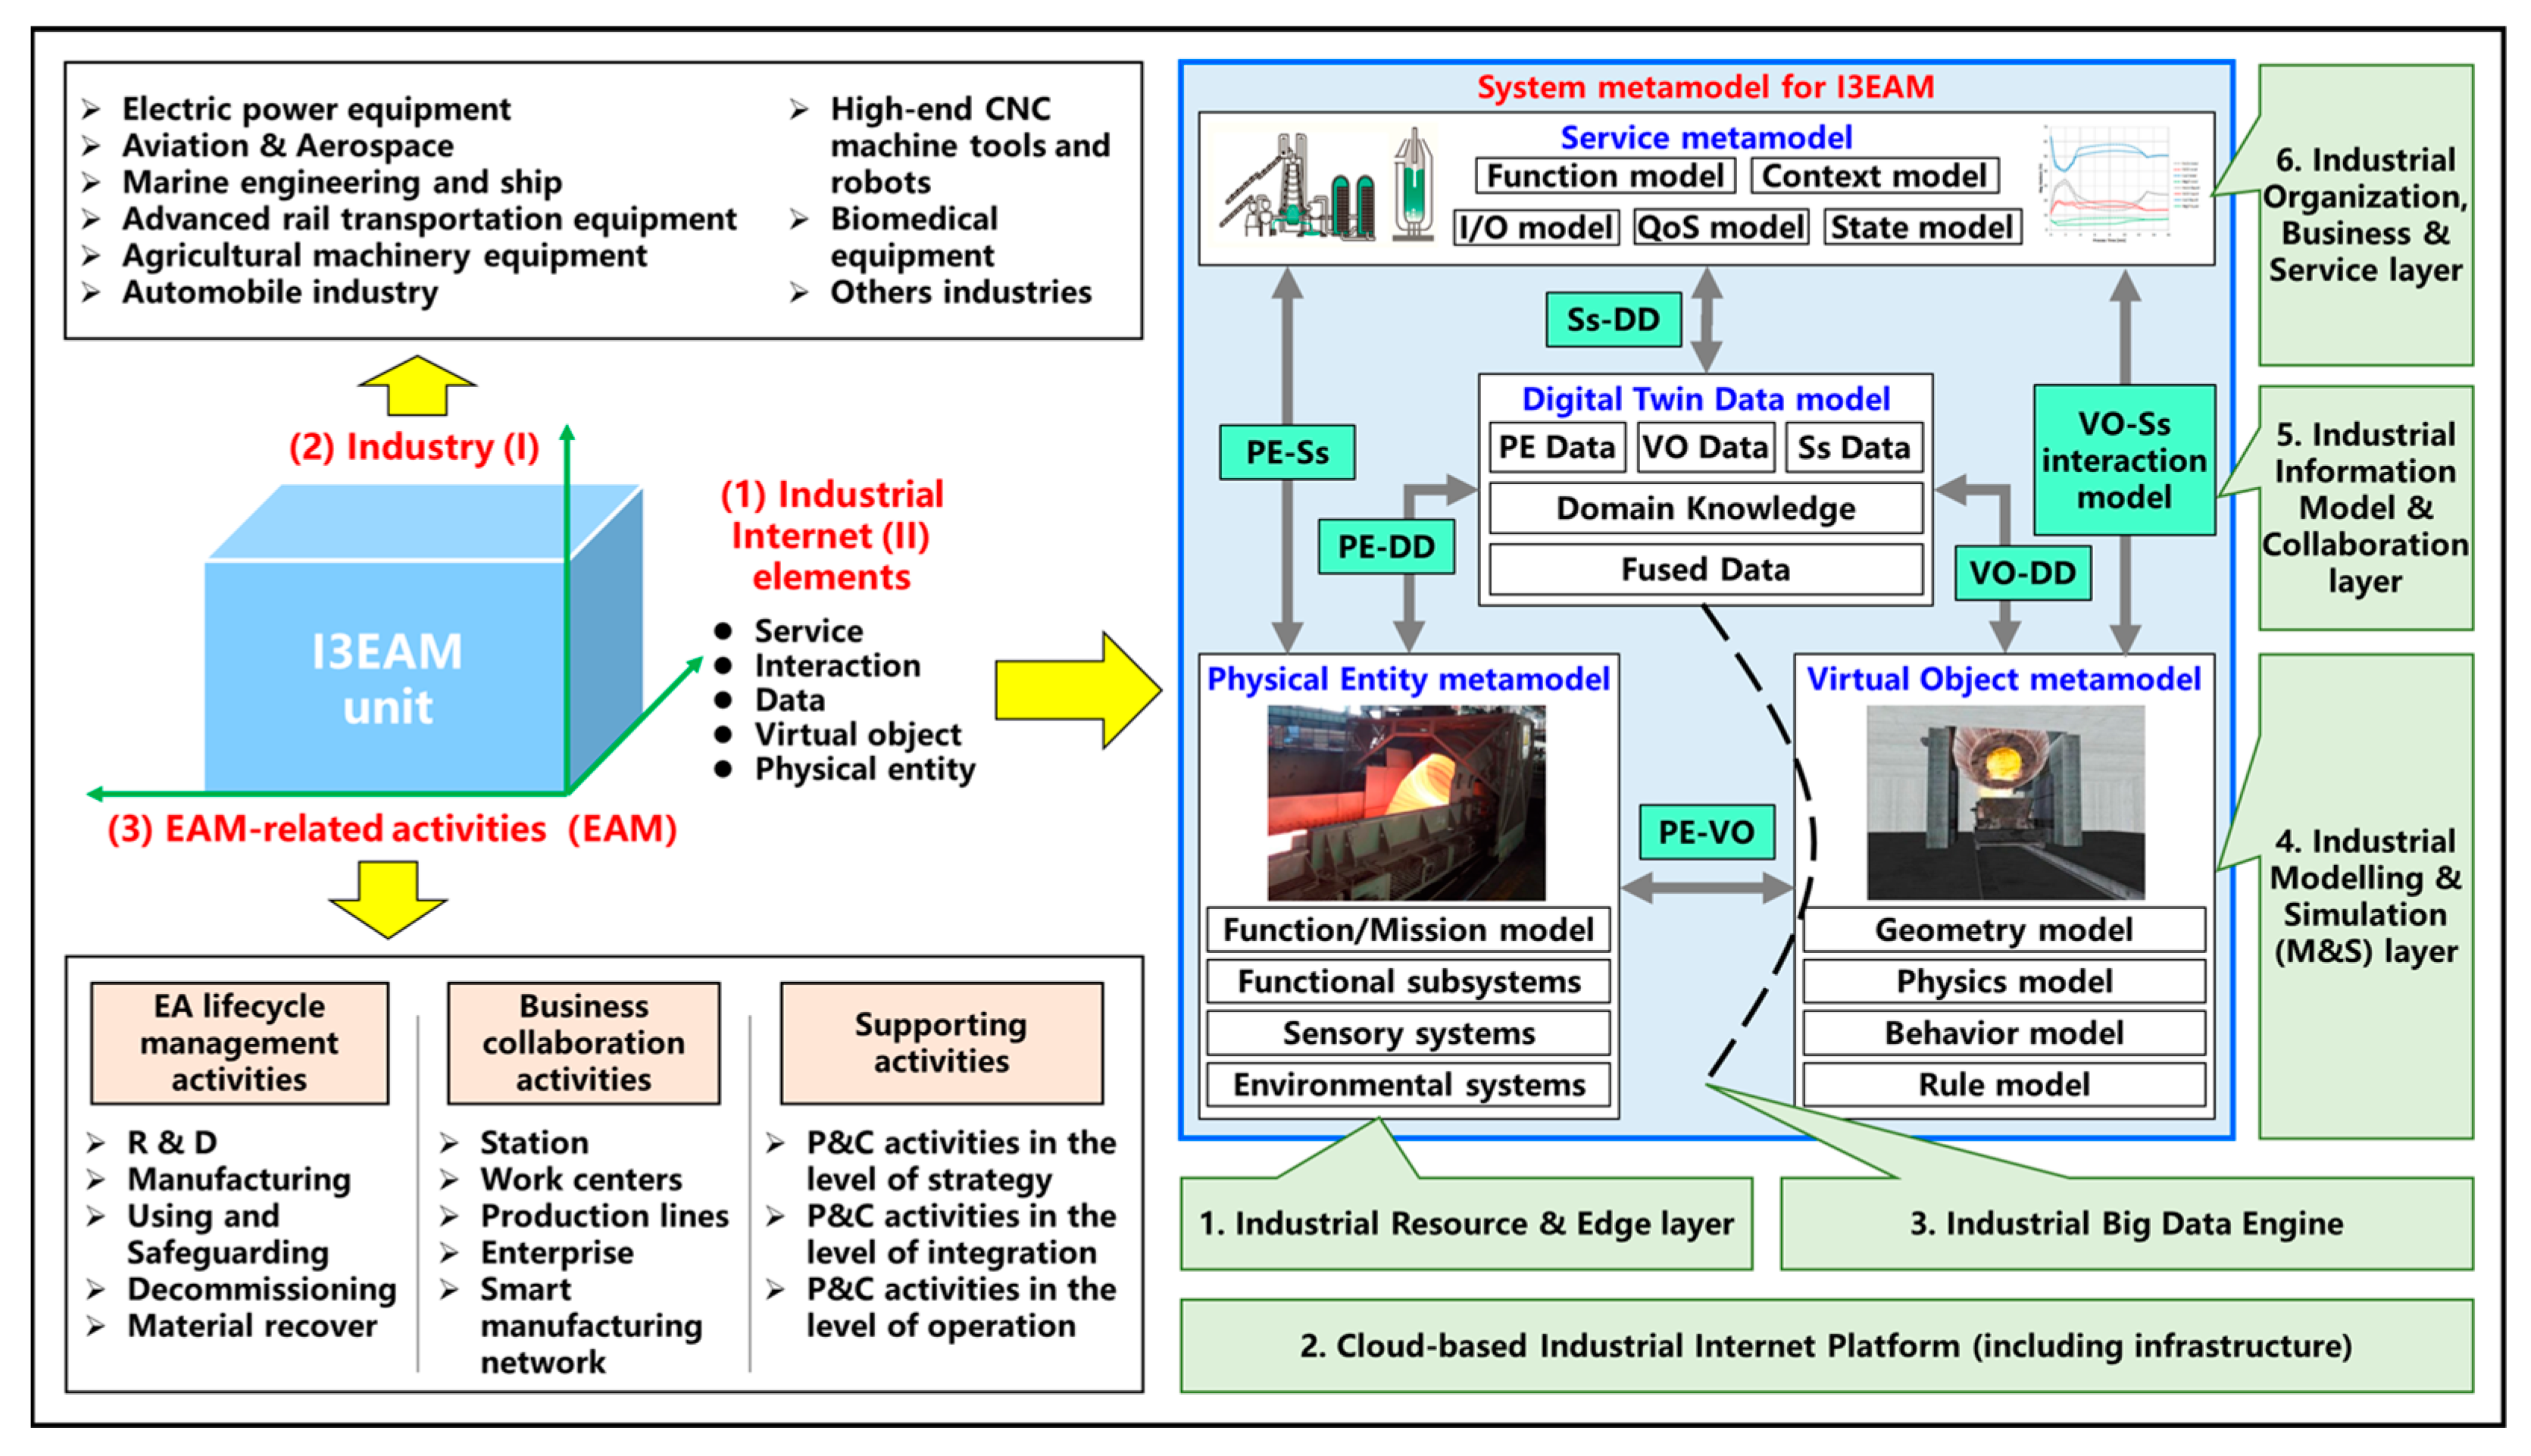
Based on the I3EAM unit, the general system model of I3EAM is defined in three dimensions: the Industrial Internet element (II), the Industry (I), and the EAM-related activities (EAM). The three dimensions have good independence and avoid the ambiguity of description. Meanwhile, the three dimensions cover the core concerns of I3EAM, including the core content of the model (corresponding to the Industrial Internet element (II) dimension), the object served by the model (corresponding to the Industry (I) dimension), and the scenario-based value of the model (corresponding to the EAM-related activities (EAM) dimension). As shown in Figure 3, we made full use of the existing architectural research results to refine and elaborate the three dimensions.
(1) 
Dimension 1: Industrial Internet element (II) dimension
The Industrial Internet element (II) dimension defines the system metamodel for I3EAM, including the physical entity, the virtual object, the digital twin data, the interaction, and the service. This dimension is a reference to the digital twin general model of complex equipment [91], while we expand on the details of the metamodel. The essence of digitalization is to create parallel control systems for specific systems, including sensing, modelling, and managing physical entities, information flows, and social relationships [106]. The physical entity metamodel consists of the function/mission model, the functional subsystems, the sensory systems, and the environmental systems. The virtual object metamodel consists of the geometry model, the physics model, the behavior model, and the rule model. The digital twin data model includes the data from the physical entities, the virtual objects, and the services, while the domain knowledge and fused data are also the parts of the data model. The service metamodel comprises the function model, the context model, the I/O model, the QoS (quality of service) model, and the state model, etc. Finally, the interaction model builds the bridges among the different models. As described in Section 5, this dimension helps the general reference model to establish a direct mapping to the Industrial Internet architecture [13].
(2) 
Dimension 2: Industry (I) dimension
The research objective of this paper is to develop a general reference model that used is across various industry sectors for I3EAM customization in social digitalization platforms. The Industry (I) dimension includes, and is not restricted to, electric power equipment, aviation and aerospace, marine engineering and ship, advanced rail transportation equipment, agricultural machinery equipment, automobile, high-end CNC machine tools and robots, biomedical equipment, and other industries.
(3) 
Dimension 3: EAM-related activities (EAM) dimension
Digitalization needs to rely on explicit business activities in order to generate a scenario-based value. In this paper, we propose a comprehensive EAM-related activity model for the system structure analysis of I3EAM to support the modular design of model and service functions. The EAM functional requirements of a specific enterprise are a functional subset of the EAM-related activity model. The EAM-related activities (EAM) dimension is divided into three types of activity, including the equipment asset lifecycle management activities [8], the business collaboration activities [5,6], and the supporting activities [1,17]. The equipment asset lifecycle management activities are further split into the activities in the phases of R&D, manufacturing, using, safeguarding, decommissioning, and material recovery [4,8,18,20,42]. Business collaboration activities are derived from the hierarchy of system integration [5,14], including the station, the work center, the production line, the enterprise, and the connected collaborative network [78,103,104]. According to the literature [17], the supporting activities for EAM consist of various EAM-related planning and control activities in the level of strategy, integration, and operation. The analysis of the activity will help to effectively locate and identify the tangible and intangible system elements with interpretable links to organizational performance and business goals [5].

5. An Implementation Path of I3EAM in Social Digitalization Platform

5.1. Overall Planning: A General Reference Architecture of Implementation Path

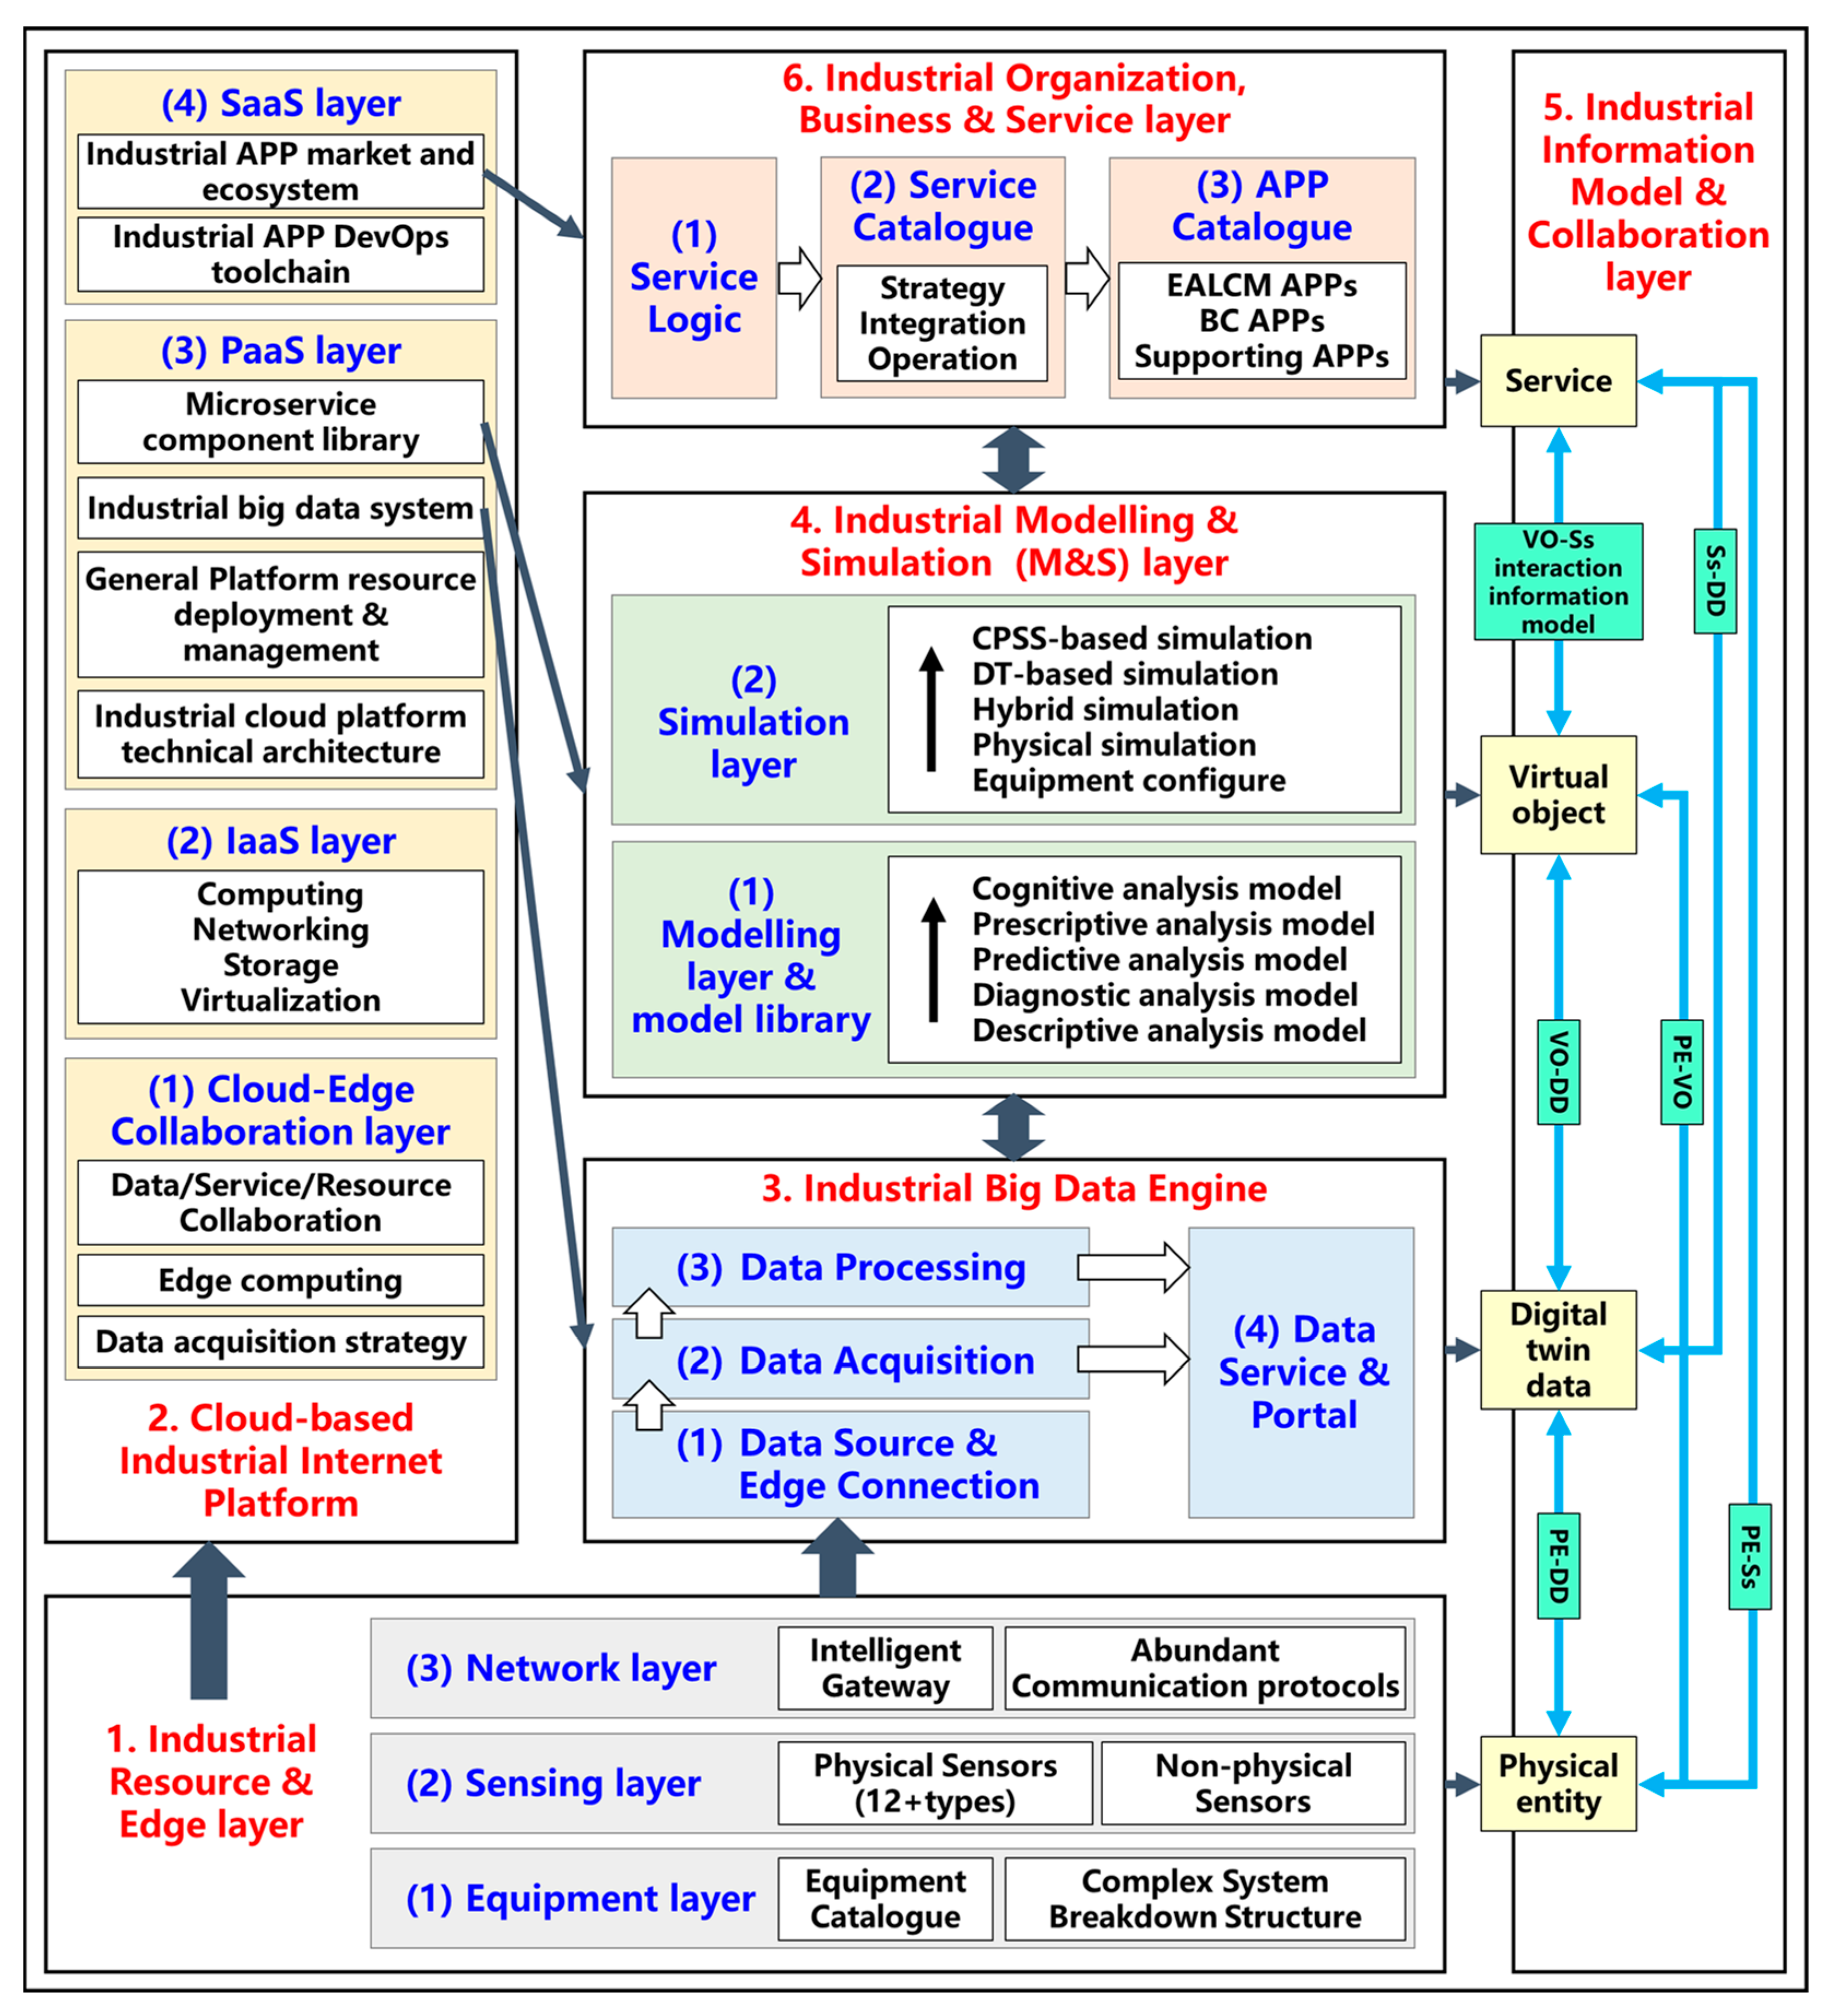
Six layers of I3EAM were derived from the metamodel, corresponding to the five dimensions of the DT model and the generic cloud computing architecture. As illustrated in Figure 4, each layer is considered to be necessary and harmonious, serving to provide common solutions for building digital twins and parallel management systems for complex equipment. The industrial edge layer enables the sensing and control of the physical entities of complex equipment and their environments. The industrial cloud platform will facilitate the flexible matching of heterogeneous computing resources and needs, as well as establish connectivity between the edge devices and the industrial services. Industrial big data and prior knowledge will support the creation of “life-like virtual objects or digital models” of complex engineering systems. Meanwhile, complex coupling optimization mechanisms for the equipment and its environment will be better identified and presented in the cycle of data collection, modeling, simulation, and collaborative interaction. In the context of evolving business goals and organizational performance, data-driven services will support the generation of better planning and control strategies and solutions, dynamically. Each layer will be clarified in detail in Section 5.2 through Section 5.6.

5.2. Step 1: Planning and Designing of Industrial Resource and Edge Layer

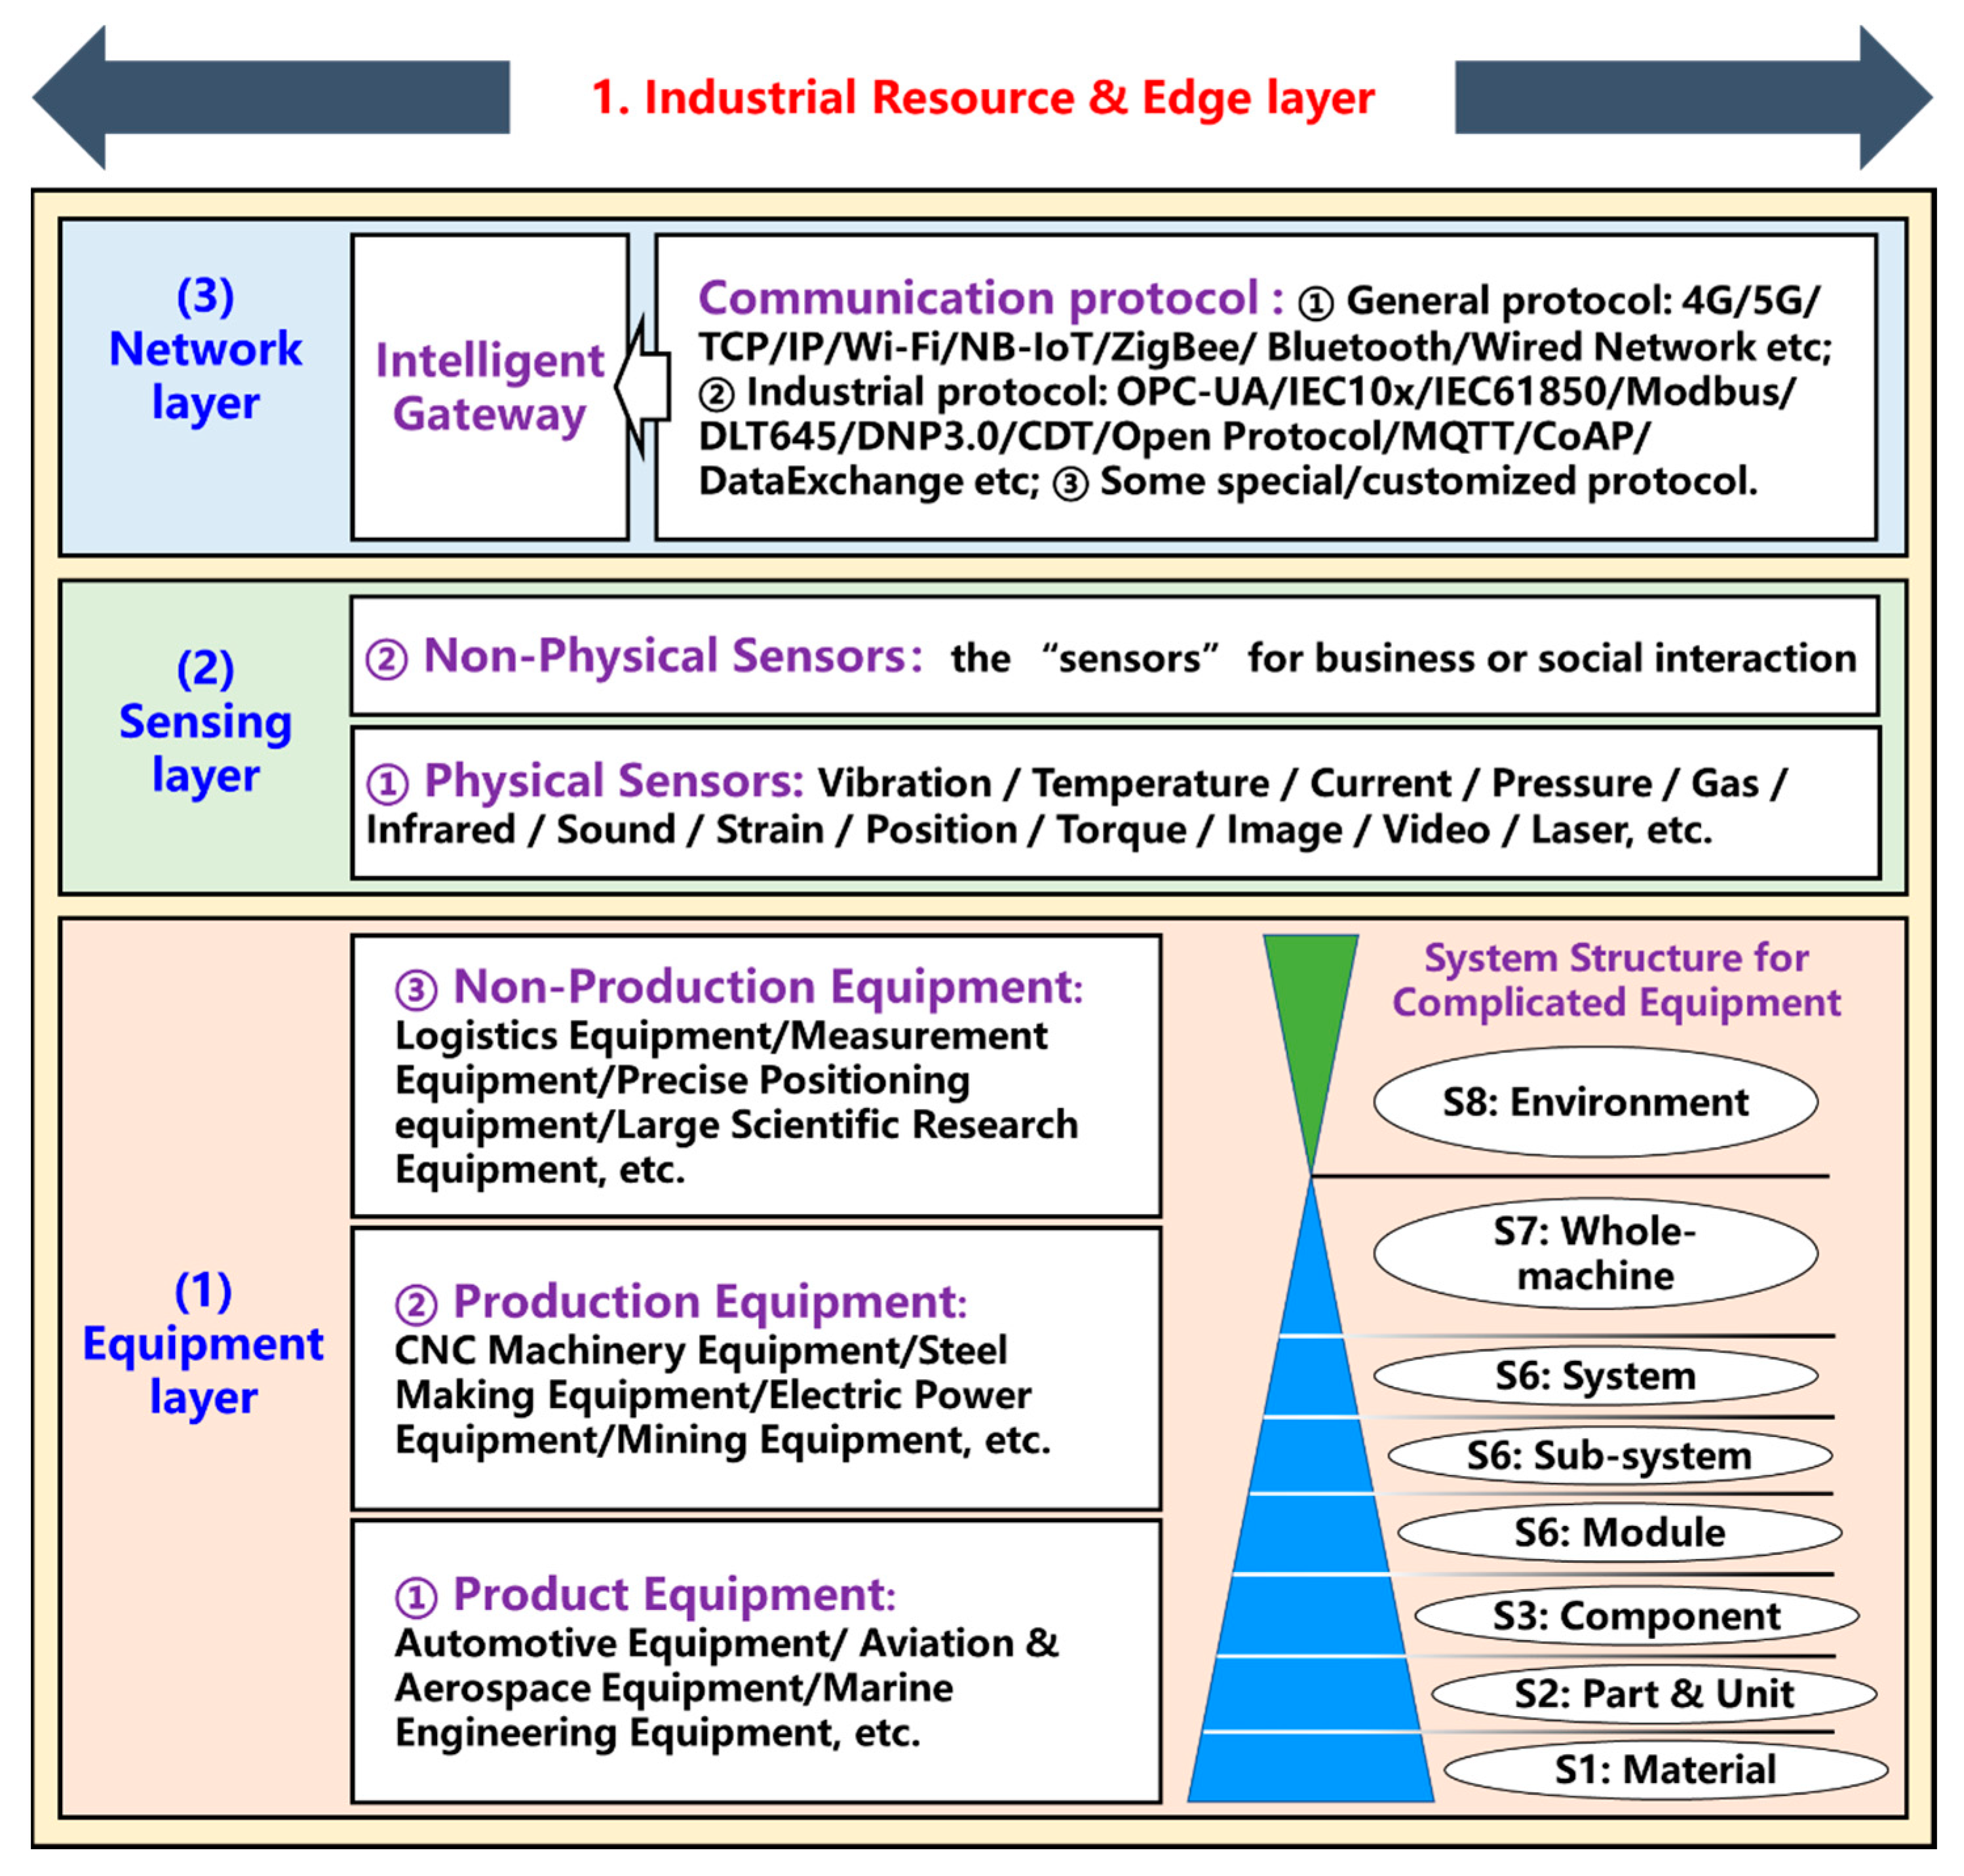
As shown in Figure 5, industrial equipment usually consists of three main categories based on predefined functions or missions: product equipment, production equipment, and non-production equipment. The equipment needs to be maintained in a reasonable interval of physical state during its operation to ensure the reliability of mission execution. The monitoring of the equipment status needs to be based on an understanding of the functional subsystems and a reasonable arrangement of sensing control schemes. For specific scenarios, non-physical signals as well as time-sensitive requirements are incorporated into edge solutions. There are tens of thousands of industrial buses or protocols with private controllers for automation devices around the world, with less than 15% of the general purpose PLCs and more than 60% of the “dumb” devices. Therefore, the edge solutions should provide “plug-and-play” capabilities with technology options for sensing and networking. The industrial edge layer includes low-cost sensor solutions for different system levels and signal types, as well as smart gateways that support a variety of industrial protocols. The industrial protocols include three categories: (1) General communication protocols: 4G, 5G, TCP/IP, Wi-Fi, NB-IoT, ZigBee, Bluetooth, Wired Network, etc.; (2) Mainstream industrial protocols: OPC-UA, IEC10x, IEC61850, Modbus, LT645, DNP3.0, CDT, Open Protocol, MQTT, CoAP, DataExchange, etc.; (3) Other specialized or custom protocols. In addition, edge computing solutions are introduced in the cloud-edge collaboration solution of the industrial cloud platform in the next section.
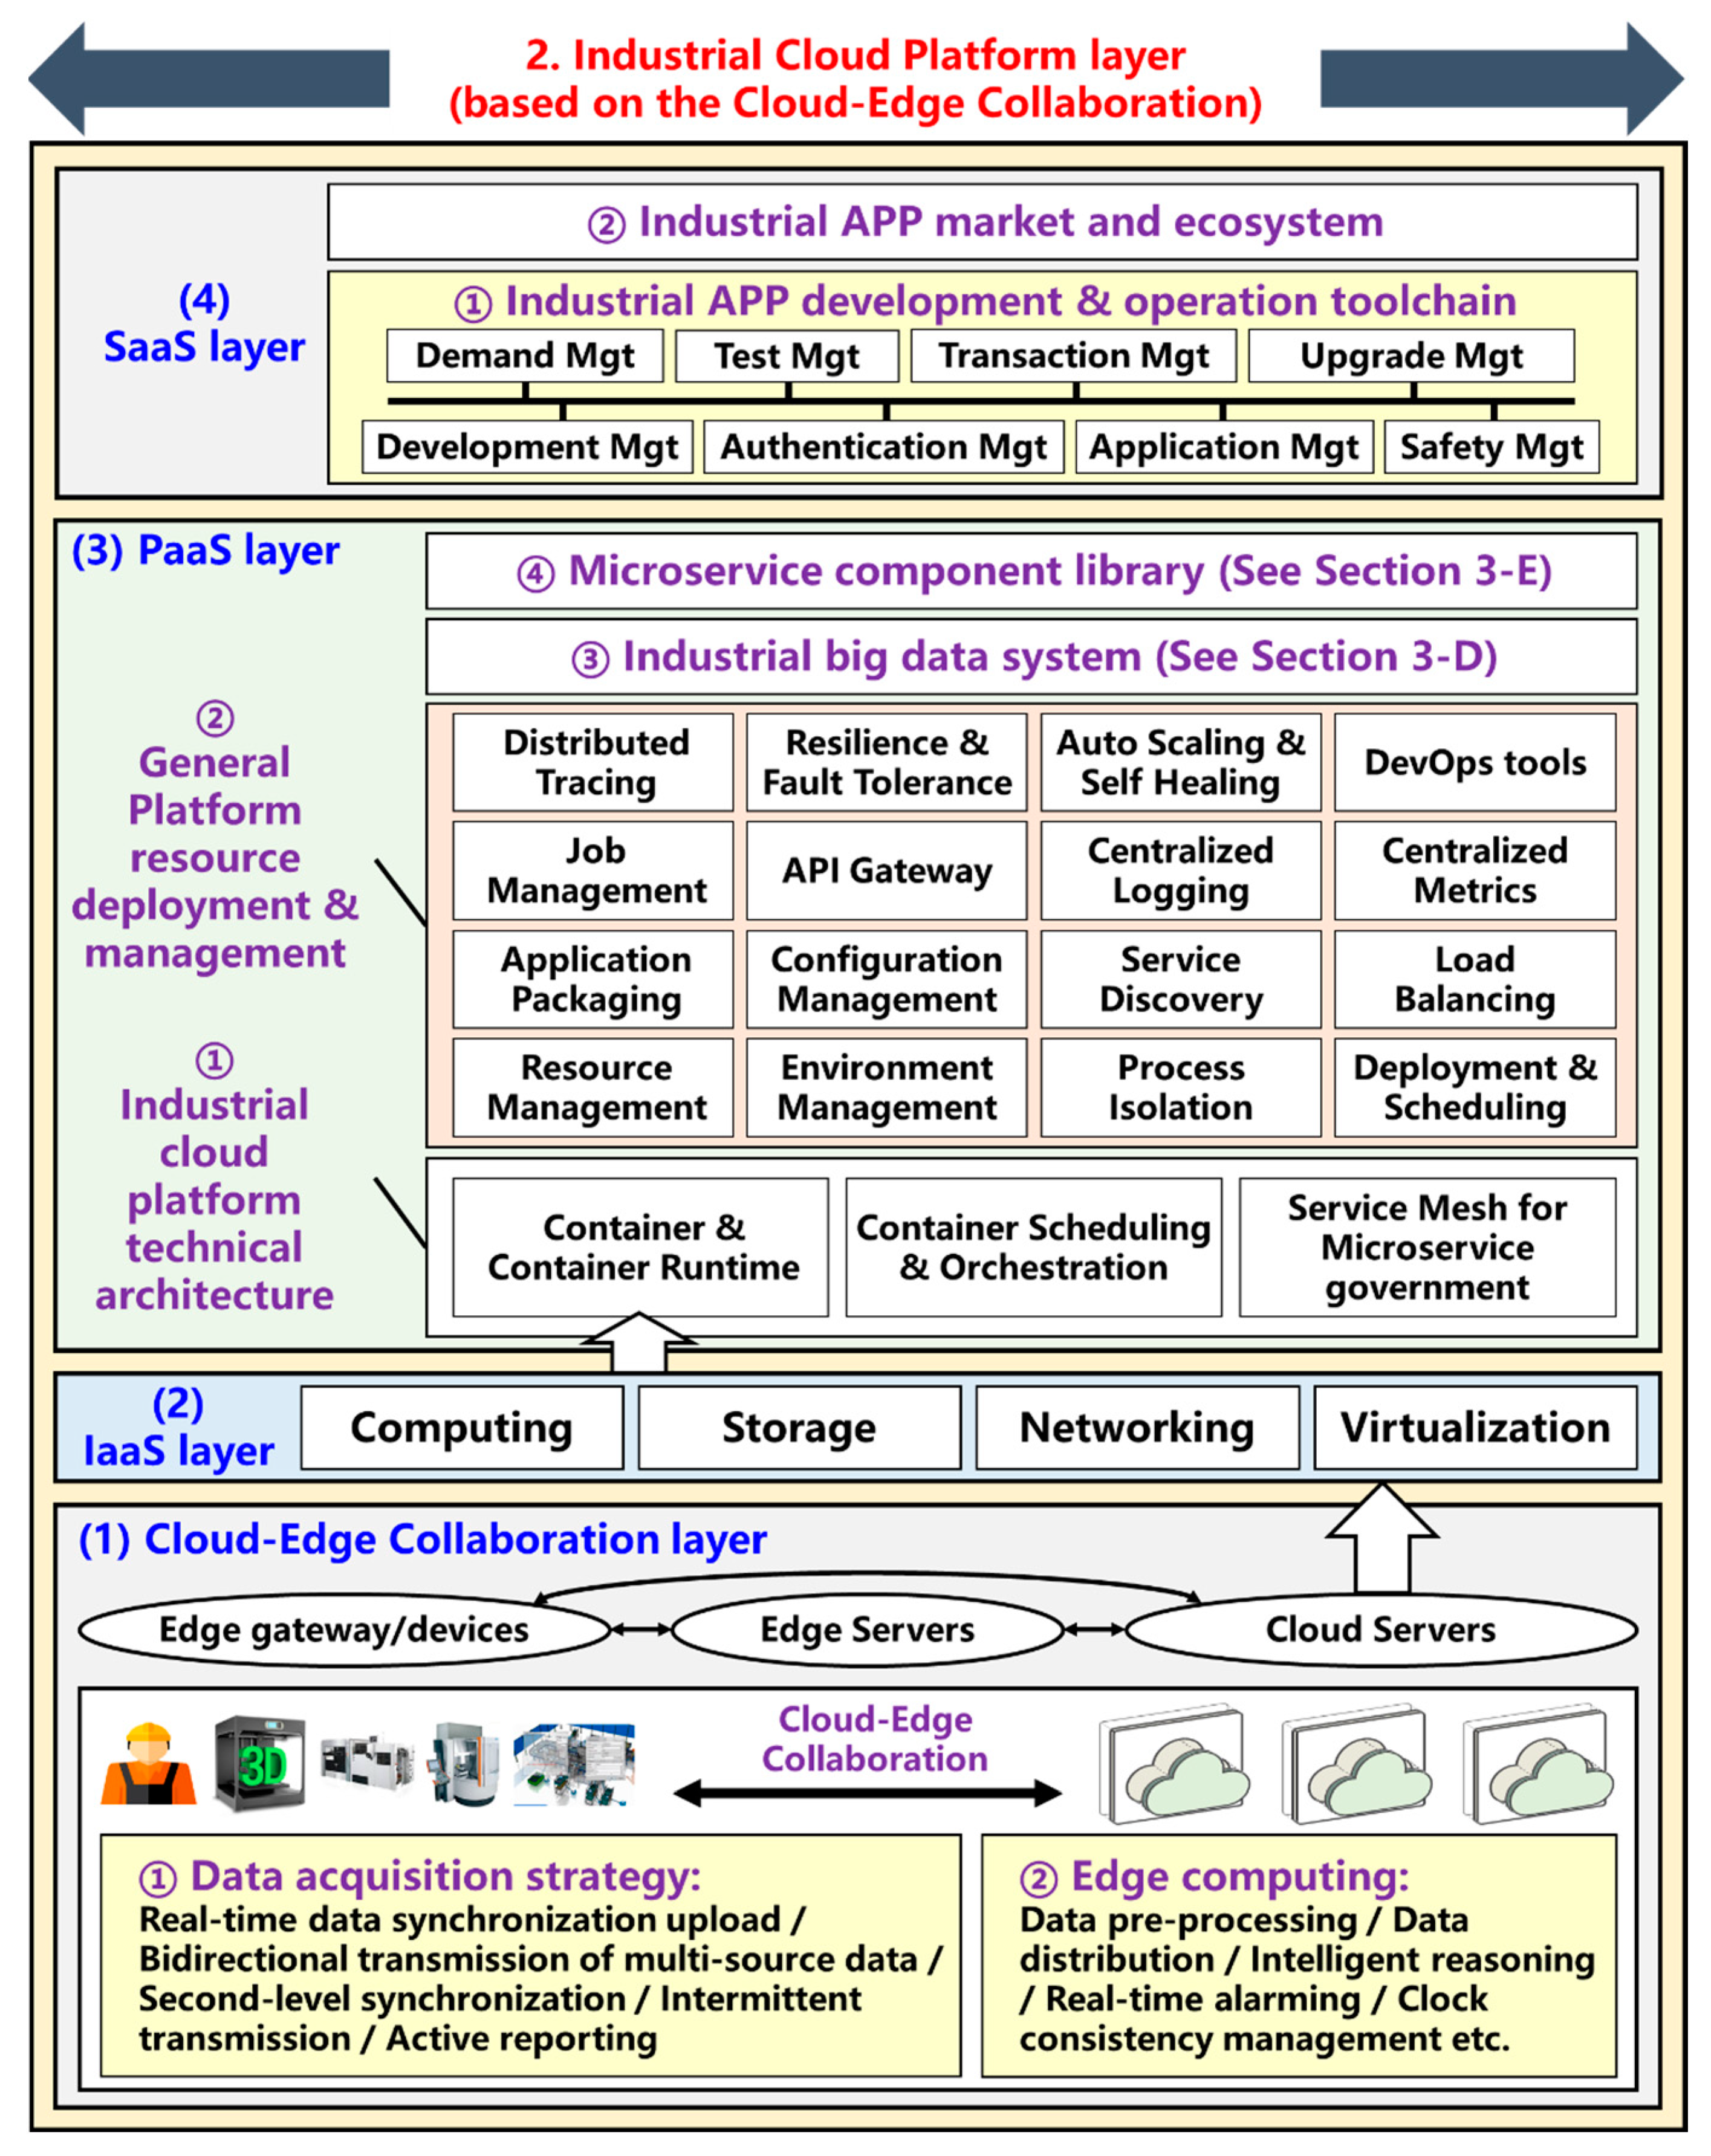
The industrial cloud platform system provides all of the necessary computer system resources for I3EAM. Due to the scalability of cloud-based computing resources, the platform that is here is not a single software system. The industrial cloud platform may involve multiple subjects and multiple layers of computer resources, including the edge computing systems, the enterprises’ local OT/IT systems, the enterprise-level Industrial Internet platforms, and the cross-industry third-party service providers. The industrial cloud platform consists of a cloud-edge collaboration layer, an IaaS (Infrastructure as a service) layer, a PaaS (Platform as a service) layer, and a SaaS (Software as a service) layer.
The cloud-edge collaboration layer will utilize the time-sensitive response capability of the edge side (e.g., real-time equipment monitoring) and the powerful back-end computing (e.g., big data analysis), and unified configuration capability (e.g., computer resource allocation) is measured by the cloud platform. The core of cloud-edge collaboration lies in selecting reasonable distributed resource and function configurations according to the application scenarios and establishing a collaborative link among the cloud, edge, and end points. The cloud-edge collaboration includes resource collaboration, service collaboration, and application collaboration. Through the abstraction of hardware resources such as underlying devices, it realizes the convenient deployment, communication, operation, and whole lifecycle management of the infrastructure resources, service components, and application software on both sides of the cloud and the edge. As shown in Figure 6, the cloud-edge collaboration layer includes edge data collection strategies and edge computing schema.

5.3. Step 2: Planning and Designing of Industrial Cloud Platform Layer

The IaaS layer provides infrastructure involving computing, storage, networking, and virtualization. The PaaS layer offers the technical architecture of the industrial cloud platform and the common capabilities for platform resource deployment and management, and it supports the integration of industrial big data systems and microservice component libraries. To establish the digital platform for the group-type company or cross-industry service provider, a strong PaaS layer is required to provide infrastructure services for wider access to the edge devices and industrial services. A flexible service-oriented technology architecture is created by combining containers and microservices. Simultaneously, in order to better handle the diverse computer system resources and microservice requirements, the platform offers a number of common services such as resource management, environment management, configuration management, load balancing, and an API gateway. In a larger range of application scenarios, service grids are used to control the service communication crisis that is caused by the increased business complexity. Finally, as described subsequently in Section 5.2 and Section 5.7, the SaaS components or industrial APPs will create direct value for business scenarios and users. The industrial cloud platform will promote the formation of industrial APP ecosystems with the toolchain of industrial APP development and operation and business model innovation.

5.4. Step 3: Planning and Designing of Industrial Big Data Engine Layer

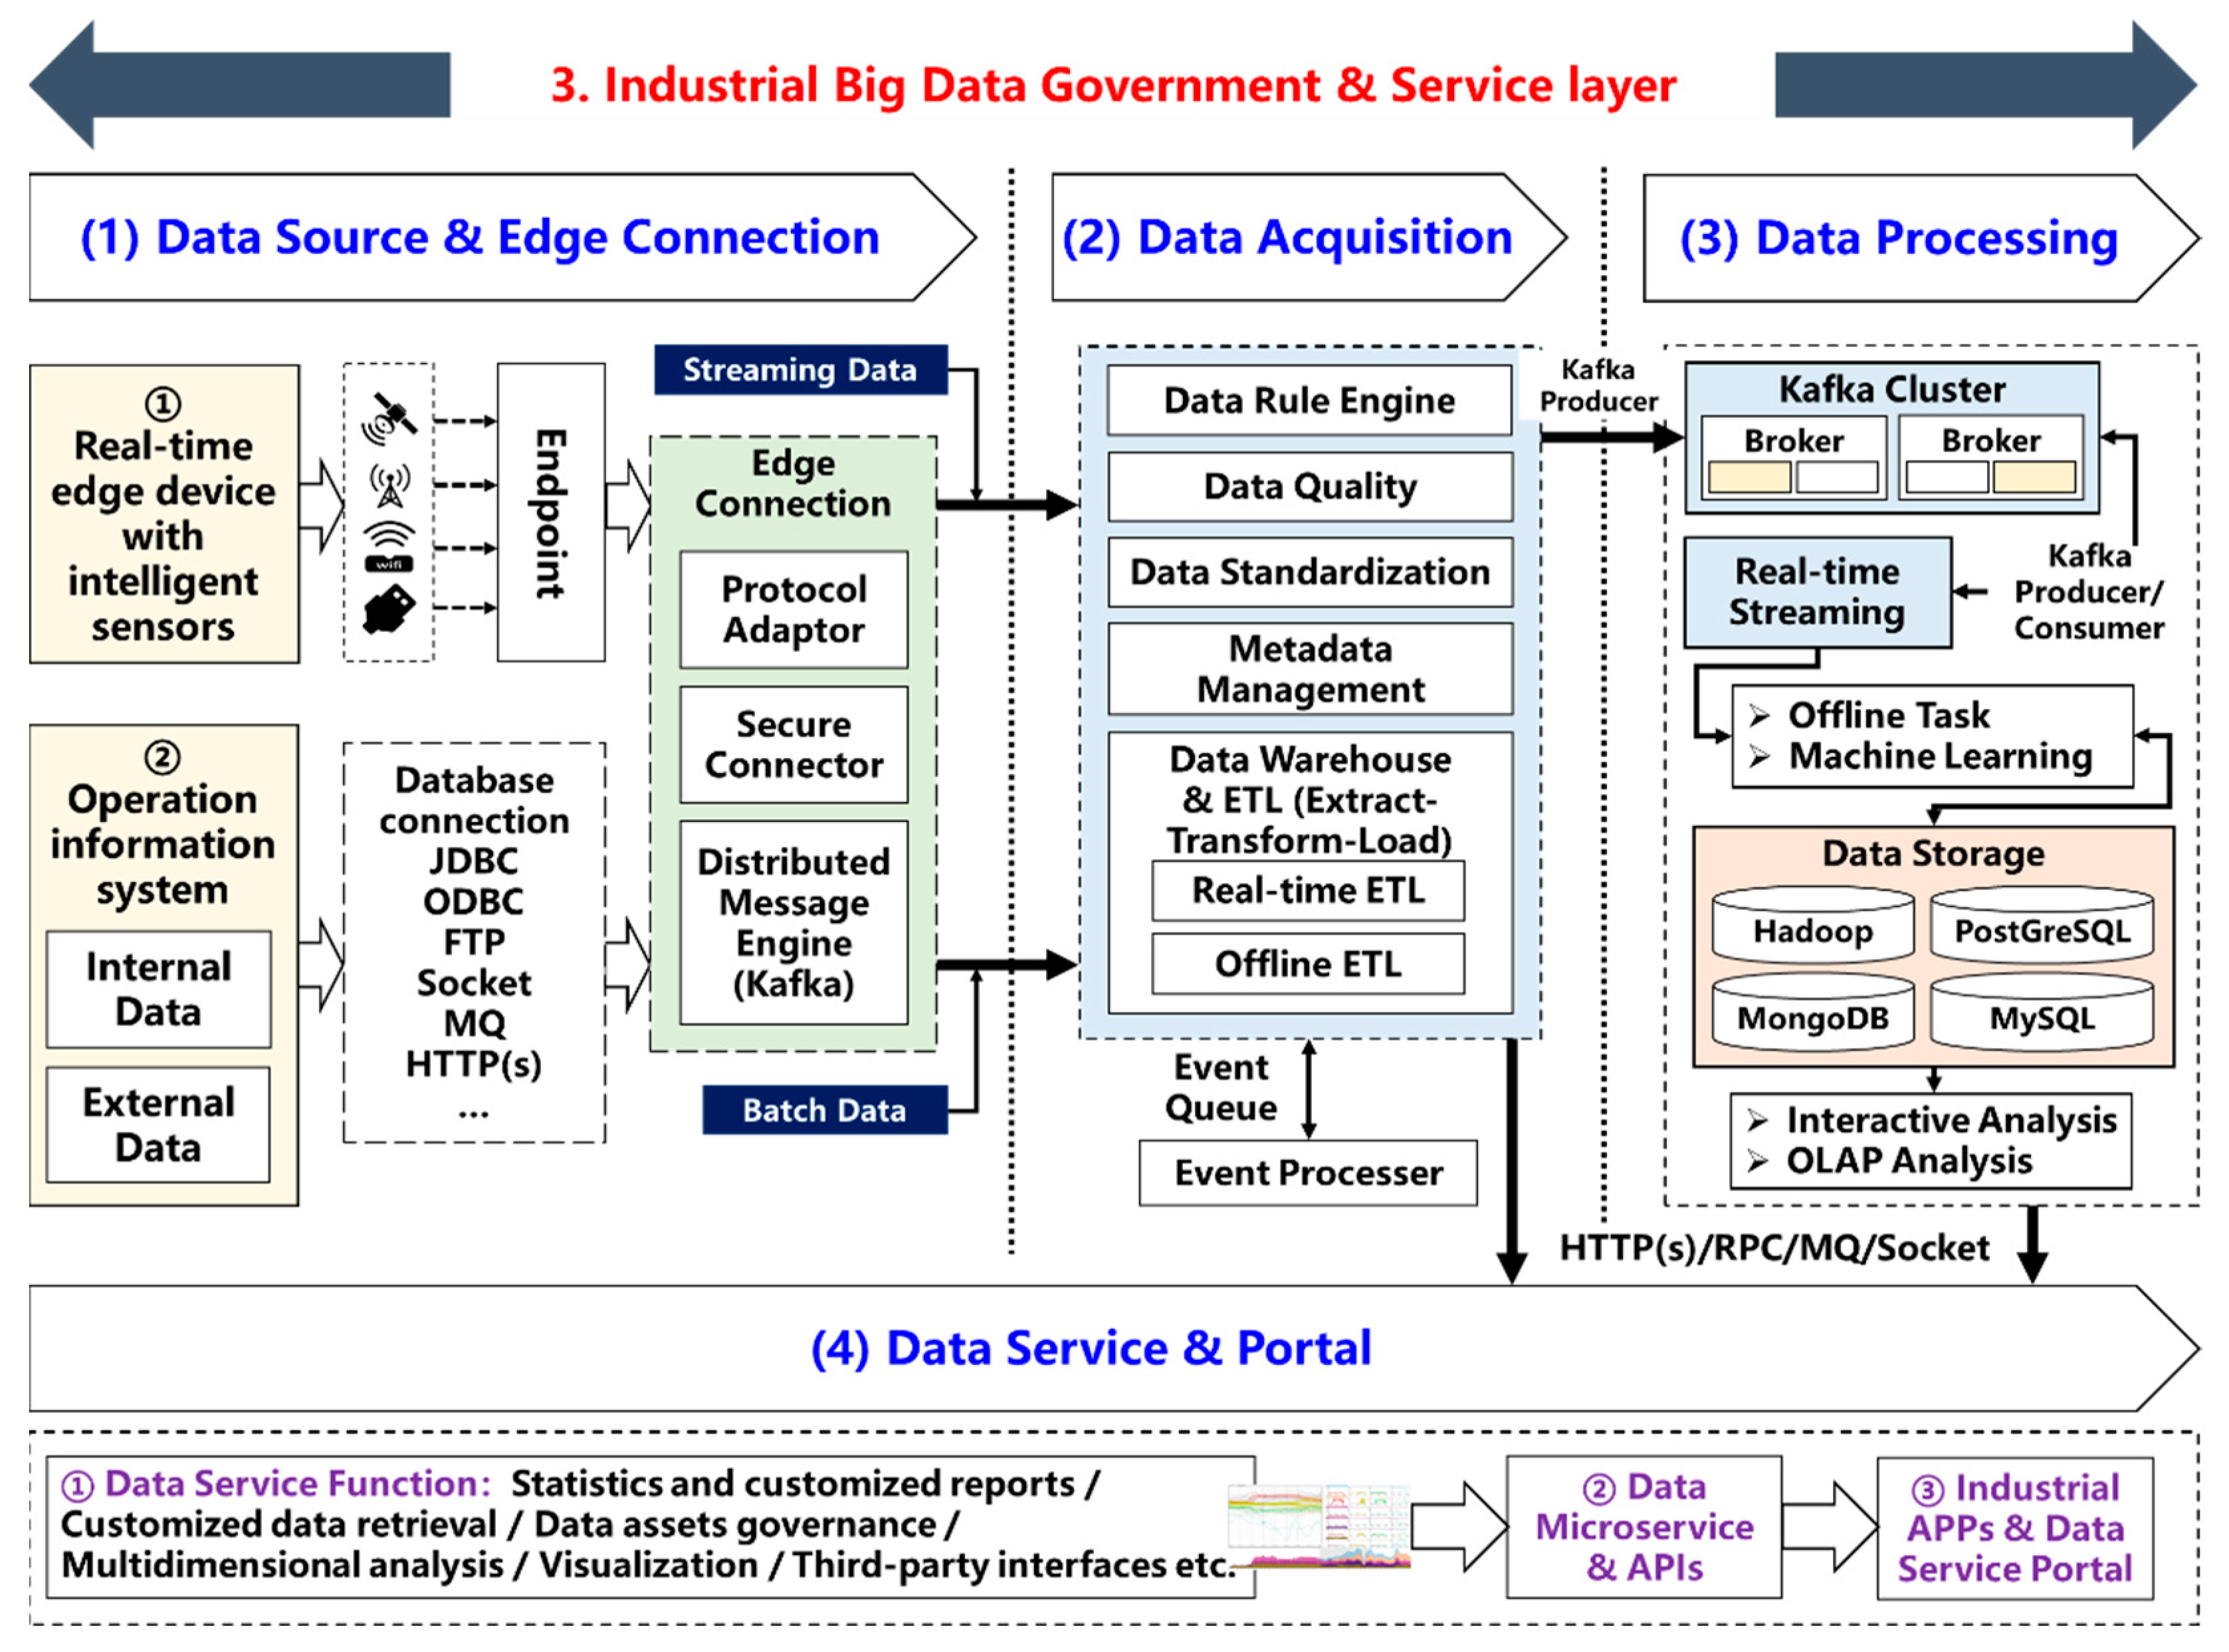
The remote sensing data of equipment through I3EAM has the characteristics of multi-source, massive and heterogeneous. On the one hand, the platform must construct a data management and governance system, to realize the effective and real-time management of the equipment data and to provide unified, complete, standardized, and visible data resources for various data application projects and data analysts. On the other hand, the platform must provide rich data service functions to improve the efficiency of the users’ access to data and the level of the data that they are using. As illustrated in Figure 7, the industrial big data system provides data sources, edge connections, data collection, data processing, data services, and portals. Different data sources should use appropriate edge access solutions, data collection strategies, and data quality standards in accordance with the data volume, data characteristics, and real-time requirements. Different databases are interconnected through the middleware, and ETL (Extract–Transform–Load) formation is developed to support data processing and integration. Based on microservices and industrial APPs, the platform should provide the users with self-service and convenient data services and support the users’ secondary development activities based on the data resources.

5.5. Step 4: Planning and Designing of Industrial Modeling and Simulation Layer

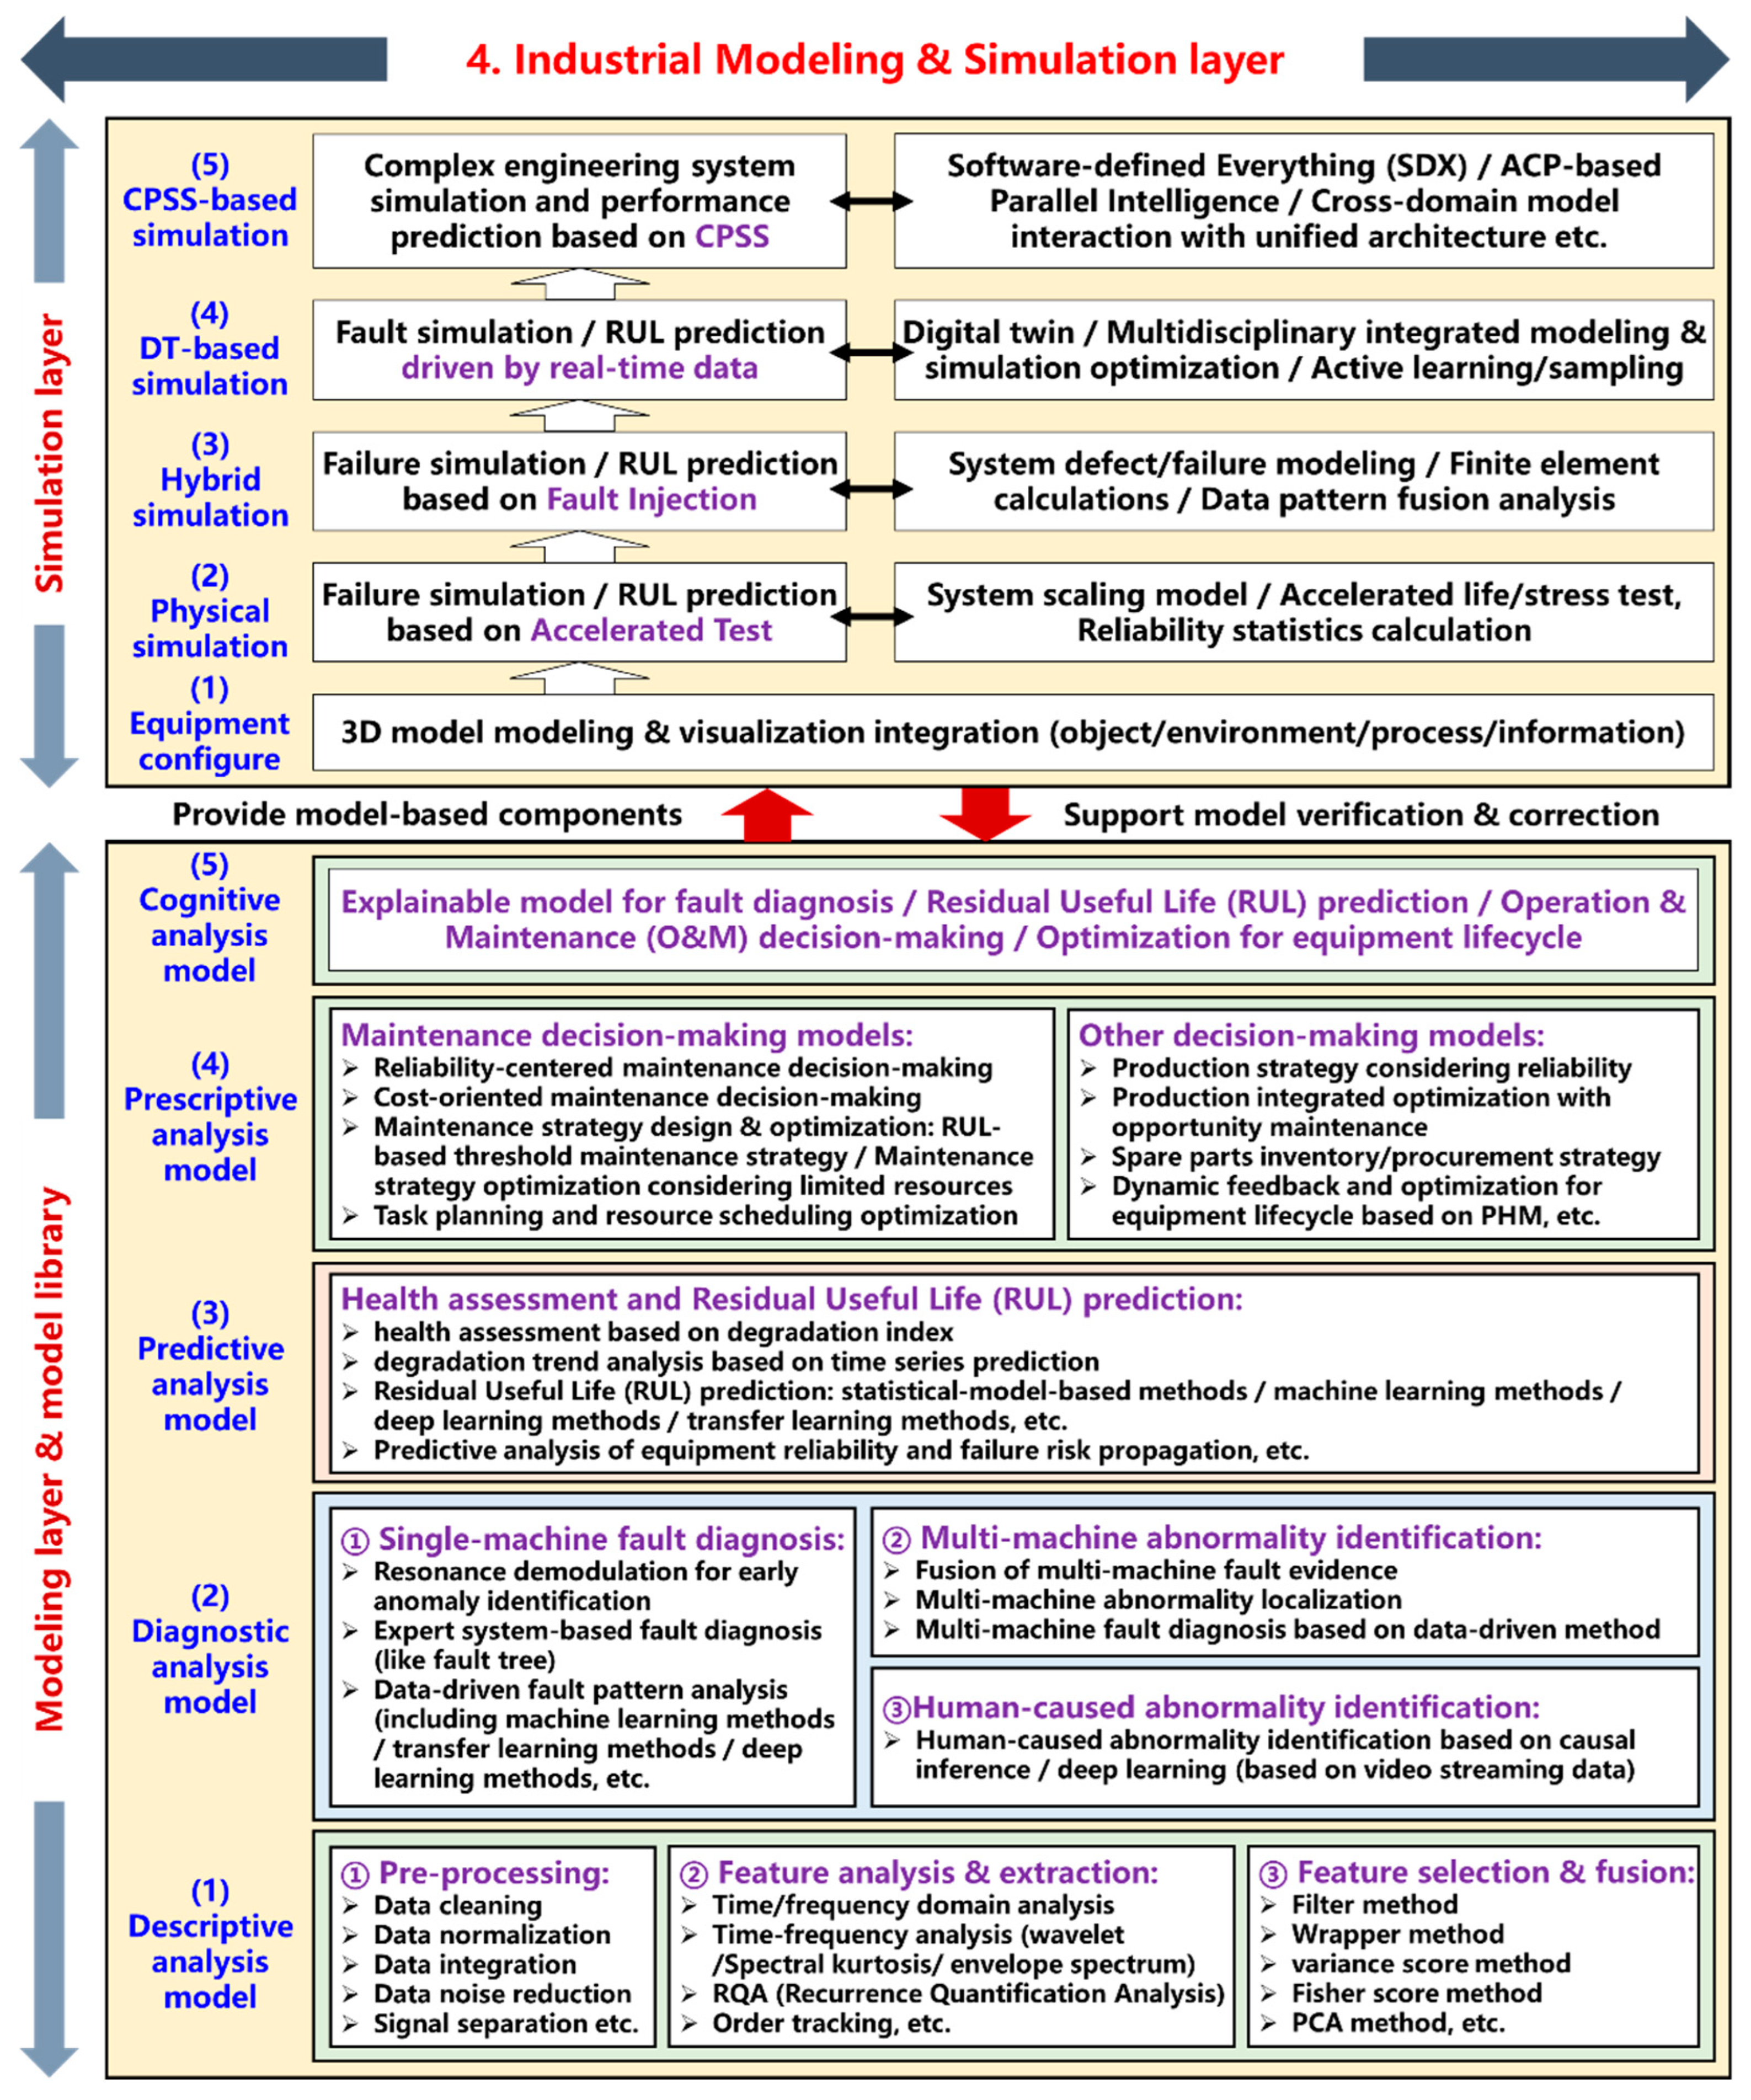
Constructing a digital twin and parallel management system for complex equipment requires data insights and prior knowledge. The mechanistic models and common methods that have already been developed in the PHM field serve as the foundation for model encapsulation and the development of microservice libraries. As shown in Figure 8, I3EAM should build modeling and simulation systems related to Equipment Asset Management (EAM) in the Industrial Internet platform environment to reduce the time and cost of building the models for complex equipment with different properties and behaviors. The proposed modeling layer contains five types of analytical models: the descriptive, diagnostic, predictive, prescriptive, and cognitive analysis models. From the functional perspective of the models, I3EAM needs to consider other decision issues related to human factors and reliability of integrated systems in addition to the models in the PHM domain.
Simulation has great potential for application in the area of equipment operation and maintenance, but it is limited by the cost of constructing high-fidelity digital models and the acquisition of rare fault data. Digital twin technology is facilitating the convergence of physical models, data models, and prior knowledge. The interaction between the physical entities and the virtual mirrors will be rolled up and optimized through generalized autoregressive models, and this will improve the effectiveness of equipment operation and maintenance decisions based on collaborative computing and consistency checks. The I3EAM simulation layer contains the equipment configuration, the physical simulation, the hybrid simulation, the digital twin-based simulation, and the CPSS-based simulation. Social factors such as the business’ processes, the human factors, and the organization, likewise, need to be defined by the software and integrated with the physical dimension of the model. For example, the impact of the manual operation of maintenance on the condition and residual useful life (RUL) of the equipment is ignored in most of the equipment PHM work.

5.6. Step 5: Planning and Designing of Industrial Information Model Layer

Here is an example from the steel industry to illustrate the objective and function of the industrial information model and collaboration layer. The inability to cooperatively optimize the equipment and accessories is caused by the lack of equipment operation and maintenance (O and M) data for the key steel production equipment that is owned by the steel mill (the equipment owner) and the outsourced equipment O and M vendors. The equipment manufacturers and lubricant companies want to obtain these data, but the equipment owners lack the motivation to collect and share it. Likewise, due to the intellectual property, it might be challenging to exchange the equipment design data and lubricant formulation data with the manufacturers or other stakeholders to improve the equipment maintenance models. The main purpose of the information model layer is to build safe and interoperative industrial information integration models, technology solutions, and collaborative systems in order to lower the barriers of knowledge transfer and collaboration to meet the challenges of new equipment, conditions, and scenarios. Federal learning and the blockchain are considered to be potential integration technology directions. In addition, information model mapping for heterogeneous devices and information systems in the cloud-edge collaboration framework is necessary. For example, the OPC-UA’s information modeling framework supports the integration of information models and protocols, allowing the direct modeling and transfer of semantic data through user-specified data formats. Based on the correspondence between the ontology model and the information model, the information is obtained from the device/edge node by semantic reasoning, and then, the device information model is exposed to the network through the OPC-UA server.

5.7. Step 6: Planning and Designing of Industrial Organization, Business, and Service Layer

Equipment assets are particularly important in industrial companies, and they are closely linked to production activities and profit generation. Industrial Internet technologies support Equipment Asset Management solutions for an increasing number of industrial enterprises. As shown in Figure 9, the service logic of I3EAM based on the Industrial Internet platform is first expressed using a simple concept diagram. The equipment reliability is associated with business goals and organizational performance in different dimensions and at different levels. Therefore, the service function requirements and the development of industrial APPs will be closely focused on the planning and control activities related to Equipment Asset Management. In the previous studies of decision support systems, the meta-model of service scenarios is missing or one-sided. In this paper, a service catalogue is given to cover the planning and control activities related to Equipment Asset Management at the strategic, integration, and operational levels based on the proposed AM framework in the literature [17]. Meanwhile, the EAM APP catalog of I3EAM is expected to be consistent with the service catalogue to provide a systematic solution for Equipment Asset Management in industrial enterprises.

6. Evaluation and Selection of I3EAM Schemes Based on Fuzzy DEMATEL-TOPSIS

6.1. The Establishment of Performance Metric Set for I3EAM Scheme

The core objective of this paper is to help enterprises to customize I3EAM using social digital platforms. The generic model and reference architecture provide effective guidance for identifying the requirements of I3EAM and planning the implementation path of I3EAM. However, there may be multiple social digitalization platforms to choose from around the specific needs of enterprises, and the I3EAM solutions that they offer have various characteristics. Therefore, based on the systematic synthesis, a set of performance metrics need to be constructed to help the enterprises to evaluate different solutions according to their preferences. The company will finally obtain an optimal solution, and the selected social digital platform will become the digital partner of the company to implement I3EAM together. The I3EAM evaluation system is crucial for EAM business–IT alignment for all of the types of enterprises, but it has not yet been studied and proposed.
The construction of I3EAM is a complex system-engineering project. The generic model and reference architecture focus on the identification of functional instances and architectural design, but they cannot completely reflect the performance of I3EAM in terms of its feasibility, capability, and ecology. Establishing an evaluation system for I3EAM will help identify the weak connections between the requirements, the solutions, and the platform partners more accurately and comprehensively, and increase the value created by the joint implementation of I3EAM. When designing and building the performance metric set for an I3EAM scheme, multiple factors and platform leverage logics need to be taken into account, such as the scheme’s feasibility, the requirement coverage level, the technical capability, the application benefits, and the potential value in the medium and long term. Based on the research of the system model and enterprise requirements, this study proposes a performance metric assessment framework for the I3EAM scheme and its corresponding social digitalization platform. The framework was designed from three dimensions, including the basic platform service attribute, the technical capacity for I3EAM, and the value of the platform application and ecology synergy, as well as fifteen specific second grade indicators which are presented, as shown in Table 3.
The dimension of the basic platform service attribute includes three aspects, namely, (1) the talent guarantee, (2) the system security guarantee, and (3) the cost of the digitalization service, which are used in order to evaluate the feasibility of the implementation scheme and the basic service capability of the digitalization platform. The dimension of the technical capability for I3EAM is comprised of eight aspects, including (1) the IT resource management capability, (2) the industrial equipment adaptation capability, (3) the industrial big data engine capability, (4) the industrial modeling and simulation service capability, (5) the microservice development and government capability, (6) the development environment supporting, (7) the scheme technical architecture performance, and (8) the system integration and collaboration capability. The performance of technical capability is the core part of the assessment metric, and its objective is to provide a quantitative evaluation of I3EAM on the basis of the previously mentioned general model and reference architecture. The dimension of value of platform application and ecology synergy involves four aspects, namely, (1) the platform scale and activity, (2) the platform application value, (3) the open and sharing mechanism, and (4) the platform ecology value. This dimension is proposed for assessing the application benefits and potential value of the chosen digitalization platform in the medium-to-long term.
In addition, for the sake of conciseness in the subsequent expressions, we assigned tags to each indicator, i.e., B1–B3 for the dimension of a basic platform service attribute, T1–T8 for the dimension of a technical capability for I3EAM, and A1–A4 for the dimension of a value of platform application and ecology synergy.

6.2. The Approach to Evaluate and Select I3EAM Schemes Based on Different SDPs

In this section, a hybrid approach combining fuzzy DEMATEL and fuzzy TOPSIS is proposed for evaluating the I3EAM schemes based on different social digitalization platforms and the selection of the best scheme and co-implementation partner (the SDP which provides the best I3EAM scheme). The computational steps of our hybrid approach are clarified as follows:
(1)
Step 1. Establishing fuzzy number and determining the linguistic variables
According to the fuzzy set theory, it is indicated that the elements have a degree of membership in a fuzzy set. A triangular fuzzy number (TFN) is defined as a fuzzy number whose membership function f a ˜ ( x ) : [ 0 , 1 ] is equal to following Equation (1). Additionally, the TFN can be denoted as a ˜ = ( l , m , u ) , where l m u .
f a ˜ ( x ) = { 0 , x < l o r x > u x l m l , l x m u x u m , m x u
In order to design the questionnaire for collecting the decision makers’ judgements, the linguistic terms and its variables were defined. In this paper, the computational technique is based on the following membership function of linguistic scale which has been defined in the literature [107] (as shown in Table 4). We used this kind of expression to evaluate the dependent influence between each two performance indicators, which are given in Section 6.1. The linguistic terms include: “No influence (N)”, ”Very low influence (VL)”, “Low influence (L)”, “High influence (H)”, “Very high influence (VH)”, and “Extremely high influence (EH)”, as well as their corresponding TFNs separately, which are (0,0,0), (0.5,0.5,1), (0.5,1,1.5), (1.5,2,2.5), (2.5,3,3.5), and (3.5,4,4), respectively.
(2)
Step 2. Constructing dependence matrices of performance indicators and group fuzzy initial direct-relation matrix
According to the previous research and industry investigations, we believe that the interaction between the performance indicators will produce a positive influence on the decision making about the importance of them (the weight of each indicator). This study used the method of group fuzzy DEMATEL for revealing the interaction relationships between every two indicator sets. For the I3EAM, such a complex system, the method is applicable to analyze and segment complex factors by group decision in an uncertain environment.
The experts were invited to make pair-wise comparisons in terms of crisp scores for the performance indicator interactions (No influence (N) = 0, Very low influence (VL) = 0.5, Low influence (L) = 1, High influence (H) = 2, Very high influence (VH) = 3, and Extremely high influence (EH) = 4). The experts were from multiple disciplines, including CIOs, procurement managers, project managers, technical staff, and financial experts. Based on the scoring system, the group judgements on the relationships between n performance indicators were collected from q decision-makers. The k th decision maker’s initial direct-relation matrix M k is as follows:
M k = [ 0 s 12 k s 21 k 0 s 1 n k s 2 n k s n 1 k s n 2 k 0 ] k = 1 , 2 , ,   q
where s i j k is the k th decision maker’s judgement with crisp score for the i th I3EAM performance indicator’s influence on the j th indicator, q is the number of experts, and n is the number of I3EAM performance indicators.
Then, through the use of Formula (1) and the membership function in Table 4, the M k can be fuzzified, and it was converted to a triangular fuzzy direct-relation matrix M ˜ k . The elements of M ˜ k are triangular fuzzy numbers s ˜ i j k = ( l i j k , m i j k , u i j k ) . Thus, the group fuzzy initial direct-relation matrix S ˜ can be obtained as follows:
S ˜ = [ 0 ^ s ^ 12 s ^ 21 0 ^ s ^ 1 n s ^ 2 n s ^ n 1 s ^ n 2 0 ^ ]
where s ^ i j = ( l ^ i j , m ^ i j , u ^ i j ) , l ^ i j = { l i j 1 , , l i j k , l i j q } , m ^ i j = { m i j 1 , , m i j k , m i j q } , and u ^ i j = { u i j 1 , , u i j k , u i j q } . Then, by calculating the average value of each element in s ^ i j , the group fuzzy direct-relation matrix S ˜ A , which was aggregated, could be obtained.
(3)
Step 3. Acquiring the fuzzy normalized direct-relation matrix and fuzzy total-relation matrix
After the process of aggregation, the fuzzy normalized direct-relation matrix N S ˜ A = [ n s ^ i j A ] n × n can be acquired through dividing each element in S ˜ A by a crisp number N F ( u ) . The N F ( u ) can be calculated by using Equation (4). Through Equation (5), the matrix S ˜ A was converted to the fuzzy normalized direct-relation matrix N S ˜ A = [ n s ^ i j A ] n × n , which is denoted as Equation (6). The element in N S ˜ A is denoted as Equation (7).
N F ( u ) = m a x j = 1 n u i j A
where u i j A = 1 q k = 1 q u i j k .
n s ^ i j A = s ^ i j A N F ( u ) = s ^ i j A m a x j = 1 n u i j A
where s ^ i j A = ( l i j A , m i j A , u i j A ) = ( 1 q k = 1 q l i j k , 1 q k = 1 q m i j k , 1 q k = 1 q u i j k ) .
N S ˜ A = [ n s ^ i j A ] n × n = [ 0 ^ n s ^ 12 A n s ^ 21 A 0 ^ n s ^ 1 n A n s ^ 2 n A n s ^ n 1 A n s ^ n 2 A 0 ^ ]
n s ^ i j A = [ l i j A m a x j = 1 n u i j A , m i j A m a x j = 1 n u i j A , u i j A m a x j = 1 n u i j A ]
Next, the fuzzy total-relation matrix T S ˜ was acquired as follows:
T S ˜ = lim k ( ( N S ˜ A ) 1 + ( N S ˜ A ) 2 + + ( N S ˜ A ) k ) = N S ˜ A × ( E N S ˜ A ) 1
T S ˜ = [ t s ^ i j ] n × n = [ 0 ^ t s ^ 12 t s ^ 21 0 ^ t s ^ 1 n t s ^ 2 n t s ^ n 1 t s ^ n 2 0 ^ ] ,   t s ^ i j = ( t s ^ i j l , t s ^ i j m , t s ^ i j u )
{ [ t s ^ i j l ] = n s ^ i j l × ( E n s ^ i j l ) 1 [ t s ^ i j m ] = n s ^ i j m × ( E n s ^ i j m ) 1 [ t s ^ i j u ] = n s ^ i j u × ( E n s ^ i j u ) 1
(4)
Step 4. Defuzzifying the fuzzy total-relation matrix
In order to acquire a crisp total-relation matrix, it was necessary to defuzzify the element of the fuzzy total-relation matrix above. In this study, the calculation operator for the process of defuzzifying used the operator in the literature [108].
t s ^ i j = t s ^ i j l + 4 t s ^ i j m + t s ^ i j u 6
(5)
Step 5. Determining the weight of performance indicators of I3EAM
After obtaining the crisp total-relation matrix, the sum of the rows and the sum of the columns are separately denoted as X i and Y j , respectively, within the crisp total-relation matrix through the following formulas:
X i = [ x i ] = [ j = 1 n t s ^ i j ] , Y j = [ y j ] = [ i = 1 n t s ^ i j ]
Next, based on the crisp total-relation matrix, x i and y j were used to calculate the “Prominence” and “Relation”, respectively. In the approach of DEMATEL, the “Prominence” represents the strength of the influences that were both dispatched and received, and the “Relation” was used to determine the difference between the dispatched ones and the received ones. The vector p i named “Prominence” was obtained by adding x i to y j . Similarly, the vector r i named “Relation” was obtained by subtracting x i to y j . The vector p i reveals how much importance the criterion has, and the vector r i divides the criteria into groups of the cause and the effect.
p i = x i + y j , r i = x i y j , i = j
Then, the importance of the i th I3EAM performance indicator ω i was calculated using Equation (14) as follows.
ω i = p i 2 + r i 2
The importance of any I3EAM performance indicator can be normalized with Equation (15) as follows:
W i = ω i 1 i n ω i
(6)
Step 6. Constructing the group fuzzy initial decision matrix with determining the appropriate linguistic variables
Assuming that there are p social digitalization platforms (SDPs) being evaluated by q decision makers (DMs) with respect to n performance indicators, the k th decision maker’s linguistic initial decision matrix N k is as follows:
N k = SDP 1 SDP 2 SDP p [ d 11 k d 12 k d 21 k d 22 k d 1 n k d 2 n k d p 1 k d p 2 k d p n k ] k = 1 , 2 , ,   q
where d i j k is the k th decision maker’s judgement with a linguistic variable for the i th SDP under the j th I3EAM performance indicator, q is the number of experts, and n is the number of I3EAM performance indicator.
Aiming to evaluate the alternatives concerning the performance indicators, the linguistic terms include: “Very poor (VP)”, ”Poor (P)”, “Fair (F)”, “Good (G)”, and “Very good (VG)”, as well as their corresponding TFNs, which are (0,0,0.25), (0,0.25,0.5), (0.25,0.5,0.75), (0.5,0.75,1), and (0.75,1,1), respectively. Similarly, the group fuzzy initial decision matrix D ˜ can be obtained as follows:
D ˜ = [ d ^ 11 d ^ 12 d ^ 21 d ^ 22 d ^ 1 n d ^ 2 n d ^ p 1 d ^ p 2 d ^ p n ]
where d ^ i j = ( l ^ i j d , m ^ i j d , u ^ i j d ) , l ^ i j d = { l i j d 1 , , l i j d k , l i j d q } , m ^ i j d = { m i j d 1 , , m i j d k , m i j d q } , and u ^ i j d = { u i j d 1 , , u i j d k , u i j d q } . Then, by calculating the average value of each element in d ^ i j , the group fuzzy decision matrix D ˜ A , which was aggregated, can be obtained.
(7)
Step 7. Acquiring the weighted fuzzy decision matrix
The weighted fuzzy decision matrix D ˜ * was obtained as follows:
D ˜ * = [ d ^ i j * ] n × n , i = 1 , 2 , , p ; j = 1 , 2 , , n
where d ^ i j * = W ^ j d ^ i j A , W ^ j is the weight of the j th performance indicator calculated by Equation (15), and d ^ i j A = ( l i j d A , m i j d A , u i j d A ) = ( 1 q k = 1 q l i j d k , 1 q k = 1 q m i j d k , 1 q k = 1 q u i j d k ) .
(8)
Step 8. Determining the fuzzy positive-ideal solution (FPIS) and fuzzy negative-ideal solution (FNIS)
The FPIS and FNIS were identified from the weighted fuzzy decision matrix by calculating Equations (19) and (20), respectively. The d ^ j + and d ^ j separately represent the FPIS and FNIS, respectively.
d ^ j + = max i ( d ^ i j )   w h e r e   d ^ j + u = max i ( d ^ i j u )
d ^ j = min i ( d ^ i j )   w h e r e   d ^ j l = min i ( d ^ i j l )
(9)
Step 9. Calculating the distance of each SDP alternative from FPIS and FNIS
The distances ( D i + and D i ) of each alternative from d ^ j + and d ^ j can calculated by using the following equations.
D i + = 1 3 j = 1 n [ ( d ^ i j l d ^ i j + l ) 2 + ( d ^ i j m d ^ i j + m ) 2 + ( d ^ i j u d ^ i j + u ) 2 ]
D i = 1 3 j = 1 n [ ( d ^ i j l d ^ i j l ) 2 + ( d ^ i j m d ^ i j m ) 2 + ( d ^ i j u d ^ i j u ) 2 ]
(10)
Step 10. Acquiring the closeness coefficients and the priority of alternatives
The closeness coefficients C C i represents the relative gaps–degree of each SPD alternative, and C C i can be obtained through calculating Equation (23). On the basis of C C i , we can also acquire the priority of all of the SDP alternatives (digitalization service provider for the co-implementation of I3EAM).
C C i = D i D i + + D i

7. Case Study

7.1. Reference Model of I3EAM Schemes in Automated Container Terminals

In this section, a case study of building an I3EAM solution in an Automated Container Terminal (ACT) application scenario will be presented. The case was also taken as an example to demonstrate the application of the proposed general model and reference architecture. The context of the study is the digital transformation needs of the ports, which require the use of Industrial Internet technologies and platforms to build a parallel management system for container terminal equipment assets. We invited several industry experts, marine equipment companies, and port terminal companies to discuss and use the general reference model to collect and qualitatively analyze the requirements for the I3EAM solution for automated container terminals. Figure 10 shows the reference model of I3EAM schemes in automated container terminals (ACTs).
(1)
Dimension 1: Industrial Internet element (II) dimension
The Equipment Asset Management of automated container terminals presents comprehensive requirements for the Industrial Internet elements, including the physical entity, the virtual object, the digital twin data, the interaction, and the service. In this study, the physical entity models in the ACTs include lifting equipment, crane equipment, storage yard equipment, port heavy AGV, the container truck and its sensory systems and environmental systems. To build the ACT simulation and emulation systems, the construction and management of virtual object models is considered to be necessary to realize the sensing, modeling, and management of the physical entities, the information flows, and the social relationships. Multiple sources of heterogeneous data were required to be integrated and managed, including the data from the physical entities, virtual objects, and services, the domain knowledge, and the fused data. The service model is comprised of real-time monitoring, state assessment, fault diagnosis, intelligent maintenance, and intelligent decision making (i.e., production scheduling, etc.). The interaction models built the connections among the different models.
(2)
Dimension 2: Industry (I) dimension
Container terminals are closely related to marine engineering and shipping, transportation and other industries. From the perspective of equipment assets, they should belong to the marine engineering and shipping industry, which will inherit the characteristics of the industry and adapt to the development needs of the industry. Due to various reasons such as efficiency, costs, and epidemics, the container terminals and unmanned terminals have become the trend of industry development, and there is an urgent need to improve the level of terminal digitalization, networking, and intelligence.
(3)
Dimension 3: EAM-related activities (EAM) dimension
In Section 4, the comprehensive EAM-related activity model is introduced, and it was used for analyzing and recognizing the scenario-based value in automated container terminals. From the perspective of the equipment’s lifecycle, using and safeguarding them is regarded as the main application scenario in automated container terminals. From the perspective of business collaboration, automated container terminals constitute a complex organic system, which includes the level of equipment health that will affect different levels of the integrated systems (including the station, the work center, the production line, and the enterprise). From the perspective of system support, the entire ACT system will also be affected by random factors such as the arrival of the cargo vessel, and so the system usually requires dynamic response and scheduling. Therefore, the necessary planning and control activities need to be provided at the levels of both integration and operation.

7.2. Reference Architecture for the Implementation of I3EAM in Automated Container Terminals

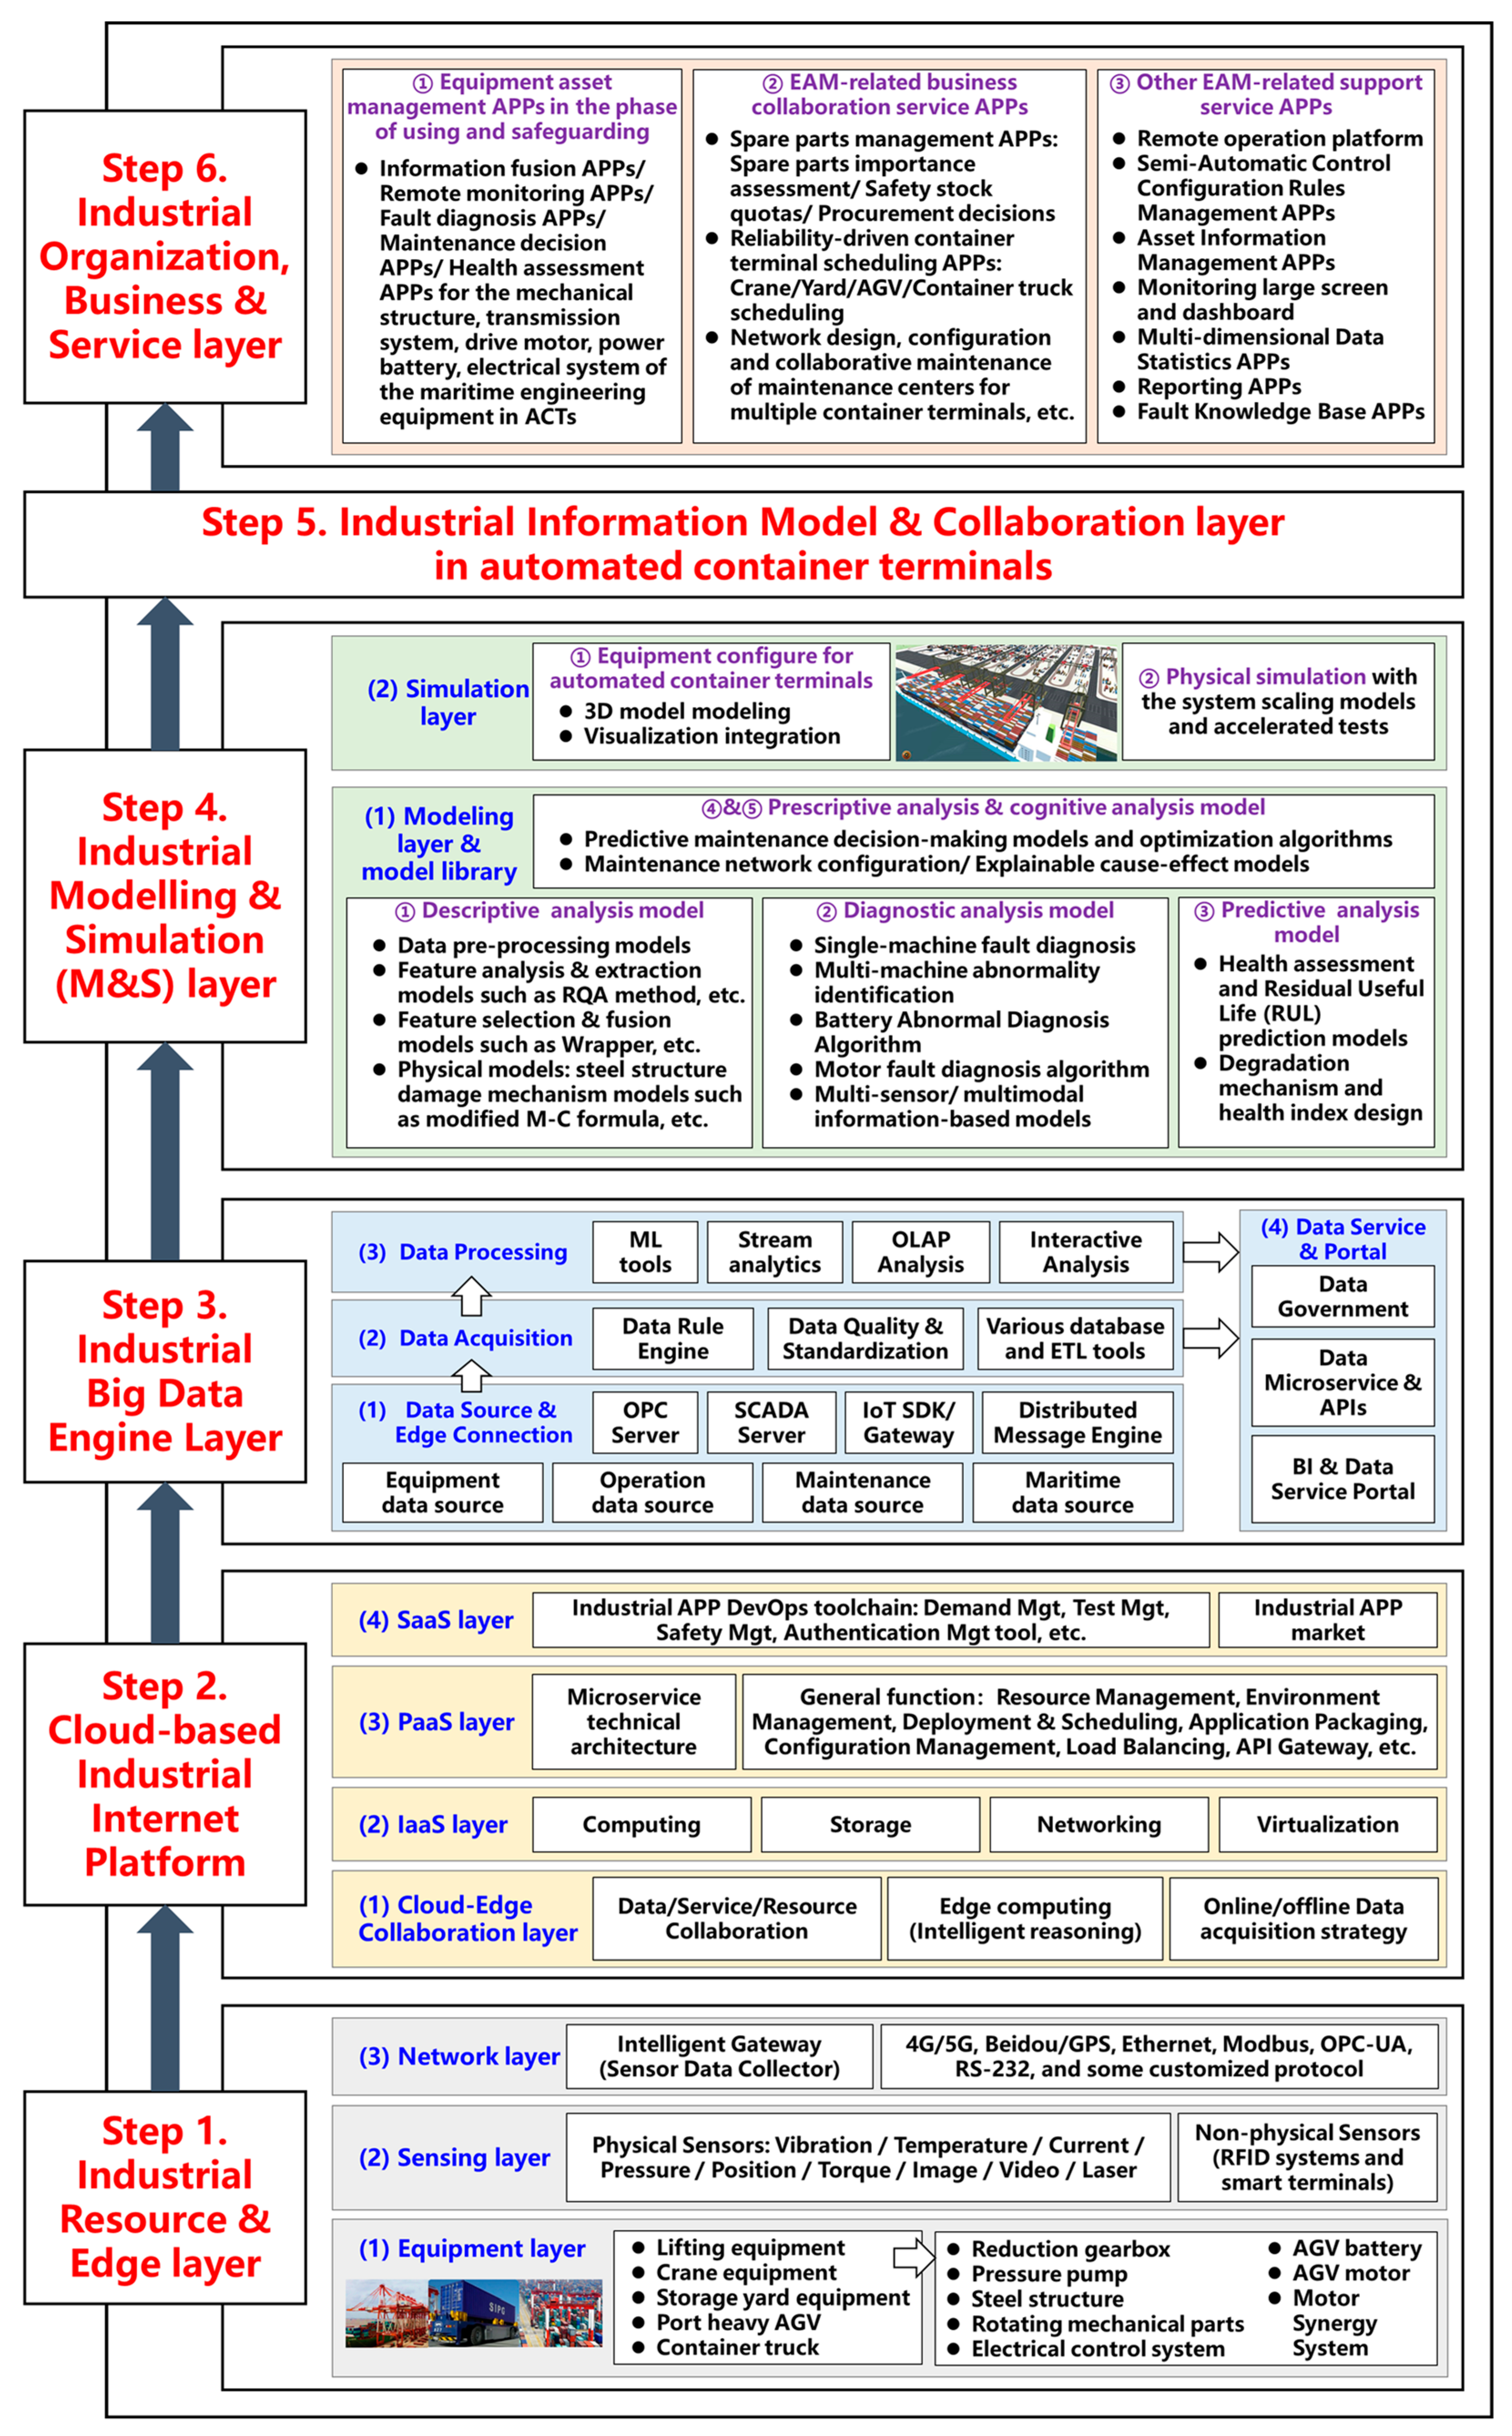
Referring to the architecture that is proposed in Section 5, the implementation path of I3EAM in the automated container terminals is composed of six common steps and special elements about the automated container terminal corresponding to the enterprise needs. Figure 11 shows the whole picture of the reference architecture for the I3EAM implementation in automated container terminals.
(1)
Step 1: Industrial resource and edge layer in ACTs
For automated container terminals, the main equipment includes the lifting equipment, the crane equipment, the storage yard equipment, the port heavy AGV, and the container truck. The focused sub-systems in the EAM business include the reduction gearbox, the pressure pump, the steel structure, the rotating mechanical parts, the electrical control system, the AGV battery, the AGV motor, and the motor synergy system. For connection and communication, the sensory systems should provide the data perception capacities about the various physical signals involving the vibration, temperature, current, pressure, position, torque, image, video, and laser ones. Additionally, many RFID-based systems and smart terminals are used for non-physical signals. With the consideration of the heterogenous equipment and edge sensors, the intelligent gateway and configurable protocol pool were planned and developed.
(2)
Step 2: Cloud-based Industrial Internet platform layer in ACTs
The cloud environment is necessary for the open, flexible, and dynamic business regarding automated container terminals. The designed platform of I3EAM in the ACTs is divided into four basic layers, including the cloud-edge collaboration layer, the IaaS layer, the PaaS layer, and the SaaS layer. Between the heterogenous integrated equipment and the remote control platform, it was necessary to establish a time-sensitive pipeline for the data/service/resource collaboration. In addition, intelligent reasoning for the edge sides and flexible data acquisition strategies were also required. The platform should be based on the microservice technical architecture. Meanwhile, the general enabling functions for resource virtualization, resource management, and service development and deployment were selected from the reference architecture, including the Resource Management, Environment Management, Deployment and Scheduling, and Configuration Management ones, etc. The APP DevOps toolchain and ecosystem are also important for the whole I3EAM scheme. Based on the protocol adaptor, secure connector, and distributed message engine, the various source data were collected in the form of streaming data or batch data.
(3)
Step 3: Industrial big data engine layer in ACTs
The third step was to plan and construct the big data engine for the common requirements in the perspective of the data source and the edge connection, the data acquisition, the data processing, and the data service and portal. In the data warehouse, the subject data which were to be collected for the automated container terminals included the equipment source data, the operation source data, the maintenance source data, and the maritime source data. The system should have a data extraction capability and it should use ETL (Extract-Transform-Load) tools to realize data import and fusion into the database. Through the data rule engine, the data quality management and its standardization, and the standard data, which are scattered, fragmented, and non-uniform, should be loaded and integrated into the data warehouse. In addition, data processing functions in the online and offline modes were needed, including machine learning (ML) tools, stream analytics, an OLAP analysis, and an interactive analysis. To satisfy different data service requirements, the tools for the full data lifecycle will be encapsulated as microservices and invoked through the APIs to support various business intelligence (BI) processes and to provide access to the users’ data.
(4)
Step 4: Industrial modelling and simulation (M and S) layer in ACTs
Through the demand analysis of predictive maintenance for automated terminals, the system decision strategy will use a combination of online and offline, stand-alone and system, equipment and process, local diagnosis, local diagnosis and remote diagnosis, wired communication and wireless communication systems. The I3EAM solution requires multi-level and multi-faceted condition monitoring, fault diagnosis, and intelligent maintenance for the automated terminals to fully ensure the stable and reliable operation of the terminal production and operation. Modeling and model libraries play an important role in the process of the intellectualization of the container terminals, including intelligent perception, intelligent control, and intelligent decision making. In the environment of rich data sources, multiple layers of analyses need to be developed, including descriptive, diagnostic, predictive, prescriptive, and cognitive analyses.
The descriptive analysis model contains the models of data pre-processing, feature analysis and extraction (such as the RQA method, etc.), feature selection and fusion (such as Wrapper, etc.), and the special physical models such as the steel structure damage mechanism models such as the modified M-C formula, etc. The diagnostic analysis model contains the single-machine fault diagnosis, the multi-machine abnormality identification, the battery abnormal diagnosis, the motor fault diagnosis, and the multi-sensor or multimodal information-based models. The predictive analysis model contains the health assessment and residual useful life (RUL) prediction models, and the degradation mechanisms and health index for the various ACT equipment and the key components. Additionally, the prescriptive and cognitive analyses need to pay more attention to causal-based decision making, including the predictive maintenance decision-making models and the optimization algorithms, the maintenance network configuration, and the explainable cause–effect models.
In addition, the simulation layer was needed, and as well as this, the equipment configuration and physical simulations were considered. Combining the domain knowledge of complex equipment and equipment performance, the visual integration of the automated container terminals was realized based on 3D models. Through equipment configuration management and imitation learning based on scaling models and accelerated tests, a more realistic simulation was carried out to optimize and improve it, and better targeting was achieved from multiple perspectives, such as single machine equipment performance and system control.
(5)
Step 5: Industrial information model and collaboration layer in ACTs
The industrial information model is an essential agreement that is shared by the participants and components in any networked and integrated system, facilitating compatibility and interoperability. Under the application scenario of the ACTs, different Industrial Internet elements (the physical entity, the virtual object, the data, and the service) in I3EAM are evolving and generating new interaction and collaboration requirements. The system needs to support the high level of interoperability, customized development, and the flexible configuration of the industrial information models. During the implementation, the different elements and their interactions were delicately and unambiguously named and assigned according to the conceptual, declarative, and programmatic representations.
(6)
Step 6: Industrial organization, business, and service layer in ACTs
Based on the EAM dimensions in the reference model and the service activity meta-model given in Section 5.7, the scenario-based service requirements of the automated container terminals were identified. The automated container terminals are the application scenario of the offshore equipment such as cranes, which mainly consider the use and protection phase of the equipment. According to the level of system integration, the status performance of single machine equipment needed to be linked with the parts (spare parts), workstations, terminal areas, enterprises, and service networks. The identified service scenarios will be transformed into industrial APP development requirements.
In the I3EAM of the targeted automated container terminal, three types of industrial APPs needed to be developed as follows:
  • The Equipment Asset Management APPs of using and safeguarding: information fusion APPs, remote monitoring APPs, fault diagnosis APPs, maintenance decision APPs, and health assessment APPs for the mechanical structure, transmission system, drive motor, power battery, electrical systems of the marine engineering equipment in the ACTs.
  • The EAM-related business collaboration service APPs: spare parts management APPs (such as spare parts importance assessment, safety stock quotas, and procurement decision-making), reliability-driven container terminal scheduling APPs (such as crane/yard/AGV/container truck scheduling), maintenance network design and configuration, and collaborative maintenance of maintenance centers for multiple container terminals, etc.
  • The EAM-related support service APPs: remote operation platform, semi-automatic control configuration rules management APPs, asset information management APPs, monitoring large screen and dashboard, multi-dimensional data statistics APPs, reporting APPs, and fault knowledge-based APPs.

7.3. Evaluation and Selection of I3EAM Schemes in Automated Container Terminals

(1)
I3EAM scheme alternative profile
The case background is a new automated container terminal construction project in a coastal city in China. In order to enhance the digitalization and intelligence of the container terminal, there was an urgent need to develop a new Equipment Asset Management solution to help the terminal improve its operational capabilities. Social digitalization platforms have become the enabler and the accelerator for transformation in traditional industries. Aiming at the I3EAM in the automated container terminal, there were four SDP alternatives for the co-implementation of I3EAM, including MindSphere (Siemens), Azure (Microsoft), ROOTCLOUD (SANY), INDICS (CASICCloud), at the start of the project. According to the implementation requirements that were analyzed previously, the four SDPs submitted their technical solutions. The project team applied the proposed framework and approach to decide for the best scheme and platform partner. Due to confidentiality reasons, the schemes are randomly named as P 1 P 4 .
(2)
Expert-based evaluation data collection
The project team consists of eight decision makers, including industry experts, marine equipment companies, and port terminal companies, all of whom have an average of more than 10 years of experience in terminal construction or digital transformation. Similarly, the decision makers’ profiles and the order of the decision making are not declared here, but they are randomly labelled as D M 1 D M 8 .
The performance metric set and the evaluation and selection approach in Section 6 were used to help select the best alternative of I3EAM scheme and its social digitalization platform for the automated container terminals. To determine the weight of the performance indicators and the priority of the alternatives, each member of the decision group provided two initial evaluation matrices, including the dependence matrix of performance indicators, and the decision matrix of I3EAM schemes with its SDPs. The original data are provided in Appendix A (Table A1, Table A2 and Table A3). There is one table containing the brief information of the decision makers, and there are two tables for the two groups of fuzzy initial matrices.
(3)
Performance indicator weight analysis by fuzzy DEMATEL
In this study, the computational tool and environment for the fuzzy DEMATEL method was Matlab2022a. The process of the weighting analysis is outlined as follows. Through calculating Formula (1) and using the membership function in Table 4, the initial dependence matrix of performance indicators was converted to the triangular fuzzy direct-relation matrix. Next, by using Equations (4)–(10), the fuzzy normalized direct-relation matrix and fuzzy total-relation matrix were obtained. Then, the fuzzy total-relation matrix was defuzzified through Equation (11). Finally, based on the crisp total-relation matrix, the normalized weights can be obtained by calculating Equations (12)–(15). As shown in Table 5, the computation results were obtained.
In our case, the T4 (Industrial modeling and simulation service capability), T3 (Industrial big data engine performance), T8 (System integration and collaboration capability), B3 (Cost of digitalization service), T7 (Scheme technical architecture performance), T6 (Development environment supporting), and B1 (Talent guarantee) emerge as the top six performance indicators of I3EAM in the automated container terminals.
(4)
I3EAM scheme sorting and selection by fuzzy TOPSIS
Similarly, the computational tool and environment for the fuzzy TOPSIS method was Matlab2022a. By applying Equation (18) and combining the normalized weights, the weighted fuzzy decision matrix was obtained. Then, through Equations (19) and (20), both the fuzzy positive-ideal solution (FPIS) and the fuzzy negative-ideal solution (FNIS) were calculated, and they are listed in Table 6.
Using Equations (21)–(23), the distance to the ideal solutions, closeness coefficient, and priority of each alternative can be calculated, as shown in Table 7. Meanwhile, the sorting of I3EAM scheme alternatives was obtained as follows: P 3   ( C C 3 = 0.6802 ) > P 2   ( C C 2 = 0.4574 ) > P 4   ( C C 4 = 0.4553 ) > P 1   ( C C 1 = 0.3376 ) . Therefore, the P 3 was the selected alternative.

7.4. The Results

In the case study above, the I3EAM’s system model and reference architecture provided the knowledge structure and systematic decision-making approach for the digitalization of the targeted global port. In our case, the applicational results of our model will be tested and examined in two main aspects: (1) whether it supports the correct implementation of the automated container terminal EAM system, and (2) whether it reduces the complexity and uncertainty of decision making.
For the first question, we examined the deviations of the implementation results of the ACT from the planning. The results show that the requirements and system architecture planning that were analyzed by I3EAM cover the list of functions of the ACT in the review phase. Around the three core equipment assets of the ACT, the project finally established capabilities such as structure resolution, edge connectivity, platform aggregation, big data engine, the model repository and ACT simulation tools, and the APP service pool. The operational status of the equipment assets can be transmitted back to the remote monitoring cloud platform through multi-channel and multi-type sensors in real time, and the joint diagnosis can be performed based on remote experts and online models. The cargo vessel demands and equipment status were incorporated into a joint scheduling model, while the swarm intelligence approaches are used to coordinate multiple equipment clusters. The overall port throughput performance meets the expected design target of 4 million containers per year. At the same time, the ACT’s flexible architecture enables a scalability up to a forward throughput of 6.3 million containers per year.
For the second question, we went back to five of the decision makers of the project team and several other project members. They represented the port group, the equipment manufacturer, the terminal operator, and the external experts. The performance of the proposed decision-making model and process was validated via 12 semi-structure interviews and the backtracking of documents. All of the respondents indicated that our knowledge structure had a significant impact during the project planning phase, especially as the Industrial Internet standards were being developed at that time. In addition, they believe that the reference architecture generalizes the multi-view knowledge well and provides analytical tools to help implement EAM systems in different domains. The respondents agreed that the research result provided a logical, understandable, and step-by-step guide for the EAM projects. The model facilitates the project teams’ systematic understanding of the Industrial Internet and EAM, collaboration across organizations, and the identification of the best platform partner.

8. Discussion

8.1. Caparisions among the Existing Research and the Research in This Paper for EAM

In the part of the status review (see Section 2), a comprehensive survey and comparison of the existing studies about the Industrial Internet-based EAM were made, including the related concepts, key technologies, application fields, decision support systems, and technical solutions, etc. The existing research mainly focus on the explicit technologies of EAM and their local applications, and only a few works give a comprehensive view of EAM implementation under the Industrial Internet-based environment. In China, the Alliance of Industrial Internet (AII) has released “Industrial Internet System Architecture (IISA) version 2.0” [13], which means the reference architecture of the Industrial Internet Platform (IIP) has been standardized. From the perspective of the future consideration of the IIP, China’s IIP needs to emphasize the scenario-driven architecture design and implementation to adapt to our national conditions [9]. However, as an important applicational scenario, the EAM domain still lacks a clear implementation path based on Industrial Internet for the actual projects. In this paper, the authors proposed a general system model, a reference architecture, and an evaluation system with the metric set and decision-making approach in order to establish the mapping with EAM application requirements and the IIP system architecture. The model of I3EAM is based on the IISA 2.0 and digital twin metamodel, and it provides more powerful high-level abstractions, and as well as this, the structured model can be developed and integrated quickly. The paradigm of Design Science Research (DSR) has been introduced into the study along fusion path between EAM and Industrial Internet. This is a valuable addition to existing research. Meanwhile, the system architecture research provides support for the horizontal collaboration of the existing research.

8.2. Caparisions between Traditional Information System and Social Digitalization Platform

Platform-based digitalization is emphasized here, particularly to leverage the abilities of social digitalization platforms. The traditional process of business–IT alignment focuses on the implementation of information systems, such as SCADA, ERP, MES, etc. The information system is seen as a system of records to assist staff in the local monitoring and managing of the operational status of the equipment assets. Social digitalization platforms based on the Industrial Internet are more focused on how to support the wider interaction and collaboration in heterogeneous environments. For example, two types of information systems have been developed by separate entities, and they support the operation of container terminals. One type is the product service system that is provided by the equipment manufacturers, i.e., the condition monitoring software for structures, motors, and transmissions. One type is the shipping data system of the port group company, which collects the vessel and cargo information. In the traditional model, there is no integration between the two information systems. However, the EAM model recognizes that automated container terminals require the integration of demanding information, equipment reliability, and O and M planning to enable rapid resource scheduling. Therefore, when one is evaluating different I3EAM solutions using a structured model, the modelling of heterogeneous data integration and collaborative scheduling issues were highlighted to be the highest priority. Meanwhile, the eventual winner ( P 3 in Table 7), which shows the accumulation of its shipping data analysis capabilities and general technologies, obtained the favor of the decision makers. This implicit phenomenon reflects the unique ecosystem advantage of the social digitalization platforms over the traditional IT service providers.

8.3. Caparisions between Traditional Process and Proposed Process for Decision Making

In the past, information systems development has been implemented during the phase of assets operation. However, digitalization is merging asset development, business innovation, and IT support. In our case, the Yangshan automated container terminal was regarded as a whole complex system, and the project emphasized the importance of overall planning in system implementation. The digital capabilities for EAM are the basic needs of system planning and design. The results in this paper offer the foundation and system engineering approaches to find the whole picture of the ACT’s EAM system. Complex engineered systems usually involve many stakeholders. Traditional decision-making processes adopt the strategy of face-to-face meetings and step-by-step implementation. Nonetheless, the stakeholders involved often have inconsistent knowledge structures and value propositions about the target system, which leads to inefficiencies in their decision making and negotiation processes. Our research provides decision support for both of the two-aspect challenges. First, the multi-layer architecture illustrates the different view and structured knowledge of the I3EAM. Next, the performance indicators define the core potential value propositions from different perspectives. Except for the models, the proposed evaluation method based on fuzzy DEMATEL-TOPSIS simplifies the decision-making processes and makes them clearer. On the basis of the model, work such as more targeted information gathering and consultation were carried out. At the same time, the value propositions of multiple relevant stakeholders are coordinated with a scientific decision-making approach. The fuzzy method alleviates the uncertainty in the decision-making process. As a rough estimate, the project time for early decision making and negotiations were reduced by 30%. The project implementation met the expected system functional requirements and retained extensible interfaces for high-level functions.
To sum up, our research results are feasible and effective. The given model, the architecture, and the method in this study can create a certain reference value for both the EAM-related business–IT alignment of various enterprises (especially SMEs) and the development of IIPs (especially SDPs).

9. Conclusions

The research motivation and the objective of this paper are to improve the capability of complex system awareness and decision-making for I3EAM projects and to provide reference knowledge for the top-level planning and the effective implementation of different industrial enterprises. This study proposes a general reference model and a reference architecture for the implementation of Industrial Internet Solution for Industrial Equipment Asset Management (I3EAM). In addition, this study also developed a set of performance indicators for I3EAM and a scheme selection method by using the fuzzy DEMATEL-TOPSIS approach. A case study from the practice in an automated container terminal project demonstrates the feasibility and efficiency of the proposed model, architecture, and approach. Various industrial enterprises can carry out the analysis and top-level planning of their I3EAM needs, and the evaluation and selection of a co-implementation platform partner with our research results. Industrial Internet Platforms (IIPs) can carry out self-evaluation and self-diagnosis continuously for their EAM technical solutions based on the general model and reference architecture.
The scientific contribution of our study is remarkable, especially the exploratory work of DSR (Design Science Research) for the combination of EAM and the Industrial Internet. The structured knowledge and reference architecture models will reduce the complexity and uncertainty of system development, directly. IISA 2.0 is the standardized reference architecture model for the Industrial Internet in China, and this work is also the first to establish a detailed IISA-based scenario application model. Our research provides a useful and valuable addition to the existing academic literature and community such as EAM, II, information system, and digital transformation, etc., and it promotes collaborative evolution among these fields.
Due to the limited space, there are some follow-up works that need to be studied to supplement these findings. The future works of this study mainly contain three aspects.
  • Firstly, more detailed content should be studied and analyzed for the comprehensive I3EAM reference model and technical architecture, including key technologies, information models, governance mechanisms, and programmatic components.
  • Secondly, more precise and refined performance metrics and group decision methods should be used for the design of complex systems and system architecture.
  • Thirdly, they should be further applied and verified in various industries and fields.

Author Contributions

Conceptualization, Y.B. and X.M.; methodology, Y.B., X.Z., T.Z. and Z.C.; validation, Y.B.; investigation, Y.B. and Z.C.; data curation, Y.B.; writing—original draft preparation, Y.B.; writing—review and editing, Y.B., X.Z., T.Z., Z.C. and X.M.; supervision, X.M.; funding acquisition, X.M. All authors have read and agreed to the published version of the manuscript.

Funding

This research was funded by National Natural Science Foundation of China [Grant No. 71632008]; Transformation and Upgrading of Industry in 2017 (China Manufacturing 2025) [Grant No. ZL35060009002]; Special Development Fund of China (Shanghai) Pilot Free Trade Zone [No. 725 (Title of funding project: ‘Integrated equipment R&D and demonstration application in Yangshan automation container terminal’)].

Data Availability Statement

Not applicable.

Acknowledgments

The authors would like to thank Shanghai Key Laboratory of Advanced Manufacturing Environment, Shanghai Research Center for industrial Informatics (SRCI2), and SJTU Innovation Center of Producer Service Development (SICPSD) for the funding support to this research.

Conflicts of Interest

The authors declare no conflict of interest.

Appendix A

Table A1. The detail information for the decision-makers.
Number of DMType of DMWorking Years of DM
1Vice General Manager and
Project manager
15
2Group IT Director13
3Group Chief Engineer25
4Vice Director of Manufacturer Software Inc.16
5General manager of ACT13
6Director of Strategic Planning15
7Group Financial Director20
8External Expert (Professor)23
Table A2. The group fuzzy initial direct-relation matrix.
D M 1 B1B2B3T1T2T3T4T5T6T7T8A1A2A3A4
B1023110430330000
B2002021000220200
B3000002200000000
T1000.500.53430.540.52000
T2201002100033021
T3203010423322021
T4304103012142102
T5002302202221000
T6203002220141201
T7002002200020000
T8001001300200000
A1200.501220.51010003
A2401000310231012
A3020010100030003
A4011000000000000
D M 8 B1B2B3T1T2T3T4T5T6T7T8A1A2A3A4
B1002112301321001
B2002013100010020
B3000001200.5000000
T100301220.50321000
T2002202100230012
T32040.530411332010
T440410.54011221011
T5001101101120000
T6202113320232201
T7003023311031000
T8002112322300002
A1201012202010112
A2302022410321013
A3011000.5200021002
A4002000000001000
Table A3. The group fuzzy initial direct decision matrix.
B1B2B3T1T2T3T4T5T6T7T8A1A2A3A4
D M 1 P 1 0.750.750.750.50.250.50.50.250.250.50.50.750.250.250.25
P 2 0.50.250.250.510.50.50.250.7510.750.50.50.50.5
P 3 0.50.50.510.5110.250.7510.50.750.50.751
P 4 10.510.250.750.50.2500.250.750.50.510.250.5
D M 2 P 1 0.510.750.250.250.50.50.250.250.250.750.750.2500
P 2 0.50.50.250.510.750.50.50.50.7510.750.50.250.75
P 3 0.50.50.7510.7510.750.750.510.50.750.250.51
P 4 0.750.50.750.250.750.50.500.250.50.50.250.750.250.5
D M 3 P 1 0.750.750.750.50.50.50.50.250.250.50.50.50.250.250.25
P 2 0.750.250.250.7510.750.250.250.750.750.750.750.50.50.5
P 3 0.50.50.510.5110.2510.750.50.750.50.750.75
P 4 10.50.750.50.750.750.50.250.250.250.50.250.750.250.75
D M 8 P 1 0.50.50.750.50.50.50.250.250.250.750.750.250.2500
P 2 0.50.250.250.7510.50.50.250.50.7510.750.750.50.5
P 3 0.50.250.510.75110.250.510.750.750.50.750.75
P 4 10.50.750.750.750.50.250.250.250.750.750.2510.250.75

References

  1. El-Akruti, K.; Dwight, R.; Zhang, T. The strategic role of Engineering Asset Management. Int. J. Prod. Econ. 2013, 146, 227–239. [Google Scholar] [CrossRef] [Green Version]
  2. Lee, J.; Wu, F.; Zhao, W.; Ghaffari, M.; Liao, L.; Siegel, D. Prognostics and health management design for rotary machinery systems—Reviews, methodology and applications. Mech. Syst. Signal Process. 2014, 42, 314–334. [Google Scholar] [CrossRef]
  3. Zhang, P.; Gao, Z.; Cao, L.; Dong, F.; Zou, Y.; Wang, K.; Zhang, Y.; Sun, P. Marine Systems and Equipment Prognostics and Health Management: A Systematic Review from Health Condition Monitoring to Maintenance Strategy. Machines 2022, 10, 72. [Google Scholar] [CrossRef]
  4. Ren, Z.; Wan, J.; Deng, P. Machine-Learning-Driven Digital Twin for Lifecycle Management of Complex Equipment. IEEE Trans. Emerg. Top. Comput. 2022, 10, 9–22. [Google Scholar] [CrossRef]
  5. Hoffmann Souza, M.L.; da Costa, C.A.; de Oliveira Ramos, G.; da Rosa Righi, R. A survey on decision-making based on system reliability in the context of Industry 4.0. J. Manuf. Syst. 2020, 56, 133–156. [Google Scholar] [CrossRef]
  6. Mi, S.; Feng, Y.; Zheng, H.; Wang, Y.; Gao, Y.; Tan, J. Prediction maintenance integrated decision-making approach supported by digital twin-driven cooperative awareness and interconnection framework. J. Manuf. Syst. 2020, 58, 329–345. [Google Scholar] [CrossRef]
  7. Erguido, A.; Marquez, A.C.; Castellano, E.; Parlikad, A.K.; Izquierdo, J. Asset Management Framework and Tools for Facing Challenges in the Adoption of Product-Service Systems. IEEE Trans. Eng. Manag. 2019, 69, 2693–2706. [Google Scholar] [CrossRef] [Green Version]
  8. Kiritsis, D.; Emmanouilidis, C.; Koronios, A.; Mathew, J. Engineering Asset Lifecycle Management; Springer-Verlag: London, UK, 2010. [Google Scholar]
  9. Li, J.; Qiu, J.-J.; Zhou, Y.; Wen, S.; Dou, K.-Q.; Li, Q. Study on the Reference Architecture and Assessment Framework of Industrial Internet Platform. IEEE Access 2020, 8, 164950–164971. [Google Scholar] [CrossRef]
  10. Zhang, X.; Ming, X. A comprehensive industrial practice for Industrial Internet Platform (IIP): General model, reference architecture, and industrial verification. Comput. Ind. Eng. 2021, 158, 107426. [Google Scholar] [CrossRef]
  11. Bao, Y.; Sun, Z.; Liao, X.; Chang, Y.; Qiu, S.; Ming, X. An industrial equipment maintenance support system for networked collaborative evolution in the smart product service ecosystem. In Proceedings of the 2022 IEEE Conference on Digital Twins & Parallel Intelligence, Ningbo, China, 26–28 October 2022. [Google Scholar]
  12. The Industrial Internet of Things Volume G1: Reference Architecture; Industrial Internet Consortium: Needham Heights, MA, USA, 2019; pp. 1–7.
  13. AII. Industrial Internet System Architecture 2.0. Alliance of Industrial Internet (AII): 2020. Available online: http://www.aii-alliance.org/index/c315/n45.html (accessed on 20 April 2020).
  14. DIN SPEC. Reference Architecture Model Industrie 4.0 (RAMI4. 0); DIN SPEC: Berlin, Germany, 2016; p. 10.31030. [Google Scholar]
  15. Industrial Value Chain Initiative. Industrial Value Chain Reference Architecture (IVRA); Technical Report; Industrial Value Chain Initiative: Tokyo, Japan, 2016. [Google Scholar]
  16. Amadi-Echendu, J.E.; Willett, R.; Brown, K.; Hope, T.; Lee, J.; Mathew, J.; Vyas, N.; Yang, B.S. What is engineering asset management? In Definitions, Concepts and Scope of Engineering Asset Management; Springer: Berlin/Heidelberg, Germany, 2010; pp. 3–16. [Google Scholar]
  17. El-Akruti, K.; Dwight, R. A framework for the engineering asset management system. J. Qual. Maint. Eng. 2013, 19, 398–412. [Google Scholar] [CrossRef]
  18. Ouertani, M.Z.; Parlikad, A.K.; McFarlane, D. Asset information management: Research challenges. In Proceedings of the 2008 Second International Conference on Research Challenges in Information Science, Marrakech, Morocco, 3–6 June 2008; IEEE: Manhattan, NY, USA, 2008. [Google Scholar]
  19. Schuman, C.A.; Brent, A.C. Asset life cycle management: Towards improving physical asset performance in the process industry. Int. J. Oper. Prod. Manag. 2005, 25, 566–579. [Google Scholar] [CrossRef] [Green Version]
  20. Macchi, M.; Roda, I.; Negri, E.; Fumagalli, L. Exploring the role of Digital Twin for Asset Lifecycle Management. IFAC-PapersOnLine 2018, 51, 790–795. [Google Scholar] [CrossRef]
  21. Mont, O.K. Clarifying the concept of product–service system. J. Clean. Prod. 2002, 10, 237–245. [Google Scholar] [CrossRef]
  22. Tukker, A. Eight types of product–service system: Eight ways to sustainability? Experiences from SusProNet. Bus. Strat. Environ. 2004, 13, 246–260. [Google Scholar] [CrossRef]
  23. Song, W.; Sakao, T. A customization-oriented framework for design of sustainable product/service system. J. Clean. Prod. 2017, 140, 1672–1685. [Google Scholar] [CrossRef] [Green Version]
  24. Tomiyama, T.; Lutters, E.; Stark, R.; Abramovici, M. Development capabilities for smart products. CIRP Ann. 2019, 68, 727–750. [Google Scholar] [CrossRef]
  25. Porter, M.E.; Heppelmann, J.E. How smart, connected products are transforming competition. Harv. Bus. Rev. 2014, 92, 64–88. [Google Scholar]
  26. Valencia, A.; Mugge, R.; Schoormans, J.; Schifferstein, H. The design of smart product-service systems (PSSs): An exploration of design characteristics. Int. J. Des. 2015, 9, 13–28. [Google Scholar]
  27. Zheng, P.; Wang, Z.; Chen, C.-H.; Khoo, L.P. A survey of smart product-service systems: Key aspects, challenges and future perspectives. Adv. Eng. Inform. 2019, 42, 100973. [Google Scholar] [CrossRef]
  28. Chen, Z.; Ming, X.; Vareilles, E.; Battaia, O. Modularization of smart product service: A framework integrating smart product service blueprint and weighted complex network. Comput. Ind. 2020, 123, 103302. [Google Scholar] [CrossRef]
  29. Kagermann, H.; Riemensperger, F.; Hoke, D.; Helbig, J.; Stocksmeier, D.; Wahlster, W.; Schweer, D. Smart Service Welt: Recommendations for the Strategic Initiative Web-Based Services for Businesses; Acatech-National Academy of Science and Engineering: Berlin, Germany, 2014. [Google Scholar]
  30. Zheng, M.; Ming, X.; Wang, L.; Yin, D.; Zhang, X. Status Review and Future Perspectives on the Framework of Smart Product Service Ecosystem. Procedia CIRP 2017, 64, 181–186. [Google Scholar] [CrossRef]
  31. Cenamor, J.; Sjödin, D.R.; Parida, V. Adopting a platform approach in servitization: Leveraging the value of digitalization. Int. J. Prod. Econ. 2017, 192, 54–65. [Google Scholar] [CrossRef]
  32. Paiola, M.; Gebauer, H. Internet of things technologies, digital servitization and business model innovation in BtoB manufacturing firms. Ind. Mark. Manag. 2020, 89, 245–264. [Google Scholar] [CrossRef]
  33. Tian, J.M.; Coreynen, W.; Matthyssens, P.; Shen, L. Platform-based servitization and business model adaptation by established manufacturers. Technovation 2021, 118, 102222. [Google Scholar] [CrossRef]
  34. Thomas, L.D.W.; Autio, E.; Gann, D.M. Architectural Leverage: Putting Platforms in Context. Acad. Manag. Perspect. 2014, 28, 198–219. [Google Scholar] [CrossRef]
  35. Fehrer, J.A.; Woratschek, H.; Brodie, R.J. A systemic logic for platform business models. J. Serv. Manag. 2018, 29, 546–568. [Google Scholar] [CrossRef] [Green Version]
  36. Zhou, T.; Ming, X.; Chen, Z.; Miao, R. Selecting industrial IoT Platform for digital servitisation: A framework integrating platform leverage practices and cloud HBWM-TOPSIS approach. Int. J. Prod. Res. 2021, 1–23. [Google Scholar] [CrossRef]
  37. Eloranta, V.; Turunen, T. Platforms in service-driven manufacturing: Leveraging complexity by connecting, sharing, and integrating. Ind. Mark. Manag. 2016, 55, 178–186. [Google Scholar] [CrossRef]
  38. Gawer, A. Digital platforms’ boundaries: The interplay of firm scope, platform sides, and digital interfaces. Long Range Plan. 2021, 54, 102045. [Google Scholar] [CrossRef]
  39. Kretschmer, T.; Leiponen, A.; Schilling, M.; Vasudeva, G. Platform ecosystems as meta-organizations: Implications for platform strategies. Strateg. Manag. J. 2021, 1–20. Available online: https://onlinelibrary.wiley.com/doi/10.1002/smj.3250 (accessed on 1 January 2022). [CrossRef]
  40. Office of Ministry of Industry and Information Technology of the People’s Republic of China. List of Cross-Industry and Cross-Domain Industrial Internet Platforms in 2022 (China). Available online: https://www.miit.gov.cn/zwgk/zcwj/wjfb/tz/art/2022/art_56f15b21b6014c2b889e9fa19e371257.html (accessed on 24 May 2022).
  41. Zhang, X.; Ming, X.; Bao, Y.; Liao, X. Industrial Internet Platform (IIP) enabled Smart Product Lifecycle-Service System (SPLSS) for manufacturing model transformation: From an industrial practice survey. Adv. Eng. Inform. 2022, 52, 101633. [Google Scholar] [CrossRef]
  42. Wang, J.; Meng, Z.; Gao, D.; Feng, L. Construction of an Integrated Framework for Complex Product Design Manufacturing and Service Based on Reliability Data. Machines 2022, 10, 555. [Google Scholar] [CrossRef]
  43. Mourtzis, D.; Vlachou, A.; Zogopoulos, V. Cloud-Based Augmented Reality Remote Maintenance Through Shop-Floor Monitoring: A Product-Service System Approach. J. Manuf. Sci. Eng. 2017, 139, 061011. [Google Scholar] [CrossRef]
  44. Chang, F.; Zhou, G.; Xiao, X.; Tian, C.; Zhang, C. A function availability-based integrated product-service network model for high-end manufacturing equipment. Comput. Ind. Eng. 2018, 126, 302–316. [Google Scholar] [CrossRef]
  45. Zhang, X.; Ming, X.; Bao, Y.; Liao, X.; Miao, R. Networking-enabled product service system (N-PSS) in collaborative manufacturing platform for mass personalization model. Comput. Ind. Eng. 2021, 163, 107805. [Google Scholar] [CrossRef]
  46. Chang, F.; Zhou, G.; Zhang, C.; Ding, K.; Cheng, W.; Chang, F. A maintenance decision-making oriented collaborative cross-organization knowledge sharing blockchain network for complex multi-component systems. J. Clean. Prod. 2021, 282, 124541. [Google Scholar] [CrossRef]
  47. Kohtamäki, M.; Parida, V.; Oghazi, P.; Gebauer, H.; Baines, T. Digital servitization business models in ecosystems: A theory of the firm. J. Bus. Res. 2019, 104, 380–392. [Google Scholar] [CrossRef]
  48. Cheng, S.; Azarian, M.H.; Pecht, M.G. Sensor Systems for Prognostics and Health Management. Sensors 2010, 10, 5774–5797. [Google Scholar] [CrossRef] [Green Version]
  49. Li, T.; Si, X.; Pei, H.; Sun, L. Data-model interactive prognosis for multi-sensor monitored stochastic degrading devices. Mech. Syst. Signal Process. 2021, 167, 108526. [Google Scholar] [CrossRef]
  50. Liu, K.; Huang, S. Integration of Data Fusion Methodology and Degradation Modeling Process to Improve Prognostics. IEEE Trans. Autom. Sci. Eng. 2014, 13, 344–354. [Google Scholar] [CrossRef]
  51. Fang, X.; Paynabar, K.; Gebraeel, N. Multistream sensor fusion-based prognostics model for systems with single failure modes. Reliab. Eng. Syst. Saf. 2017, 159, 322–331. [Google Scholar] [CrossRef] [Green Version]
  52. Sim, J.; Kim, S.; Park, H.J.; Choi, J.-H. A Tutorial for Feature Engineering in the Prognostics and Health Management of Gears and Bearings. Appl. Sci. 2020, 10, 5639. [Google Scholar] [CrossRef]
  53. Tian, J.; Morillo, C.; Azarian, M.H.; Pecht, M. Motor Bearing Fault Detection Using Spectral Kurtosis-Based Feature Extraction Coupled With K-Nearest Neighbor Distance Analysis. IEEE Trans. Ind. Electron. 2015, 63, 1793–1803. [Google Scholar] [CrossRef]
  54. Oh, H.; Jung, J.H.; Jeon, B.C.; Youn, B.D. Scalable and Unsupervised Feature Engineering Using Vibration-Imaging and Deep Learning for Rotor System Diagnosis. IEEE Trans. Ind. Electron. 2018, 65, 3539–3549. [Google Scholar] [CrossRef]
  55. Zhu, Y.; Wu, J.; Wu, J.; Liu, S. Dimensionality reduce-based for remaining useful life prediction of machining tools with multisensor fusion. Reliab. Eng. Syst. Saf. 2021, 218, 108179. [Google Scholar] [CrossRef]
  56. Wang, D.; Peng, Z.; Xi, L. The sum of weighted normalized square envelope: A unified framework for kurtosis, negative entropy, Gini index and smoothness index for machine health monitoring. Mech. Syst. Signal Process. 2020, 140, 106725. [Google Scholar] [CrossRef]
  57. Hou, B.; Wang, D.; Wang, Y.; Yan, T.; Peng, Z.; Tsui, K.-L. Adaptive Weighted Signal Preprocessing Technique for Machine Health Monitoring. IEEE Trans. Instrum. Meas. 2020, 70, 1–11. [Google Scholar] [CrossRef]
  58. Fang, X.; Zhou, R.; Gebraeel, N. An adaptive functional regression-based prognostic model for applications with missing data. Reliab. Eng. Syst. Saf. 2015, 133, 266–274. [Google Scholar] [CrossRef]
  59. Liu, R.; Yang, B.; Zio, E.; Chen, X. Artificial intelligence for fault diagnosis of rotating machinery: A review. Mech. Syst. Signal Process. 2018, 108, 33–47. [Google Scholar] [CrossRef]
  60. Wang, D.; Chen, Y.; Shen, C.; Zhong, J.; Peng, Z.; Li, C. Fully interpretable neural network for locating resonance frequency bands for machine condition monitoring. Mech. Syst. Signal Process. 2021, 168, 108673. [Google Scholar] [CrossRef]
  61. Huang, T.; Zhang, Q.; Tang, X.; Zhao, S.; Lu, X. A novel fault diagnosis method based on CNN and LSTM and its application in fault diagnosis for complex systems. Artif. Intell. Rev. 2021, 55, 1289–1315. [Google Scholar] [CrossRef]
  62. Jia, F.; Lei, Y.; Lin, J.; Zhou, X.; Lu, N. Deep neural networks: A promising tool for fault characteristic mining and intelligent diagnosis of rotating machinery with massive data. Mech. Syst. Signal Process. 2016, 72–73, 303–315. [Google Scholar] [CrossRef]
  63. Li, Q.; Chen, L.; Shen, C.; Yang, B.; Zhu, Z. Enhanced generative adversarial networks for fault diagnosis of rotating machinery with imbalanced data. Meas. Sci. Technol. 2019, 30, 115005. [Google Scholar] [CrossRef]
  64. Wang, J.; Mo, Z.; Zhang, H.; Miao, Q. Ensemble diagnosis method based on transfer learning and incremental learning towards mechanical big data. Measurement 2020, 155, 107517. [Google Scholar] [CrossRef]
  65. Zhang, S.; Sun, Z.; Wang, M.; Long, J.; Bai, Y.; Li, C. Deep Fuzzy Echo State Networks for Machinery Fault Diagnosis. IEEE Trans. Fuzzy Syst. 2019, 28, 1205–1218. [Google Scholar] [CrossRef]
  66. Chen, Z.; Xu, J.; Peng, T.; Yang, C. Graph Convolutional Network-Based Method for Fault Diagnosis Using a Hybrid of Measurement and Prior Knowledge. IEEE Trans. Cybern. 2021, 52, 1–13. [Google Scholar] [CrossRef]
  67. Zheng, R.; Najafi, S.; Zhang, Y. A recursive method for the health assessment of systems using the proportional hazards model. Reliab. Eng. Syst. Saf. 2022, 221, 108379. [Google Scholar] [CrossRef]
  68. Aremu, O.O.; Hyland-Wood, D.; McAree, P.R. A Relative Entropy Weibull-SAX framework for health indices construction and health stage division in degradation modeling of multivariate time series asset data. Adv. Eng. Inform. 2019, 40, 121–134. [Google Scholar] [CrossRef]
  69. Hu, C.-H.; Pei, H.; Si, X.-S.; Du, D.-B.; Pang, Z.-N.; Wang, X. A Prognostic Model Based on DBN and Diffusion Process for Degrading Bearing. IEEE Trans. Ind. Electron. 2019, 67, 8767–8777. [Google Scholar] [CrossRef]
  70. Zhang, Y.; Xin, Y.; Liu, Z.-W.; Chi, M.; Ma, G. Health status assessment and remaining useful life prediction of aero-engine based on BiGRU and MMoE. Reliab. Eng. Syst. Saf. 2022, 220, 108263. [Google Scholar] [CrossRef]
  71. Chang, Y.; Chen, J.; Liu, Y.; Xu, E.; He, S. Temporal convolution-based sorting feature repeat-explore network combining with multi-band information for remaining useful life estimation of equipment. Knowl.-Based Syst. 2022, 249, 108958. [Google Scholar] [CrossRef]
  72. Yang, X.; Zheng, Y.; Zhang, Y.; Wong, D.S.-H.; Yang, W. Bearing Remaining Useful Life Prediction Based on Regression Shapalet and Graph Neural Network. IEEE Trans. Instrum. Meas. 2022, 71, 1–12. [Google Scholar] [CrossRef]
  73. Chao, M.A.; Kulkarni, C.; Goebel, K.; Fink, O. Fusing physics-based and deep learning models for prognostics. Reliab. Eng. Syst. Saf. 2021, 217, 107961. [Google Scholar] [CrossRef]
  74. Zhang, W.; Li, X.; Ma, H.; Luo, Z.; Li, X. Transfer learning using deep representation regularization in remaining useful life prediction across operating conditions. Reliab. Eng. Syst. Saf. 2021, 211, 107556. [Google Scholar] [CrossRef]
  75. Fan, Y.; Nowaczyk, S.; Rögnvaldsson, T. Transfer learning for remaining useful life prediction based on consensus self-organizing models. Reliab. Eng. Syst. Saf. 2020, 203, 107098. [Google Scholar] [CrossRef]
  76. Mauthe, F.; Hagmeyer, S.; Zeiler, P. Creation of Publicly Available Data Sets for Prognostics and Diagnostics Addressing Data Scenarios Relevant to Industrial Applications. Int. J. Progn. Health Manag. 2021, 12. [Google Scholar] [CrossRef]
  77. Qu, Y.; Hou, Z. Degradation principle of machines influenced by maintenance. J. Intell. Manuf. 2021, 33, 1521–1530. [Google Scholar] [CrossRef]
  78. Luo, C.; Shen, L.; Xu, A. Modelling and estimation of system reliability under dynamic operating environments and lifetime ordering constraints. Reliab. Eng. Syst. Saf. 2021, 218, 108136. [Google Scholar] [CrossRef]
  79. Song, Y.; Mi, J.; Cheng, Y.; Bai, L.; Chen, K. A dependency bounds analysis method for reliability assessment of complex system with hybrid uncertainty. Reliab. Eng. Syst. Saf. 2020, 204, 107119. [Google Scholar] [CrossRef]
  80. Compare, M.; Antonello, F.; Pinciroli, L.; Zio, E. A general model for life-cycle cost analysis of Condition-Based Maintenance enabled by PHM capabilities. Reliab. Eng. Syst. Saf. 2022, 224, 108499. [Google Scholar] [CrossRef]
  81. Ding, S.-H.; Kamaruddin, S. Maintenance policy optimization—Literature review and directions. Int. J. Adv. Manuf. Technol. 2014, 76, 1263–1283. [Google Scholar] [CrossRef]
  82. Cavalcante, C.A.; Lopes, R.S.; Scarf, P.A. Inspection and replacement policy with a fixed periodic schedule. Reliab. Eng. Syst. Saf. 2020, 208, 107402. [Google Scholar] [CrossRef]
  83. Xia, T.; Si, G.; Wang, D.; Pan, E.; Xi, L. Progressive Opportunistic Maintenance Policies for Service-Outsourcing Network With Prognostic Updating and Dynamical Optimization. IEEE Trans. Reliab. 2021, 71, 1340–1354. [Google Scholar] [CrossRef]
  84. Xia, T.; Sun, B.; Chen, Z.; Pan, E.; Wang, H.; Xi, L. Opportunistic maintenance policy integrating leasing profit and capacity balancing for serial-parallel leased systems. Reliab. Eng. Syst. Saf. 2021, 205, 107233. [Google Scholar] [CrossRef]
  85. Jafar-Zanjani, H.; Zandieh, M.; Sharifi, M. Robust and resilient joint periodic maintenance planning and scheduling in a multi-factory network under uncertainty: A case study. Reliab. Eng. Syst. Saf. 2021, 217, 108113. [Google Scholar] [CrossRef]
  86. Nguyen, K.-A.; Do, P.; Grall, A. Joint predictive maintenance and inventory strategy for multi-component systems using Birnbaum’s structural importance. Reliab. Eng. Syst. Saf. 2017, 168, 249–261. [Google Scholar] [CrossRef]
  87. Qin, Y.; Zhang, J.; Chan, F.T.; Chung, S.; Niu, B.; Qu, T. A two-stage optimization approach for aircraft hangar maintenance planning and staff assignment problems under MRO outsourcing mode. Comput. Ind. Eng. 2020, 146, 106607. [Google Scholar] [CrossRef]
  88. Sanchez-Londono, D.; Barbieri, G.; Fumagalli, L. Smart retrofitting in maintenance: A systematic literature review. J. Intell. Manuf. 2022, 1–19. [Google Scholar] [CrossRef]
  89. Wang, C.; Guo, R.; Yu, H.; Hu, Y.; Liu, C.; Deng, C. Task offloading in cloud-edge collaboration-based cyber physical machine tool. Robot. Comput. Manuf. 2023, 79, 102439. [Google Scholar] [CrossRef]
  90. Calabrese, F.; Regattieri, A.; Bortolini, M.; Gamberi, M.; Pilati, F. Predictive Maintenance: A Novel Framework for a Data-Driven, Semi-Supervised, and Partially Online Prognostic Health Management Application in Industries. Appl. Sci. 2021, 11, 3380. [Google Scholar] [CrossRef]
  91. Tao, F.; Zhang, M.; Liu, Y.; Nee, A.Y.C. Digital twin driven prognostics and health management for complex equipment. CIRP Ann. 2018, 67, 169–172. [Google Scholar] [CrossRef]
  92. Savolainen, J.; Urbani, M. Maintenance optimization for a multi-unit system with digital twin simulation. J. Intell. Manuf. 2021, 32, 1953–1973. [Google Scholar] [CrossRef]
  93. Vichare, N.; Pecht, M. Prognostics and health management of electronics. IEEE Trans. Compon. Packag. Technol. 2006, 29, 222–229. [Google Scholar] [CrossRef]
  94. Baroroh, D.K.; Chu, C.-H.; Wang, L. Systematic literature review on augmented reality in smart manufacturing: Collaboration between human and computational intelligence. J. Manuf. Syst. 2020, 61, 696–711. [Google Scholar] [CrossRef]
  95. Kafiabad, S.T.; Zanjani, M.K.; Nourelfath, M. Robust collaborative maintenance logistics network design and planning. Int. J. Prod. Econ. 2021, 244, 108370. [Google Scholar] [CrossRef]
  96. Fan, D.; Lin, J.; Cai, B.; Liu, B. Robustness of maintenance support service networks: Attributes, evaluation and improvement. Reliab. Eng. Syst. Saf. 2021, 210, 107526. [Google Scholar] [CrossRef]
  97. Zhang, K.; Xia, T.; Wang, D.; Chen, G.; Pan, E.; Xi, L. Privacy-preserving and sensor-fused framework for prognostic & health management in leased manufacturing system. Mech. Syst. Signal Process. 2023, 184, 109666. [Google Scholar] [CrossRef]
  98. Martowicz, A.; Uhl, T. Reliability- and performance-based robust design optimization of MEMS structures considering technological uncertainties. Mech. Syst. Signal Process. 2012, 32, 44–58. [Google Scholar] [CrossRef]
  99. Mourtzis, D.; Angelopoulos, J.; Panopoulos, N. Equipment Design Optimization Based on Digital Twin Under the Framework of Zero-Defect Manufacturing. Procedia Comput. Sci. 2021, 180, 525–533. [Google Scholar] [CrossRef]
  100. Tong, X.; Liu, Q.; Pi, S.; Xiao, Y. Real-time machining data application and service based on IMT digital twin. J. Intell. Manuf. 2019, 31, 1113–1132. [Google Scholar] [CrossRef]
  101. Wang, W.; He, Y.; Liao, R.; Cai, Y.; Zheng, X.; Zhao, Y. Mission reliability driven functional healthy state modeling approach considering production rhythm and workpiece quality for manufacturing systems. Reliab. Eng. Syst. Saf. 2022, 226, 108682. [Google Scholar] [CrossRef]
  102. Colledani, M.; Yemane, A. Impact of Machine Reliability Data Uncertainty on the Design and Operation of Manufacturing Systems. Procedia CIRP 2013, 7, 557–562. [Google Scholar] [CrossRef]
  103. Li, H.; Palau, A.S.; Parlikad, A.K. A social network of collaborating industrial assets. Proc. Inst. Mech. Eng. Part O J. Risk Reliab. 2018, 232, 389–400. [Google Scholar] [CrossRef]
  104. Palau, A.S.; Liang, Z.; Lütgehetmann, D.; Parlikad, A.K. Collaborative prognostics in Social Asset Networks. Future Gener. Comput. Syst. 2019, 92, 987–995. [Google Scholar] [CrossRef] [Green Version]
  105. Zhu, S.-P.; Huang, H.-Z.; Peng, W.; Wang, H.-K.; Mahadevan, S. Probabilistic Physics of Failure-based framework for fatigue life prediction of aircraft gas turbine discs under uncertainty. Reliab. Eng. Syst. Saf. 2016, 146, 1–12. [Google Scholar] [CrossRef]
  106. Wang, F.Y.; Wang, X.; Li, L.; Li, L. Steps toward parallel intelligence. IEEE/CAA J. Autom. Sin. 2016, 3, 345–348. [Google Scholar]
  107. Chen, Z.; Lu, M.; Ming, X.; Zhang, X.; Zhou, T. Explore and evaluate innovative value propositions for smart product service system: A novel graphics-based rough-fuzzy DEMATEL method. J. Clean. Prod. 2019, 243, 118672. [Google Scholar] [CrossRef]
  108. Kutlu, A.C.; Ekmekçioğlu, M. Fuzzy failure modes and effects analysis by using fuzzy TOPSIS-based fuzzy AHP. Expert Syst. Appl. 2012, 39, 61–67. [Google Scholar] [CrossRef]
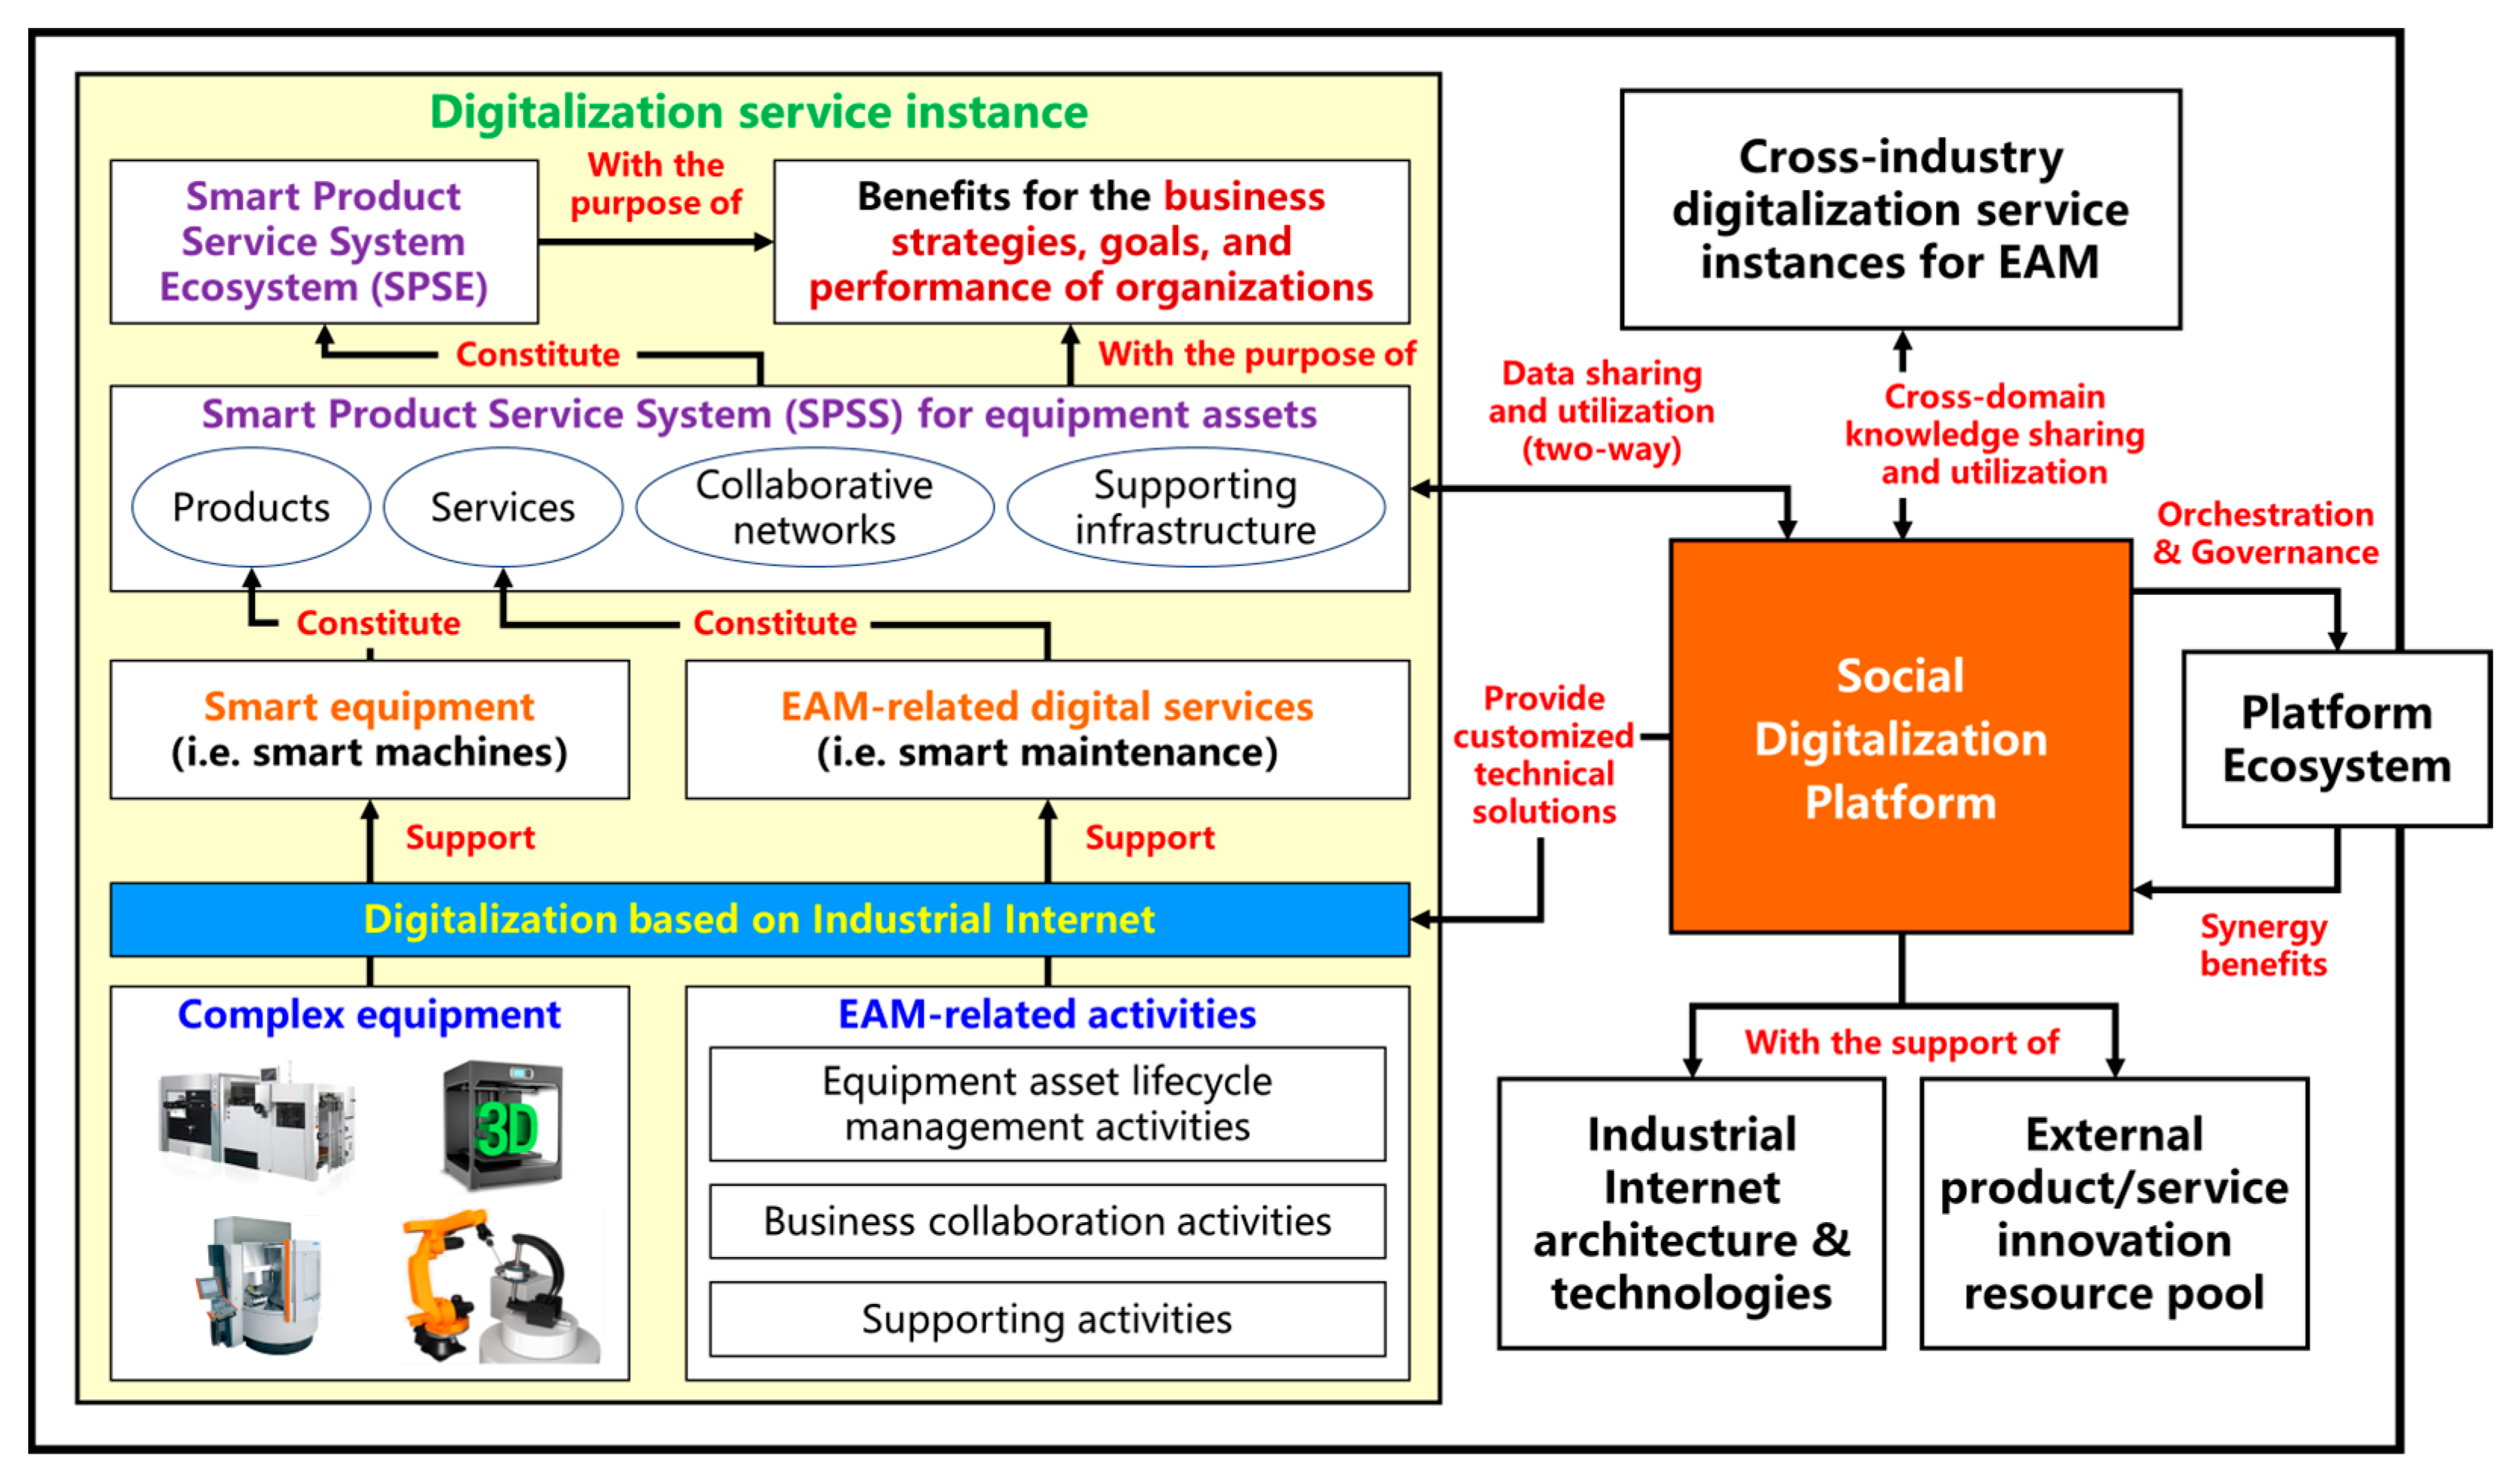
Figure 1. The relationship between Industrial Internet, EAM, SPSS, and SDP.
Machines 10 01137 g001
Figure 2. The system model for the research of I3EAM.
Machines 10 01137 g002
Figure 3. A general reference model of I3EAM in social digitalization platform.
Machines 10 01137 g003
Figure 4. A general reference architecture of the implementation path for I3EAM in SPD.
Machines 10 01137 g004
Figure 5. Industrial resource and edge layer.
Machines 10 01137 g005
Figure 6. Industrial cloud platform layer.
Machines 10 01137 g006
Figure 7. Industrial big data government and service layer.
Machines 10 01137 g007
Figure 8. Industrial modeling and simulation layer.
Machines 10 01137 g008
Figure 9. Industrial organization, business, and service layer.
Machines 10 01137 g009
Figure 10. Reference model of I3EAM schemes in automated container terminals.
Machines 10 01137 g010
Figure 11. Reference architecture for the I3EAM implementation in automated container terminals.
Machines 10 01137 g011
Table 1. Literature review of advanced Industrial Internet technologies for EAM.
CategoryThe State-of-the-Art TechnologiesFuture Direction
Data acquisition
  • Sensing technologies (13 types usually): vibration, temperature, current, pressure, infrared, gas, sound, strain, position, torque, image, video, laser, etc., [48];
  • Informative sensor identification technologies [49];
  • Multi-sensor fusion technologies [50,51].
Wireless transmission, large-scale low-cost access, intelligent edge acquisition, and multi-modal information fusion
Signal processing
  • Feature extraction methods: many signal features have been proposed, especially for the vibration signal for critical structural components (such as gear and bearing) [52], including the time domain, frequency domain, and time-frequency domain features [53,54];
  • Main technologies: including methods for data of redundancy [55], sparsity [56,57], and deficiency [58].
Interpretable physical linkage of signal processing and feature extraction [56]
Fault diagnosis
  • Main research flow: fault diagnosis based on the historical data, fault diagnosis based on the physical model, and data-driven fault diagnosis;
  • Main technologies: the threshold and physical model approaches for time-sensitive scenarios [56,57], and a wide variety of deep and shallow neural networks for more robust learning and higher accuracy [59,60], including the CNN [61], DNN [62], GAN [63], transfer learning [64], deep echo state network [65], and GNN ones [66], etc.
Convergence of physics, data, and expert experience for higher accuracy of pattern recognition [60,66]
Health assessment
  • Main research flow: performance degradation assessment, health index (HI) construction, and residual useful life (RUL) prediction of machines;
  • Main technologies: monitoring initial failure time [56] and constructing health indices by multi-sensing signal fusion [50,67], residual useful life (RUL) prediction based on physical models [68], machine learning, deep learning (DBN [69], GRU [70], TCN [71], and GNN [72], etc.), and fusion models [73], and transfer learning for RUL prediction with data from similar objects [74], simulation [75], or scaling models.
Powerful public data sets [76], cross-scenario adaptive learning methods, and health assessment with consideration of multiple maintenance influences [77]
Maintenance
decision-making
  • Main maintenance modes: condition-based maintenance, preventive maintenance, predictive maintenance, cognitive maintenance;
  • Main maintenance decision-making problems: the main research problems include ageing probabilistic risk/safety assessment [78,79], cost estimation [80], maintenance policy selection and optimization [81,82,83], maintenance outsourcing and leased manufacturing [84,85], spare parts management [86], multi-skilled staffing and scheduling (resource dynamic allocation) [87], overhaul and retrofitting decision-making for critical, complex equipment [88], etc.;
  • Main methods and technologies: stochastic model, Markov process modelling, Bayesian network, probabilistic relational model, multi-criteria decision-making (MCDM) methods, mathematical programming model, D-S theory, evolutionary algorithms for NP-hard problems.
Joint optimization for effective equipment maintenance in the integrated environment with multi-component systems [86], multi-state systems, and multi-layer systems [78]
Remote monitoring
and co-maintenance
  • Edge-cloud collaboration technologies: task offloading for time-sensitive PHM scenarios [89], online PHM with incremental learning [90];
  • Digital-twin-based technologies: digital-twin-driven PHM approach [91], digital twin-driven cooperative awareness and interconnection framework for total factors of maintenance decision-making environment [6], DT-based equipment lifecycle management [4], DT-based maintenance cost joint optimization [92];
  • AR/VR-based technologies: smart asset management functions (monitoring, recognition, positioning, classification, instruction, prognosis, optimization, and their combinations) and human–machine collaboration [93,94].
Real-time synchronization, multi-discipline, multi-scale, faithful mapping, and high-fidelity modelling for complex equipment and maintenance decision-making environment [6]
Service network setting
and optimization
  • Maintenance network design and planning [95];
  • Service network modelling [44];
  • Robustness of maintenance service networks and adaptive mechanisms [96].
Technology-driven business model innovation for data sharing and utilization [97]
Knowledge sharing and privacy preservation
  • Maintenance decision making oriented cross-organization knowledge sharing blockchain network [46];
  • Privacy-preserving PHM framework [97].
Equipment optimization
driven by reliability data
  • Reliability data for equipment lifecycle [42], equipment design [98,99], and others [100].
Joint optimization model and algorithm design which is driven by various collaborative scenarios, missions and utility goals [101]
Business optimization
driven by reliability data
  • Uncertainty modelling and business optimization [102];
  • Mission reliability-driven functional healthy state modelling [101];
  • Social network of collaborating industrial assets [103];
  • Collaborative prognostics in social asset networks [104].
Table 2. A brief overview of typical Industrial Internet solutions and applications for EAM.
Name of the Industrial Internet PlatformTechnical Framework and Its CharactersIndustrial Application
Siemens MindSphere
  • Cloud-based Open IoT Architecture: including three main layers: MindConnect, MindCloud, and MindApps;
  • Edge-cloud collaboration, digital twin, and low-code industrial service development capabilities;
  • Abundant common application components for Equipment Asset Management.
Aerospace and defense, automotive and transportation, electronics and semiconductors, heavy equipment, and industrial machinery, etc.
GE Predix
  • Asset Performance Management (APM) Software: featuring Digital Twin analytics, work process automation and built-in GE industry expertise.
Energy, paper and pulp, chemical, mining and metallurgy, and fertilizer, etc.
Microsoft Azure
  • Secured reliable computing and industrial IoT solutions (from chip to cloud);
  • Powerful machine learning capabilities, edge intelligence solutions, and software ecosystems.
Transportation and logistics, industrial robot, casting, elevator, and food and drink industry, etc.
SANY ROOTCLOUD
  • Powerful connectivity (supporting 1100+ common industrial protocols and protocols customization);
  • Powerful modelling capacity (multi-level nested models for equipment: abstract thing model, thing model, basic elements of thing model, thing instances);
  • Mature business model of product service system.
Industrial machinery, discrete manufacturing, steel and non-ferrous metal, chemical, and mining industry, etc.
CASICCloud INDICS
  • INDCIS + CMSS: Industrial Internet social platform + Cloud manufacturing support systems;
  • Supporting 21 types of scenarios of equipment data collection, including machining, welding, and simulation, etc.;
  • Safe, autonomous and controllable.
Aerospace, electronics, machinery, and automotive industry, etc.
You-Ye Thingswise iDOS
  • A unified and loosely coupled system architecture and reuse of general technology components;
  • Powerful industrial mechanism modeling capacity.
Process manufacturing industries including energy, metallurgy, and material processing, etc.
Table 3. Performance metric set for I3EAM scheme.
First-Grade
Indicator
Second-Grade
Indicator
Explanation of the Indicator
Basic
platform
service
attribute
(B)
B1: Talent
guarantee
Whether the platform constructor has the necessary industry technology and IT technology capabilities;
The number of professionals engaged in the platform construction and operation;
The coverage of the professionals’ fields (knowledge and skills for ICT, specific industrial fields, and platform ecology construction &and operation).
B2: System
Security guarantee
Whether a management system of information security has been built, and whether the hidden dangers can be controlled;
Whether effective countermeasures of information security have been constructed;
The adoption of technologies for networking security, data security, and industrial access security, etc.
B3: Cost of
digitalization service
The level of the total cost for the implementation of I3EAM.
Technical
capability
for I3EAM
(T)
T1: IT resource management capabilityThe comprehensive performance of IT infrastructure resources (including computing, storage, and network), and the capabilities of cloud-based management and scheduling of IT resources.
T2: Industrial equipment adaptation capabilityThe capability of connection of heterogenous equipment asset resources (including type, sensing scheme, gateway, protocol, and cloud-edge collaboration scheme).
T3: Industrial big data
engine
performance
The comprehensive performance of industrial big data engine (including data acquisition, data processing, and data service and portal).
T4: Industrial modeling and simulation service
capability
The capability of modeling and simulation for Equipment Asset Management (including intelligent algorithms, industrial mechanism models, industrial domain knowledge, digital twins schemes, and human–machine interactions).
T5: Microservice development and
government capability
The application level of microservice technical architecture, including capability maturity for microservice development and governance, the number and type of the EAM-related microservice, and the coverage of the needs of I3EAM.
T6:
Development environment supporting
The potential for custom development, secondary development and ongoing development of the microservices and industrial APPs (including cost of learning, low-code scheme, the friendliness level of user interfaces, and development toolchain).
T7: Scheme
technical
architecture
performance
The comprehensive performance of the technical architecture for I3EAM, namely the combination and integration scheme of the platform basic services, EAM-related microservices and industrial APPs.
T8: System
integration and
collaboration
capability
The level of compatibility and interoperability with enterprise information systems, the degree of standardization of information models, and the capability of middleware services.
Value of platform application and
ecology synergy
(A)
A1: Platform scale and
activity
The platform scale and activity, including the user scale, user activity, developer scale, developer activity, service provider scale, service provider category, and service provider capability level.
A2: Platform
application
value
The application level of the platform (including the number and type of long-term served industries, and the number and type of long-term served industrial scenarios related to EAM).
A3: Open and sharing mechanismWhether the platform has the mechanisms and tools for data and knowledge sharing and utilization across the various users and fields.
A4: Platform ecology valueThe ecology synergy effect of the platform (including the synergy effect in group company, global company, value chain, industry chain, and platform ecosystem).
Table 4. Membership function of linguistic scale.
Fuzzy NumberLinguistic (Abbreviation)Scale of Fuzzy Number
4Extremely high influence (EH)(3.5,4,4)
3Very high influence (VH)(2.5,3,3.5)
2High influence (H)(1.5,2,2.5)
1Low influence (L)(0.5,1,1.5)
0.5Very low influence (VL)(0.5,0.5,1)
0No influence (N)(0,0,0)
Table 5. The importance and normalized weights of performance indicators of I3EAM.
Indicators ω i W i
B12.4254 0.0746
B21.0255 0.0315
B32.8756 0.0884
T11.8564 0.0571
T21.8314 0.0563
T33.5128 0.1080
T43.8550 0.1185
T51.5719 0.0483
T62.4328 0.0748
T72.5513 0.0784
T82.9460 0.0906
A11.6440 0.0505
A21.9866 0.0611
A30.9139 0.0281
A41.1009 0.0338
Table 6. The fuzzy positive-ideal solution (FPIS) and fuzzy negative-ideal solution (FNIS).
IndicatorsFPISFNIS
B1(0.0443, 0.0629, 0.0722)(0.0117, 0.0280, 0.0466)
B2(0.0099, 0.0177, 0.0246)(0.0039, 0.0118, 0.0197)
B3(0.0497, 0.0718, 0.0884)(0.0000, 0.0221, 0.0442)
T1(0.0428, 0.0571, 0.0571)(0.0161, 0.0303, 0.0446)
T2(0.0281, 0.0422, 0.0563)(0.0088, 0.0229, 0.0369)
T3(0.0776, 0.1046, 0.1080)(0.0337, 0.0607, 0.0877)
T4(0.0741, 0.1037, 0.1185)(0.0222, 0.0518, 0.0815)
T5(0.0076, 0.0196, 0.0317)(0.0015, 0.0060, 0.0181)
T6(0.0374, 0.0561, 0.0678)(0.0000, 0.0187, 0.0374)
T7(0.0515, 0.0711, 0.0784)(0.0147, 0.0343, 0.0539)
T8(0.0566, 0.0792, 0.0906)(0.0255, 0.0481, 0.0708)
A1(0.0221, 0.0347, 0.0474)(0.0063, 0.0190, 0.0316)
A2(0.0382, 0.0534, 0.0611)(0.0057, 0.0210, 0.0363)
A3(0.0114, 0.0184, 0.0255)(0.0000, 0.0061, 0.0132)
A4(0.0212, 0.0296, 0.0338)(0.0000, 0.0042, 0.0127)
Table 7. The closeness coefficients and the priority of alternatives.
Alternatives D i + D i C C i Sorting
P 1 0.04940.09690.33764
P 2 0.06680.07920.45742
P 3 0.09410.04420.68021
P 4 0.07000.08370.45533
Publisher’s Note: MDPI stays neutral with regard to jurisdictional claims in published maps and institutional affiliations.