Abstract
Fault diagnosis plays an important role in the safe and stable operation of rotating machinery, which is conducive to industrial development and economic improvement. However, effective feature extraction of rotating machinery fault diagnosis is difficult in the complex sound field with characteristics of reverberation and multi-dimensional signals. Therefore, this paper proposes a novel acoustic feature extraction method of the rotating machinery based on the Weighted Prediction Error (WPE) integrating the Linear Constrained Minimum Variance (LCMV). The de-reverberation signal is obtained by inputting multi-channel signals into the WPE algorithm using an adaptive optimal parameters selection function with the sound field changes. Then, the incident angle going from the fault source to the center of the microphone array is calculated from the full-band sound field distribution, and the signal is de-noised and fused using the LCMV. Finally, the fault feature frequency is extracted from the fused signal envelope spectrum. The results of fault data analysis of the centrifugal pump test bench show that the Envelope Harmonic Noise Ratio (EHNR) is more than twice that of the original signal after the WPE-LCMV processing. Compared to the Recursive Least Squares and the Resonance Sparse Signal Decomposition (RLS-RSSD) and the parameter optimized Variational Mode Decomposition (VMD), the EHNR has a higher value for all types of faults after applying the WPE-LCMV processing. Furthermore, the proposed method can effectively extract the frequency of bearing faults.
1. Introduction
Rotating machinery is widely used in all kinds of engineering domains. Whenever its key components fail, this will directly affect the safe operation of the entire system. Therefore, the fault diagnosis of rotating machinery is of great significance [1,2,3]. At present, the feature extraction of rotating machinery fault diagnosis mainly focuses on vibration sensors [4]. Vibration analysis has an advance theory and measurement techniques, and it also has reliable diagnostic results. This contact measurement method is not applicable when high temperature and high corrosion scenes are present whereas the acoustic signal has the advantages of contactless measurement and its monitoring range can reach some dozens of meters [5,6]. Compared to vibration analysis, the fault acoustic signal is weak due to the complex signal composition and transmission paths, which makes it difficult to extract fault features. Thus, it is necessary to develop a rotating machinery fault feature extraction method based on the acoustic signal in a complex sound field environment yielding severe background noise and reverberation, where the Signal–Noise Ratio (SNR) is less than 0.
In recent years, several scholars have made achievements in the field of rotating machinery fault feature extraction based on the acoustic signal. Zhou et al., 2022 [7] proposed a parameter-optimized Variational Mode Decomposition (VMD) to enhance the fault acoustic signal. This method does not consider the impact of reverberation on feature extraction, and its effect is poor when the reverberation is serious. Wang et al., 2009 [8] proposed an improved blind deconvolution de-reverberation method using the envelope spectrum and a normalized kurtosis to offer a better diagnostic effect only when there is less noise. However, the de-reverberation effect is poor and the accurate diagnosis rate of remains low under complex sound conditions. Yu et al., 2020 [9] proposed a rolling bearing fault diagnosis method based on the Resonance Sparse Signal Decomposition (RSSD) and sub-band enhancement. Feature extraction is challenging in an environment with significant noise and reverberation because several parameters must be adjusted in accordance with the real sound field. A combination method of the Recursive Least Squares (RLS) with the RSSD was proposed to process a bearing acoustic signal was proposed (2022) [10]. The effect of fault feature extraction was improved after de-reverberation by the RLS. However, when a complex sound field environment is present, the RLS solution becomes unstable and a poor de-reverberation effect will be observed. A single-channel acoustic signal is used by the above three methods including the envelope spectrum and a normalized kurtosis, the RSSD and the sub-band enhancement and RLS-RSSD for fault diagnosis, and the signal received by a single microphone is superimposed by multiple sound sources and environmental noise. However, it is difficult to separate reverberation, noise, and each sound source although reverberation is an important factor affecting the result of fault feature extraction. To reduce the influence of reverberation, Bharathi et al., 2018 [11] proposed a multi-channel empirical mode maximum likelihood signal enhancement method that relied greatly on the existing data, which had a poor de-reverberation effect in complex sound fields. In addition, Huang et al., 2020 [12] proposed a method of differential beamforming to remove additive noise that is better, but the effect of reverberation on the convolution noise is worse. To sum up, the above methods have the problems of poor de-reverberation effect and insufficient utilization of multi-channel information, which makes it difficult to extract fault features.
The Weighted Prediction Error (WPE) algorithm is a blind deconvolution method, and the signal of the past L frames is used to predict the late reverberation signal of the delayed frames and then subtracts the late reverberation from the collected signal to obtain the target signal. The principle of prediction reverberation using the WPE is shown in Figure 1, which has achieved good behavior in the speech processing [13]. Ikeshita et al., 2021 [14] proposed a fast blind source speech separation method based on the WPE algorithm and the independent vector extraction to suppress reverberation effectively. Nakatani et al., 2019 [15] proposed a speech enhancement method using a weighted power minimization distortion-less response beamformer, which can achieve good results in the WPE de-reverberation, the main key to assure good results in the Minimum Variance Distortion-less Response (MVDR) algorithm relies on the determination of the central frequency band. However, it is difficult to accurately solve the central frequency band of the rotating machinery sound field.
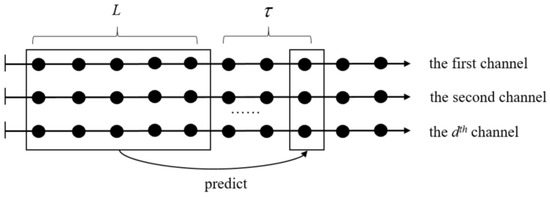
Figure 1.
The principle of predicting the late reverberation using WPE.
Where L is the prediction filter taps, is the delay coefficient, and d is the number of microphones.
The Linear Constrained Minimum Variance (LCMV) method can enhance the signal in the target direction and minimize the influence of the interference signal in other directions [16]. Therefore, the LCMV is often used in the processing of additive signals of speech and wireless sensor networks [17,18]. Hassani et al., 2017 [19] applied the signal enhancement method of jointly distributed nodes based on the LCMV in wireless sensor networks, and achieved a good de-noising effect. Ribeiro et al., 2019 [20] proposed a separable LCMV beamformer for large antenna systems. The separable LCMV has a good effect when being simulated. However, it has not been verified in the real physical domain.
To sum up, concerning the diagnosis of rotating machinery faults in complex sound field environments, poor de-reverberation and insufficient utilization of multi-channel information still exist. Thus, this paper proposes a novel fault feature extraction method for rotating machinery combining the WPE with the LCMV (WPE-LCMV). The WPE method, which adaptively adjusts the parameters according to the change of the sound field, is used to de-reverberate through multi-channel signals. Then, the incidence angle of the fault source is calculated using the sound field distribution. Finally, the LCMV is applied to de-noise the signal and fuse it into a single-channel signal for extracting the fault feature. Compared with the RLS-RSSD and the parameter-optimized VMD, the effectiveness of the proposed method will be verified by simulating a rolling bearing fault on the centrifugal pump test bench, the Envelope Harmonic Noise Ratio (EHNR) is higher for all types of faults after the WPE-LCMV processing.
The contributions of this paper include the following:
- (1)
- In order to more effectively extract fault features in a complex sound field, a multi-channel acoustic signal enhancement method is proposed for rotating machinery based on WPE-LCMV.
- (2)
- The composition and the transmission paths of the rotating machinery acoustic signal are analyzed in detail.
- (3)
- In order to obtain signals with a more obvious impact and a higher correlation with the original signal in different sound fields, the range of kurtosis is selected as the index of parameter selection of the WPE de-reverberation algorithm.
- (4)
- The problem of calculating the incident angle in the LCMV method is solved by using the sound field distribution.
This paper is divided as follows: Section 2 presents the background study of the acoustic field model, the reverberation mechanism, the de-reverberation principle of the WPE, and the principle of the LCMV. In Section 3, the acoustic fault feature extraction method of rotating machinery based on the WPE-LCMV is proposed. The simulations and the discussion will be provided in Section 4. Finally, Section 5 shows the conclusion and some future works.
2. Background and Theory
2.1. Acoustic Field Model
The sound field model is divided into near-field and far-field models. In the far-field model, the phase is ignored, and the signal wave is a plane wave. As for the near-field model, the phase difference of the acoustic signal reaching each array element is further considered, and the signal wave is a spherical wave. The empirical formula to distinguish between the near-field and far-field models is shown in Equation (1), where the fulfillment of this equation yield is to consider the model as a near-field model, and vice versa [21,22].
where r is the distance from the microphone array to the sound source, l is the length of array, λ is the wave-length of the sound source signal, c is the wave velocity of the acoustic signal, and fr is the frequency of the acoustic signal.
2.2. Reverberation Mechanism
When far-field conditions are met, the signal, received by the microphone, is composed of the target signal, the background noise and the reverberation generated by the reflection, which is shown in Equation (3) [23]:
where s[n] is both a direct signal and a target signal, K is the number of reflections, s[n-knk] is the signal received after kth reflection and accumulation of different delays, is the early reverberation, is the late reverberation, is the reflection coefficient of the kth reflection and u(n) is the background noise.
The s[n] propagates from the fault source to the microphone sensor without any reflection. The early reverberation has a small number of reflections and attenuation, it enhances the target signal whereas the late reverberation has several reflections, a serious attenuation, and a great interference to the target signal.
If the background noise is not considered, according to the convolution characteristics of the unit impulse function , the signal received by the microphone can be obtained using Equation (4) [24,25]:
where h[n] is the Room Impulse Response (RIR).
From the mathematical model of reverberation, the RIR consists of a direct sound, and an early and a late reverberation. The received reverberation signal is regarded as the convolution of the target signal and the RIR. The principle of reverberation elimination is to reduce the influence of in the RIR.
The reverberation time (RT60) is an important parameter related to the reverberation, which refers to the time required for the sound energy density to decay by 60 dB after the sound source stops making sound. In a confined space, not only the surface absorbs sound energy, but also the air itself absorbs this energy. Moreover, the RT60 can be solved using the Sabine–Nutson equation as shown below [26,27]:
where V is the total volume of the room (measured in m3), S is the total area of the room (measured in m2), is the average sound absorption coefficient of the room surface (measured in sabin), and e is the sound energy decay constant of air (measured in 1/m).
2.3. De-Reverberation Principle of the WPE
Assuming that the parameters in the short-time Fourier transform (STFT) domain are locally modeled using the complex Gaussian distribution of the unknown variance, the complex STFT parameters of the target signal be modeled as a time-varying Gaussian (TVG) model. The maximum likelihood estimation criterion is used to estimate the parameters of the multichannel linear predictive filter based on the TVG model [28,29].
The target signal is obtained by subtracting the late reverberation from the sound signal collected by the microphone array:
where t is the frame number of the signal, f is the frequency point of the signal, Gf is the filter weight, x(t, f) is the target signal, and y(t, f) is the signal collected by the microphone.
It can be seen from Equation (7) that the parameters of L and directly determine the prediction effect of late reverberation, but there is no reference index for the parameter selection in a specific sound field environment.
In each time-frequency unit, the target signal is modeled as a cyclic complex Gaussian distribution model with a zero mean and an unknown time-varying variance:
where u(t, f) is the variance.
The likelihood function of the TVG model is expressed as:
where T is the total frame number of the signal and g(t, f) is the prediction filter coefficients.
It is necessary to solve the g(t, f) and u(t, f) for the WPE de-reverberation, this can be done by converting it into a minimum problem as follows:
Equation (11) is a joint minimization problem for two unknown parameters. The optional optimization solution process is used where the two unknown parameters are iteratively updated until the convergence criteria are met, so as to obtain the global optimal solution of the unknown variables. The procedure consists of selecting the first channel as the reference signal, and generating the output of the de-reverberation signal:
where x1(t, f) is the first channel signal after de-reverberation and y1(t, f) is the first channel signal collected by the microphone.
2.4. Principle of the LCMV
Based on the Capon algorithm, the LCMV beamforming is extended from a single linear constraint to a set of linear constraints, which increases the constraints at the interference signal, enhances the target signal and makes null the noise interference direction zero [30].
The LCMV principle minimizes the power of the beamforming output while satisfying a set of constraints as shown below:
where is the weight, C is the constraint matrix, b is the constraint vector, Rx is the covariance matrix of the signals, and H represents the conjugate transpose superscript.
When the constraint vector is determined, the target signal is set to 1, and the direction of the interference signal is set to zero. The constraint matrix can be solved according to the incident angle of the target signal:
where is the incidence angle of the target signal and D is the vector representing the number of microphones.
As for the cost function, it is calculated using Lagrange multiplier method:
where is Lagrange multiplier vector.
Making the complex derivative of with respect to equal to zero will lead to obtaining the expression of the optimal solution under the LCMV criterion as follows:
where is the optimal weight vector.
In summary, the core of calculating the weight of each channel by the LCMV is the accurate solution of the incidence angle of the target signal.
3. Acoustic Fault Feature Extraction Method Based on the WPE-LCMV
Taking a rolling bearing fault as an example, in an ideal situation the acoustic signals collected by the microphone sensor include the signals of generated by normal bearings and the faulty bearing due to their own machining errors and variable flexibility , and the impact signal of faulty bearings due to defects .
As for the various background noises in the environment, they are represented by . In addition, shows the signal that is transmitted to the sound sensor by direct transmission from the position of the sound source, mainly containing low-frequency signals. and represent the signals that are first transmitted to the air through the bearing housing and then transmitted to the microphone, mainly containing high-frequency signals.
where J is the type of background noise.
There is reverberation in the confined space of industrial production, the early reverberation and late reverberation produced by some dominant signals reflected indoors, can be written as follow:
Microphone array signals Y(t) consist of individual channel signals yd(t).
The late reverberation results from the convolution of , , and . The WPE predicts accurately the late reverberation by making full use of the previous frame signals of the multiple channels, so that the remaining fault signal is expressed in the form of residual prediction. In addition, background noise and rolling bearing fault acoustic signals are distributed in different directions. The LCMV beamforming has a good noise reduction effect both at high-frequency signals and low-frequency signals, which enhances the signal in the direction of the fault source and accurately solves the weight of each channel. In the microphone array, although the microphone spacing is small, the signals collected by each channel are different. Thus, each channel contains fault-related information. The multi-channel signal fusion makes the fault signal more prominent, avoids the interference caused by the mutation of the single-channel signal, and improves the precision of fault feature extraction.
In summary, the process of rotating machinery fault feature extraction method based on the proposed WPE-LCMV in this paper is shown in Figure 2, and the concrete implementation process is described below.
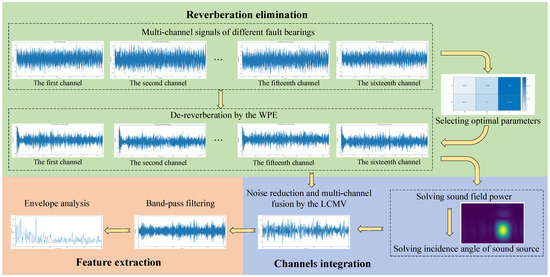
Figure 2.
Process of fault feature extraction method based on the WPE-LCMV.
- (1)
- Reverberation elimination: The delay coefficient and the number of prediction filter taps in the WPE method have a great influence on the de-reverberation effect and the signal correlation. From [31], it is clear that the delay coefficient is usually valued to be equal to 1, 2, 3 or 4 and the number of prediction filter taps is equal to 5, 6, 7, 8, 9 or 10. The delay coefficient is adjusted to separate the previous L frames signal from a frame signal that will forecast the late reverberation. This lowers the continuity between the two signals and prevents the signal from becoming too whitened. When the delay coefficient increases, the de-reverberation effect is enhanced, so it is initially selected as 3 or 4. In addition, more reference information can be obtained by increasing the taps of the prediction filter, so as to predict the late reverberation more effectively and improve the de-reverberation performance. However, beyond a certain range, excessive de-reverberation leads to signal distortion and reduces the signal correlation., where the prediction filter taps are initially selected as 5, 6 or 7. The specific methods for determining the delay coefficient and the prediction filter taps are as follows:
According to the rotating machinery structure and to the transmission path of the acoustic signal, the collected acoustic signal contains an impact signal. The kurtosis, the clearance and the pulse index reflect the impact of the signal where the stability of the pulse index is poor, the clearance is used to detect the equipment wear and the kurtosis index is sensitive to the impact characteristics. In general, the kurtosis value for the normal operating condition is equal to 3. However, when operating in faulty mode, the kurtosis value becomes greater than 3. The range reflects the volatility and the correlation of a group of signals: the smaller the range is, the more stable the signal and the higher the correlation will be. In order to ensure that better signals are obtained in different sound fields, the range of kurtosis is used as an index for selecting the WPE de-reverberation method parameters. Multi-channel de-reverberation signals are obtained by using the WPE under different groups of parameters, and the kurtosis of each channel signal in each group of parameters is calculated, respectively. When the kurtosis of each channel is larger than 3, the kurtosis range of each group of parameters is solved. A group of parameters with the smallest kurtosis range is selected for the WPE, and the multi-channel signals after de-reverberation of the group of parameters are delivered. the optimal selection process of delay coefficient and prediction filter taps is shown in Algorithm 1:
| Algorithm 1. Method: Optimal Selection Process of L and |
| Input: multichannel fault sound signals, multiple sets of L and Processing: repeating the following steps for each set of parameters:
else; abandoning; Return: selecting a set of parameters with the smallest kurtosis range. |
- (2)
- Channels integration: Due to the late reverberation of the delayed frames in prediction by the WPE based on the previous K frames of signals, the de-reverberation effect may be poor the signal of (L + − 1) frames at the beginning of each set of data, in order to reduce the interference with fault feature extraction, the signal of (L + − 1) frames at the beginning of each set of data is discarded when performing channels integration. The scanning range Scanxz is selected according to the size of the rotating equipment. To obtain a higher scanning accuracy, the scanning step is set to 0.01 m.where (x, z) is the coordinates in the scanning plane, (xmin, xmax) is the coordinate range in x direction and (zmin, zmax) is the coordinate range in z direction.
The covariance matrix and the cross-spectrum matrix are often used to calculate the sound field power. In a complex environment, the low calculation accuracy of the covariance matrix will lead to a decrease in the algorithm function. The cross-spectrum matrix ensures that the main lobe peak is unchanged and reduces the influence of the side lobes. The sound source power of each point in the sound field is obtained by solving the cross-spectral matrix of the de-reverberation signals and the steering vector of each point in the scanning range in the full frequency band, where the coordinate (x, y) with the largest power is taken as the fault source position [32,33,34]. The incident angle is calculated according to the fault source coordinates (x, y), the center coordinates of the microphone array (X, Y) and the distance Q of the center of the equipment shaft, as shown in Equation (25). Then, the LCMV beamforming is used to enhance the direction signal of the fault source and to calculate the weights of each channel. After normalizing the weight, the multi-channel signal fusion is performed.
where P(i) is the sound power of each scanning point, C is the cross-spectrum matrix of multi-channel signals after de-reverberation, ST(i) is the transpose of steering vectors for each scanning point, and S*(i) is the conjugation of steering vectors of each scanning point.
- (3)
- Feature extraction: The faulty features of the rolling bearing are extracted by filtering and envelope analysis of the fused signal to achieve the fault feature extraction of rotating machinery.
4. Experimental Validation
4.1. Experimental Platform and Experimental Design
The centrifugal pump test bench is composed of a water tank, a horizontal centrifugal pump, a motor, and a control cabinet. The test bench, the microphone array, and the data collector are arranged as shown in Figure 3, where the height of the microphone array center is 765 mm and that of the centrifugal pump shaft center is 275 mm. During the test, the speed of the three-phase asynchronous motor is kept stable due to its excitation by a constant voltage frequency ratio control of the frequency converter to ensure constant speed of the rolling bearing signal.
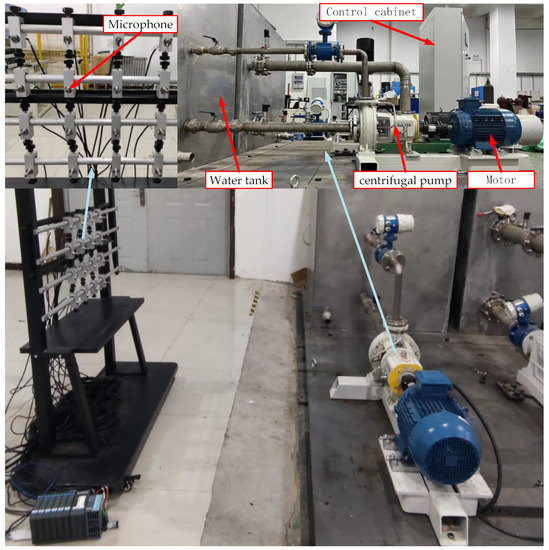
Figure 3.
Layout of the centrifugal pump test bench, the rectangular microphone array and the data collector.
The rectangular array is used in this experiment, which is composed of 16 microphone sensors, arranged as 4 × 4. According to the rolling bearing fault feature, the frequency does not exceed 500 Hz in the centrifugal pump test bench and the main frequency of the signal is mainly concentrated below 2000 Hz. In addition, the sampling frequency fs, the number of sampling points P, the speed of acoustic signal c, the wave length , and the maximum spacing of each array element dm are shown in Table 1.

Table 1.
Basic parameters of the experiment.
It can be seen from Table 1 that, the maximum spacing of each array element is set to 0.005 m, the distance from the microphone array to the sound source r is equal to 1.22 m, as calculated using Equation (1), in order to meet the far-field condition, and the distance Q is set to 1.52 m.
The type of cylindrical roller bearing, selected in this test, is NUP307 ECJ. The defects in the contact side between the inner ring and the rolling element, the contact side between the outer ring and the rolling element, and the rolling element are preset defects through the axis direction by wire cutting. The cage between the two rolling elements is cut off directly as cage fault. The processing defects and fault information are shown in Table 2.
Table 2.
Rolling bearing defect information.
4.2. Data Analysis
The size of the laboratory is 17 × 15 × 6 m where indoor environmental parameters are shown in Table 3. The RT60 is calculated at a constant period, equivalent to 1.64 s according to Equation (6), which is much larger than 50 ms. Thus, the test sound field belongs to the reverberation field, it is consistent with the indoor sound field in industrial production.
Table 3.
Indoor environment parameters.
The EHNR is used as an indicator to assess the degree of signal enhancement effect for the RLS-RSSD and the WPE-LCMV methods. As fault impulse will excite multiple resonant frequencies, the envelope spectrum is regarded as the sum of harmonic components and noise components. The greater the ENHR value is, the more prominent the impulse signal will be [35]. The EHNR is calculated as follows:
where Ha is the energy of harmonic components and N is the energy of the noise component.
The WPE-LCMV method is used to analyze the fault signal of the bearing. The results of the outer ring fault analysis are used as an example. In fact, the outer ring fault signal is de-reverberated by the WPE, the optimal selection results of the delay coefficient and the prediction filter taps L are shown in Figure 4. It can be seen from Figure 4 that the L is taken as 5 and the as 3. The time–frequency spectrums before and after de-reverberation are shown in Figure 5, where the main changing frequencies are mentioned.
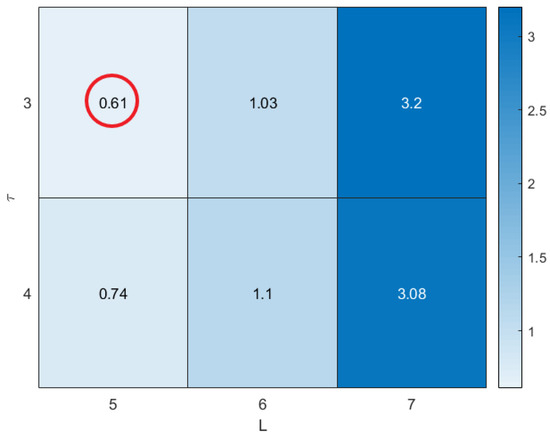
Figure 4.
Optimal parameter selection results.
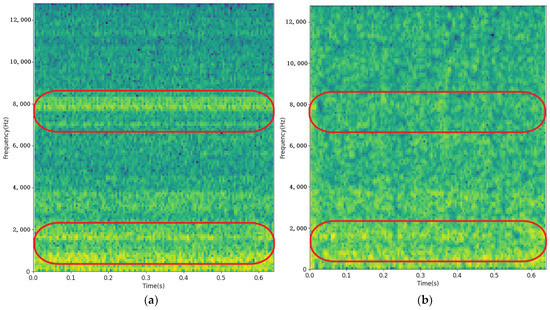
Figure 5.
Time–frequency spectrum: (a) the first microphone signal; and (b) its de-reverberation signal.
According to the overall size of the centrifugal pump test bench, the scanning range is set to and . The sound field distribution is calculated in the full frequency band, as shown in Figure 6. It can be seen from Figure 6 that the maximum sound source coordinate is (0.07, −0.43). According to Equation (25), the incident angle between the faulty bearing and the center of the microphone array is 74.2°, which is close to the actual angle of 72.5°.
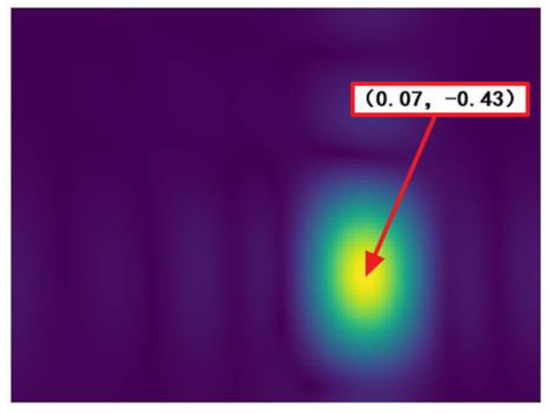
Figure 6.
Sound field distribution of the centrifugal pump.
Each channel signal is de-noised and the weights are determined by the LCMV algorithm where their normalized values are shown in Table 4. The original waveform and the fused signals of the sixteen channels are shown in Figure 7a,b. Through filtering and envelope analysis, the envelope spectrum of the original signal of the first microphone is shown in Figure 8a, and the envelope spectrum after the WPE-LCMV analysis is shown in Figure 8b.
Table 4.
Weight of each channel.
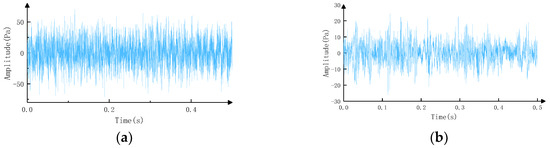
Figure 7.
The waveform of (a) the first microphone original signal and (b) the fused signal.
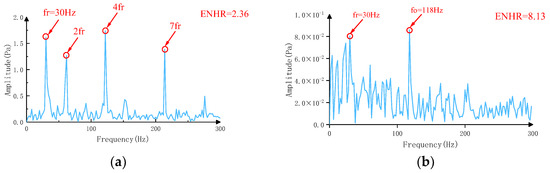
Figure 8.
The envelope spectrum of (a) the first microphone original signal and (b) after WPE-LCMV analysis.
The RLS-RSSD and the parameter-optimized VMD methods are used to analyze the bearing outer ring fault signal, and the envelope spectrum as shown in Figure 9.
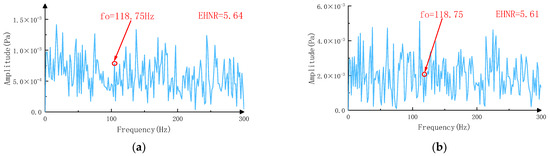
Figure 9.
Envelope spectrum after applying (a) the RLS-RSSD analysis and (b) the parameter-optimized VMD.
In order to further verify the effectiveness of the proposed method, in addition to the bearing outer ring fault test, the bearing inner ring fault, the cage fault and the rolling element fault tests are also carried out. The ENHR of the original signal, the RLS-RSSD output, the parameter-optimized VMD output and the WPE-LCMV output are shown in Table 5.
Table 5.
Comparison of EHNR of each method.
It can be seen from Figure 5 and Figure 7 that the interference in the original waveform is serious, and the impact signal is weak. After processing by the WPE-LCMV method, the interference component is reduced, especially in the high-frequency part where the impact component is significantly increased, and the signal enhancement effect is obvious.
Referring to Figure 8, the envelope spectrum of the original signal is mainly frequency doubling, and the fault feature frequency is weak. The original signal is analyzed by the WPE-LCMV, the fault feature frequency 118 Hz can be clearly read out in the envelope spectrum, basically equal to the bearing outer ring fault theory frequency (equivalent to 118.5 Hz). Therefore, it can be determined that there is an outer ring fault in the measured bearing. It is inevitable that there is a certain difference between the actual and the theoretical fault feature frequency due to the problems of disassembled bearings and the data acquisition board resolution. It can be seen from Figure 9 that the EHNR is higher than the original signal, there is also a characteristic frequency of 118.75 Hz. But there is a large number of interference components with higher amplitude, so the feature extraction effect is poor by using RLS-RSSD and the parameter-optimized VMD. The difference of 0.75 Hz between the fault characteristic frequencies obtained by the four methods is due to the different resolutions after the data is intercepted in the WPE-LCMV.
It can be seen from Table 5 that, after using the WPE-LCMV to enhance the three types of fault signals, the EHNR is significantly higher than the original signal, the RLS-RSSD output, and the parameter-optimized VMD output. Therefore, the proposed method is superior to the RLS-RSSD and the parameter-optimized VMD in a complex sound field environment.
4.3. Results Analysis
Based on the different findings, it can be seen that the EHNR of the WPE-LCMV is larger than that of both the RLS-RSSD and the parameter-optimized VMD. Therefore, the signal-enhancement effect after the WPE-LCMV analysis is significantly better than the RLS-RSSD and the parameter-optimized VMD. The parameter-optimized VMD method does not eliminate the reverberation generated by the reflection of the sound source in the room. However, the reverberation affects the amplitude and phase of the faulty signal, resulting in weak fault characteristics. The RLS algorithm needs to input pure fault signal as a reference while inputting reverberation signal. However, it is difficult to obtain such a pure fault signal in the actual production. If simulation analysis is used, there are many factors that are ignored. Based on the RLS-RSSD and the parameter-optimized VMD method, when a single channel signal is used for analysis, less effective information can be obtained. All signals in the space are superimposed together and it is not easy to separate reverberation and background noise from collected signals. The influence of microphone placement position on different faults is also particularly large. Therefore, the fault feature extraction method, based on the RLS-RSSD and the parameter-optimized VMD method does not perform well.
After the WPE-LCMV processing, the interference components are more discarded, the de-reverberation and the noise reduction effects are significant, the quality of the signal is improved, and the fault feature frequency can be extracted more effectively. Multi-channel signals are used by the WPE to predict the late reverberation, which avoids the limitations of single-channel signals and increases the prediction effect. Added to that, the range of kurtosis is introduced as an indicator in the process of de-reverberation. The parameters are adaptively selected according to different sound field environments, which improves the de-reverberation effect of the WPE in various environments, and ensures that the signal after de-reverberation has a high impact and correlation. In the complex sound field environment, the cross-spectral matrix can accurately calculate the sound field distribution to solve the incident angle of the fault source. To do so, a beam will be formed by the LCMV in the direction of the fault source to enhance the signal in the beam, so as to obtain the fault signal and suppress the background noise to the greatest possible extent. Finally, the multi-channel signal is fused into a single-channel signal, which integrates the fault information of each channel and increases the effect of feature extraction.
5. Conclusions
In this paper, a novel multi-channel acoustic signal enhancement method, based on the WPE integrating the LCMV is proposed to solve the problem of difficult feature extraction in a complex sound field. The range of kurtosis is used as the index of the optimal parameter selection of the WPE de-reverberation. The cross-spectral matrix is also used to calculate the sound field power, and the incident angle is determined according to the sound field distribution. Multi-channel signals are fused into a single-channel signal while the noise is reduced by the LCMV, which has better de-reverberation and noise reduction effect, and realizes the accurate diagnosis of the rolling bearing fault. This method provides a reference for other types of fault feature extraction.
The proposed method is a traditional signal processing method. However, with the wide application of deep learning, it can be combined with the WPE-LCMV to enhance the reliability of the proposed method. Meanwhile, some other future works may be implemented in this method to enhance it, one can list the following: DNN has the capability of parameter estimation, it can replace the iterative process of the WPE.
Author Contributions
Conceptualization, P.W.; methodology, P.W.; validation, P.W., G.Y. and N.D.; formal analysis, P.W.; data curation, N.D. and G.Y.; writing—original draft preparation, P.W. and G.Y.; writing—review and editing, P.W., G.Y. and B.M.; supervision, B.M.; funding acquisition, B.M. All authors have read and agreed to the published version of the manuscript.
Funding
This research received no external funding.
Data Availability Statement
Not applicable.
Conflicts of Interest
The authors declare no conflict of interest.
References
- Han, Y.; Liu, J.; Liu, F.; Geng, Z. An Intelligent Moving Window Sparse Principal Component Analysis-Based Case Based Reasoning for Fault Diagnosis: Case of the Drilling Process. ISA Trans. 2022, 128, 242–254. [Google Scholar] [CrossRef]
- Geng, Z.; Duan, X.; Han, Y.; Liu, F.; Xu, W. Novel Variation Mode Decomposition Integrated Adaptive Sparse Principal Component Analysis and It Application in Fault Diagnosis. ISA Trans. 2022, 128, 21–31. [Google Scholar] [CrossRef]
- Hou, J.; Ma, B.; Liang, L.; Zhang, M. An Early Warning Method for Mechanical Fault Detection Based on Adversarial Auto-Encoders. J. Adv. Manuf. Sci. Technol. 2022, 2, 2022006. [Google Scholar] [CrossRef]
- Yao, J.; Liu, C.; Song, K.; Feng, C.; Jiang, D. Fault Diagnosis of Planetary Gearbox Based on Acoustic Signals. Appl. Acoust. 2021, 181, 108151. [Google Scholar] [CrossRef]
- Qin, C.; Wang, D.; Xu, Z.; Tang, G. Improved Empirical Wavelet Transform for Compound Weak Bearing Fault Diagnosis with Acoustic Signals. Appl. Sci. 2020, 10, 682. [Google Scholar] [CrossRef]
- He, S.; Hu, D.; Yu, G.; Liao, A.; Shi, W. Trackside Acoustic Detection of Axle Bearing Fault Using Wavelet Domain Moving Beamforming Method. Appl. Acoust. 2022, 195, 108851. [Google Scholar] [CrossRef]
- Zhou, Y.; Zhang, Y.; Lu, J.; Yang, F.; Dong, H.; Li, G. Feature Extraction Method of Pipeline Signal Based on Parameter Optimized Vocational Mode Decomposition and Exponential Entropy. Trans. Inst. Meas. Control 2022, 44, 216–231. [Google Scholar] [CrossRef]
- Wang, Y.; Chi, Y.; Wu, X.; Liu, C. Extracting Acoustical Impulse Signal of Faulty Bearing Using Blind Deconvolution Method. In Proceedings of the 2009 Second International Conference on Intelligent Computation Technology and Automation, Changsha, China, 10–11 October 2009; pp. 590–594. [Google Scholar]
- Yu, G.; Ma, B.; Yan, G. Acoustic Diagnosis of a Rolling Bearing Based on Resonance Sparse Decomposition and Sub-band Enhancement. J. Beijing Univ. Chem. Technol. (Nat. Sci.) 2021, 48, 49–57. [Google Scholar]
- Yu, G.; Yan, G.; Ma, B. Feature Enhancement Method of Rolling Bearing Acoustic Signal Based on RLS-RSSD. Measurement 2022, 192, 110883. [Google Scholar] [CrossRef]
- Marxim Rahula Bharathi, B.; Mohanty, A.R. Underwater Sound Source Localization by EMD-Based Maximum Likelihood Method. Acoust. Aust. 2018, 46, 193–203. [Google Scholar] [CrossRef]
- Huang, G.; Chen, J.; Benesty, J.; Cohen, I.; Zhao, X. Steerable Differential Beamformers with Planar Microphone Arrays. EURASIP J. Audio Speech Music Process. 2020, 2020, 15. [Google Scholar] [CrossRef]
- Ikeshita, R.; Kinoshita, K.; Kamo, N.; Nakatani, T. Online Speech Dereverberation Using Mixture of Multichannel Linear Prediction Models. IEEE Signal Process. Lett. 2021, 28, 1580–1584. [Google Scholar] [CrossRef]
- Ikeshita, R.; Kamo, N.; Nakatani, T. Blind Signal Dereverberation Based on Mixture of Weighted Prediction Error Models. IEEE Signal Process. Lett. 2021, 28, 399–403. [Google Scholar] [CrossRef]
- Nakatani, T.; Kinoshita, K. A Unified Convolutional Beamformer for Simultaneous Denoising and Dereverberation. IEEE Signal Process. Lett. 2019, 26, 903–907. [Google Scholar] [CrossRef]
- Khan, M.Z.U.; Malik, A.N.; Zaman, F.; Qureshi, I.M. Robust LCMV Beamformer for Direction of Arrival Mismatch without Beam Broadening. Wirel. Pers. Commun. 2019, 104, 21–36. [Google Scholar] [CrossRef]
- Gosling, N.; Hadad, E.; Gannot, S.; Doclo, S. Binaural LCMV Beamforming with Partial Noise Estimation. IEEE/ACM Trans. Audio Speech Lang. Process. 2020, 28, 2942–2955. [Google Scholar] [CrossRef]
- Pandey, O.J.; Gautam, V.; Nguyen, H.H.; Shukla, M.K.; Hegde, R.M. Fault-Resilient Distributed Detection and Estimation Over a SW-WSN Using LCMV Beamforming. IEEE Trans. Netw. Serv. Manag. 2020, 17, 1758–1773. [Google Scholar] [CrossRef]
- Hassani, A.; Plata-Chaves, J.; Bahari, M.H.; Moonen, M.; Bertrand, A. Multi-Task Wireless Sensor Network for Joint Distributed Node-Specific Signal Enhancement, LCMV Beamforming and DOA Estimation. IEEE J. Sel. Top. Signal Process. 2017, 11, 518–533. [Google Scholar] [CrossRef]
- Ribeiro, L.N.; de Almeida, A.L.; Mota, J.C. Separable Linearly Constrained Minimum Variance Beamformers. Signal Process. 2019, 158, 15–25. [Google Scholar] [CrossRef]
- Omologo, M.; Svaizer, P.; Matassoni, M. Environmental Conditions and Acoustic Transduction in Hands-Free Speech Recognition. Speech Commun. 1998, 25, 75–95. [Google Scholar] [CrossRef]
- Ma, B.; Yan, G.; Yu, G. Bogie Running-in Test of Fault Monitoring Experiment on Rolling Stock Based on Microphone Array. Electr. Drive Locomot. 2019, 6, 95–99. [Google Scholar]
- Zheng, K.; Zheng, C.; Sang, J.; Zhang, Y.; Li, X. Noise-Robust Blind Reverberation Time Estimation Using Noise-Aware Time–Frequency Masking. Measurement 2022, 192, 110901. [Google Scholar] [CrossRef]
- Purushothaman, A.; Sreeram, A.; Kumar, R.; Ganapathy, S. Dereverberation of Autoregressive Envelopes for Far-Field Speech Recognition. Comput. Speech Lang. 2022, 72, 101277. [Google Scholar] [CrossRef]
- Ullah, R.; Shohidul Islam, M.; Imran Hossain, M.; Wahab, F.E.; Ye, Z. Single Channel Speech Dereverberation and Separation Using RPCA and SNMF. Appl. Acoust. 2020, 167, 107406. [Google Scholar] [CrossRef]
- Yoshioka, T.; Sehr, A.; Delcroix, M.; Kinoshita, K.; Maas, R.; Nakatani, T.; Kellermann, W. Making Machines Understand Us in Reverberant Rooms: Robustness against Reverberation for Automatic Speech Recognition. IEEE Signal Process. Mag. 2012, 29, 114–126. [Google Scholar] [CrossRef]
- Scamoni, F.; Scrosati, C.; Depalma, M.; Barozzi, B. Experimental Evaluations of Acoustic Properties and Long-Term Analysis of a Novel Indoor Living Wall. J. Build. Eng. 2022, 47, 103890. [Google Scholar] [CrossRef]
- Yoshioka, T.; Nakatani, T. Generalization of Multi-Channel Linear Prediction Methods for Blind MIMO Impulse Response Shortening. IEEE Trans. Audio Speech Lang. Process. 2012, 20, 2707–2720. [Google Scholar] [CrossRef]
- Parchami, M.; Amindavar, H.; Zhu, W.-P. Speech Reverberation Suppression for Time-Varying Environments Using Weighted Prediction Error Method with Time-Varying Autoregressive Model. Speech Commun. 2019, 109, 1–14. [Google Scholar] [CrossRef]
- Frost, O.L. An Algorithm for Linearly Constrained Adaptive Array Processing. Proc. IEEE 1972, 60, 926–935. [Google Scholar] [CrossRef]
- Drude, L.; Heymann, J.; Boeddeker, C.; Haeb-Umbach, R. NARA-WPE: A Python Package for Weighted Prediction Error Dereverberation in Numpy and Tensorflow for Online and Offline Processing. In Proceedings of the Speech Communication, 13th ITG-Symposium, Oldenburg, Germany, 10–12 October 2018; pp. 1–5. [Google Scholar]
- Zhou, T.; Huang, J.; Du, W.; Shen, J.; Yuan, W. 2-D Deconvolved Conventional Beamforming for a Planar Array. Circuits Syst. Signal Process. 2021, 40, 5572–5593. [Google Scholar] [CrossRef]
- Gao, J.; Wu, H.; Jiang, W. Dipole-Based Beamforming Method for Locating Dipole Sources with Unknown Orientations in Three-Dimensional Domains. J. Acoust. Soc. Am. 2020, 147, 125–136. [Google Scholar] [CrossRef]
- Tan, Y.; Ma, B.; Zhang, Q. Rotating Machinery Fault Source Location Method Based on Sensitive Characteristic Frequency Band. J. Mech. Electr. Eng. 2022, 39, 1080–1087+1095. [Google Scholar]
- Xu, X.; Zhao, M.; Lin, J.; Lei, Y. Envelope Harmonic-to-Noise Ratio for Periodic Impulses Detection and Its Application to Bearing Diagnosis. Measurement 2016, 91, 385–397. [Google Scholar] [CrossRef]


Publisher’s Note: MDPI stays neutral with regard to jurisdictional claims in published maps and institutional affiliations. |
© 2022 by the authors. Licensee MDPI, Basel, Switzerland. This article is an open access article distributed under the terms and conditions of the Creative Commons Attribution (CC BY) license (https://creativecommons.org/licenses/by/4.0/).