
A Novel Simplified FE Rail Vehicle Model in Longitudinal and Lateral Collisions
Abstract
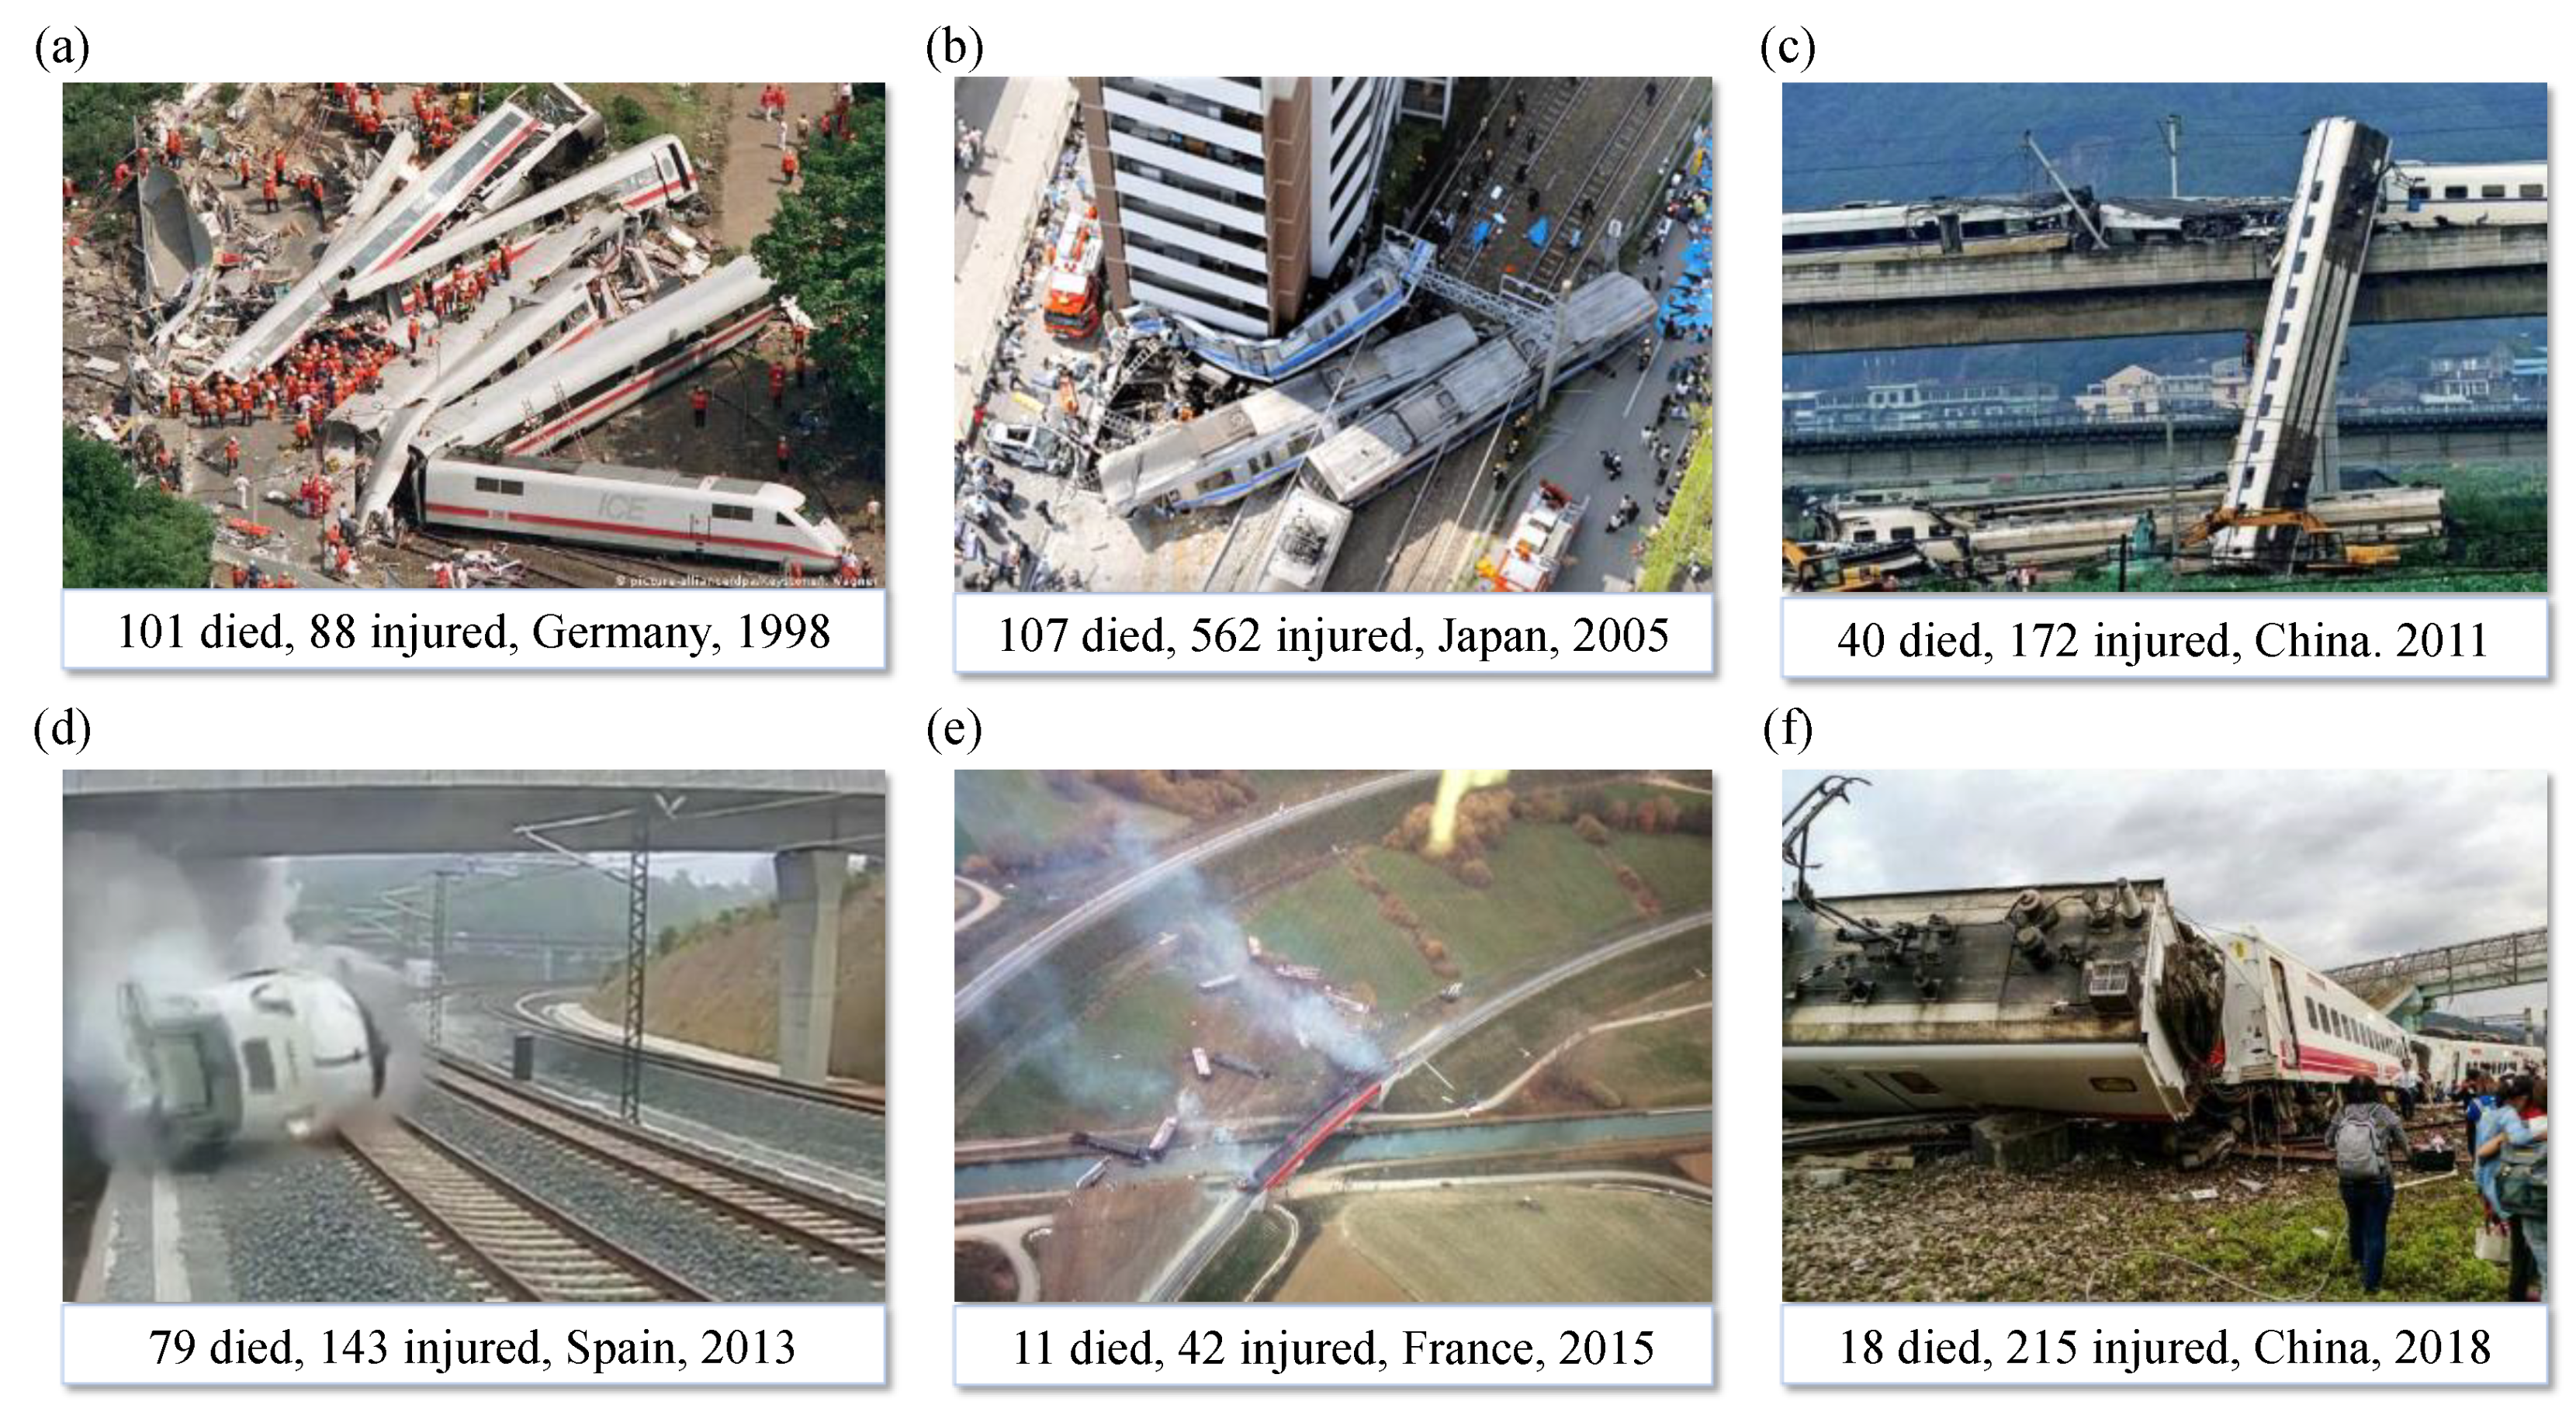
:1. Introduction
2. Materials and Methods
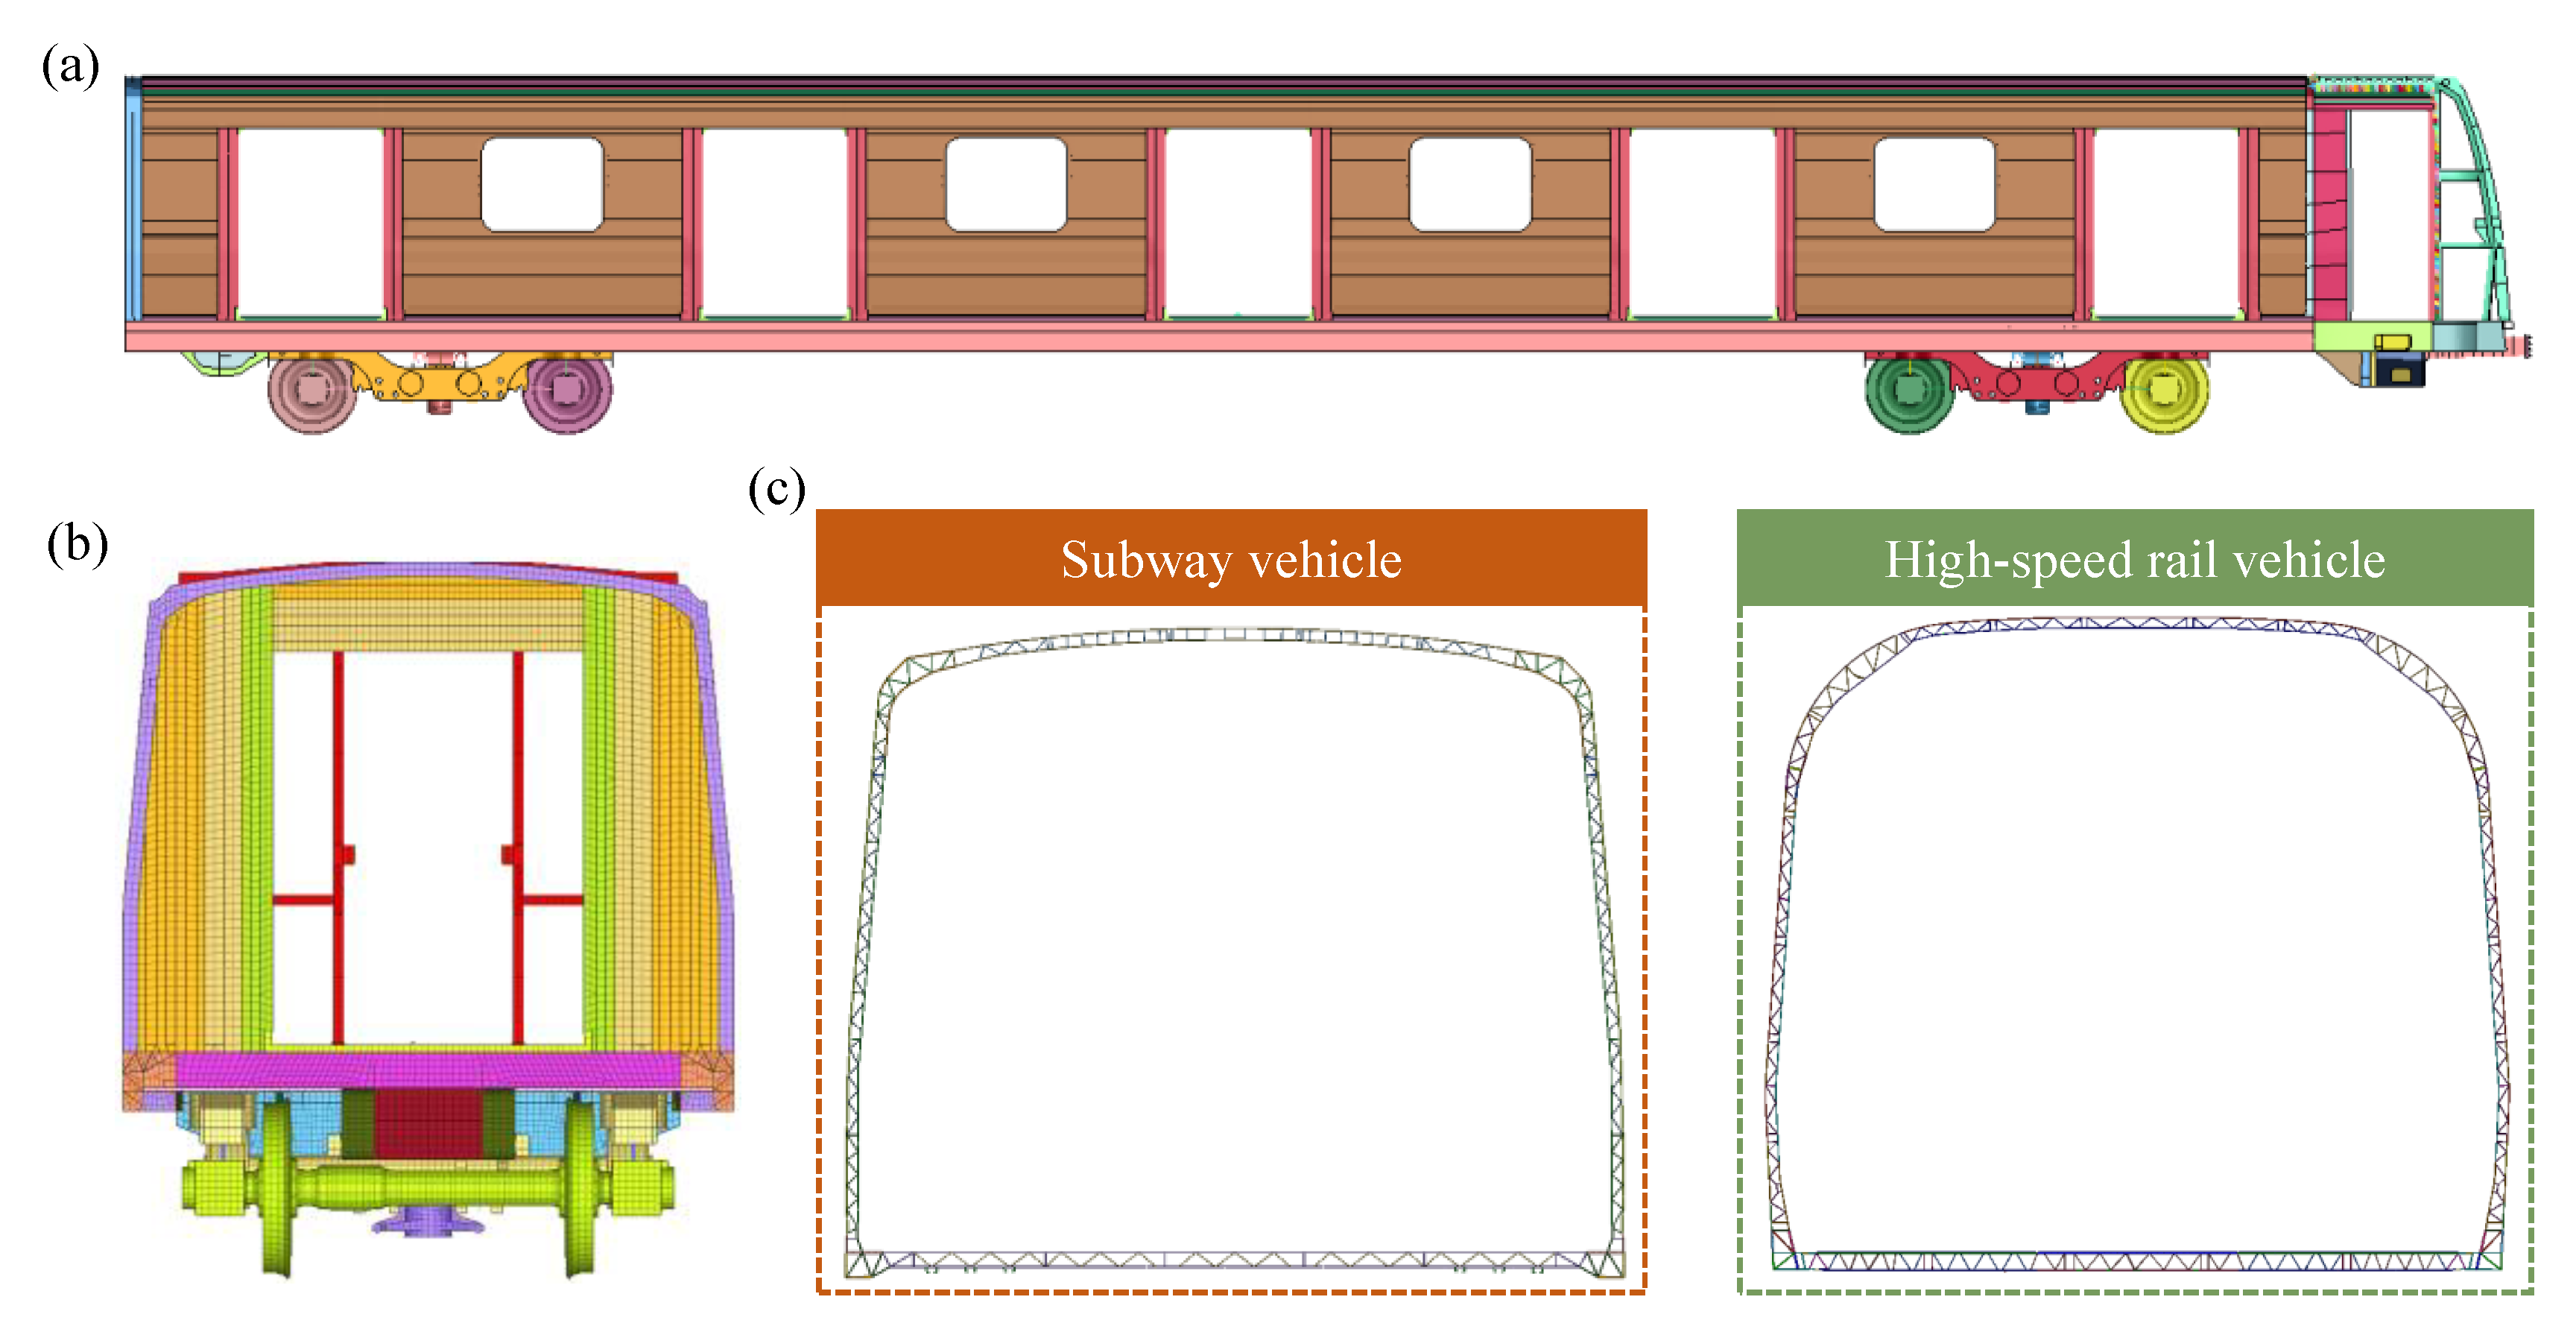
2.1. FE Baseline Detailed Model of Rail Vehicle
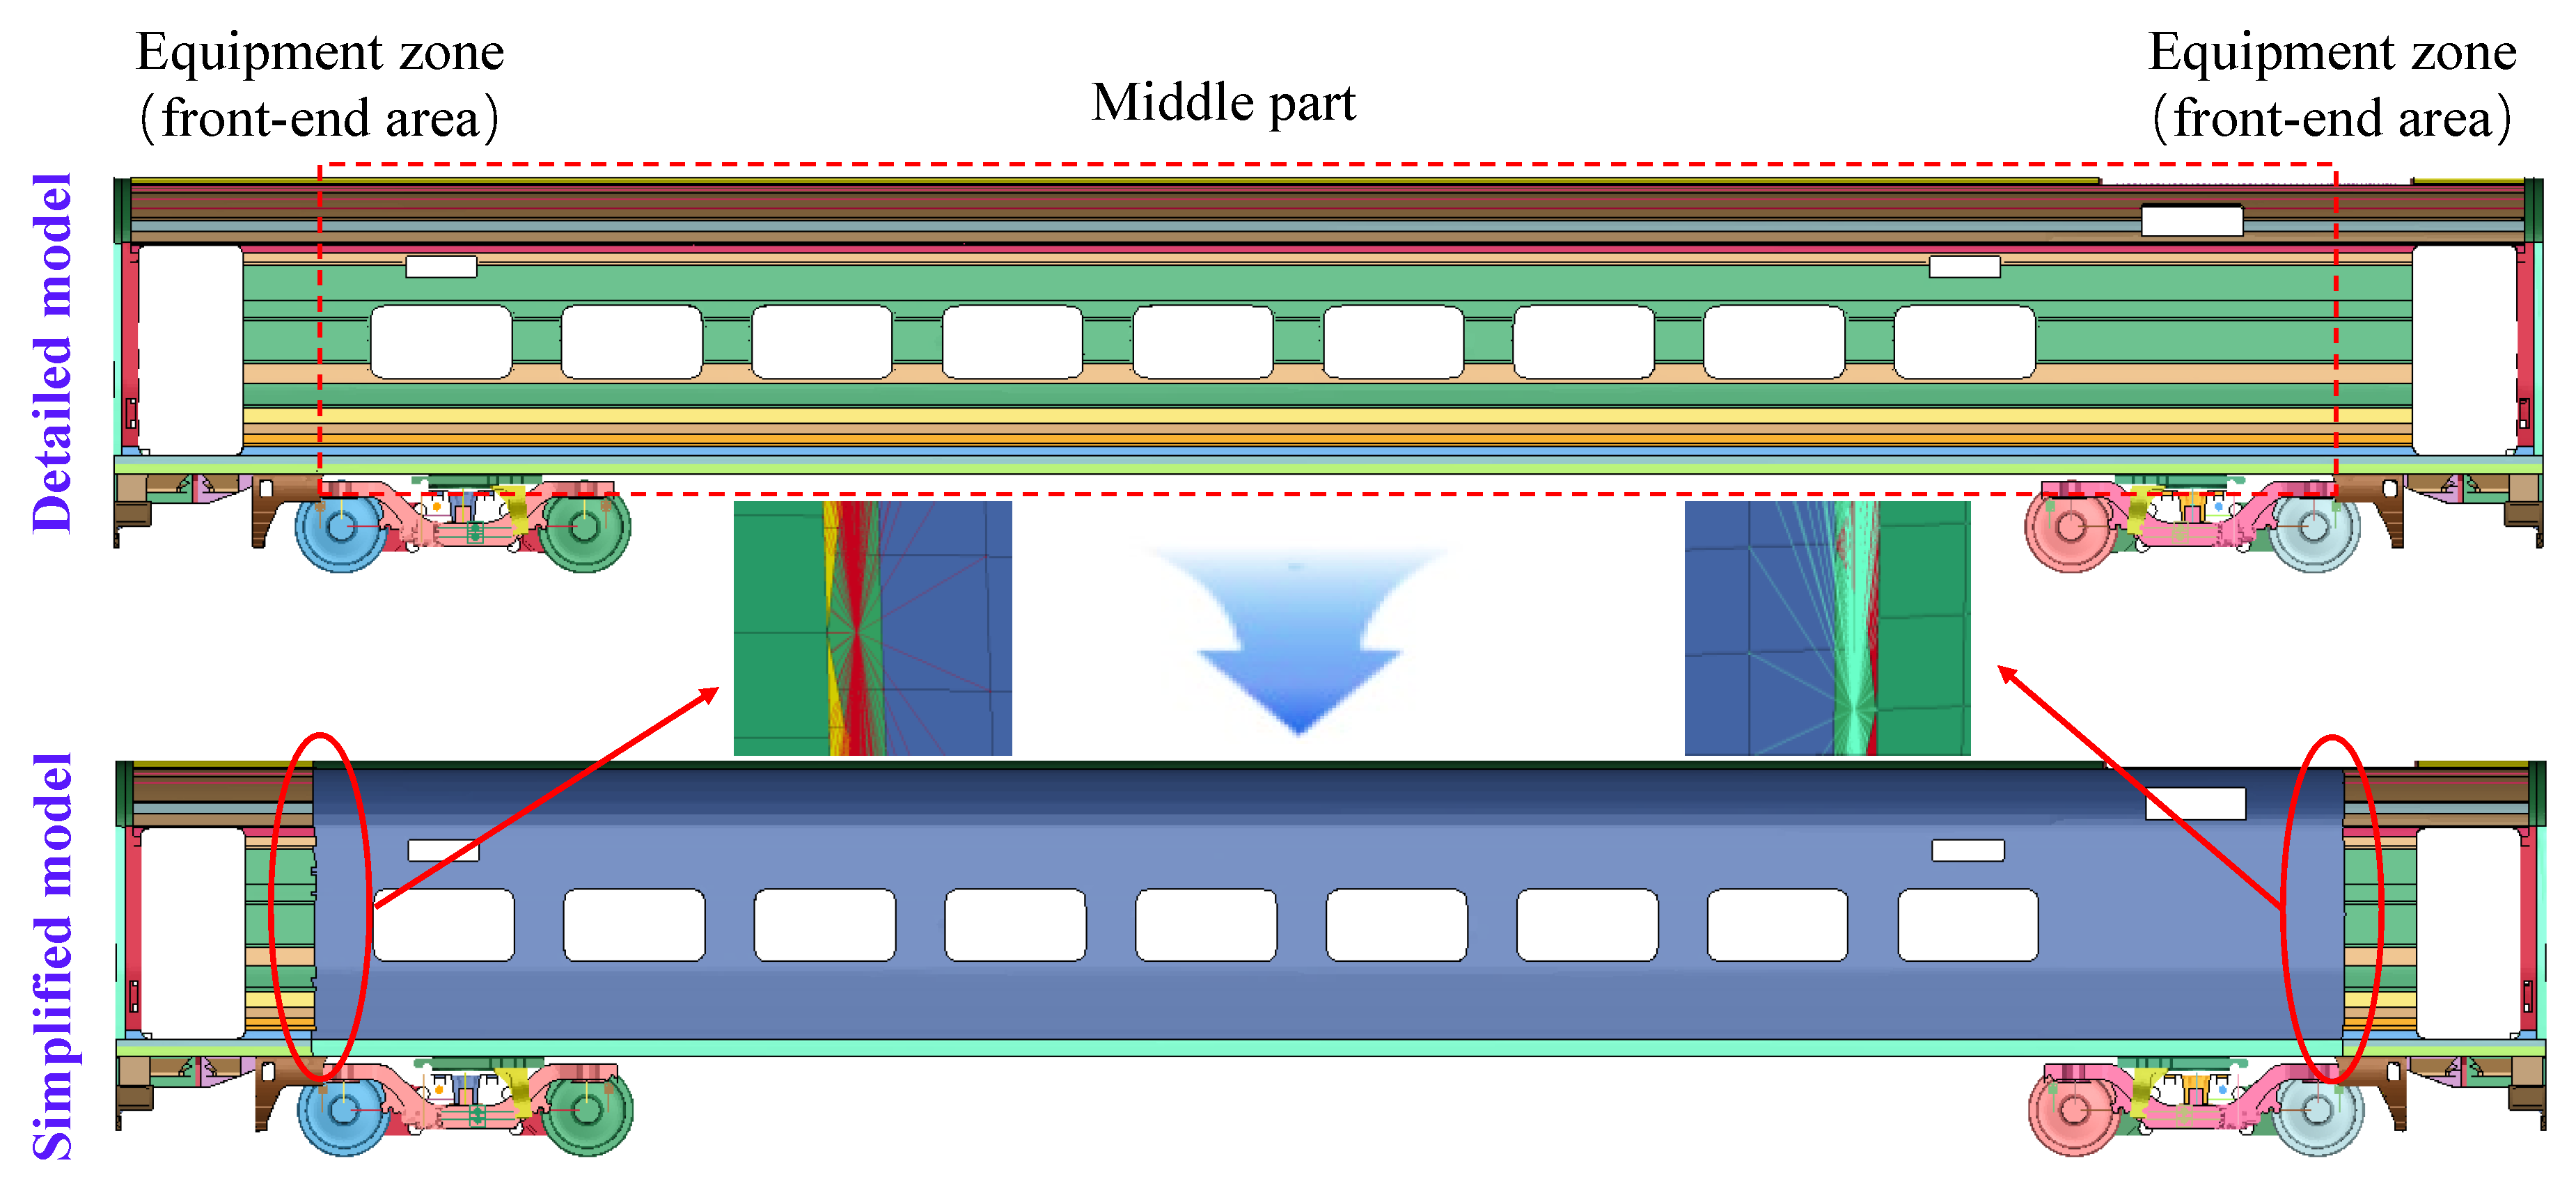
2.2. FE Simplified Model of Rail Vehicle
2.3. Longitudinal and Lateral Collision Simulations
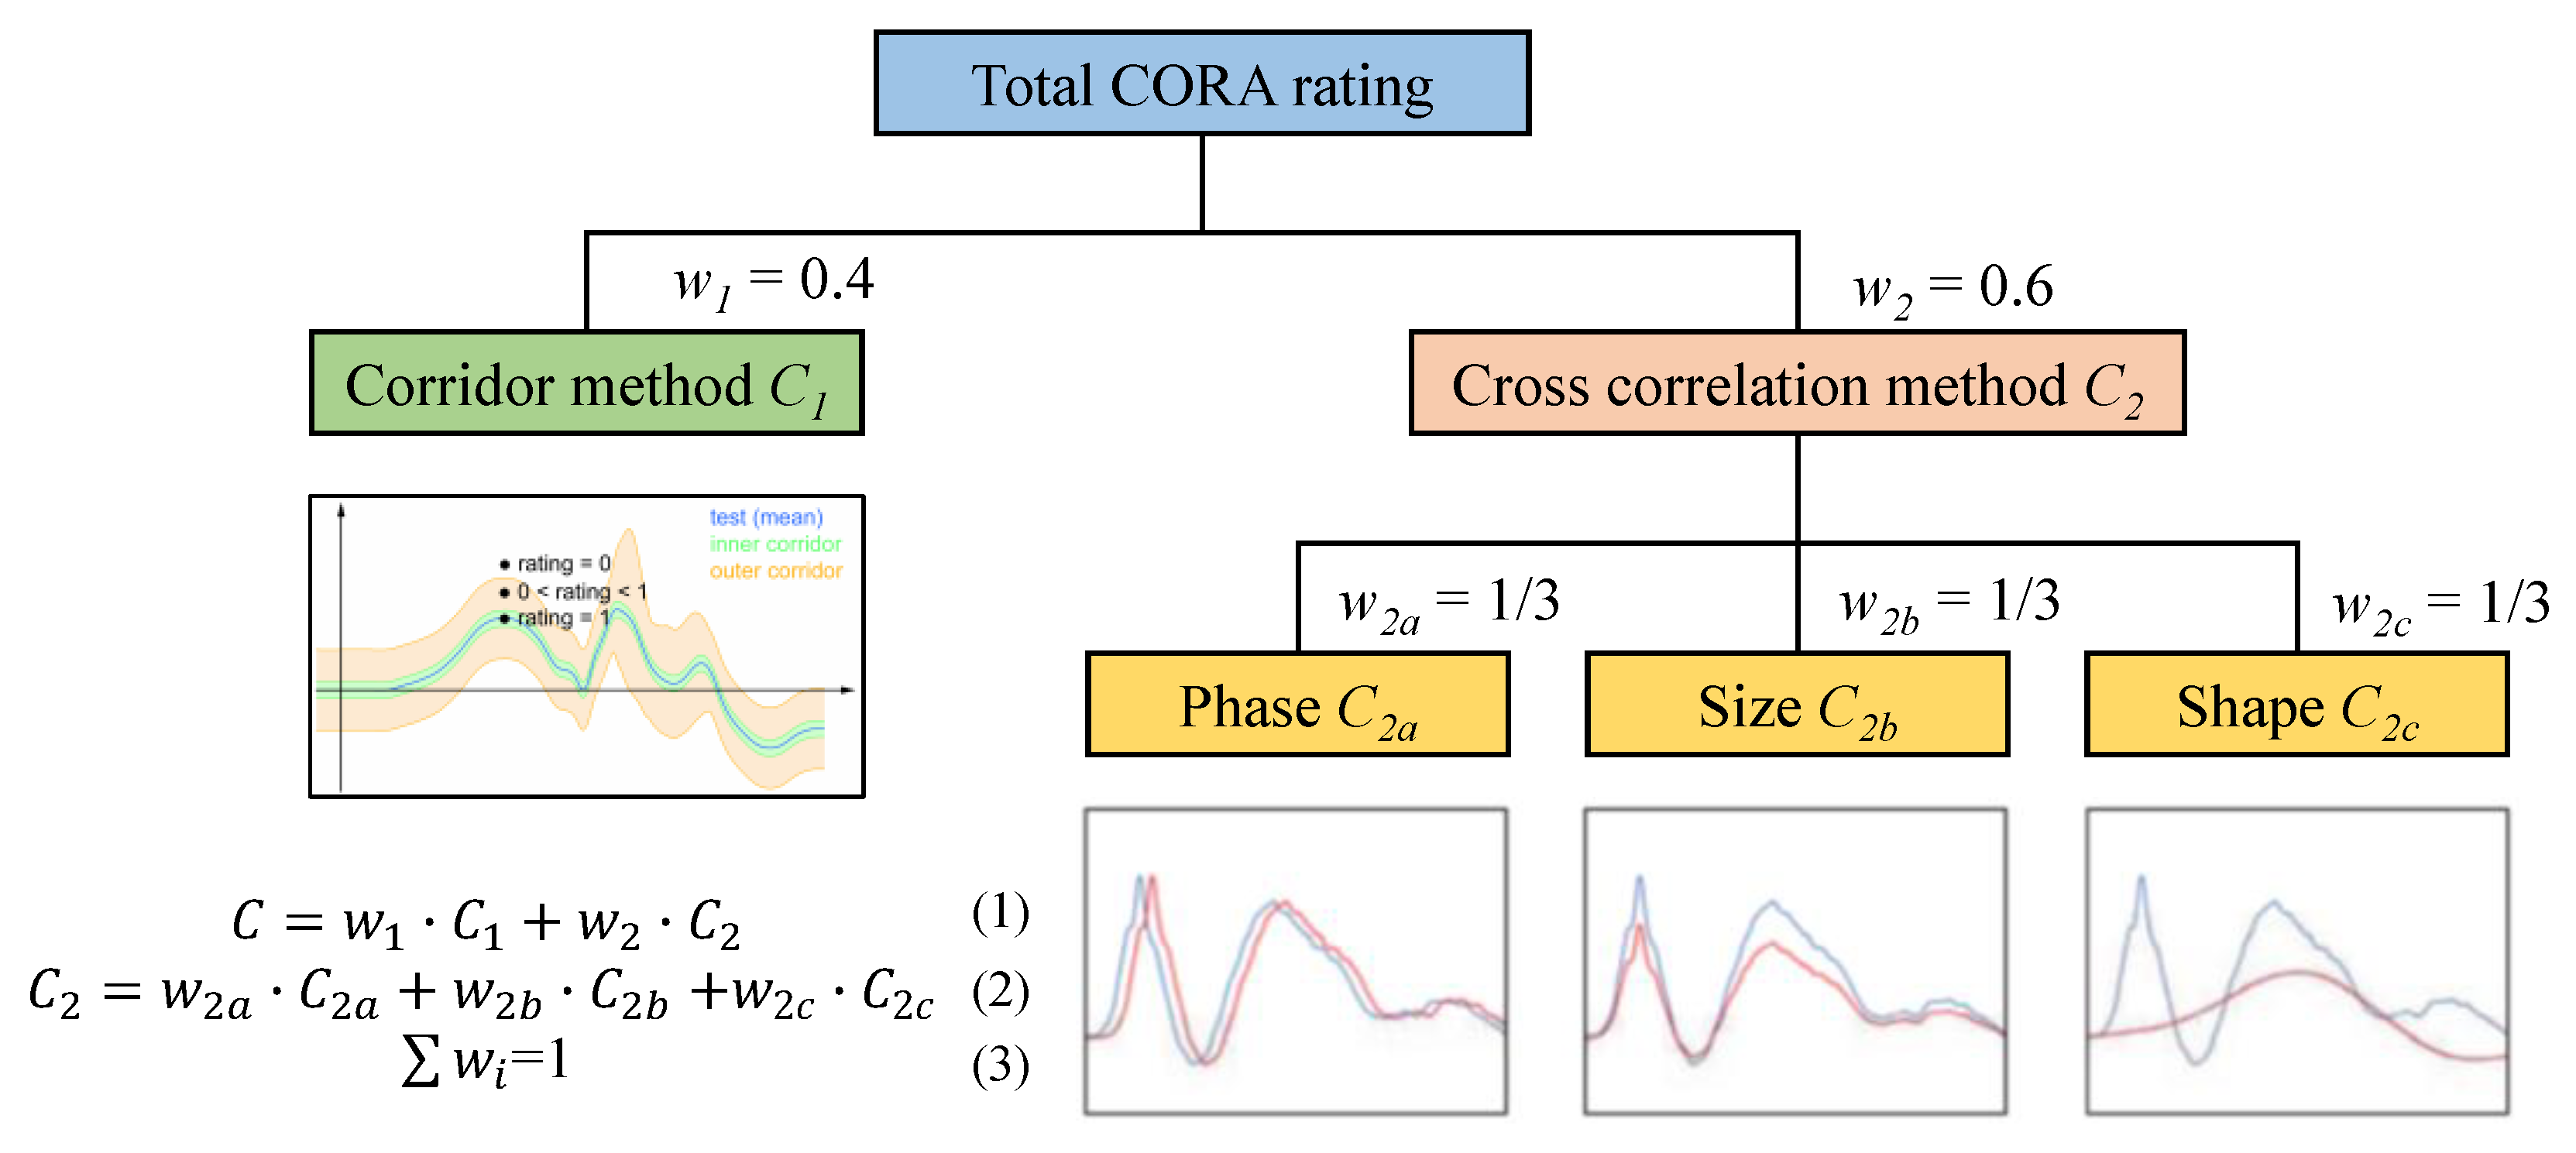
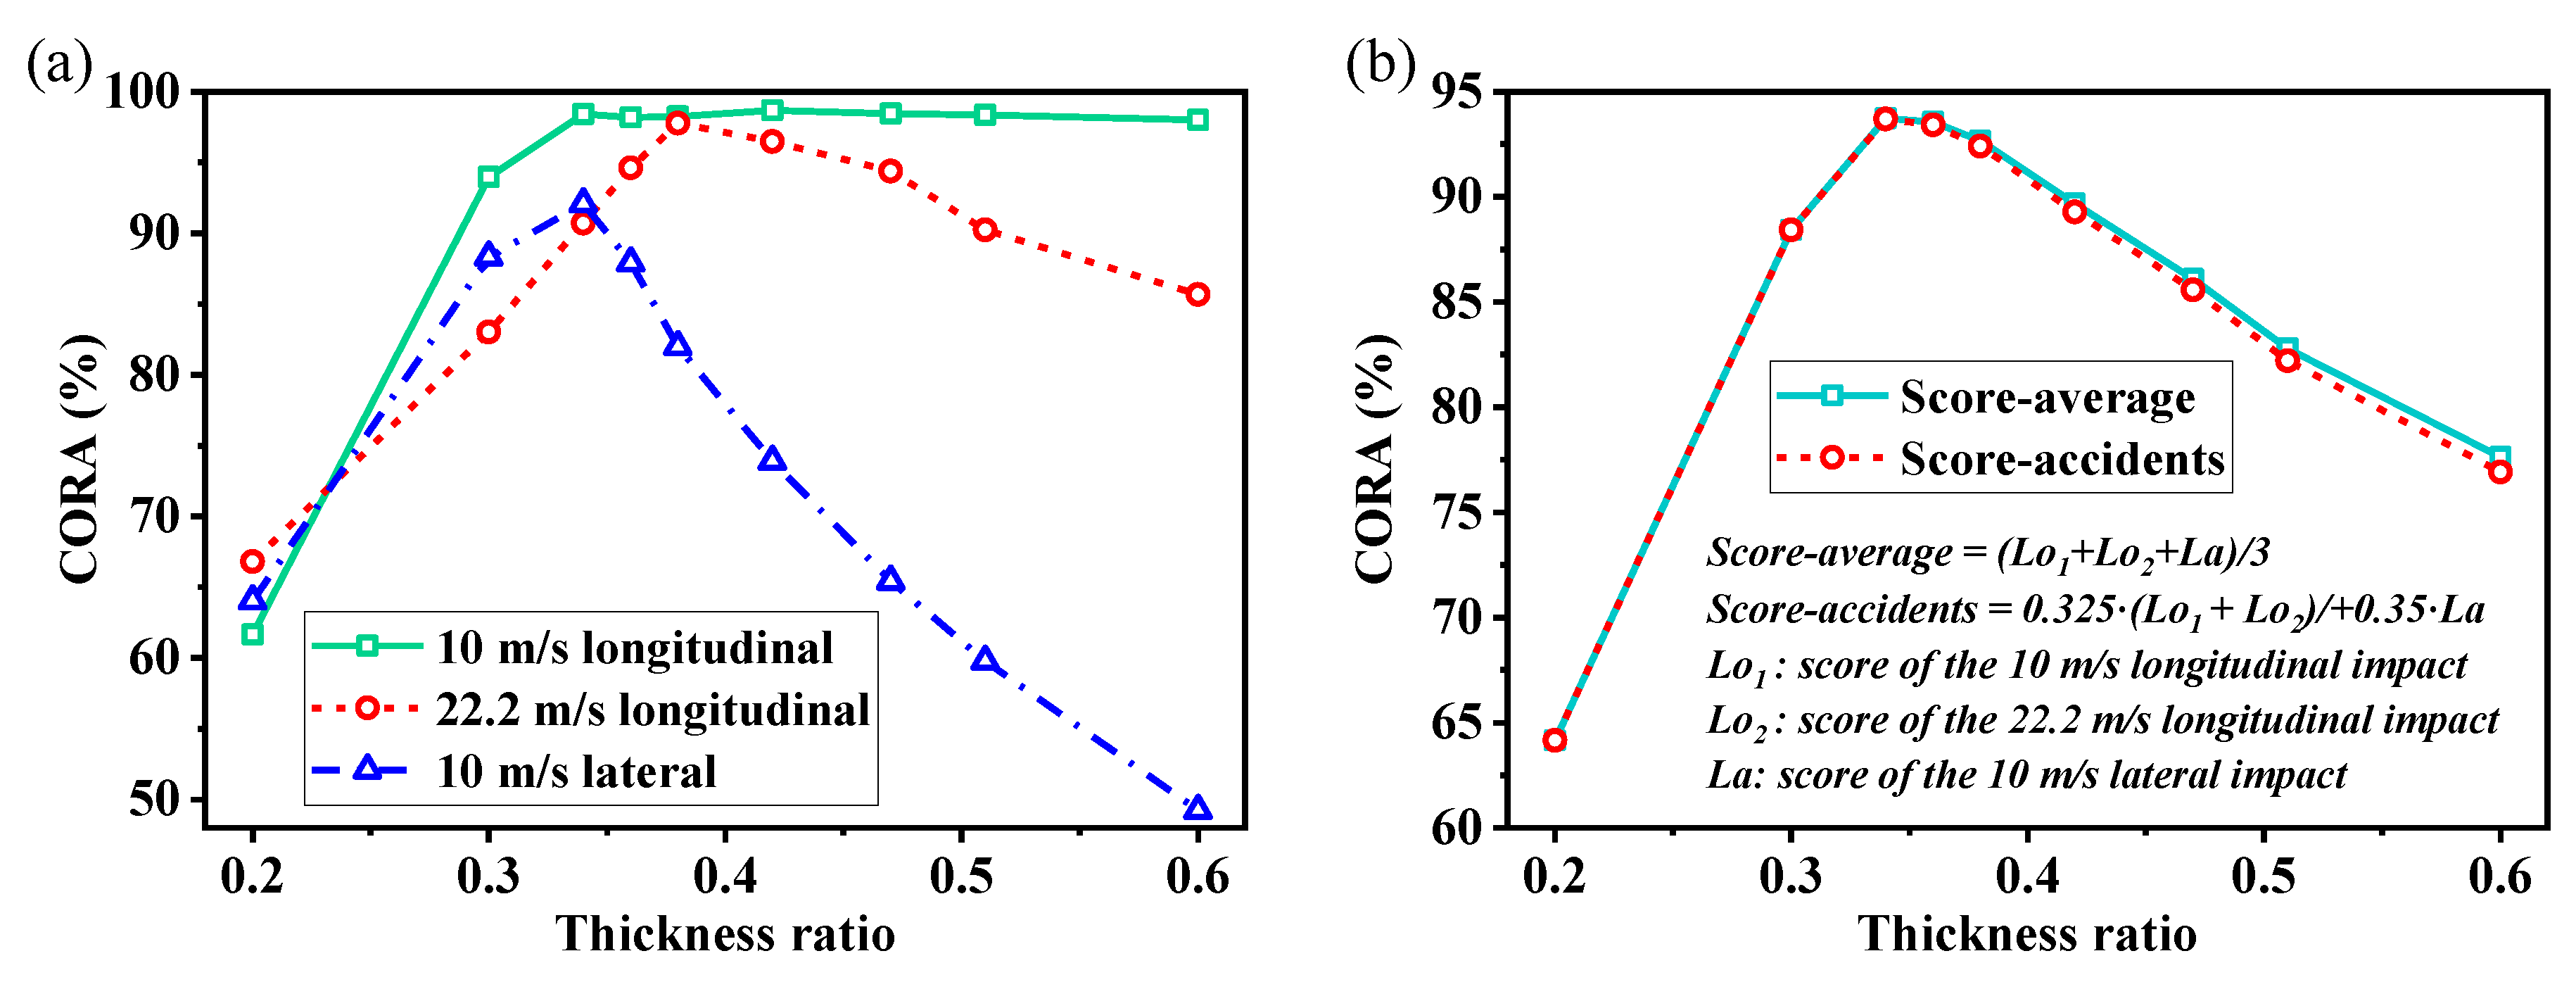
2.4. Objective Evaluation Method
3. Results
4. Discussion
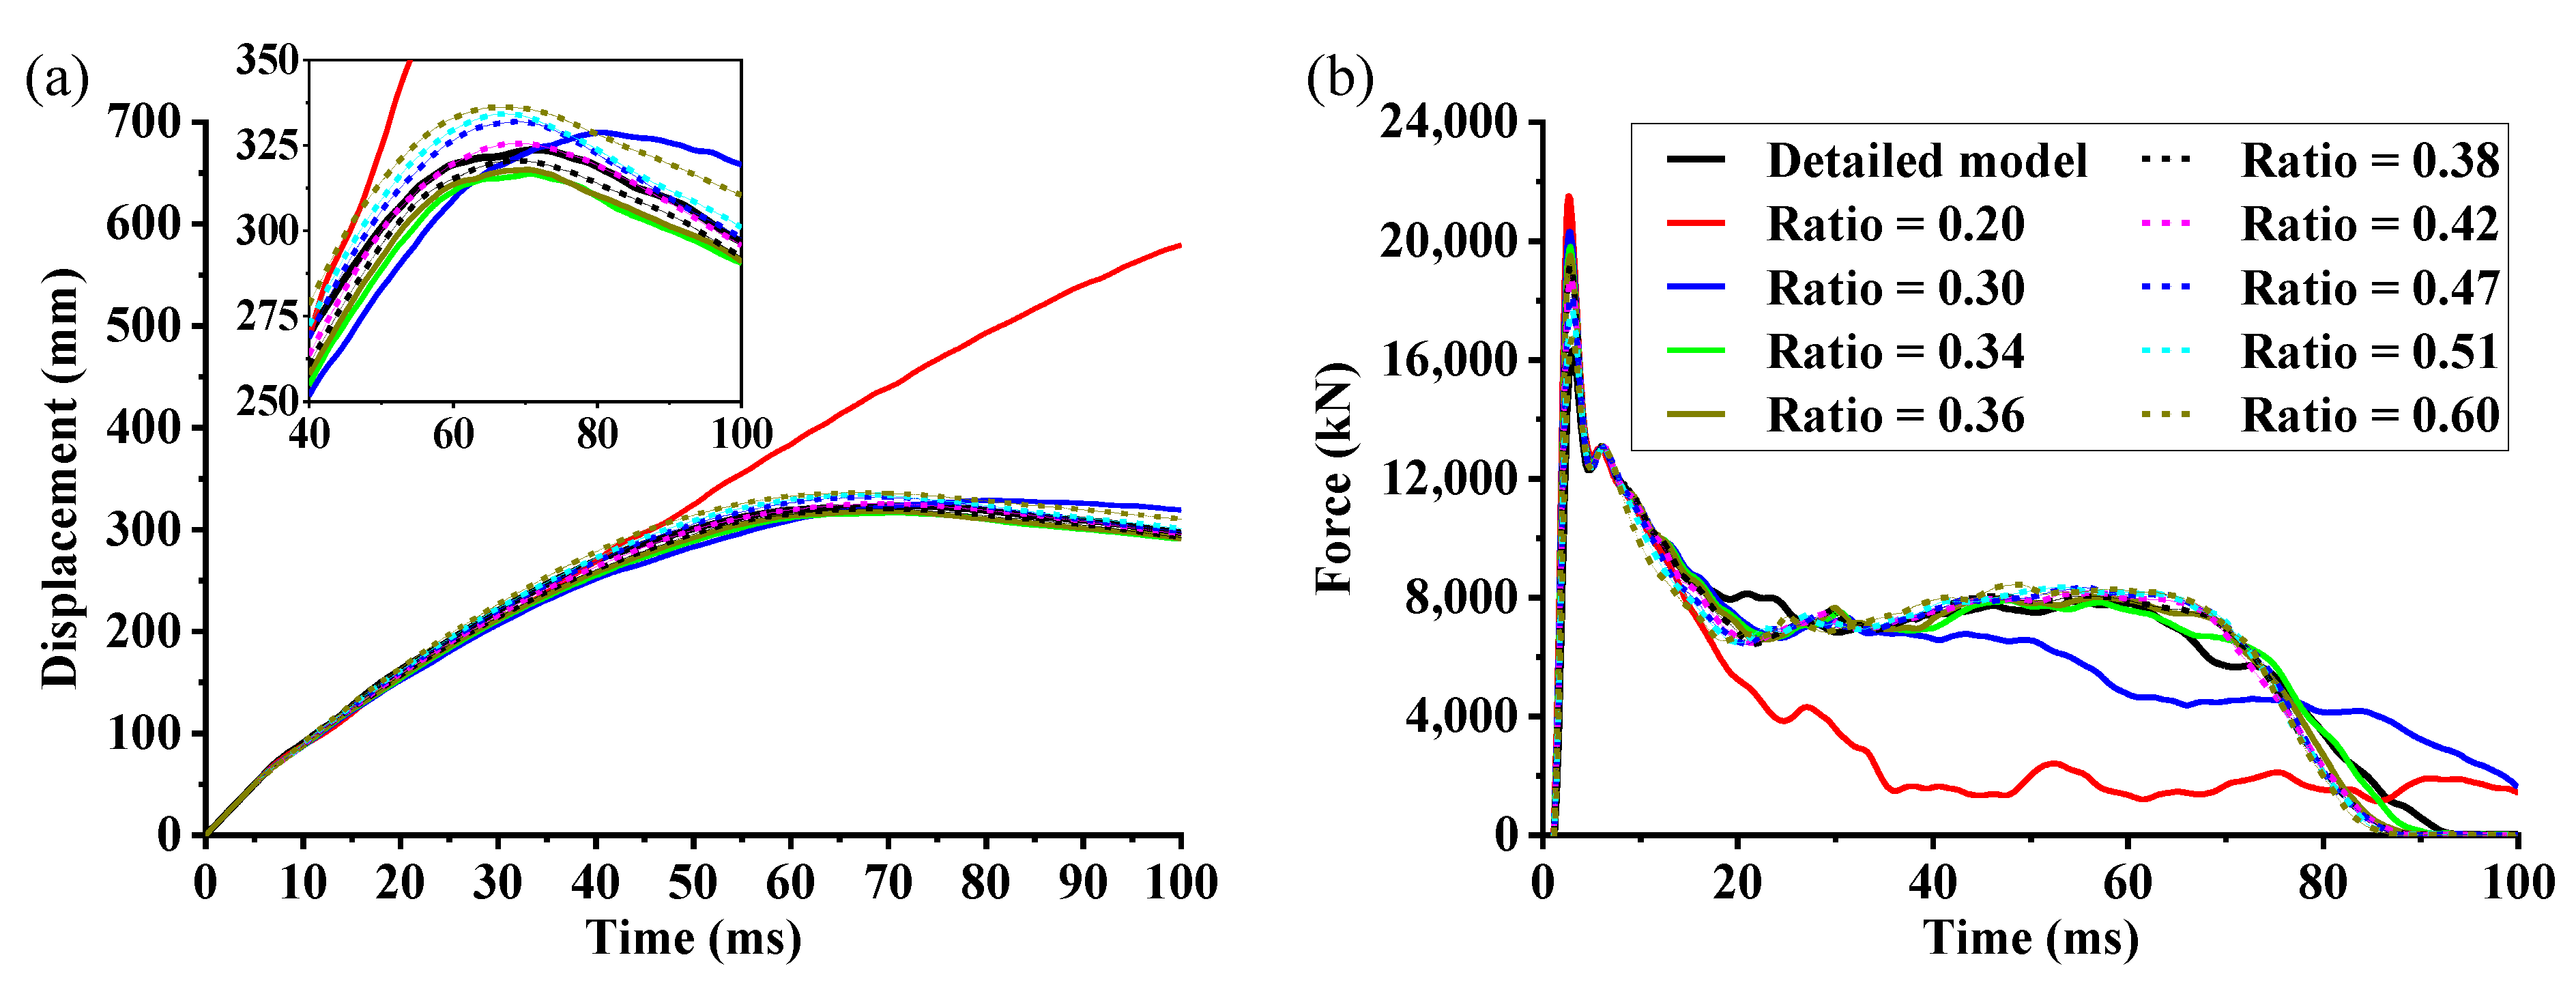
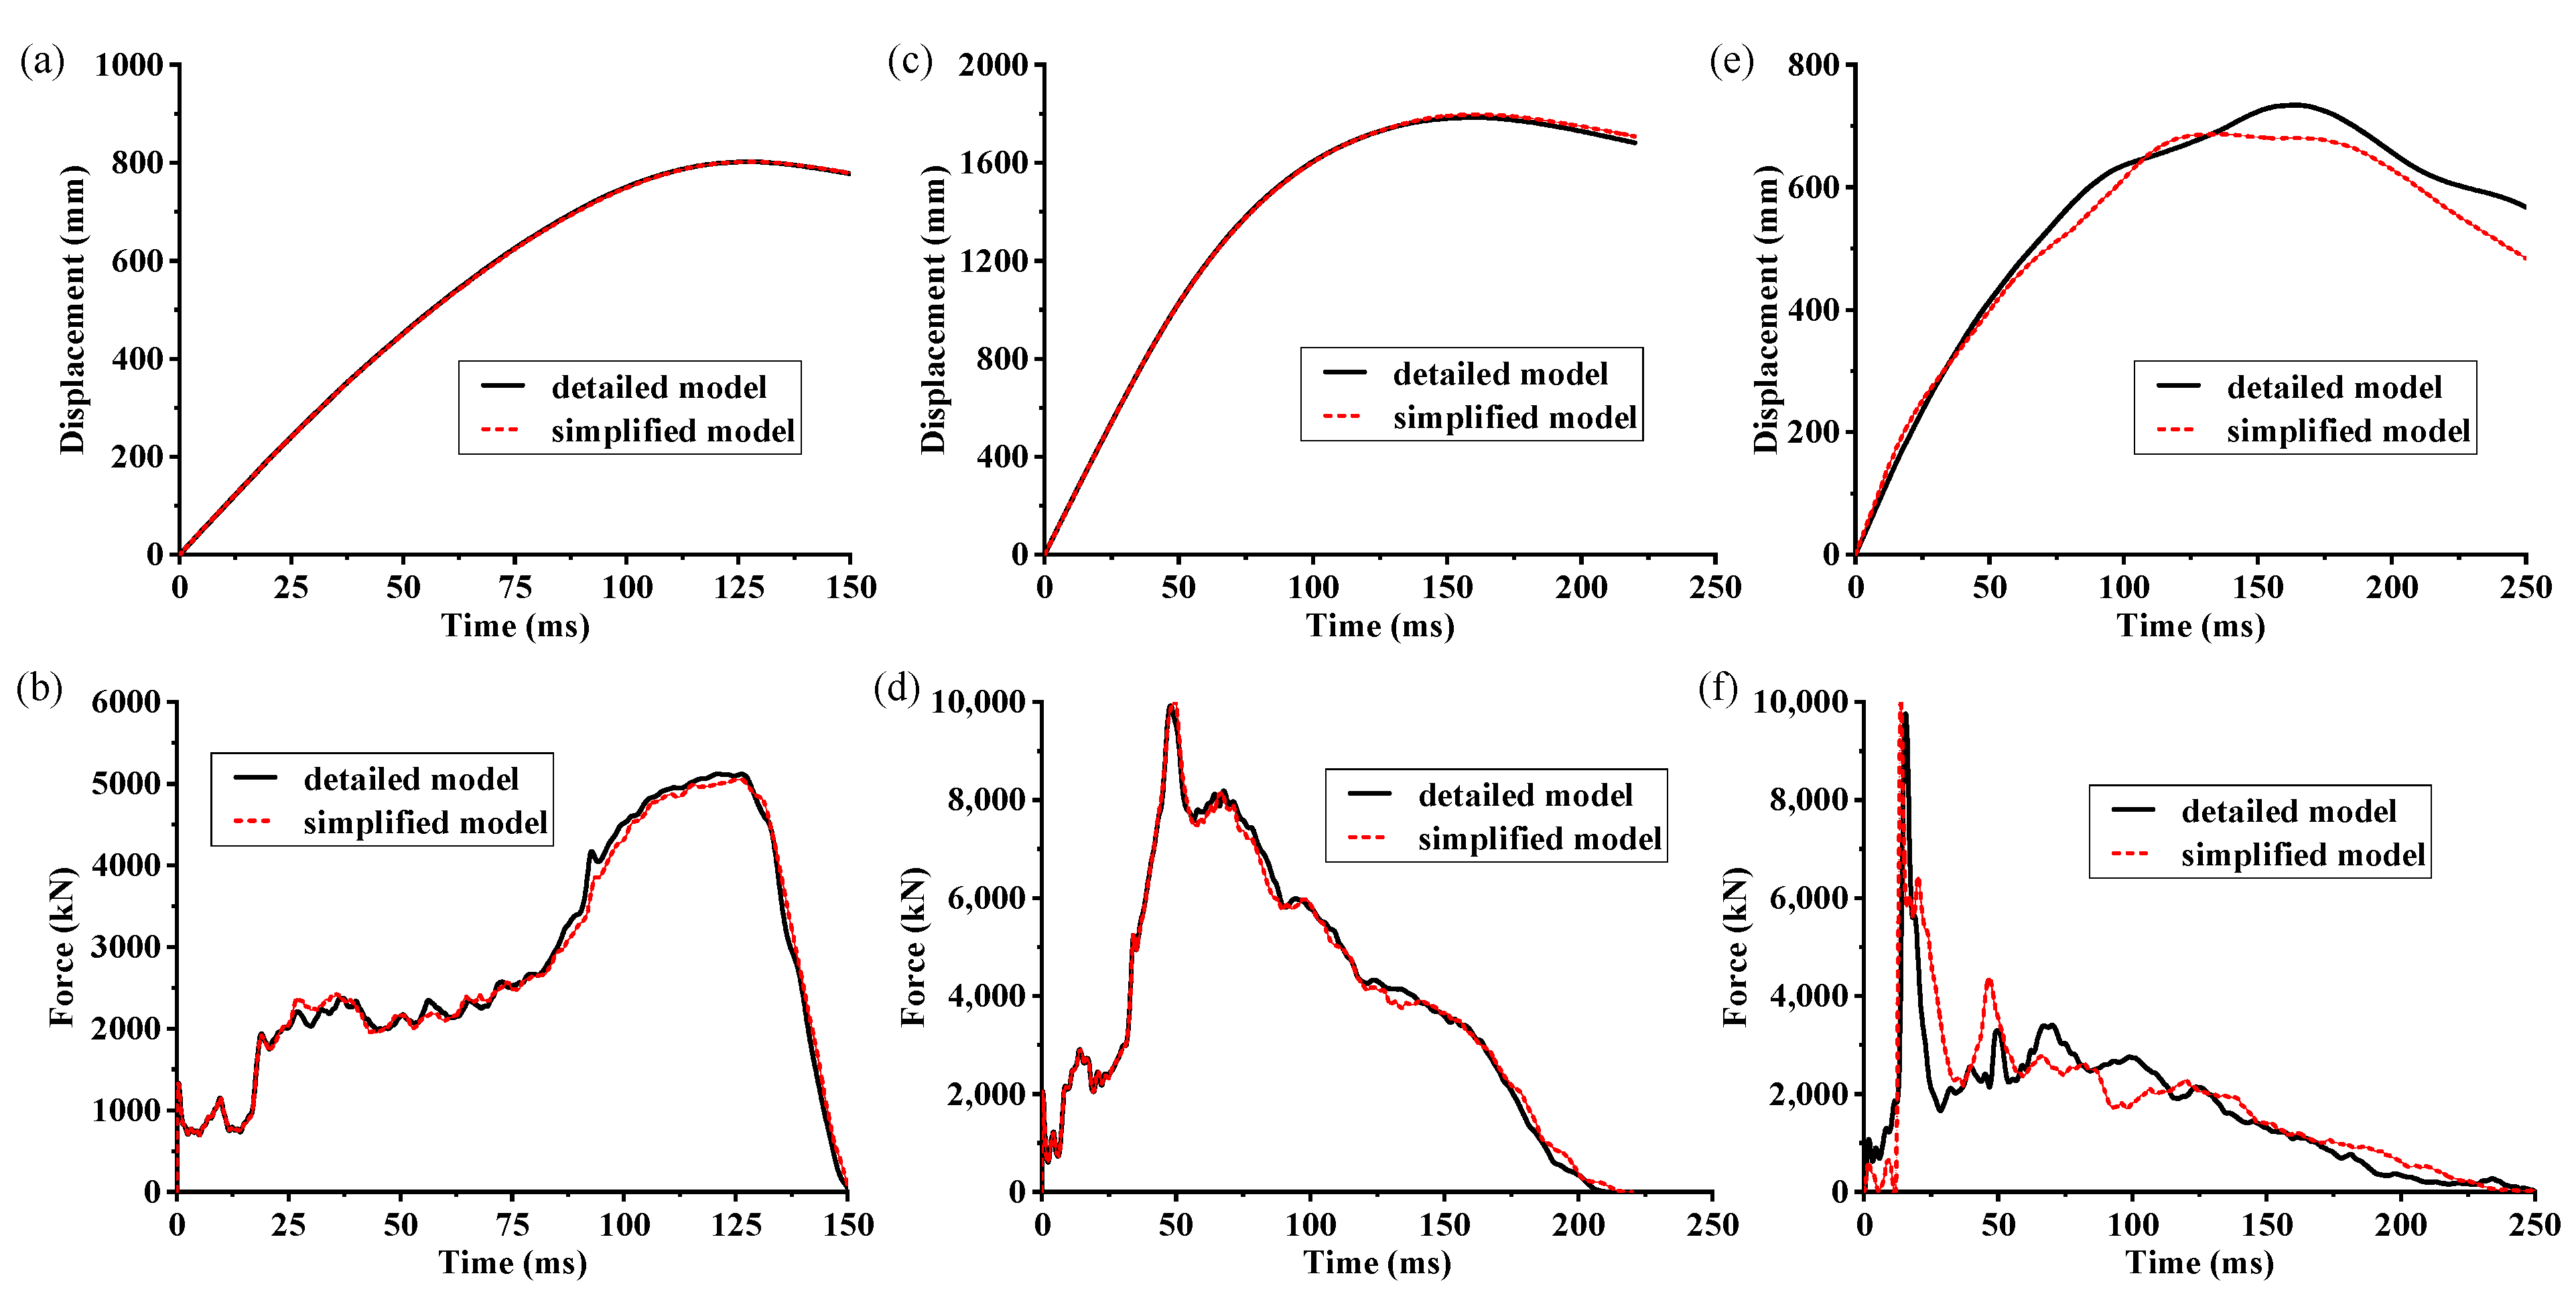
4.1. 10 m/s Longitudinal Rigid-Wall Collisions
4.2. 22.2 m/s Longitudinal Rigid-Wall Collisions
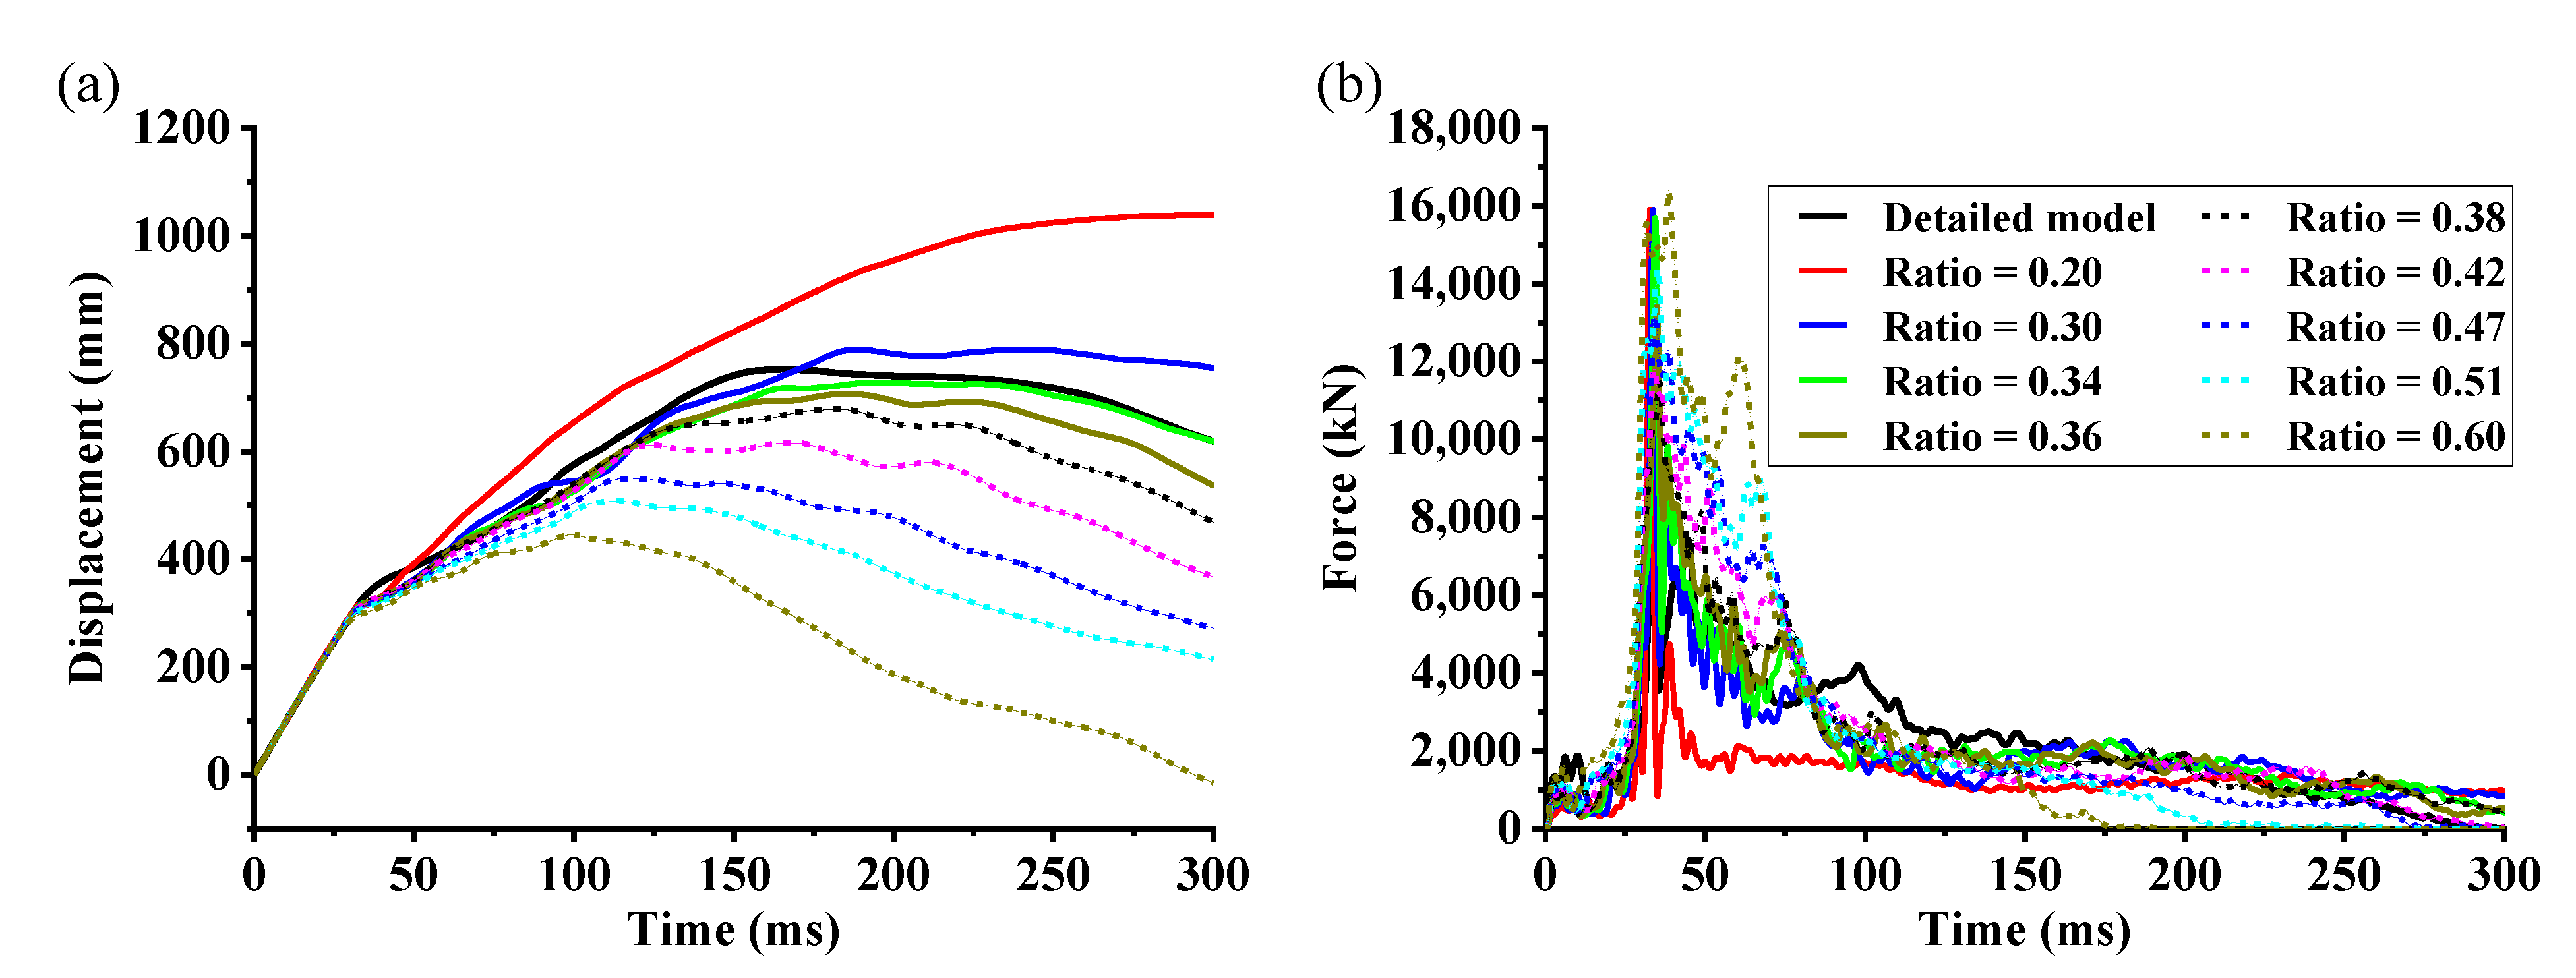
4.3. 10 m/s Lateral Rigid-Cylinder Collisions
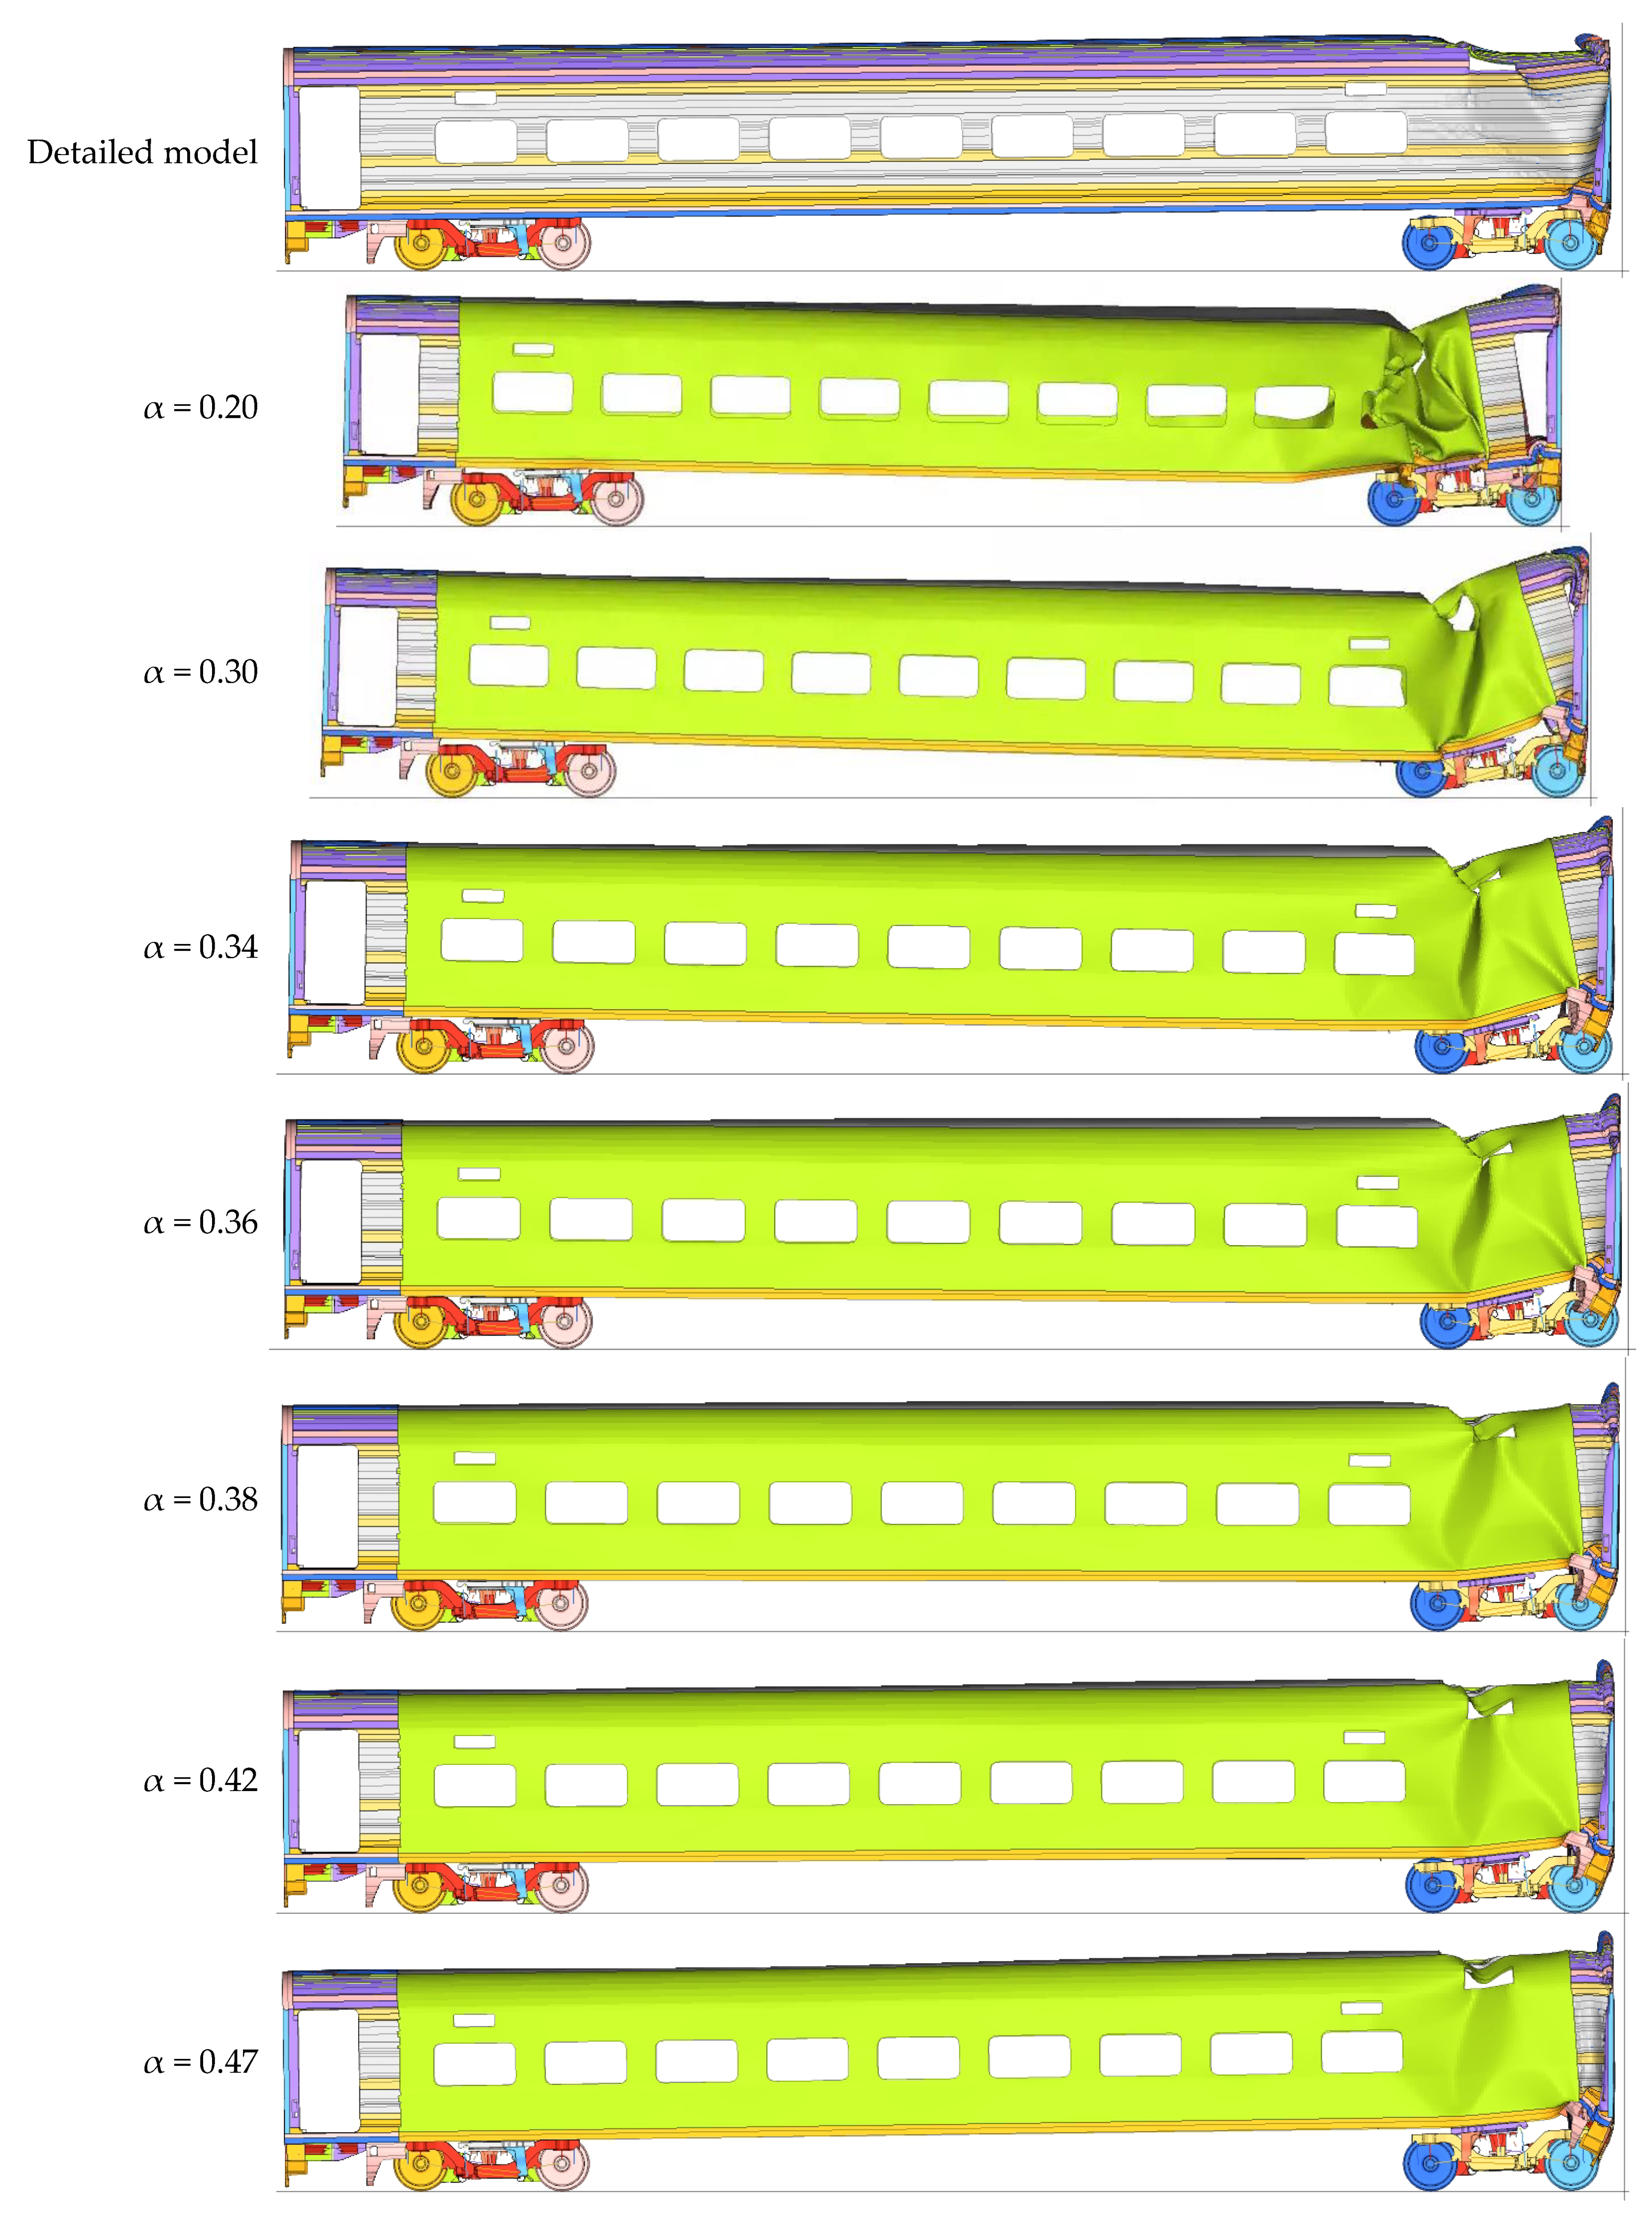
4.4. Effectiveness of the Simplification Method
4.5. Limitations
5. Conclusions
Author Contributions
Funding
Institutional Review Board Statement
Informed Consent Statement
Data Availability Statement
Conflicts of Interest
References
- Gao, G.; Wang, S. Crashworthiness of Passenger Rail Vehicles: A Review. Int. J. Crashworthiness 2019, 24, 664–676. [Google Scholar] [CrossRef]
- Li, Z.; Ma, W.; Zhu, H.; Deng, G.; Hou, L.; Xu, P.; Yao, S. Energy Absorption Prediction and Optimization of Corrugation-Reinforced Multicell Square Tubes Based on Machine Learning. Mech. Adv. Mater. Struct. 2021, 29, 1–19. [Google Scholar] [CrossRef]
- Hou, L.; Zhang, H.; Peng, Y.; Wang, S.; Yao, S.; Li, Z.; Deng, G. An Integrated Multi-Objective Optimization Method with Application to Train Crashworthiness Design. Struct. Multidiscip. Optim. 2021, 63, 1513–1532. [Google Scholar] [CrossRef]
- Carvalho, M.S.; Martins, A.P.; Milho, J. Railway Seat Design for Injury Mitigation in Crash Scenario. Int. J. Rail Transp. 2020, 8, 215–233. [Google Scholar] [CrossRef]
- Deng, G.; Wang, F.; Yu, C.; Peng, Y.; Xu, H.; Li, Z.; Hou, L.; Wang, Z. Assessment of Standing Passenger Traumatic Brain Injury Caused by Ground Impact in Subway Collisions. Accid. Anal. Prev. 2022, 166, 106547. [Google Scholar] [CrossRef]
- Deng, G.; Simms, C.; Xu, T.; Peng, Y.; Li, Z.; Hou, L.; Che, Q.; Yu, Y.; Liu, Z. Occupant head injury assessment for bullet trains using dummy crash tests. In Proceedings of the 2022 International Research Council on the Biomechanics of Injury Europe Conference (IRCOBI), Porto, Portugal, 14–16 September 2022. [Google Scholar]
- Tyrell, D.; Severson, K.; Perlman, A.B.; Rancatore, R. Train-to-Train Impact Test: Analysis of Structural Measurements. In Proceedings of the Rail Transportation, ASMEDC, New Orleans, LA, USA, 1 January 2002; pp. 109–115. [Google Scholar]
- Jacobsen, K.; Tyrell, D.; Perlman, B. Impact Test of a Crash-Energy Management Passenger Rail Car. In Proceedings of the Joint Rail, ASMEDC, Baltimore, MD, USA, 1 January 2004; pp. 19–26. [Google Scholar]
- Tyrell, D.; Jacobsen, K.; Martinez, E.; Perlman, A.B. Train-to-Train Impact Test of Crash Energy Management Passenger Rail Equipment: Structural Results. In Proceedings of the Rail Transportation, ASMEDC, Chicago, IL, USA, 1 January 2006; pp. 35–44. [Google Scholar]
- Zhao, H.; Xu, P.; Li, B.; Yao, S.; Yang, C.; Guo, W.; Xiao, X. Full-Scale Train-to-Train Impact Test and Multi-Body Dynamic Simulation Analysis. Machines 2021, 9, 297. [Google Scholar] [CrossRef]
- Yao, S.; Zhu, H.; Liu, M.; Li, Z.; Xu, P.; Che, Q. A Study on the Frontal Oblique Collision-Induced Derailment Mechanism in Subway Vehicles. Proc. Inst. Mech. Eng. Part F J. Rail Rapid Transit. 2020, 234, 584–595. [Google Scholar] [CrossRef]
- Hou, L.; Peng, Y.; Sun, D. Dynamic Analysis of Railway Vehicle Derailment Mechanism in Train-to-Train Collision Accidents. Proc. Inst. Mech. Eng. Part F J. Rail Rapid Transit. 2021, 235, 1022–1034. [Google Scholar] [CrossRef]
- Han, H.S.; Koo, J.S. Simulation of train crashes in three dimensions. Veh. Syst. Dyn. 2003, 40, 435–450. [Google Scholar] [CrossRef]
- Cole, C.; Spiryagin, M.; Wu, Q.; Sun, Y.Q. Modelling, Simulation and Applications of Longitudinal Train Dynamics. Veh. Syst. Dyn. 2017, 55, 1498–1571. [Google Scholar] [CrossRef]
- BS EN 15227; Railway Applications—Crashworthiness Requirements for Rail Vehicles. British Standard Committee: Chiswick, UK, 2020.
- Yao, S.; Zhu, H.; Yan, K.; Liu, M.; Xu, P. The Derailment Behaviour and Mechanism of a Subway Train under Frontal Oblique Collisions. Int. J. Crashworthiness 2021, 26, 133–146. [Google Scholar] [CrossRef]
- Afazov, S.; Denmark, W.; Yaghi, A. Modelling Aspects of the Design of Railway Vehicle Structures and Their Crashworthiness. Proc. Inst. Mech. Eng. Part F J. Rail Rapid Transit. 2016, 230, 1575–1589. [Google Scholar] [CrossRef]
- Lu, S.; Xu, P.; Yan, K.; Yao, S.; Li, B. A force/stiffness equivalence method for the scaled modelling of a high-speed train head car. Thin-Walled Struct. 2019, 137, 129–142. [Google Scholar] [CrossRef]
- Lu, S.; Wang, P.; Ni, W.; Yan, K.; Zhao, S.; Yang, C.; Xu, P. Energy absorption design for crash energy management passenger trains based on scaled model. Struct. Multidiscip. Optim. 2022, 65, 2. [Google Scholar] [CrossRef]
- Xie, S.; Yang, W.; Xu, P. Simulation Analysis of a Multiple-Vehicle, High-Speed Train Collision Using a Simplified Model. Shock Vib. 2018, 2018, 9504141. [Google Scholar] [CrossRef] [Green Version]
- Li, B.; Lu, Z.; Yan, K.; Lu, S.; Kong, L.; Xu, P. Experimental Study of a Honeycomb Energy-Absorbing Device for High-Speed Trains. Proc. Inst. Mech. Eng. Part F J. Rail Rapid Transit. 2020, 234, 1170–1183. [Google Scholar] [CrossRef]
- Deng, G.; Peng, Y.; Yan, C.; Wen, B. Running Safety Evaluation of a 350 km/h High-Speed Freight Train Negotiating a Curve Based on the Arbitrary Lagrangian-Eulerian Method. Proc. Inst. Mech. Eng. Part F J. Rail Rapid Transit. 2021, 235, 1143–1157. [Google Scholar] [CrossRef]
- Chen, X.; Peng, Y.; Peng, S.; Yao, S.; Chen, C.; Xu, P. Flow and Fracture Behavior of Aluminum Alloy 6082-T6 at Different Tensile Strain Rates and Triaxialities. PLoS ONE 2017, 12, e0181983. [Google Scholar] [CrossRef] [Green Version]
- Peng, Y.; Chen, X.; Peng, S.; Chen, C.; Li, J.; Liu, G. Strain Rate-Dependent Constitutive and Low Stress Triaxiality Fracture Behavior Investigation of 6005 Al Alloy. Adv. Mater. Sci. Eng. 2018, 2018, 2712937. [Google Scholar] [CrossRef] [Green Version]
- Qin, R.; Gao, F.; Wang, T.; Chen, B. Numerical simulation of bearing capacity of carbody for high-speed train subjected to longitudinal impact. J. Traffic Transp. Eng. 2021, 21, 209–224. [Google Scholar] [CrossRef]
- TB/T 3500-2018; Crashworthiness Requirements and Verification Specification for Car Body of EMU/DMU. National Railway Administration: Beijing, China, 2018.
- Gehre, C.; Gades, H. Objective Rating of Signals Using Test and Simulation Responses. In Proceedings of the International Technical Conference on the Enhanced Safety of Vehicles Conference (ESV), Stuttgart, Germany, 15–18 June 2009; pp. 9–407. [Google Scholar]
- Barbat, S.; Fu, Y.; Zhan, Z.; Yang, R.-J.; Gehre, C. Objective Rating Metric for Dynamic Systems. In Proceedings of the International Technical Conference on the Enhanced Safety of Vehicles Conference (ESV), Seoul, Republic of Korea, 27–30 May 2013. [Google Scholar]
- ISO/TS 18571; Road Vehicles—Objective Rating Metric for Non-Ambiguous Signals. International Organization for Standardization: Geneva, Switzerland, 2014.
- Yu, C.; Wang, F.; Wang, B.; Li, G.; Li, F. A Computational Biomechanics Human Body Model Coupling Finite Element and Multibody Segments for Assessment of Head/Brain Injuries in Car-To-Pedestrian Collisions. Int. J. Environ. Res. Public. Health. 2020, 17, 492. [Google Scholar] [CrossRef] [PubMed] [Green Version]
- Poulard, D.; Kent, R.W.; Kindig, M.; Li, Z.; Subit, D. Thoracic Response Targets for a Computational Model: A Hierarchical Approach to Assess the Biofidelity of a 50th-Percentile Occupant Male Finite Element Model. J. Mech. Behav. Biomed. Mater. 2015, 45, 45–64. [Google Scholar] [CrossRef] [PubMed]


| Aluminum Alloy | Density (kg/m3) | Poisson’s Ratio | Young’s Modulus (GPa) | Yield Stress (MPa) | Ultimate Strength (MPa) | Tangent Modulus (MPa) |
|---|---|---|---|---|---|---|
| 6082-T6 | 2700 | 0.3 | 71 | 260 | 310 | 250 |
| 6005A | 2700 | 0.3 | 71 | 215 | 255 | 200 |
| Case | Thickness Ratio | Signal | Corridor Score (%) | Cross-correlation Metric (%) | Cross Correlation Score (%) | Total CORA (%) | ||
|---|---|---|---|---|---|---|---|---|
| Shape Score | Phase Score | Size Score | ||||||
| 10 m/s longitudinal crash | 0.20 | Displacement | 49.43 | 82.03 | 100 | 41.62 | 74.55 | 64.50 |
| Force | 48.90 | 43.29 | 100 | 52.95 | 65.41 | 58.81 | ||
| 0.30 | Displacement | 97.26 | 99.18 | 100 | 97.94 | 99.04 | 98.33 | |
| Force | 83.92 | 87.34 | 100 | 92.93 | 93.42 | 89.62 | ||
| 0.34 | Displacement | 100 | 99.97 | 100 | 94.08 | 98.02 | 98.81 | |
| Force | 98.13 | 97.85 | 100 | 95.99 | 97.95 | 98.02 | ||
| 0.36 | Displacement | 100 | 99.98 | 100 | 95.00 | 98.33 | 99.00 | |
| Force | 97.13 | 97.36 | 100 | 95.21 | 97.52 | 97.37 | ||
| 0.38 | Displacement | 100 | 99.99 | 100 | 96.69 | 98.89 | 99.34 | |
| Force | 96.58 | 97.13 | 100 | 95.44 | 97.52 | 97.15 | ||
| 0.42 | Displacement | 100 | 99.98 | 100 | 99.29 | 99.76 | 99.86 | |
| Force | 96.78 | 97.30 | 100 | 96.51 | 97.93 | 97.47 | ||
| 0.47 | Displacement | 100 | 99.97 | 100 | 97.93 | 99.30 | 99.58 | |
| Force | 96.41 | 97.22 | 100 | 96.59 | 97.93 | 97.33 | ||
| 0.51 | Displacement | 100 | 99.97 | 100 | 96.05 | 98.68 | 99.21 | |
| Force | 96.38 | 97.06 | 100 | 97.59 | 98.22 | 97.48 | ||
| 0.60 | Displacement | 100 | 99.98 | 100 | 92.55 | 97.51 | 98.51 | |
| Force | 95.87 | 96.65 | 100 | 99.17 | 98.60 | 97.51 | ||
| 22.2 m/s longitudinal crash | 0.20 | Displacement | 40.97 | 88.14 | 100 | 41.69 | 76.61 | 62.35 |
| Force | 67.87 | 48.94 | 100 | 71.50 | 73.48 | 71.24 | ||
| 0.30 | Displacement | 71.18 | 97.95 | 100 | 75.66 | 91.20 | 83.20 | |
| Force | 79.27 | 67.60 | 100 | 87.95 | 85.18 | 82.82 | ||
| 0.34 | Displacement | 93.46 | 99.53 | 100 | 89.94 | 96.49 | 95.28 | |
| Force | 81.00 | 70.05 | 100 | 98.48 | 89.51 | 86.11 | ||
| 0.36 | Displacement | 98.18 | 99.67 | 100 | 93.95 | 97.87 | 97.99 | |
| Force | 88.89 | 83.55 | 100 | 94.78 | 92.78 | 91.22 | ||
| 0.38 | Displacement | 100 | 99.94 | 100 | 95.49 | 98.48 | 99.09 | |
| Force | 95.65 | 92.70 | 100 | 98.16 | 96.95 | 96.43 | ||
| 0.42 | Displacement | 97.67 | 99.94 | 100 | 89.17 | 96.37 | 96.89 | |
| Force | 95.42 | 93.30 | 100 | 95.96 | 96.42 | 96.02 | ||
| 0.47 | Displacement | 92.38 | 99.86 | 100 | 85.90 | 95.25 | 94.10 | |
| Force | 93.70 | 91.30 | 100 | 94.70 | 95.34 | 94.68 | ||
| 0.51 | Displacement | 85.31 | 99.63 | 100 | 81.62 | 93.75 | 90.38 | |
| Force | 88.38 | 85.09 | 100 | 88.66 | 91.25 | 90.10 | ||
| 0.60 | Displacement | 79.72 | 99.29 | 100 | 78.24 | 92.51 | 87.39 | |
| Force | 81.25 | 75.45 | 100 | 81.63 | 85.69 | 83.92 | ||
| 10 m/s lateral crash | 0.20 | Displacement | 40.30 | 89.30 | 100 | 48.50 | 79.27 | 63.68 |
| Force | 69.43 | 34.50 | 100 | 48.56 | 61.02 | 64.38 | ||
| 0.30 | Displacement | 84.17 | 97.98 | 100 | 85.44 | 94.47 | 90.35 | |
| Force | 85.06 | 64.14 | 100 | 97.14 | 87.09 | 86.28 | ||
| 0.34 | Displacement | 98.67 | 99.78 | 100 | 92.94 | 97.57 | 98.01 | |
| Force | 89.66 | 67.02 | 100 | 84.42 | 83.81 | 86.15 | ||
| 0.36 | Displacement | 86.32 | 98.84 | 100 | 82.26 | 93.70 | 90.75 | |
| Force | 89.25 | 69.73 | 100 | 77.02 | 82.25 | 85.05 | ||
| 0.38 | Displacement | 69.39 | 96.28 | 100 | 71.65 | 89.31 | 81.34 | |
| Force | 87.28 | 69.41 | 100 | 69.25 | 79.55 | 82.64 | ||
| 0.42 | Displacement | 48.71 | 88.85 | 100 | 55.72 | 81.52 | 68.40 | |
| Force | 84.22 | 69.18 | 100 | 59.49 | 76.22 | 79.42 | ||
| 0.47 | Displacement | 34.45 | 78.11 | 100 | 39.86 | 72.66 | 57.37 | |
| Force | 79.45 | 59.28 | 100 | 49.30 | 69.53 | 73.50 | ||
| 0.51 | Displacement | 29.74 | 65.71 | 100 | 30.30 | 65.34 | 51.10 | |
| Force | 73.66 | 51.86 | 100 | 42.89 | 64.92 | 68.42 | ||
| 0.60 | Displacement | 25.20 | 10.12 | 100 | 18.47 | 42.86 | 35.80 | |
| Force | 69.00 | 42.68 | 100 | 32.59 | 58.42 | 62.65 | ||
| Impact Simulations | Impact Duration (ms) | Calculate Time (h) | Time Reduction (%) | |
|---|---|---|---|---|
| Original Detailed Model | Simplified Model | |||
| 10 m/s longitudinal crash | 100 | 4 | 1.8 | 55 |
| 22.2 m/s longitudinal crash | 250 | 9.5 | 4.2 | 56 |
| 10 m/s lateral crash | 300 | 11.2 | 5 | 55 |
Publisher’s Note: MDPI stays neutral with regard to jurisdictional claims in published maps and institutional affiliations. |
© 2022 by the authors. Licensee MDPI, Basel, Switzerland. This article is an open access article distributed under the terms and conditions of the Creative Commons Attribution (CC BY) license (https://creativecommons.org/licenses/by/4.0/).
Share and Cite
Deng, G.; Peng, Y.; Hou, L.; Li, Z.; Li, B.; Yu, C.; Simms, C. A Novel Simplified FE Rail Vehicle Model in Longitudinal and Lateral Collisions. Machines 2022, 10, 1214. https://doi.org/10.3390/machines10121214
Deng G, Peng Y, Hou L, Li Z, Li B, Yu C, Simms C. A Novel Simplified FE Rail Vehicle Model in Longitudinal and Lateral Collisions. Machines. 2022; 10(12):1214. https://doi.org/10.3390/machines10121214
Chicago/Turabian StyleDeng, Gongxun, Yong Peng, Lin Hou, Zhixiang Li, Benhuai Li, Chao Yu, and Ciaran Simms. 2022. "A Novel Simplified FE Rail Vehicle Model in Longitudinal and Lateral Collisions" Machines 10, no. 12: 1214. https://doi.org/10.3390/machines10121214