2.4. Computational Fluid Dynamics Results
The dimensionless pressure coefficient,
Cp, and Δ
H/
H are reference values for quantifying the intensity of pressure pulsations in pump-turbines, as shown in Equation (4).
where
Cp is the dimensionless pressure pulsation coefficient (%),
is the corresponding pressure at point
i (Pa),
is the time-averaged pressure,
H is the head (m),
ρ is the density of water, and
g is the gravitational acceleration. Δ
H is the pressure pulsation peak-to-peak value, m;
is the corresponding maximum and minimum pressure values at point
i, Pa.
Figure 4 and
Figure 5 show the time-domain and frequency-domain plots of the pressure pulsation monitoring point, VL6 of the prototype test, respectively, where
f1 is the blade-passing frequency (BPF), 9
fn. As seen in the figure, the primary frequency of the pressure pulsation monitoring point, VL6, in the vaneless space of the prototype test was BPF 9
fn (i.e., 73.32 Hz), and the relative pressure pulsation amplitude was 1.97%. The secondary frequency was 18
fn, that is, 146.91 Hz, and the relative pressure pulsation amplitude was 0.94%. Additionally, the relative pressure pulsation amplitude, 4
fn, was relatively small (32.58 Hz) at a relative pressure pulsation amplitude of 0.28%.
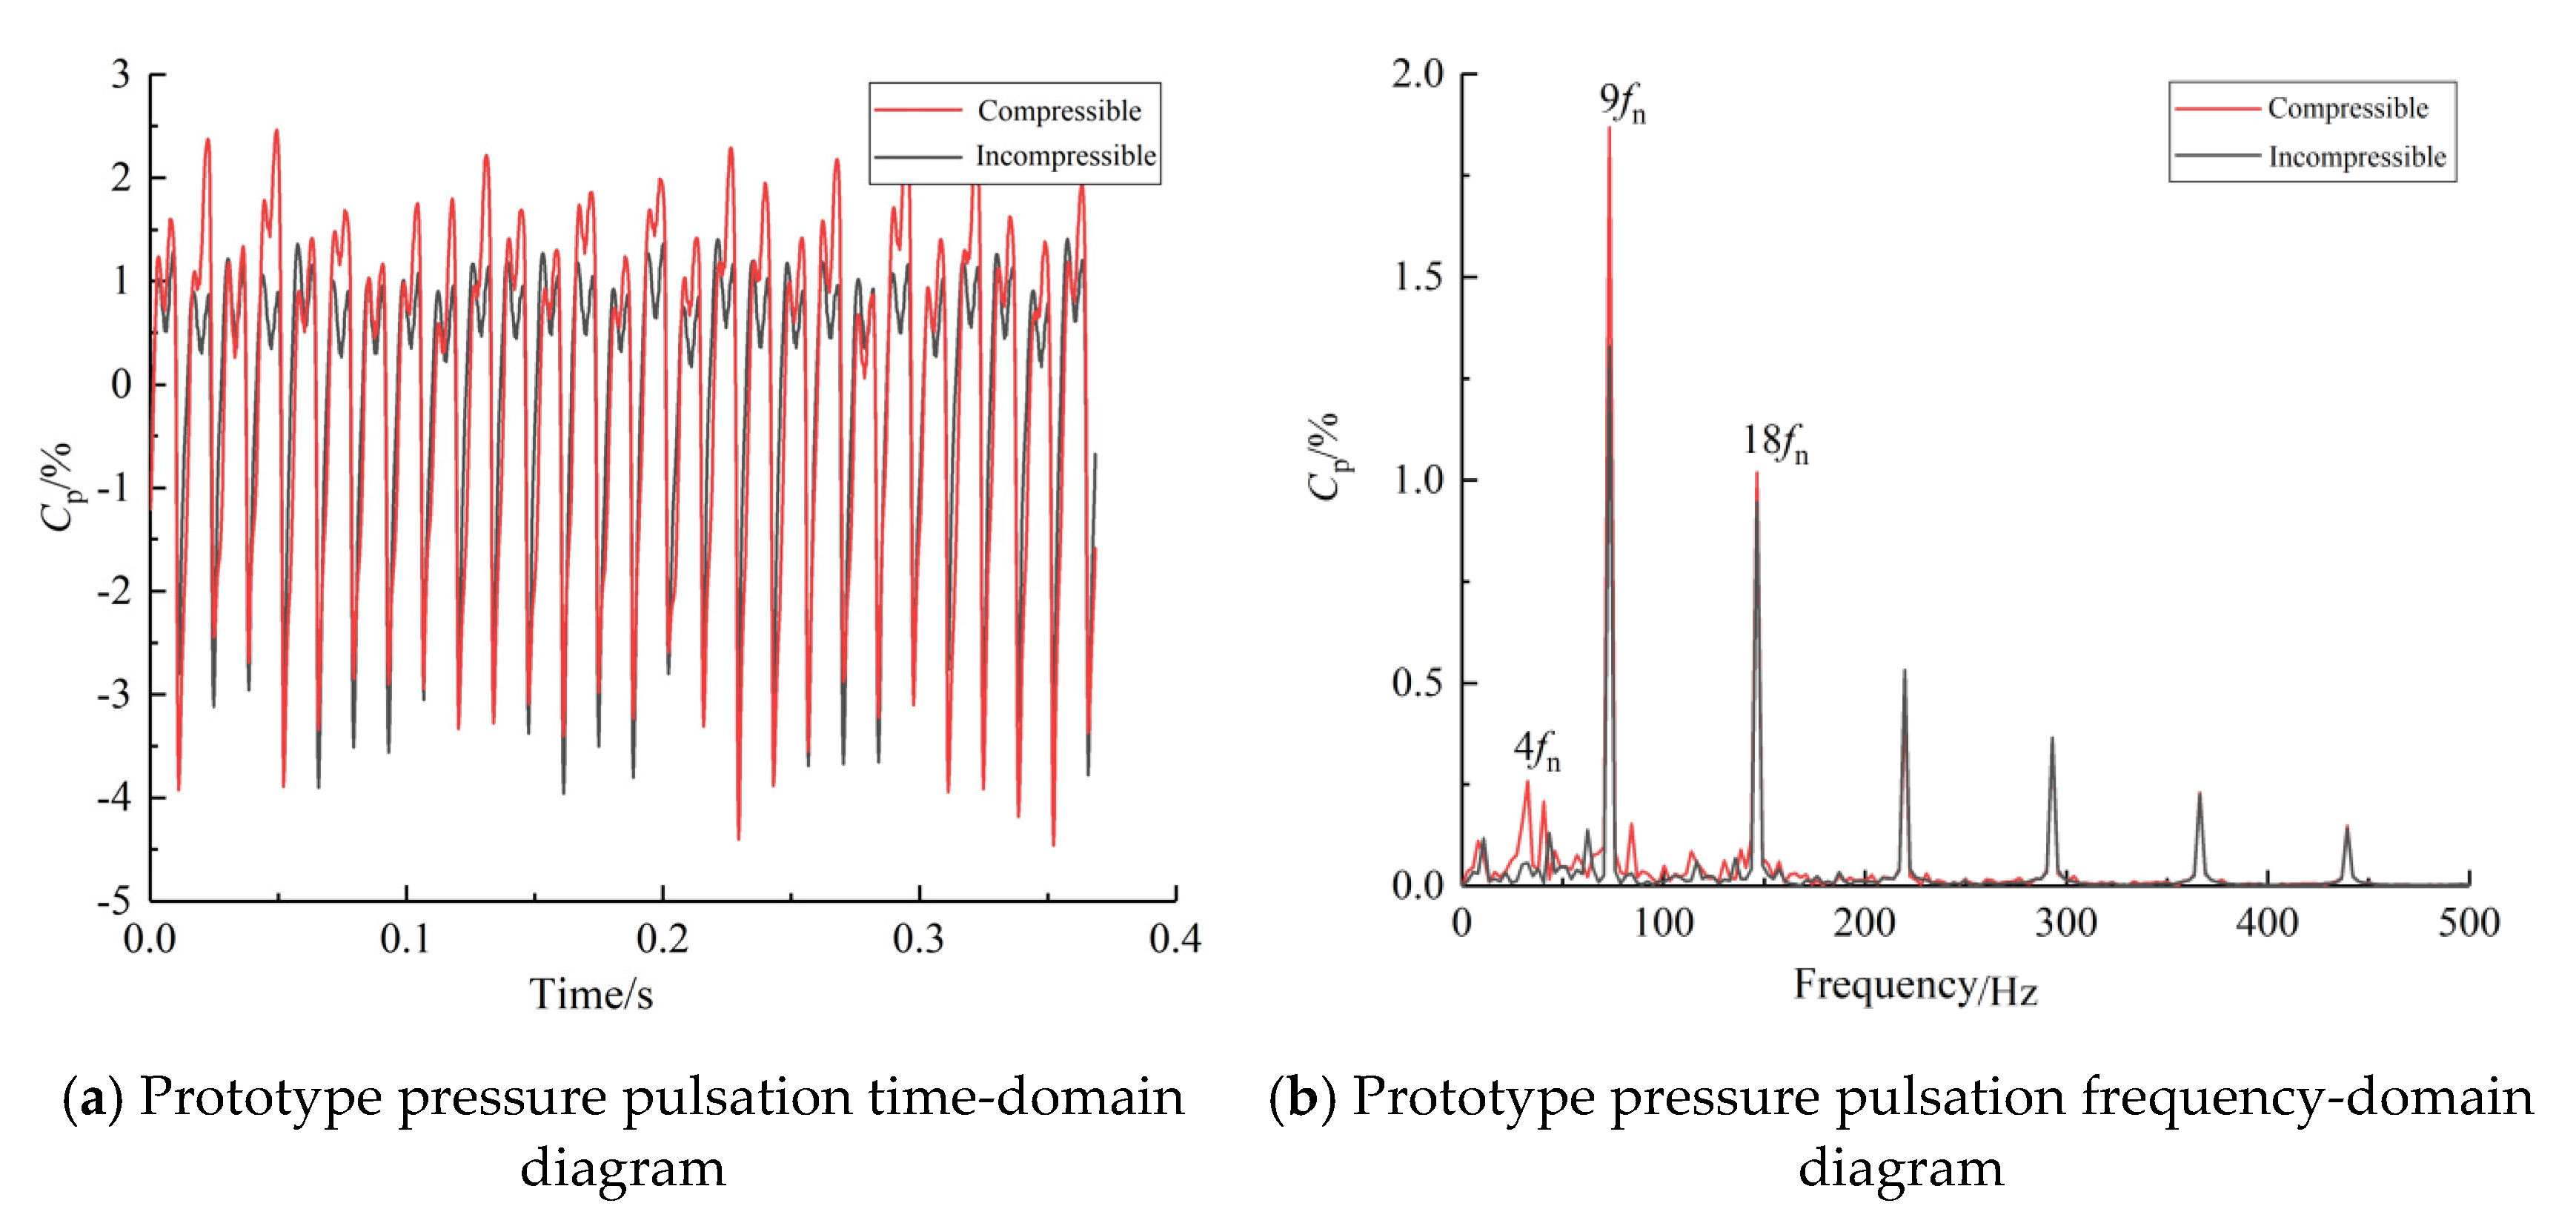
Figure 6 shows the frequency-domain and time-domain diagrams of pressure pulsation considering the compressible and non-compressible cases of water. Evidently, both the compressible and non-compressible simulations can better reflect the main frequencies in the prototype test, but the difference in their prediction of the main frequency amplitude is relatively large. The main frequency
f1 relative pressure pulsation amplitude is 1.32% in the incompressible simulation, while the
f1 relative pressure pulsation amplitude is 1.86% in the compressible simulation, which is closer to the prototype test results. In addition, the incompressible simulation fails to obtain the characteristic frequency,
f3, while the relative pressure pulsation amplitude of the characteristic frequency
f3 in the compressible simulation is 0.25%.
Figure 6b shows the time-domain diagram of the pressure pulsation of the pressure monitoring point VL6 in the vaneless space within one rotating cycle of the runner considering the compressible and non-compressible cases of the water, and the pressure pulsation in the vaneless space within one rotating cycle of the runner in both the compressible and non-compressible simulations shows periodic changes, but the relative pressure pulsation amplitude in the weakly compressible condition is larger than that in the non-compressible condition. Therefore, the results yielded when the weak compressibility of the water in the numerical simulation is considered are closer to those of the prototype test than the results yielded when the compressibility of the water is not considered.
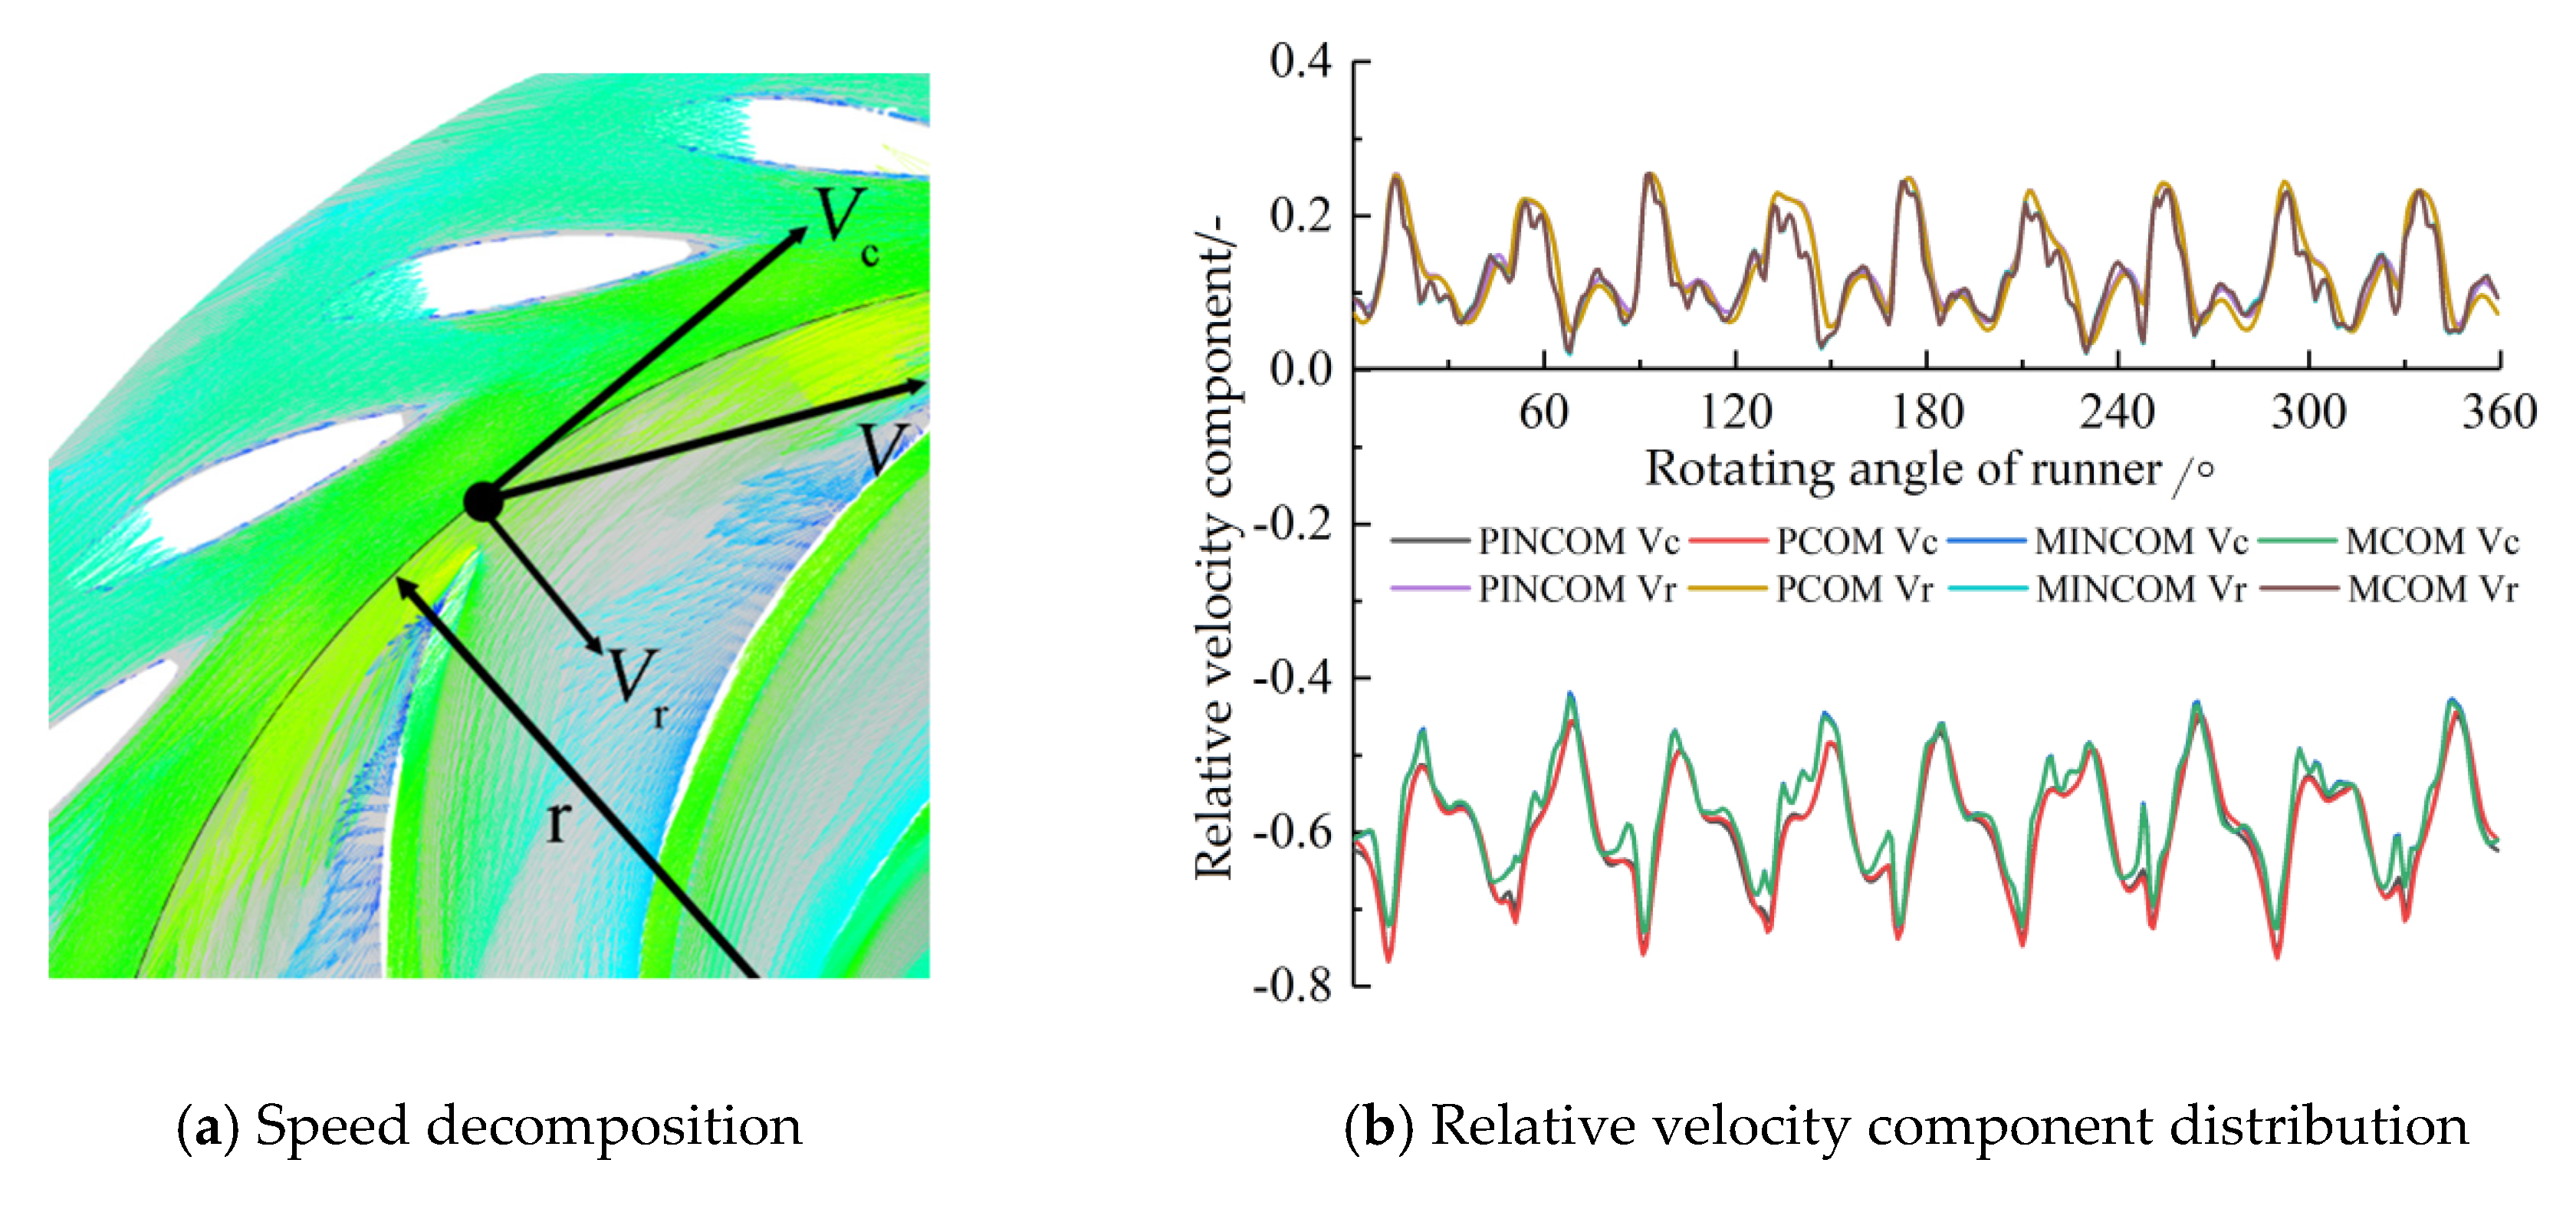
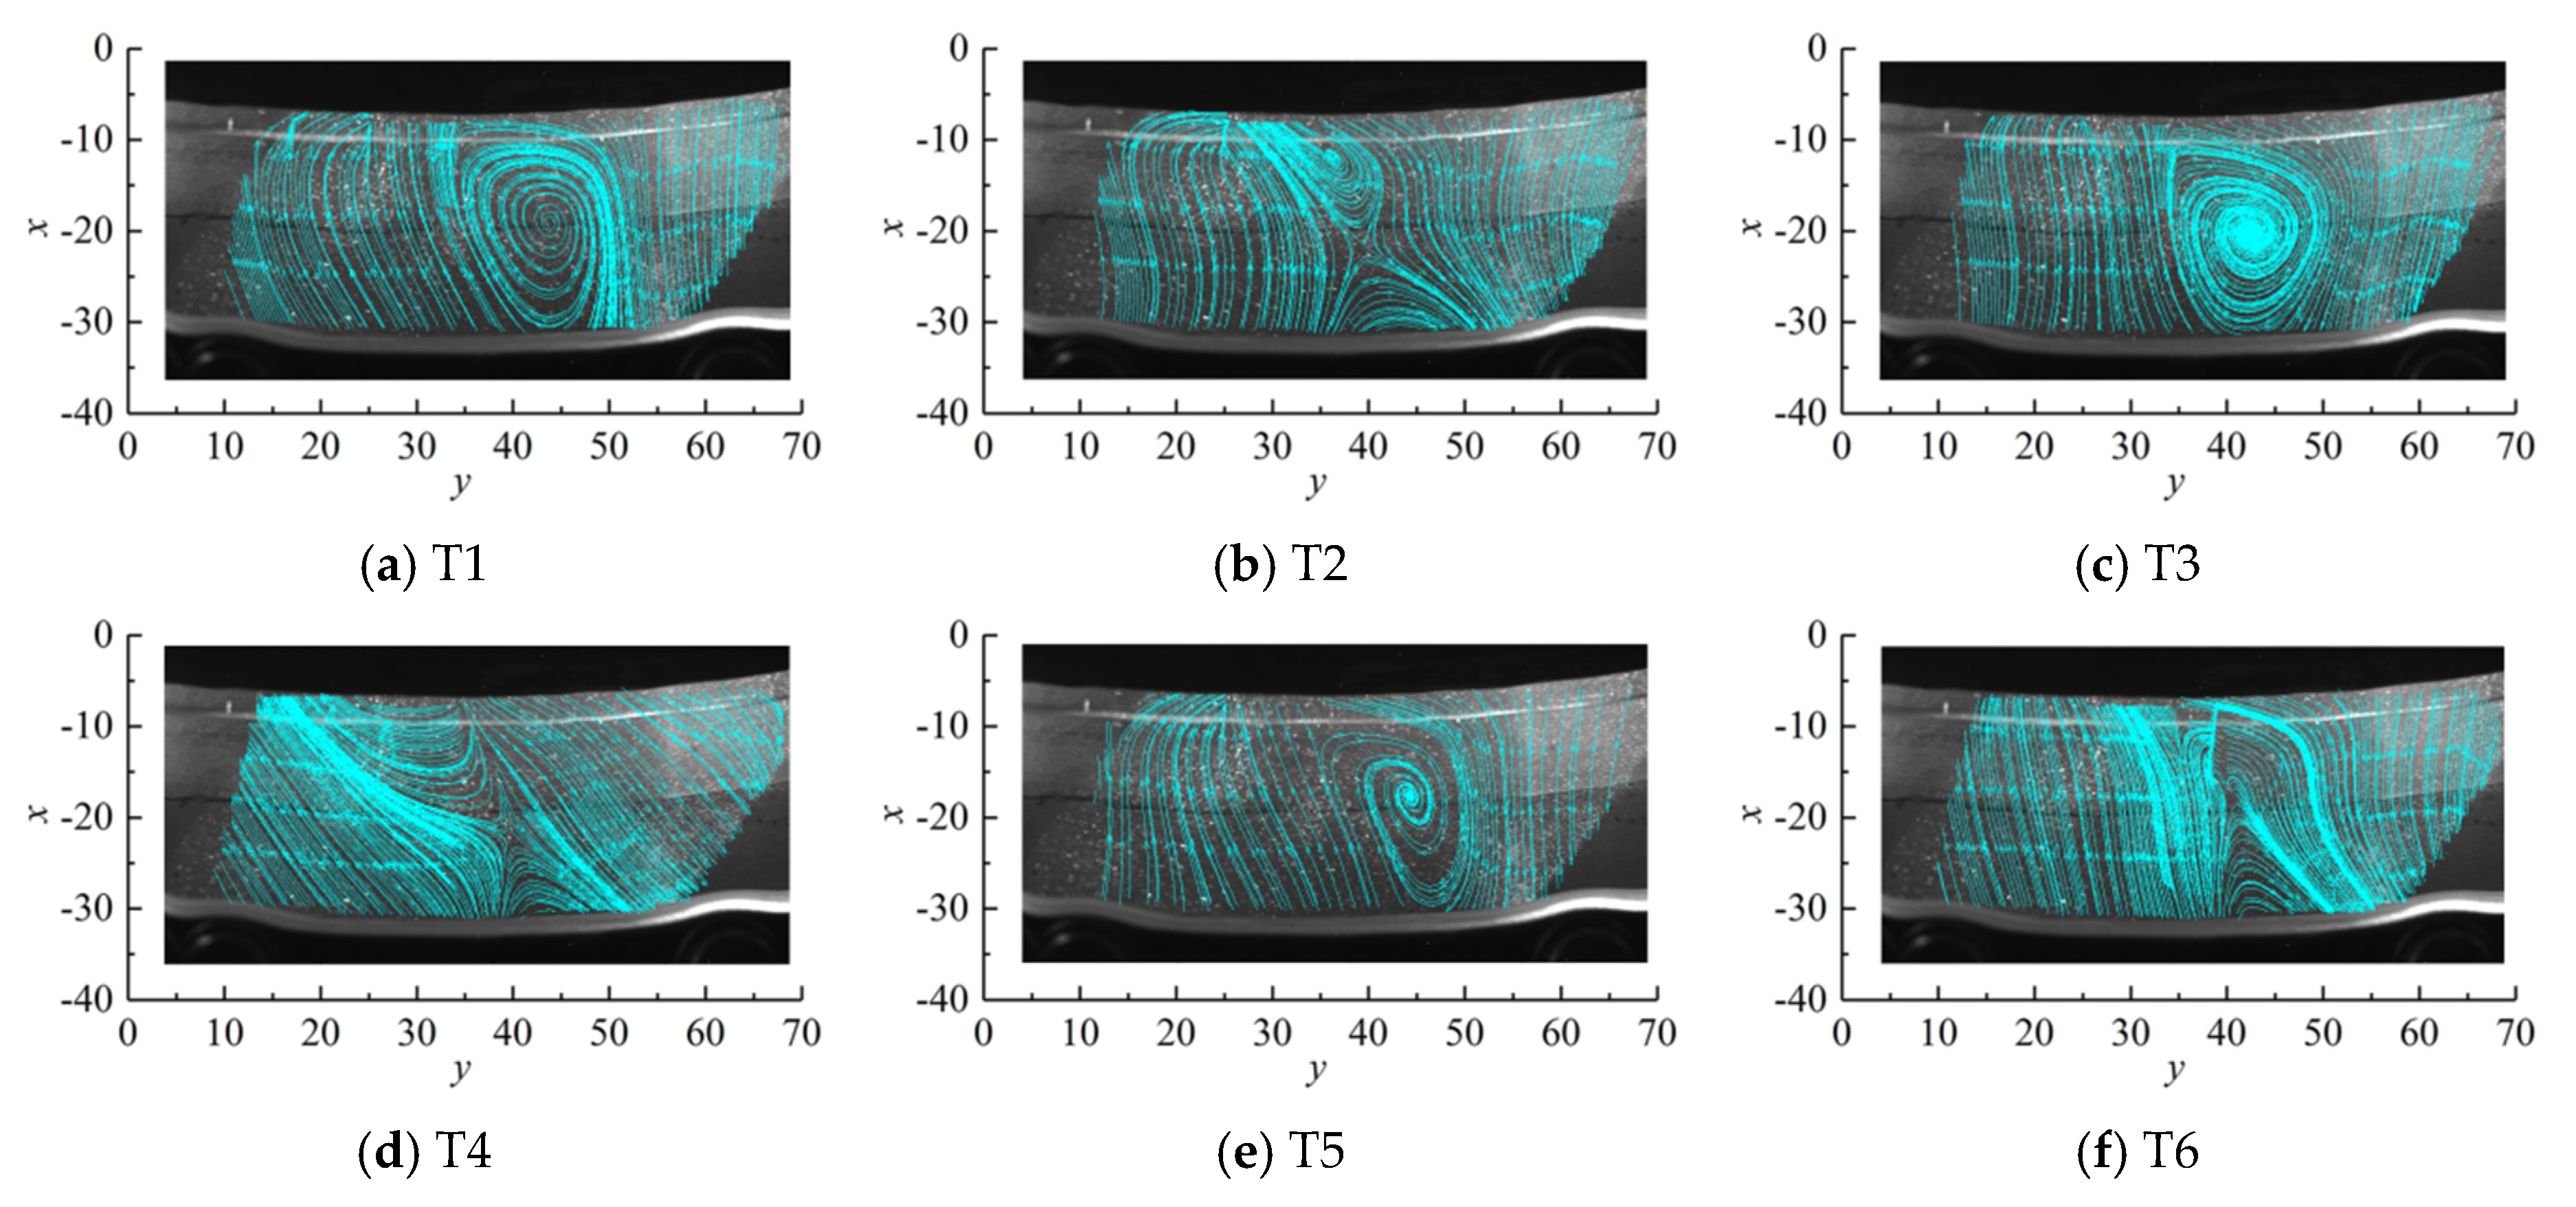
The internal flow field characteristics of the prototype and the model were compared and analyzed, and
Figure 7 shows the relative velocity distribution of the annulus within the vaneless space.
Figure 7 shows that the water flow in the flow field in the vaneless space under rated operating conditions flows into the runner through this ring surface, showing regular velocity fluctuations corresponding to the number of runner blades, which indicates that the hydraulic instability in the flow field in the vaneless space of the model pump-turbine and the prototype pump-turbine under this operating condition is mainly generated by RSI, where the potential flow disturbance phenomenon is obvious. The CFD results of compressible simulation and incompressible simulation are relatively consistent.
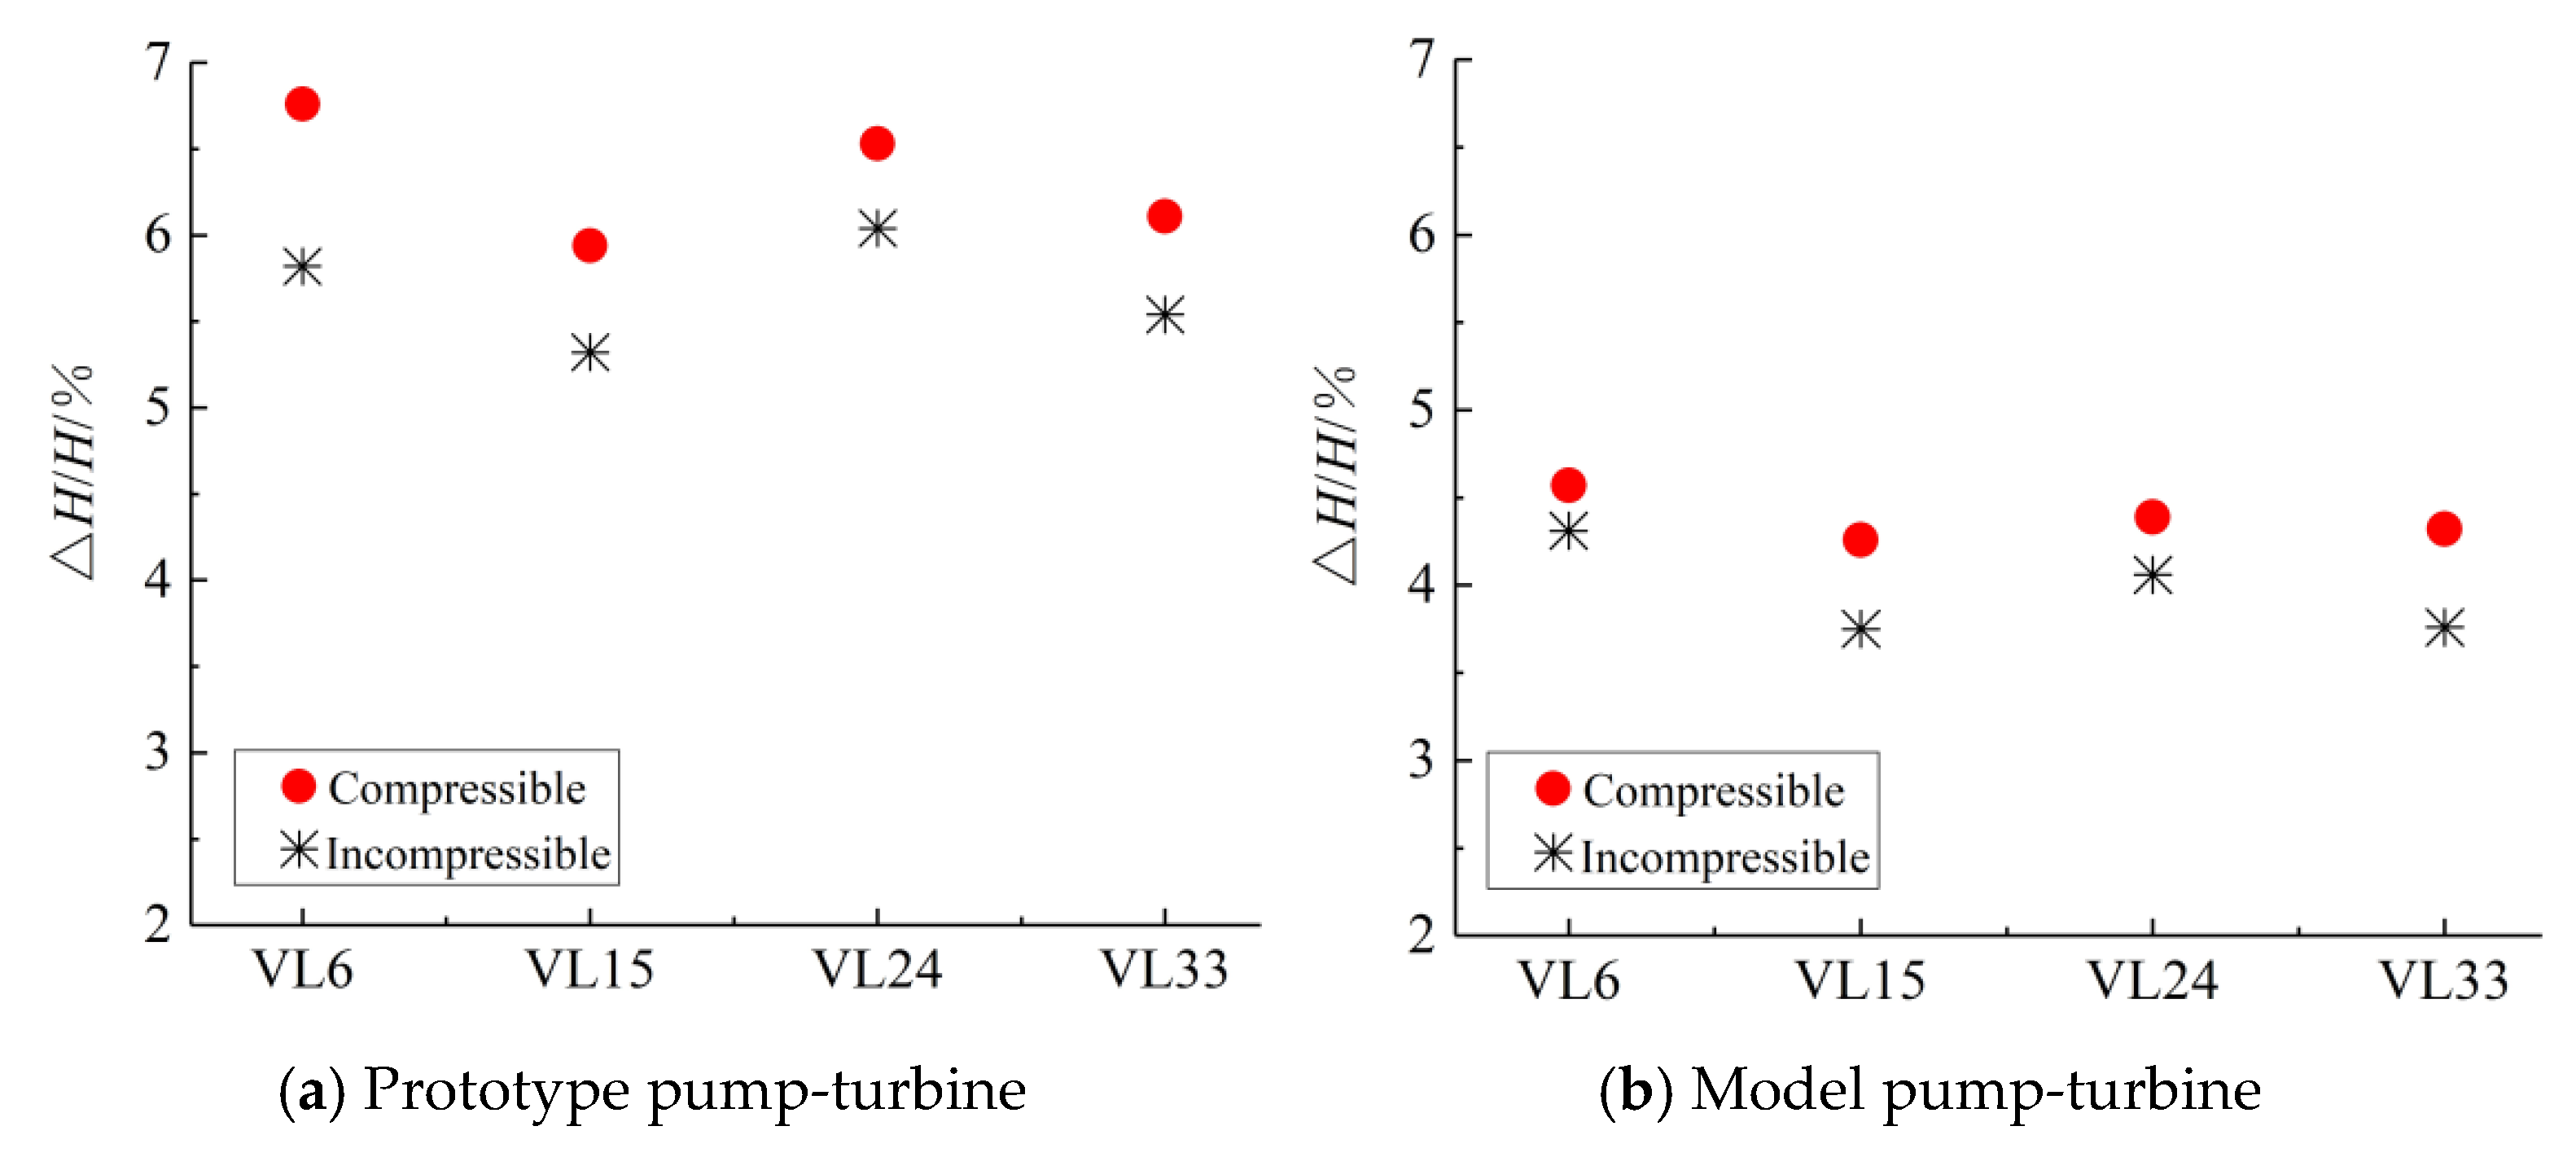
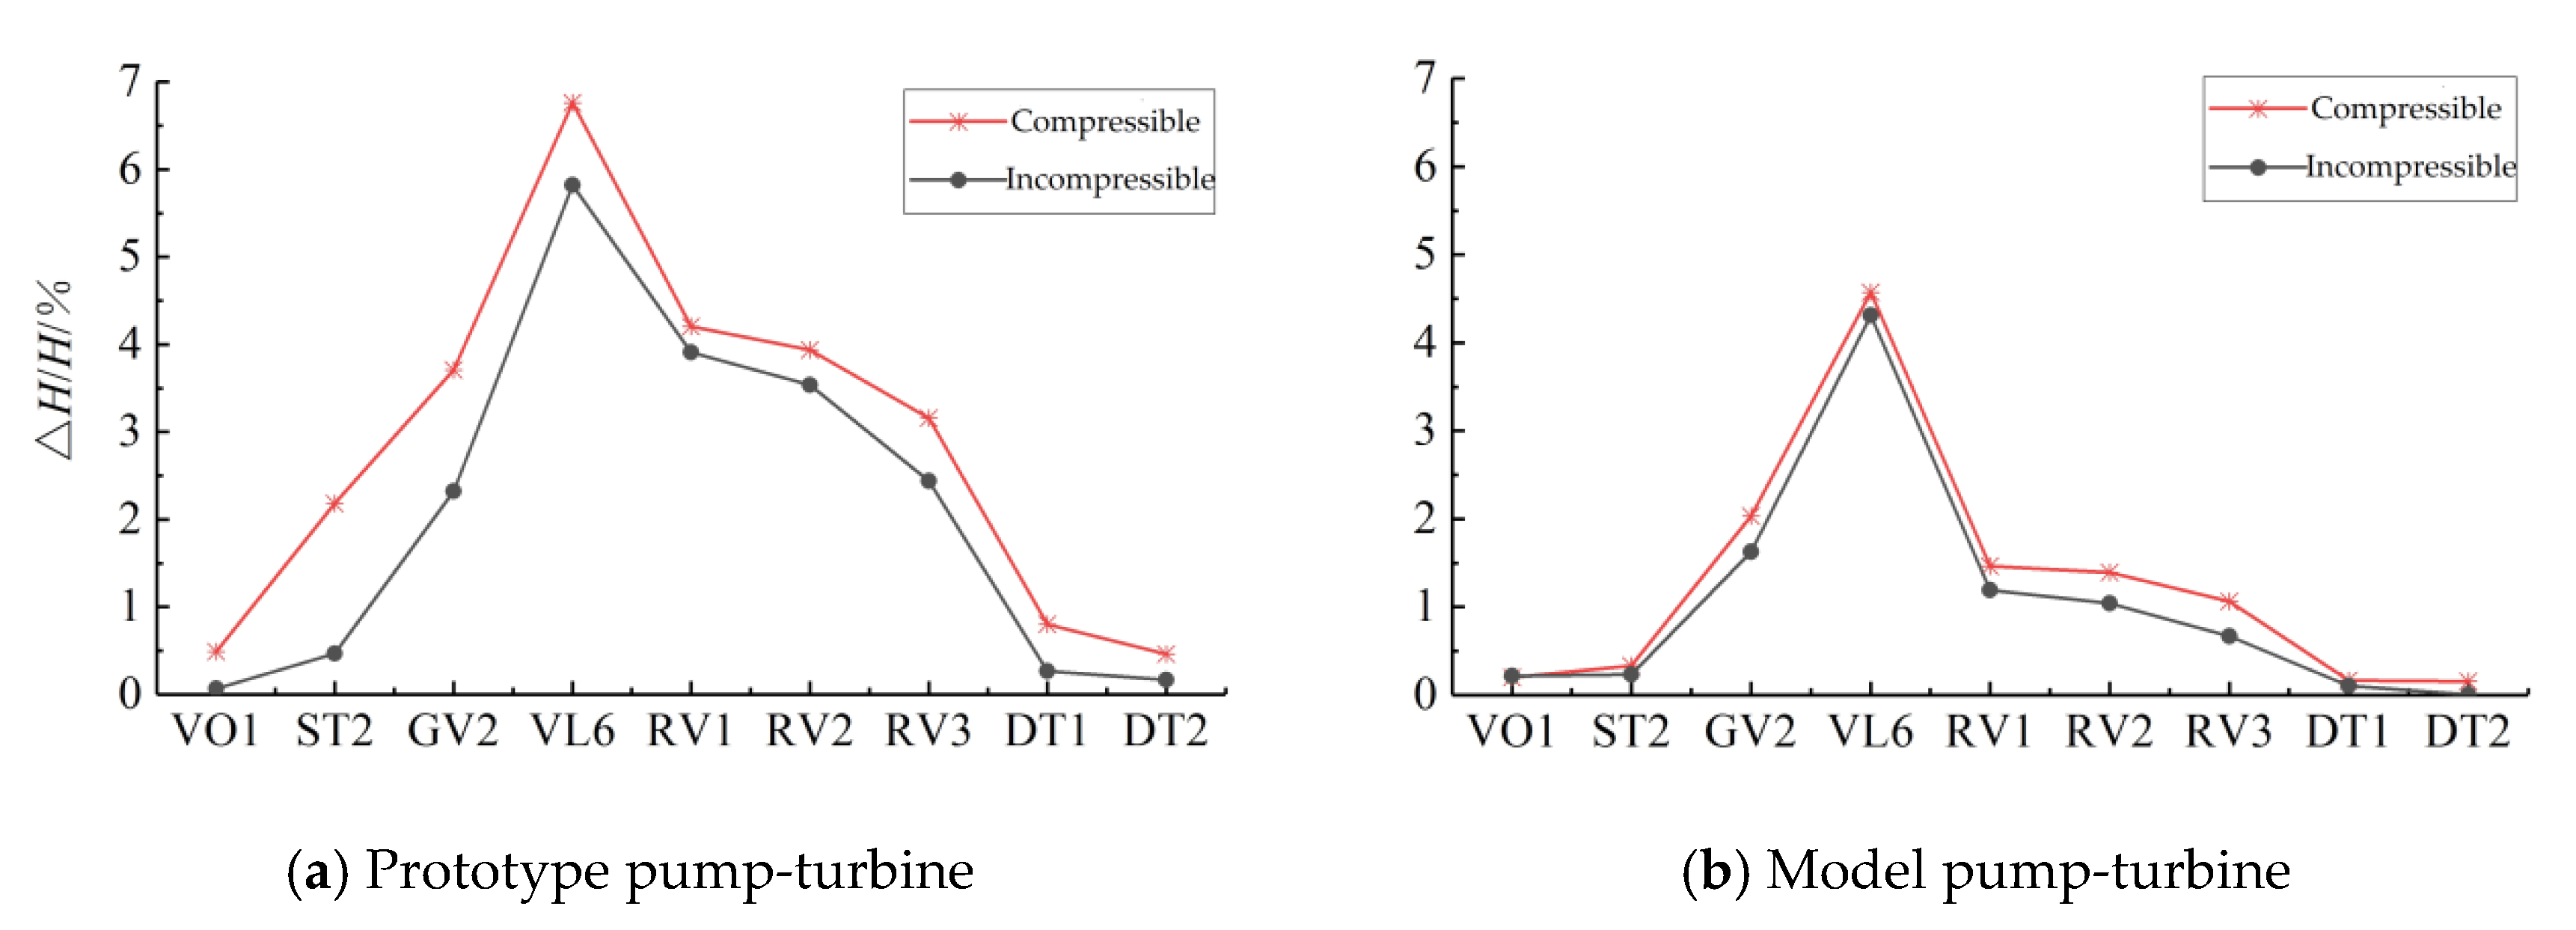
The relative amplitude of pressure pulsation Δ
H/
H at monitoring point VL6, monitoring point VL15, monitoring point VL24, and monitoring point VL33 in the vaneless space of the prototype and the model machine were compared and analyzed as shown in
Figure 8. The positions of the four monitoring points were symmetrical with respect to the central axis of the runner, and the monitoring points were separated by 90° from each other, as shown in
Figure 3.
Comparison of the relative pressure pulsation amplitude of the four monitoring points in the vaneless space of the prototype and the model machine indicates that the distribution pattern of the relative pressure pulsation amplitude in the vaneless space of the prototype pump-turbine is consistent with that of the model pump-turbine, but the relative pressure pulsation amplitude in the vaneless space of the prototype pump-turbine is larger than that of the model pump-turbine, and the compressible simulation is larger than the incompressible simulation. This difference in the relative pressure pulsation amplitude caused by the compressibility of water is more obvious in the prototype pump-turbine.
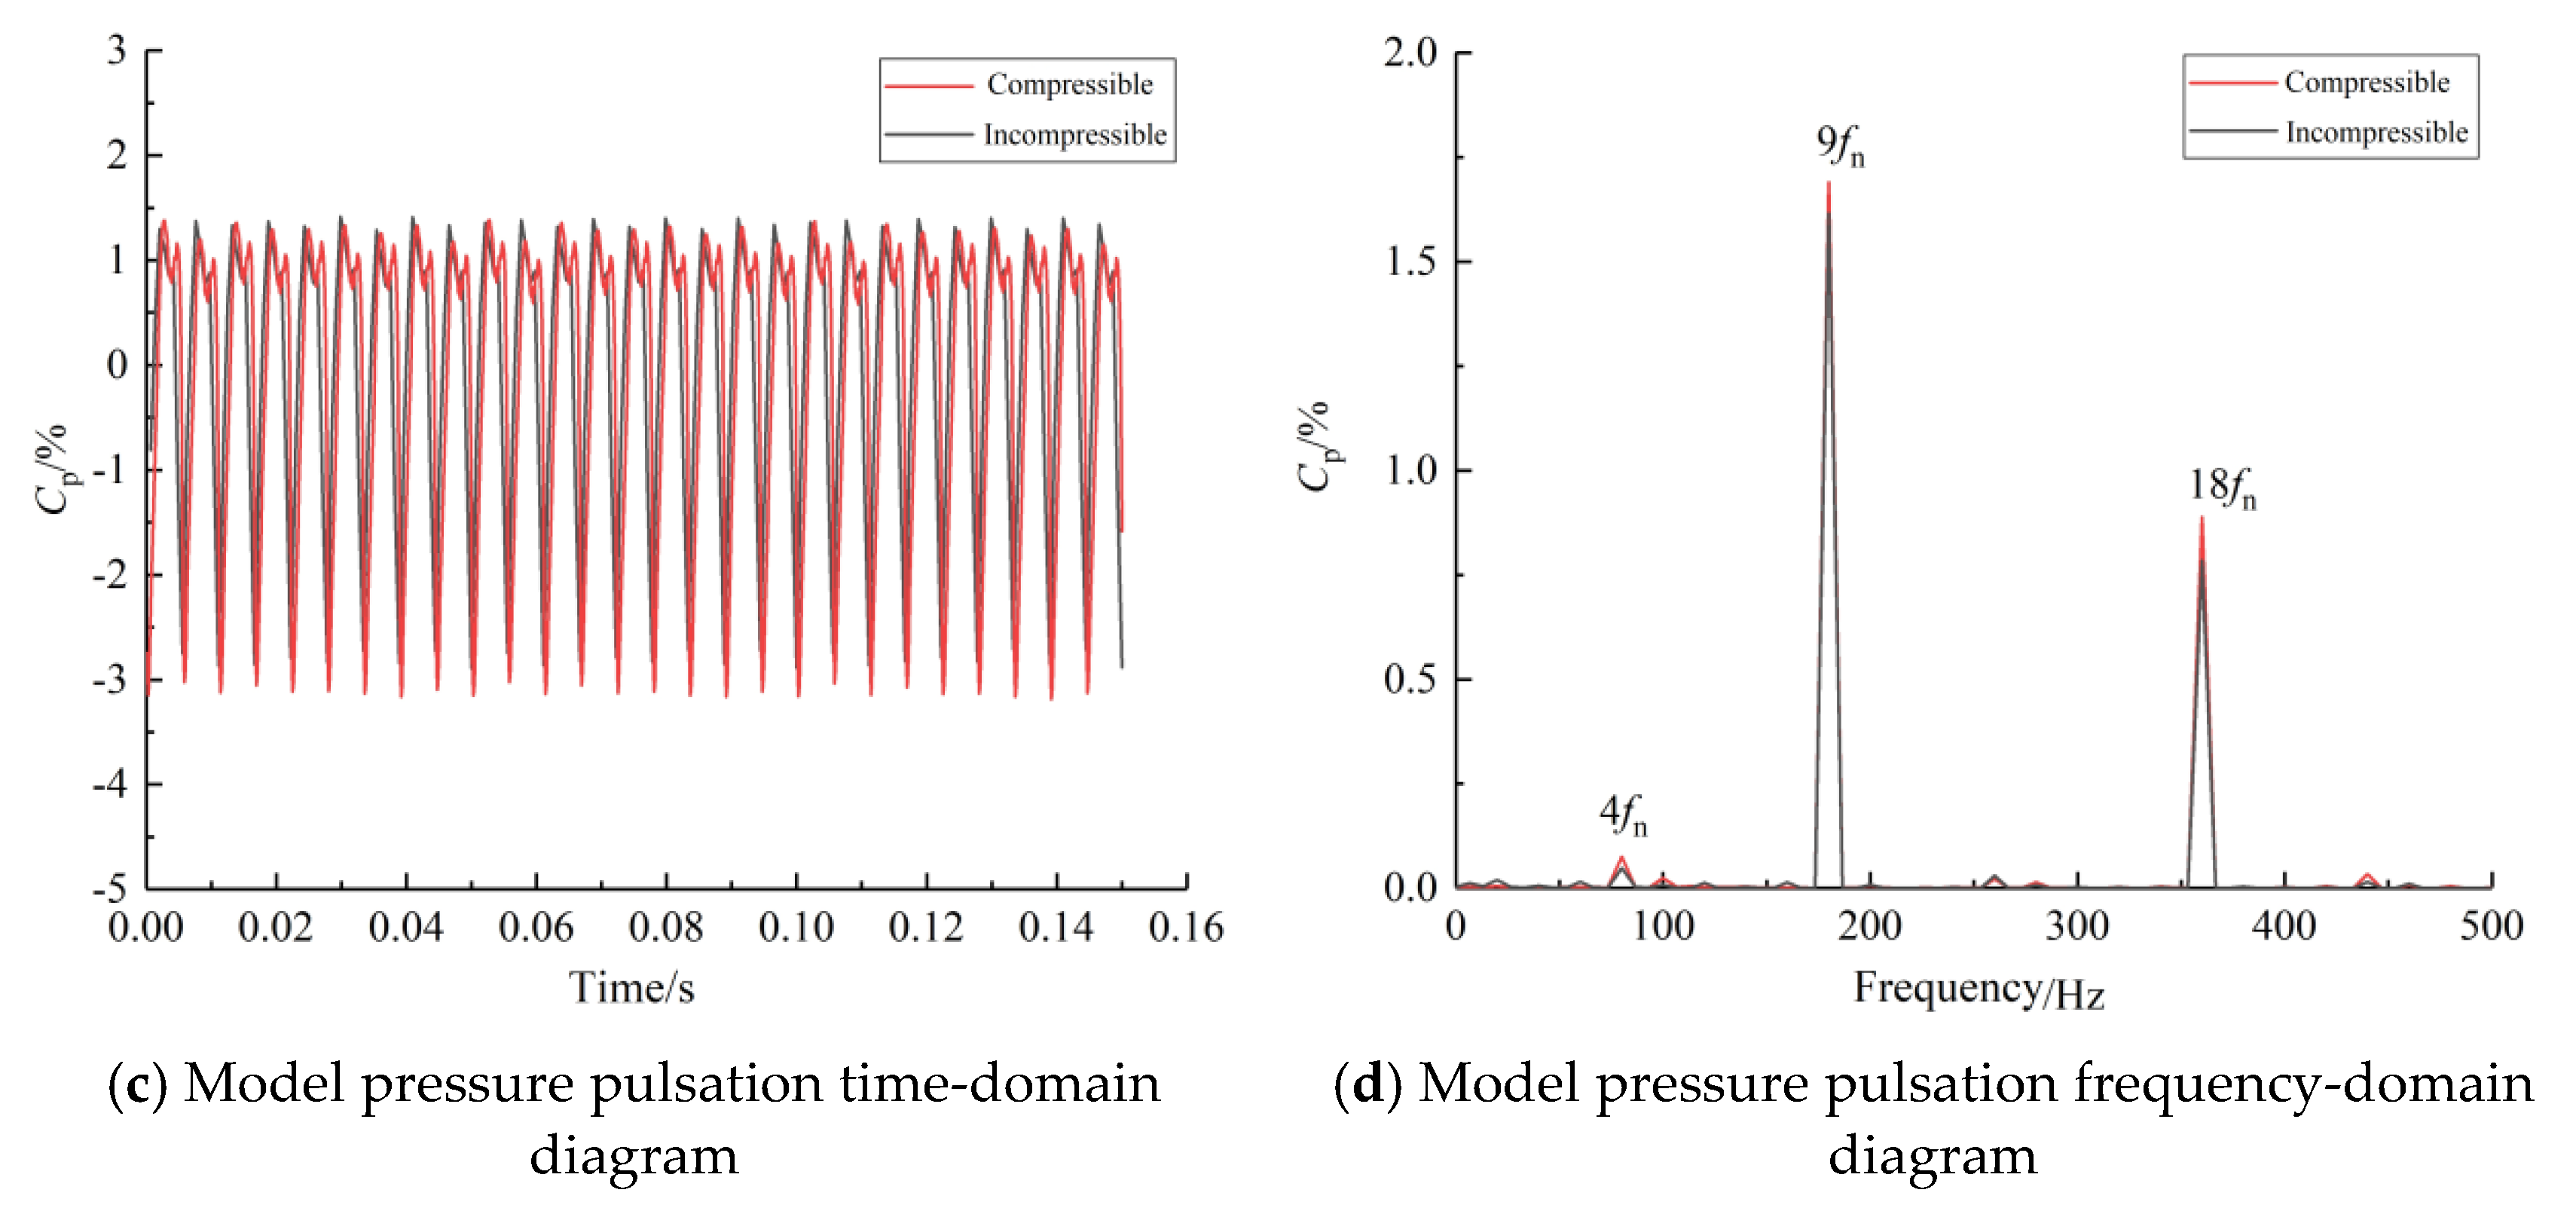
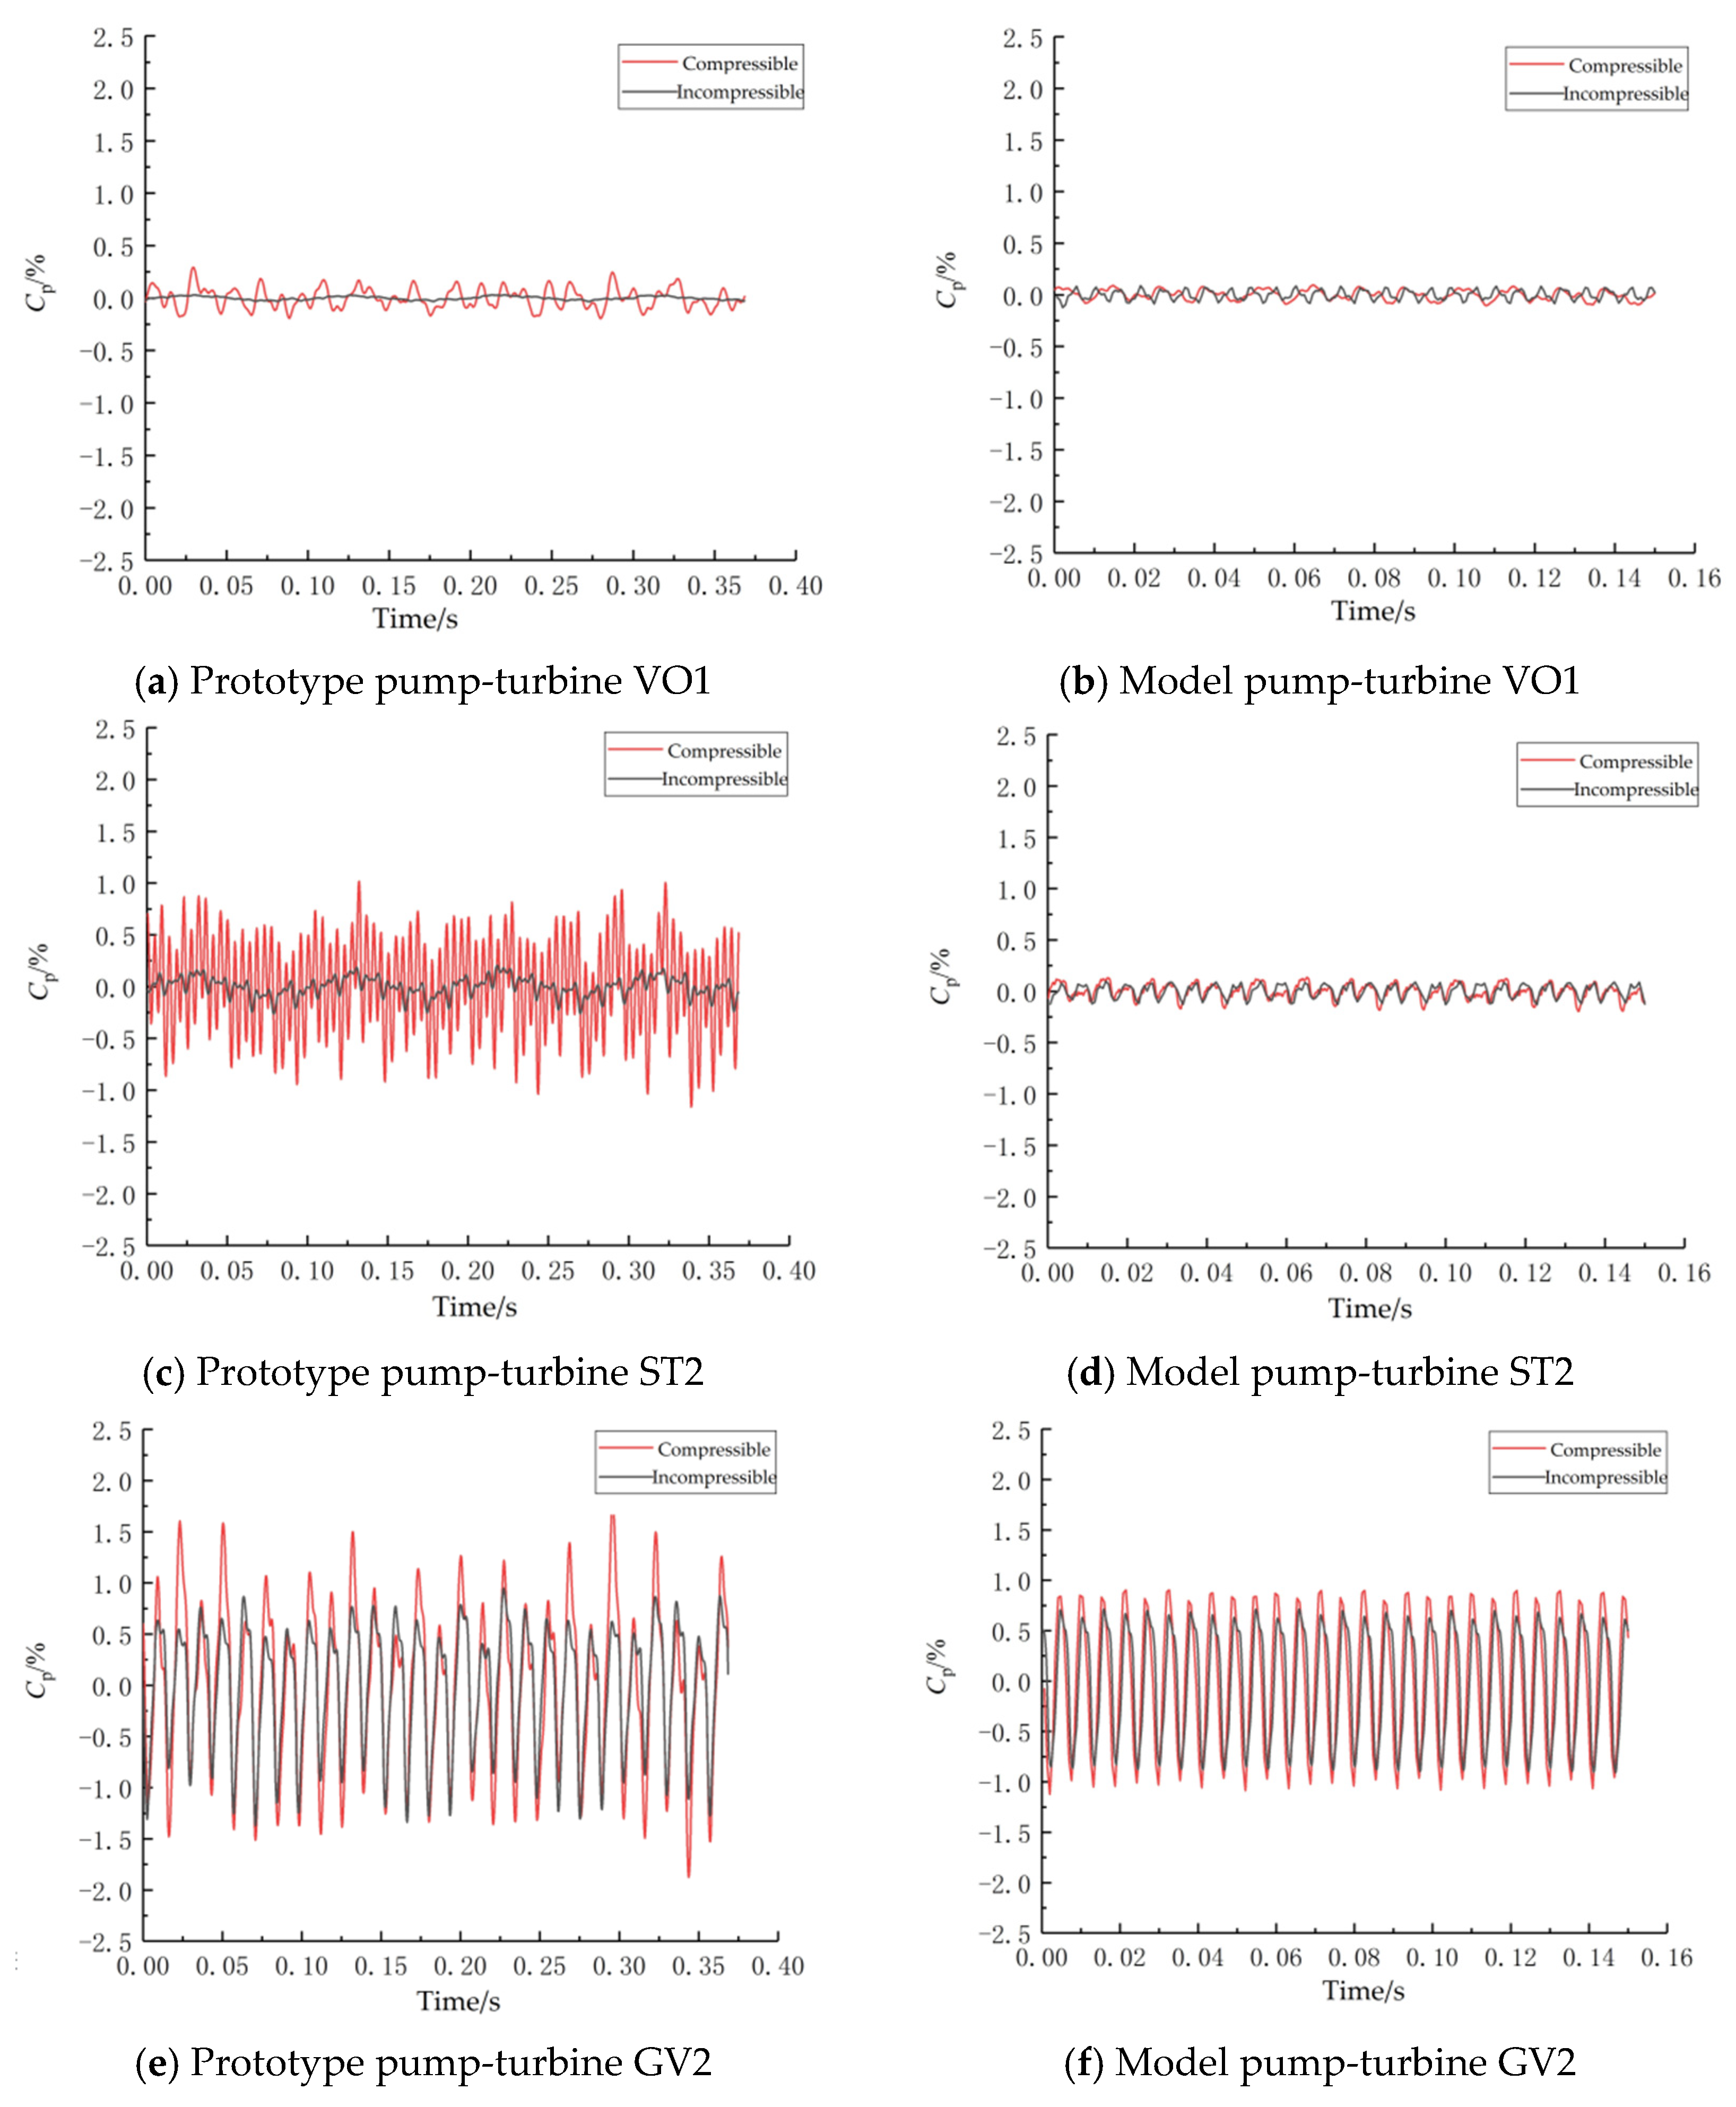
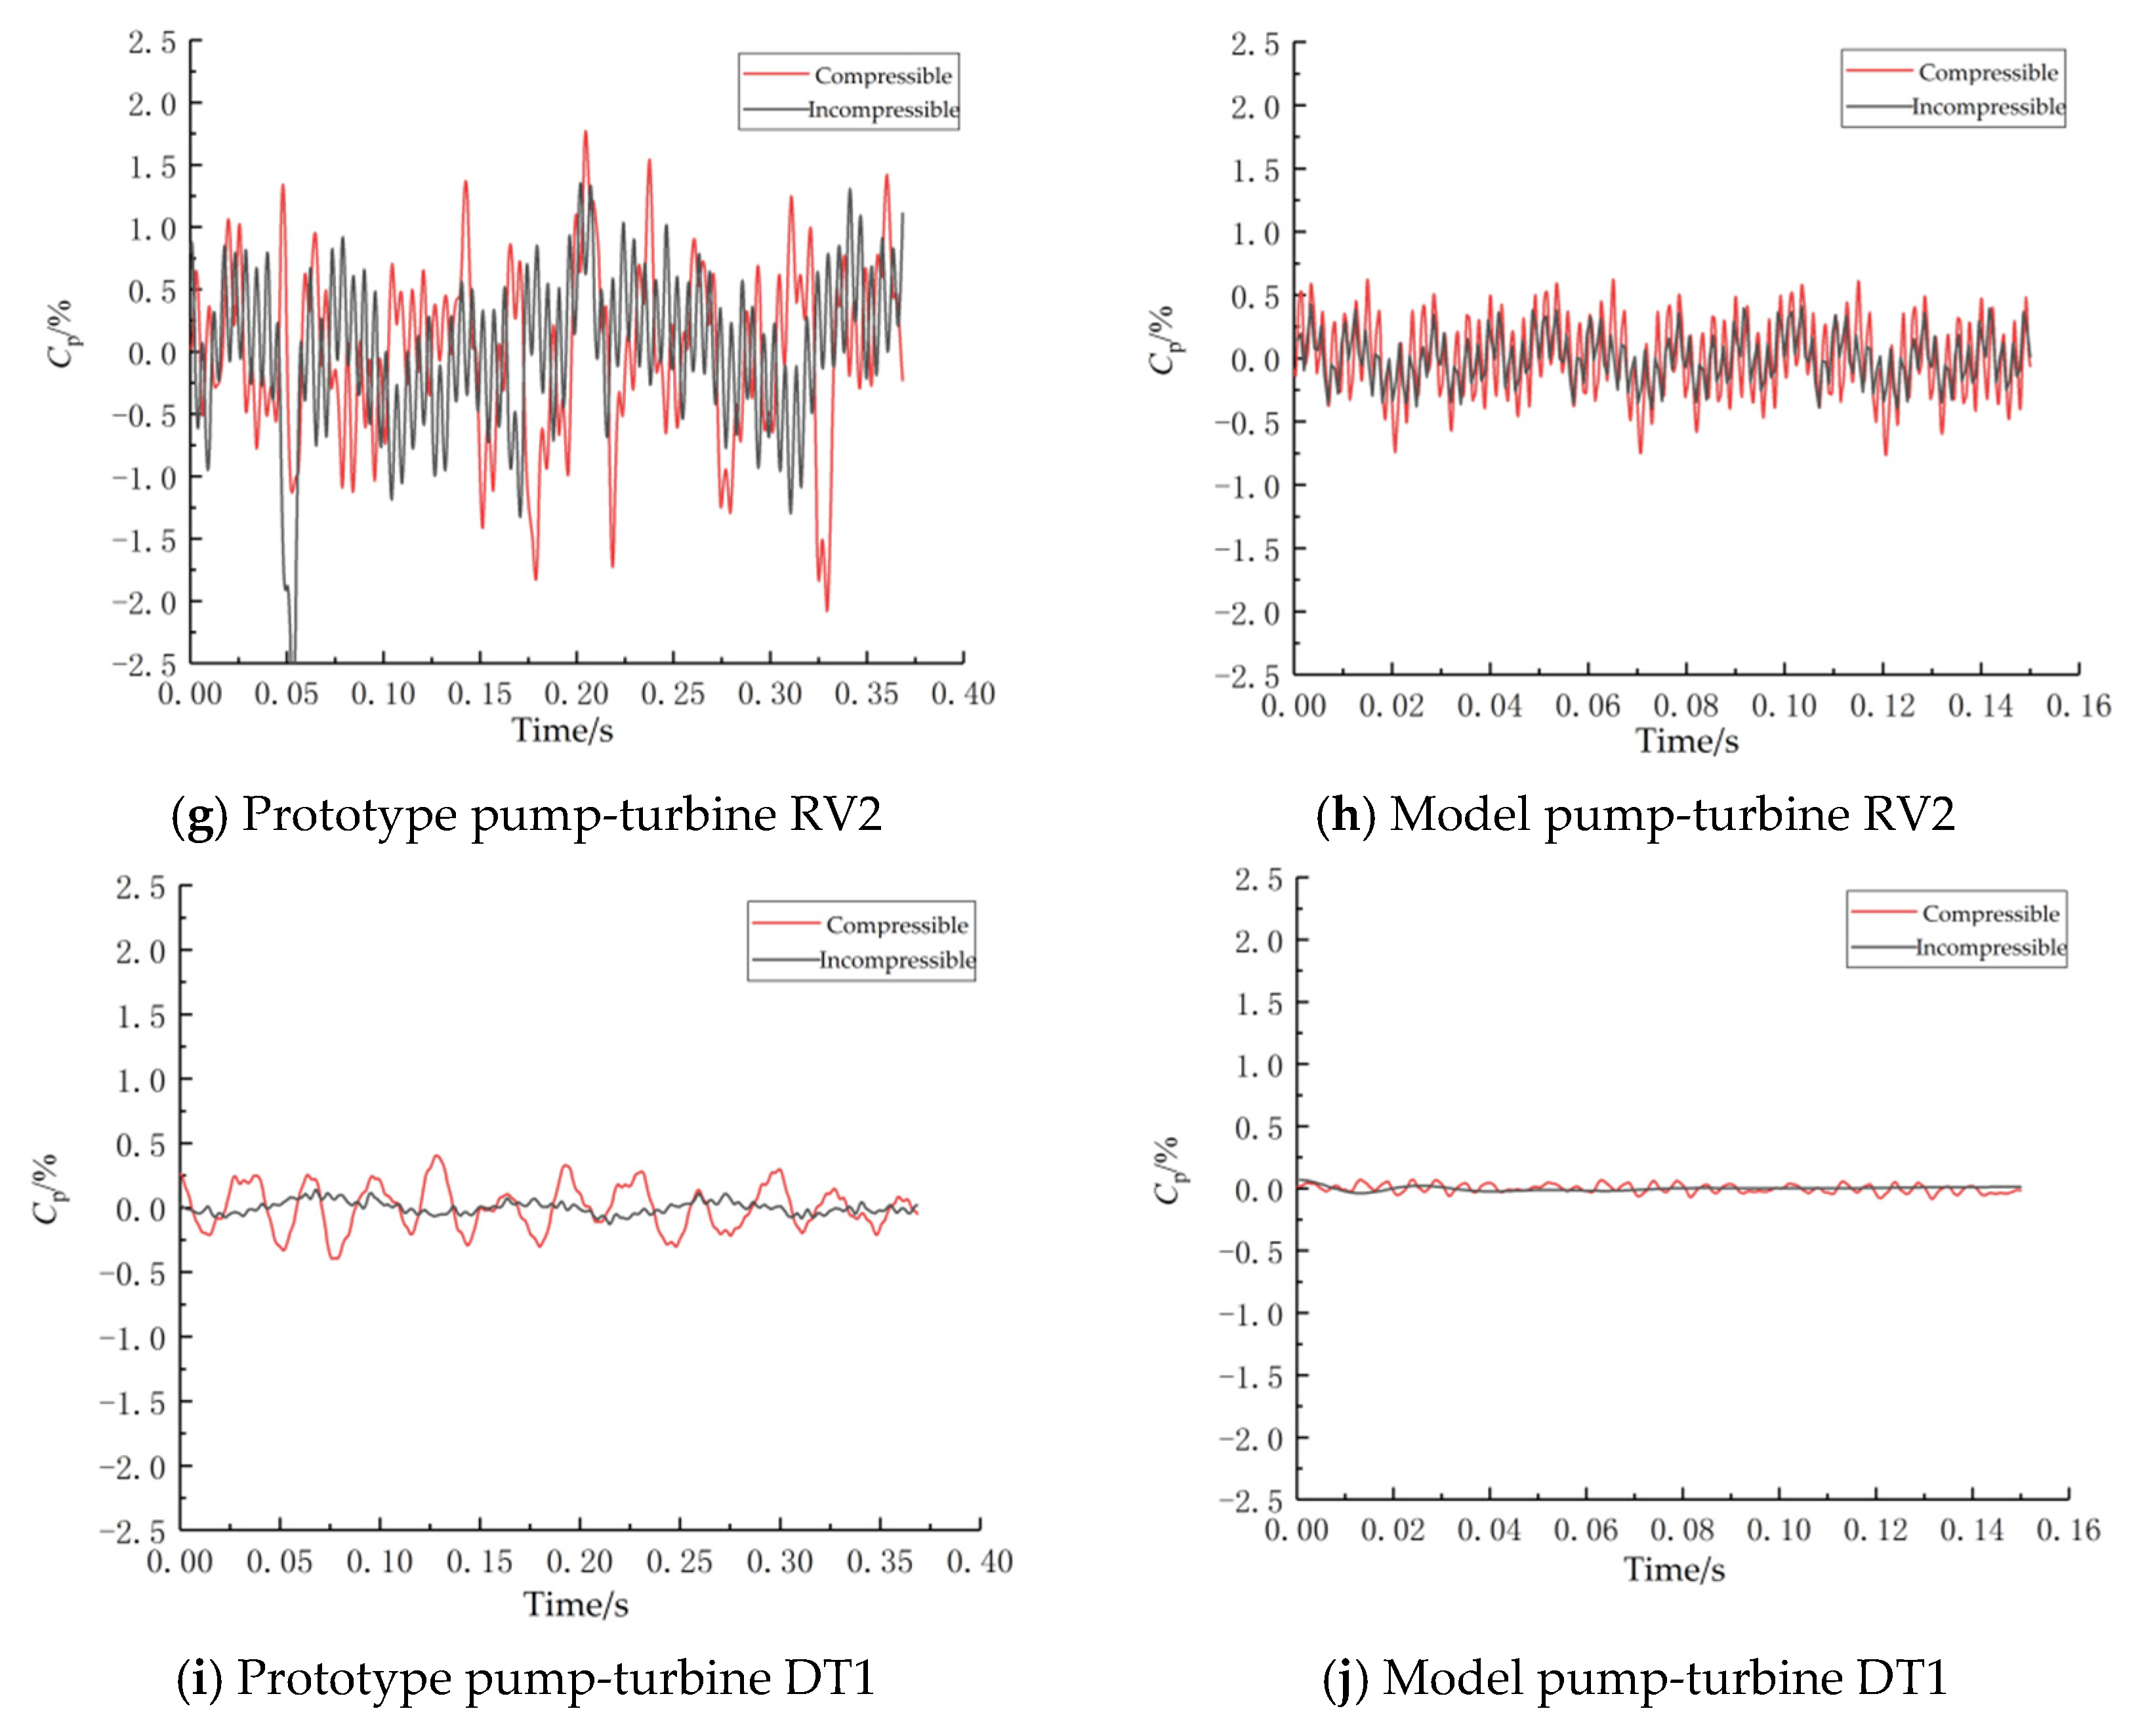
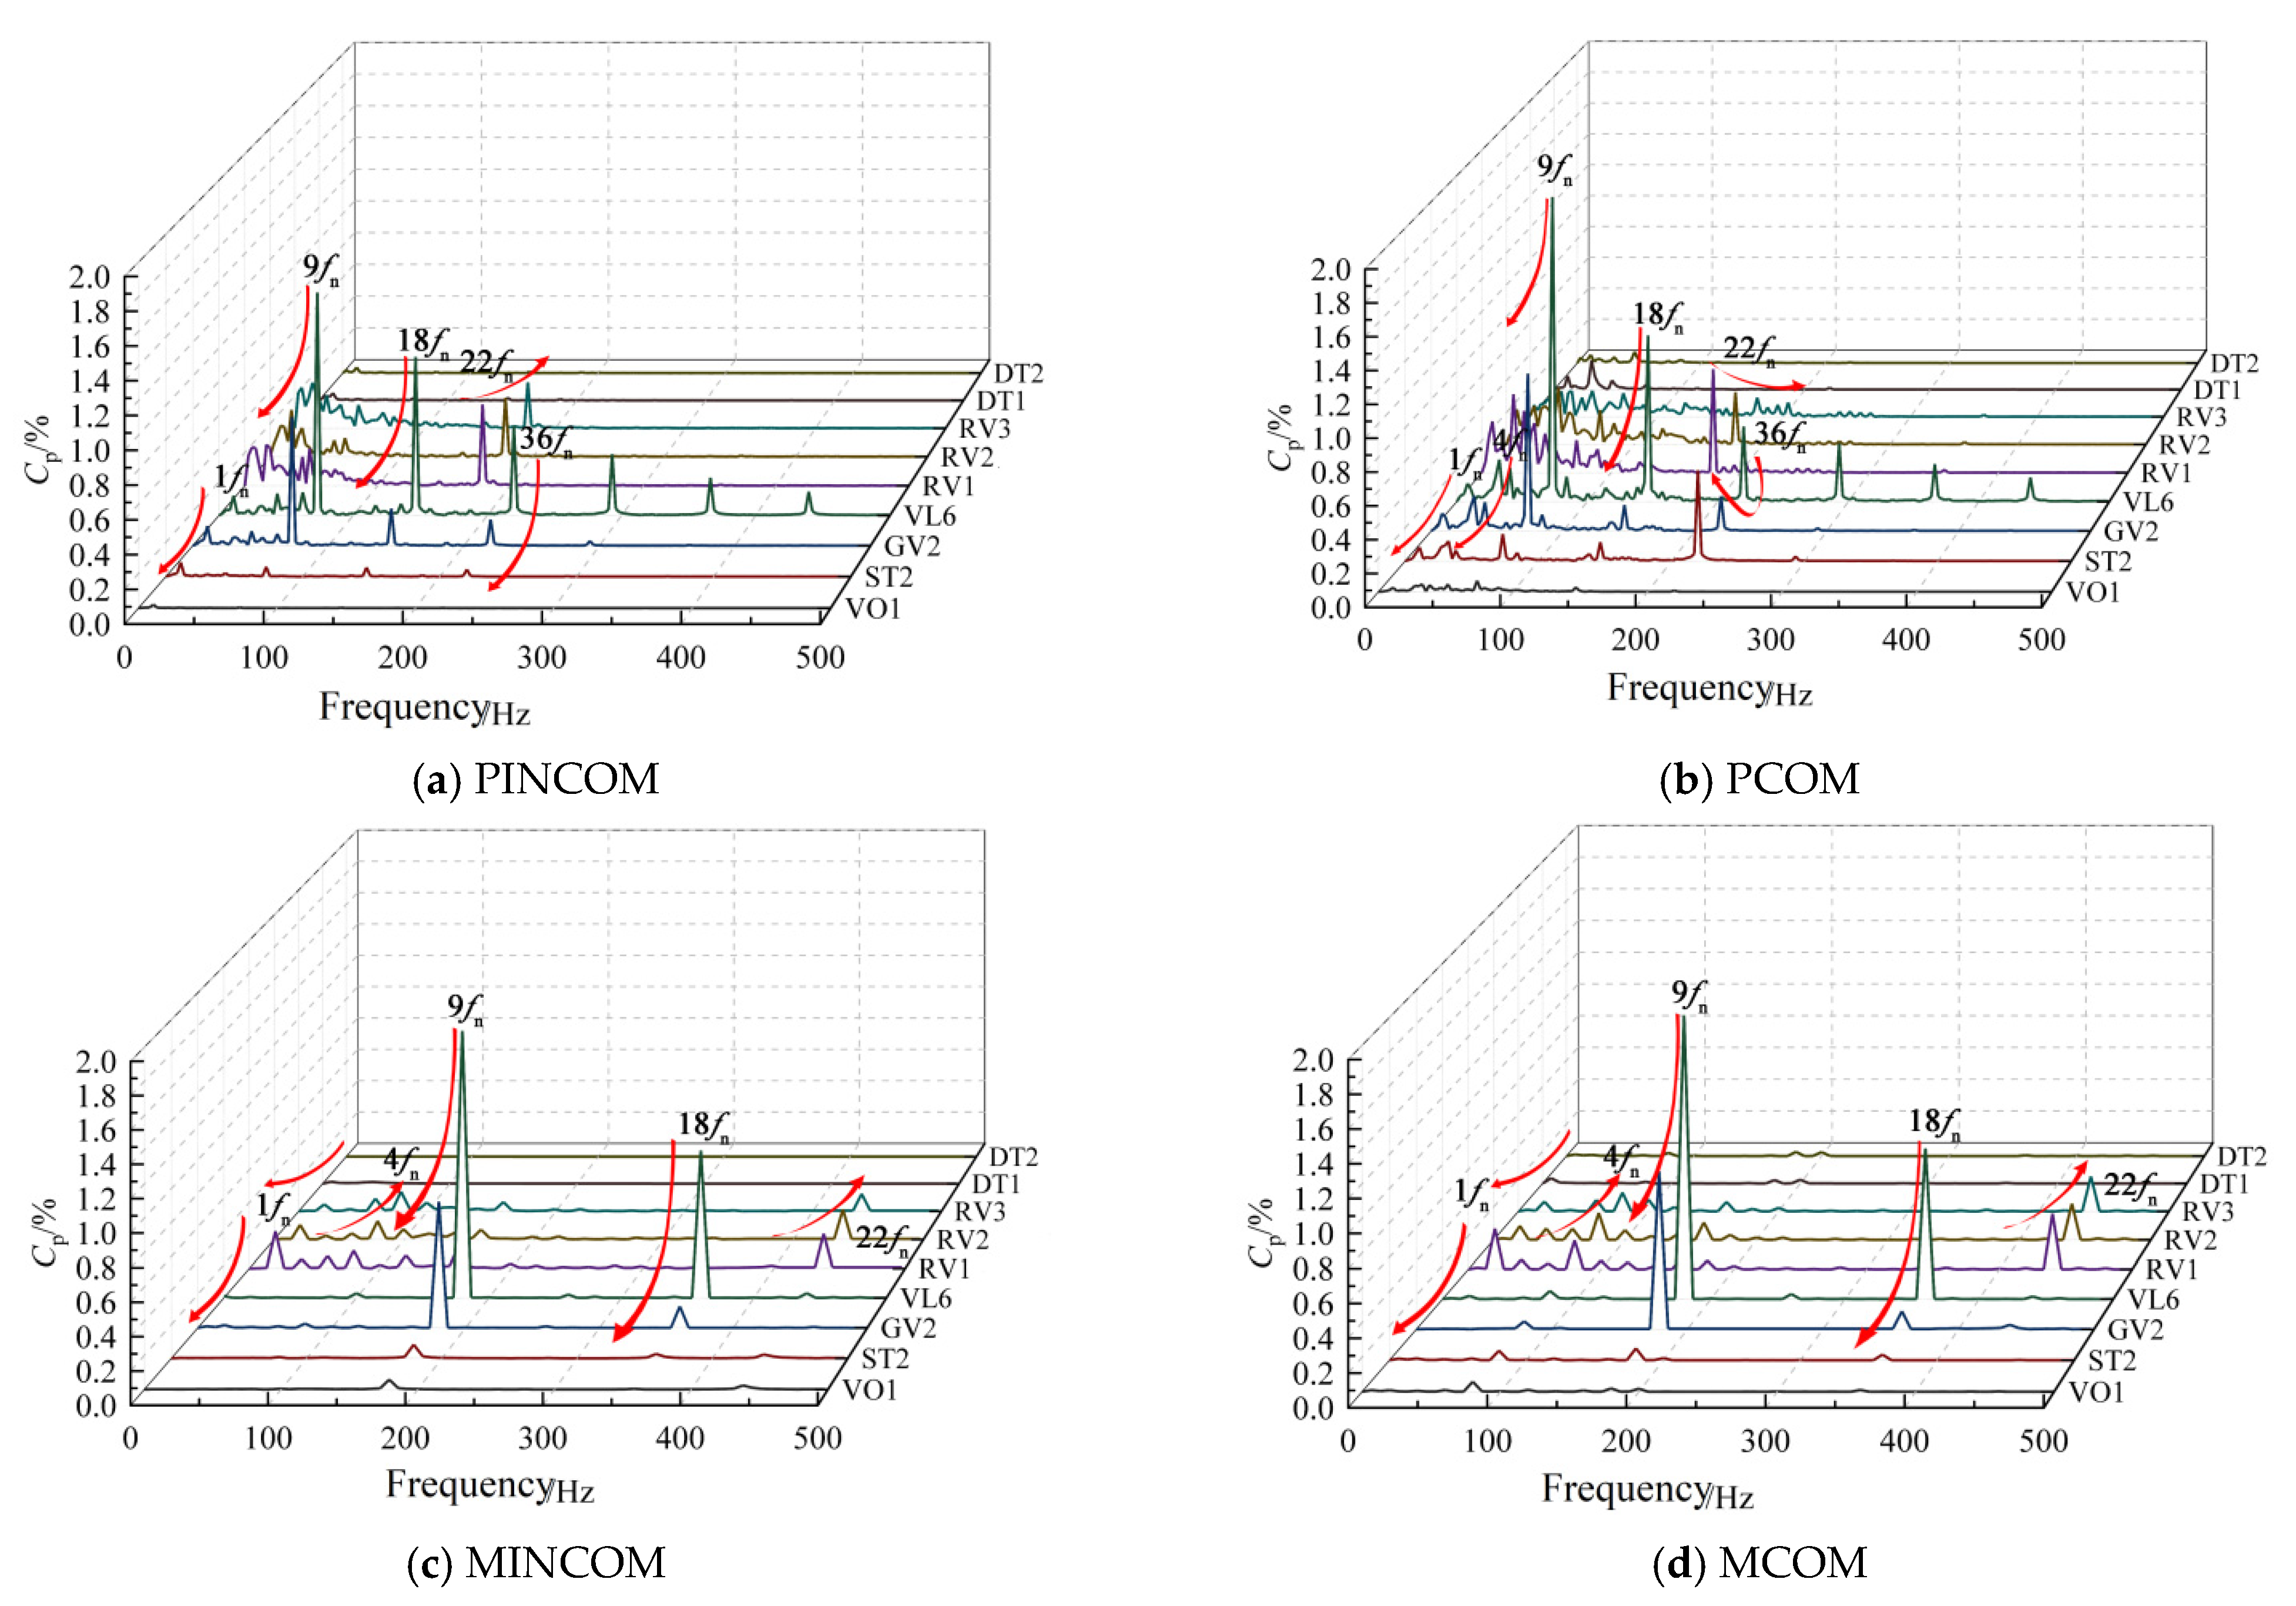
The pressure pulsation time-frequency characteristics of the prototype and model pump-turbine vaneless space monitoring point VL6 are further analyzed, as shown in
Figure 9, where the blade rotation frequency
fn is 8.15 Hz and 19.99 Hz for the prototype pump-turbine and model pump-turbine, respectively, under the rated operating condition of the turbine, and its BPF is 9
fn.
The main frequencies of pressure pulsation in the vaneless space of both the prototype and the model pump-turbine are BPF, and its harmonic frequencies are 9fn and 18fn. In addition, there is a relatively small pressure pulsation amplitude of 4fn. The blade-passing frequency and its harmonic frequencies 9fn and 18fn are RSI frequencies. 4fn is obtained from the upward propagation of the runner channel.
Whether compressibility is considered or not, the numerical simulation results are consistent with the main frequency of pressure pulsation of the test results, but there is still a certain difference in amplitude. Under the incompressible condition, the main frequency amplitude of pressure pulsation in the vaneless space of the prototype pump-turbine is significantly smaller than that of the prototype test results, and the main frequency amplitude of pressure pulsation in the vaneless space of the model pump-turbine is lower than that of the model test results, but the difference is smaller. Under the weakly compressible condition, the main frequency amplitude of pressure pulsation in the vaneless space of the prototype and model pump-turbine is increased, and the main frequency amplitude of pressure pulsation in the vaneless space of the prototype pump-turbine is higher than that of the model pump-turbine when the weak compressibility of the water is considered. Generally, when considering the weak compressibility of water, the main frequency amplitude of pressure pulsation is closer to the experimental value, and it is more obvious in the numerical simulation of the prototype pump-turbine. This is because the speed of sound in water is approximately 1400 m/s, the wavelength is approximately 5–30 m, the RSI frequency of the pump-turbine is approximately 50–200 Hz, and its corresponding acoustic wave wavelength is similar to the scale of the prototype pump-turbine, so this pressure wave perturbation caused by the compressibility of the water causes acoustic resonance in the flow field and enhances its pressure pulsation amplitude.


 ,
, 


