Article

Clarification of the Mechanism of Pulse Laser Grinding of Nanosecond Lasers Using High-Speed Camera Imaging

Department of Electrical and Mechanical Engineering, Nagoya Institute of Technology, Nagoya 466-8555, Japan
*
Author to whom correspondence should be addressed.
Machines 2022, 10(3), 196; https://doi.org/10.3390/machines10030196
Submission received: 4 February 2022 / Revised: 26 February 2022 / Accepted: 6 March 2022 / Published: 8 March 2022

Abstract

:
Pulse laser grinding (PLG), as a cutting tool processing method, can not only achieve edge sharpening with high precision, but it can also produce surface modification. For example, polycrystalline cubic boron nitride (PCBN) tools processed by PLG can show increased hardness due to the reduction in defects. However, the mechanism of edge formation under PLG processing remains unclear. In this study, by observing the plasma generated during processing using a high-speed camera, the elementary process for each laser pulse of the PLG process was visualized. The plasma luminescence moved successively through four stages: multipoint luminescence, uniform luminescence, the downward movement of the luminous center, and faint luminescence. By comparing the results of three different laser pulse pitches (0.2, 2, and 20 μm), it was found that the pulse pitch had a significant influence on the PLG processing mode. When the pulse pitch was too small, the sidewall effect was likely to lead to local excess machining. The large pulse pitch resulted in processed surfaces that could not be fully covered by laser irradiation, and it was preferred to remove the decrease threshold subsequently. Thus, the moderate pulse pitch condition showed a superior processed surface compared to the others.

1. Introduction

In the cutting process, a precise and regular-shaped tool edge is an essential factor in determining the machining accuracy and finished surface properties. Generally, the cutting edge is sharpened by grinding using diamond-based grinding wheels [1,2]. However, this might lead to the problem of edge chipping and micro-defects/cracks on the tool surface, which significantly affect the tool lifetime and the quality of the processed surface for highly brittle tools, such as diamond or polycrystalline cubic boron nitride (PCBN) tools. In addition, owing to their extremely high hardness, the mechanical processing of these tools is characterized by high tool wear and high cost [2]. To give full play to their high cutting performance, the laser ablation technique has attracted the attention of researchers in recent years [3,4,5] as a method with high geometrical accuracy and flexibility. For PCBN tools, Denkena et al. successfully increased the cutting performance by applying laser-induced structures to cutting-edge surfaces [6], while Walter et al. used a picosecond laser to ablate regular micro-patterns onto the surfaces of PCBN grinding tools to achieve reduced grinding forces and improved grinding efficiency [7]. Everson et al. used nanosecond laser processing to perform the two-dimensional fabrication of microtools in polycrystalline diamond (PCD), although the phase transformation towards amorphous carbon and graphite occurred on the processed surface. In other studies [8,9] of edge shaping using PCD or chemical vapor deposition (CVD) diamond tools, the thermal impact of the nanosecond laser was used to combine laser-induced diamond graphitization with precision grinding to improve the edge quality. However, these processing methods have the problems of complex operation, low efficiency, and high cost, and the resulting edge sharpness is insufficient for application in high-precision machining.
Accordingly, an innovative tool edge processing method, called pulsed laser processing (PLG), which is a combination of laser ablation and the averaging effect (through random repeated scanning to offset various errors), was developed by our group using a nanosecond laser [10,11,12]. The laser beam irradiates the tool edge part obliquely at a very small processing angle of several degrees, almost parallel tool edge surface. Through the repeated scanning of the laser, similar to the grinding wheel, ablation removal processing produces edge shaping. Previous studies of PLG have shown that it not only possesses high flexibility, machining efficiency, and precision, but also improves surface integrity after laser processing. Suzuki et al. [10] conducted PLG processing using a five-nanosecond pulse laser with PCBN cutting tools, and the tool edge surface hardness increased; this was attributed to the presence of fewer defects and the generation of TiB2 in the binder matrix. Meanwhile, the formation of hBN by laser ablation leads to friction reduction, rendering it superior to mechanical ground tools. In addition, Liu et al. [13,14] found that for the processing of CVD diamond-coated tools with femtosecond lasers, PLG can attain higher-precision processing using a high-fluence laser and, more interestingly, the diamond crystallinity can be improved with low-fluence irradiation. With the combination of these two advantages, femtosecond lasers can produce harder and sharper tools of higher quality than those produced with conventional PLG with nanosecond lasers. However, there are still many unclear points regarding PLG. For example, theoretically, after numerous laser scanning passes, the roughness of the processed surface should approach infinitely small values and should not be affected by laser conditions, such as scanning speed. However, the actual results show that pulse pitch and processing angle, among other features, have a significant impact on the final processed surface roughness. Currently, optimal laser processing conditions are often determined based on experimental experience. Thus, to clarify the processing mechanisms involved in PLG, it is necessary to study the elementary process for every laser pulse and implement the visualization of this PLG process. The visual observation of the plasma/plume in a laser-material interaction has been achieved using different methods, among which high-speed photography is an effective method for attaining the visualization and characterization of plasma to investigate its evolution during the progress of processing [15,16,17].
In this study, the plasma generated in the PLG process was observed using a high-speed camera to visualize the formation of the processed tool edge surface. PCBN tools, which are widely used for the high-speed machining of hardened steels, were employed. The plasma’s evolution with the PLG passes was characterized by the distribution of plasma intensity and the coordinates of the plasma luminous center acquired by the high-speed camera. Having investigated the effect of the laser pulse pitch on the intensity and shape change of the plasma during the processing process, we discuss the PLG tool edge-shaping mechanism in detail in this report.

2. Experimental Method

2.1. PLG Processing of PCBN Tools

A schematic illustration of the PLG process is shown in Figure 1a. First, as depicted in blue, the laser beam was focused using a long-focus lens to create a cylindrical and longitudinal laser processing area. The pulsed laser features a Gaussian beam profile, so the three-dimensional fluence distribution is calculated as follows:
F r = 2 E π w 2 exp 2 r 2 w 2
where E means the laser energy per pulse, r denotes the spatial coordinate with the peak of the laser fluence as the origin, and w denotes the beam radius, also generally referred to as beam waist. When laser is focused with a lens, the beam radius w z will be a function of the propagation distance from the focusing point z, which is as follows:
w z = w 0 1 + λ z π w 0 2 2
where λ means wavelength and w 0 denotes the beam waist at the focus point. Therefore, the spatial distribution of laser intensity I (r, z) can be obtained from Equations (1) and (2) as a function of r and z. Furthermore, from the squared laser intensity, the power density can be calculated with the contour profile of power density shown in Figure 1a, in blue, which is a long, narrow power-density area. Therefore, the laser beam was focused to create a power density of three-dimensional cylindrical distribution.
Similar to a grinding wheel, the laser beam was repeatedly scanned in parallel with the tip of tool edge, and the PCBN was gradually ground to remove the material. The laser processing was conducted at a small processing angle θ that was almost parallel to the tool surface. Here, ‘pass’ refers to the number of times the laser beam scans over the tool edge. For example, in Figure 1a the laser beam scanning from A to B is one pass, while from A to B and back to A, this reciprocating scan is represented by two passes. After a certain number of scanning passes, the tool feeds towards the laser beam horizontally for one step and then performs another round of new scanning and removal processing. After repeating the above scanning and feeding process several times, the cutting edge could be shaped on the rake face of the tool, just as a large and flattened chamfer land was formed, as shown in light blue in Figure 1a. The chamfer angle between the as-received and processed surfaces is referred to as processed angle φ (Figure 1b).
As shown in Figure 1c, the theoretical roughness of the PLG-processed surface produced in the case of a one-laser scanning pass was determined by the laser spot diameter and pulse pitch, which refers to the spatial distance between two adjacent pulses, as represented by x in Figure 1c. Since in the actual PLG process, the scanning of the stage and laser pulse is not synchronized, the subsequent scanning passes were carried out randomly. In this way, after a sufficient number of laser scans, an extremely smooth machined surface was achieved.
A commercial PCBN tool was used as the tool material, which was fine-grained (dcBN = 2 μm) with a low cBN content grade of 50–55% and a ceramic TiN-based binder. This type of PCBN tool material is generally used in the machining of hardened steels. The tool is triangular in shape and features a negative type edge, with a noise radius of 0.8 mm and PCBN thickness of 4.76 mm, as shown in Figure 2a. Figure 2b shows the image from rake face using an optical microscope (VHX-6000, KEYENCE, Osaka, Japan), and significant grinding marks on the as-received tool can be observed.
In this study, PLG processing was conducted in the tool edge area framed in red in Figure 2a. After applying PLG processing, the roughness Ra of the PLG-processed surface, the cross-sectional profile, and the processed angle φ (chamfer angle between the as-deposited and processed surface) were measured using a surface profilometer (SJ-410, Mitutoyo, Kawasaki, Japan), which featured a stylus tip with a radius 2 µm, a cone angle of 60°, a horizontal resolution of 0.25 μm, and a vertical resolution of 0.000125 μm. The shape filter used was Gaussian. The cut-off length was 0.08 mm and the evaluation length was 0.4 mm. Ra was measured in the center of PLG area, parallel to the laser scanning direction as shown in the black line. The cross-sectional profile and the processed angle φ were measured perpendicular to the laser scanning direction, as shown by the blue line in Figure 2b. Scanning electron microscopy (SEM) (TM4000Plus, HITACHI, Tokyo, Japan) was used to investigate the morphology of the processed tool edges.

2.2. Plasma Visualization and Characterization

A schematic of the optical system for practical PLG processing, along with the plasma visualization setup, is shown in Figure 3. A high-speed camera (FASTCAM APX-RS, Photron, Tokyo, Japan) was used to capture the plasma. To capture the short lifetime-pulsed laser-produced plasma clearly, the shutter of the high-speed camera was synchronized with a laser pulse of 15 kHz so that halation could be effectively avoided. The frame rate was set to 15,000 fps (frame/s), and the shutter speed was 1/15,000 s. The camera was horizontally positioned, almost perpendicular to the processed surface, so that the entire laser-induced plasma could be clearly captured for the analysis. In the acquired image, the plasma presented as a bright shuttle-shaped luminous area, as shown in Figure 3b. Since the relative position of the high-speed camera and laser was fixed for the visualization experiments, and the photos were trimmed to the same size as those in the same position; the plasma character information, such as the plasma intensity distribution or coordinates of the luminous center, could be obtained from those photographs. Herein, the luminous center is the center of the region with the highest grayscale after the image graying treatment.

3. Results and Discussion

3.1. Visualization of the Plasma Evolution during PLG

Figure 4 shows the typical plasma images acquired by the high-speed camera at a pulse pitch of 2 μm. Because the camera was set at a frame rate of 15,000 fps and synchronized with the laser oscillator, each picture represents the plasma emission generated by one laser pulse. Figure 4a shows six randomly extracted plasma images in the first pass of laser scanning, illustrating good consistency. Figure 4b shows the evolution of the plasma’s luminescence with the processing pass during the repeated scanning of PLG. It can be seen that with an increase in the pass number, the intensity of plasma luminescence gradually weakened. The intensity became quite low after 50 passes of scan, with close to no luminescence after 100 passes, implying that the PLG processing had been completed and that the angle of the processed surface (φ shown in Figure 1b) had reached the abrasion threshold of the removal process. As this threshold value is directly dependent on the absorptivity, it varies significantly for different materials. Therefore, it was possible to visualize the PLG process from the start to the end by acquiring the changed images of the plasma luminescence using a high-speed camera.
Upon further observation, it was found that the plasma images of PLG in each stage showed different characteristics. In the first pass, shown in Figure 4b, the plasma luminescence presented discretely as multiple points rather than in a uniform manner. Because the as-received tool surface had a roughness Ra of approximately 0.8 μm after grinding, it was considered that multiple-point luminescence in the first pass was caused by the removal processing of the surface asperities. Subsequently, the plasma luminescence became uniform, with an increase in the number of passes. In addition, by comparing the plasma of the fifth, thirteenth, and twentieth passes, it was found that the luminous center (the brightest point) gradually moved downward in the images.
To further investigate the plasma’s evolution during the PLG process, the distribution of the plasma’s luminous intensity was analyzed, as shown in Figure 5. The plasma intensity after conversion to grayscale is quantitatively represented by the gray value of the plasma images. Figure 5a shows the longitudinal distribution of the intensity from the top to the bottom of each image at different processing passes. The optical microscopy images of the processed surfaces at different passes are shown in Figure 6, with the roughness Ra measured in the center part of the PLG area, as shown by the black horizontal line in Figure 2b, summarized on the right. In the multipoint luminescence stage (first pass), the surface asperities were flattened. As the processing progressed, the Ra obviously decreased (fifth pass), so that the intensity of the plasma’s luminosity became more uniform, implying that the longitudinal section of the processed crater was almost symmetrical. Subsequently, the plasma’s luminescence started to gather at one point. Comparing the distributions of 13, 20, and 50 passes in Figure 5a, it can be seen that the most luminous point, that is, the processing center of the laser, gradually moved rightward, meaning that this section of the crater became asymmetric, and the valley bottom gradually moved towards the tool edge. Meanwhile, the plasma intensity decreased with the pass number, indicating that the angle between the processed surface and laser beam became increasingly small, owing to the removal process. Figure 5b–d show the plasma intensity distributions of six randomly selected plasma images at stages of 1st, 20th, and 100th passes. In Figure 5b, the plasma intensity distributions at the processing center are quite different from those at the initial stage, corresponding to the ablated surface asperities. As the processing continued, at the 20th pass, the six distributions generally follow the same shape, although the intensity still varied, implying horizontal roughness. Finally, these distribution curves almost coincided with each other, indicating the end of the PLG. To verify this, the longitudinal cross-section profiles of different processed surfaces are also shown in Figure 7, with the hook-shaped profile of the 30th pass agreeing with the downward-moved luminous center. Finally, after the residual part of the tool edge was removed, the plasma returns to weak and uniform luminescence until the luminescence disappeared, which was similar to the finishing machining process. The PLG-processed surface, after 100 passes of scan, showed a significantly smoother surface than the upper unprocessed part and approximately 63% reduced Ra, as shown in Figure 6 and Figure 7.

3.2. Effect of Pulse Pitch on PLG Processing

Using the above visualization method, the effect of the pulse pitch on the PLG processing was investigated. The pulse energy was fixed, and the pulse pitch was set to 0.2, 2, and 20 μm, as shown in Table 1. To ensure that the total laser energy (irradiated pulse number) was consistent for these three conditions, the scanning pass number was set to 10, 100, and 1000, respectively. Figure 8 shows the optical microscopy images and roughness Ra of the PLG-processed surfaces under different pulse pitches, which illustrates that it had a great dependence on the pulse pitch. Considering the discolored surface (0.2 μm) and some longitudinal machining marks (20 μm), the specimen with a moderate pulse pitch of 2 μm showed the lowest roughness Ra. This result agrees with the results of previous research by our group [18,19], in which PLG was employed to implement CVD diamond-coated tool edge shaping, and there was always a lower limit value of finished surface roughness Rz of approximately 0.2 μm, due to the mechanical motion error of the stage according to the copy principle.
The plasma luminescence of these PLG processes was also acquired using a high-speed camera, as shown in Figure 9. The plasma luminescence images from top to bottom correspond to the results of three different pulse pitches, while the effective irradiated pulse number N from left to right represents the different processing stages of the PLG, which was calculated from the scanning pass number n, the pulse pitch p, and the laser spot diameter d, using the following formula: N = n × d/p. For a PLG of 0.2 μm, the processing was almost complete at approximately N = 625 (5th pass), which was much more rapid than that of 2 μm. By contrast, in the case of 20 μm, the plasma luminescence showed no significant change, but was even more intense after processing by N = 125 (100th pass). At N = 1250, faint plasma luminescence could still be observed, which revealed the different processing modes caused by the effect of the pulse pitch.
Furthermore, the changes in the coordinates of the luminous center with the PLG process for the three different conditions are summarized in Figure 10. As shown in Figure 3b, the X-axis was positive from the original trimming point to the right, and the Y-coordinate specified the distance from the top, meaning that the higher this value was, the lower the plasma luminescence. From the results of the X-axis, the position of the luminous center fluctuated greatly at the beginning and tended to be stable in the later stages. The error bar, as an estimation of the transverse height of the ridge between the pulse laser-ablated grooves of the tool surfaces during different processing stages, generally decreased with the number of irradiated laser pulses. This was especially true for that of 2 μm, where the variation of the X-coordinates in the final PLG was quite small, corresponding to the low roughness in Figure 8. According to the change in the Y-axis, the initial luminous center is near the middle of the image. With the change in the processed surface profile due to material removal, the center coordinates first increased and then returned to the middle, and the luminescence was faint at the final PLG stage.
For 0.2 μm, this Y-coordinate change also illustrates that PLG processing was much more rapid. By further comparing the luminous images with different conditions (2 μm and 20 μm), it was found that the plasma showed significant bilateral asymmetrical luminescence for the initial two images (first and second pass), which corresponds to the violent fluctuation in the initial few passes (red plots in Figure 10), implying that the subsequent laser pulse was significantly affected by the previous pulse due to the high overlap. Figure 11 shows the SEM image of the PLG-processed tool edge at a pulse pitch of 0.2 μm. Although the processed part appears smooth as a whole, from the magnified image on the right, some machining caused irregular longitudinal grooves on the tool edge tip, which was distinct from the other two and was probably due to excess machining. In addition, the cross-sectional profile at the different PLG stages was measured, from which the processed angle φ changing with the pass number was calculated and is shown in Figure 12. The angle φ directly reached 3.2° after the first pass processing and then drastically increased to 4.3° after the second pass. Next, the angle was almost constant until it was processed to 10 passes. This reveals that even though material removal still occurred in the third or subsequent passes, the final processed angle was determined at the initial PLG stage under these conditions.
Based on the above, we suggest a PLG processing mechanism with a 0.2 μm pulse pitch, as depicted in Figure 13. Since the pulse pitch was quite small, the overlap of the laser pulses was high for a specific irradiated area. As shown in Figure 13a, each laser pulse only shifted slightly, that is, 0.8% of the laser beam spot diameter, from the previous pulse. Thus, the following pulse irradiated the previously formed oblique side to produce asymmetrical luminescence (Figure 13b) and a large change between the X-coordinate of first pass and second pass, as shown in Figure 10. As a result, the reflected laser from this slope, similar to a wall effect, might lead to interference with the following laser pulse and cause local enhancement of the laser fluence at the valley part. This side wall effect, fabricated by laser processing, has also been reported in other studies investigating the variations that inhibit the fabrication of flat surfaces [20,21,22]. Owing to this localized laser, grooves in some local parts of the processed surface formed (Figure 13c) that were even deeper (for example, as the yellow dashed line) than the theoretically processed surface (red dashed line, the same as the φ in Figure 1b). Subsequently, because in these parts the fluence was lower than the ablation threshold, the subsequent repeated scanning could not correct the times, resulting in the initially formed excess machining marks remaining until the end. Consequently, the surface roughness under the condition of a 0.2 μm pulse pitch could not be reduced further.
By contrast, if the pulse pitch was sufficiently wide, the aforementioned effect of the oblique side shown in Figure 13 did not occur. Therefore, for a pulse pitch of 20 μm, regardless of the processing progress, the observed plasma luminescence is bilaterally symmetrical, indicating little influence between the pulses in one pass. In addition, as the scanning of each pass is random, theoretically, after the first pass scanning, in the subsequent passes, different places will be processed, so the luminous coordinate of the visualization experiment should have a certain degree of shift. However, as a result of the condition of 20 μm shown in Figure 10, the X-coordinate of the tenth pass had almost no shift from that of first pass. This implies that an incubation effect might have occurred, in which the ablation threshold decreased under multi-pulse irradiation, probably due to the accumulation of laser-induced chemical and/or structural changes in the material and/or plastic deformation of the surface [23]. This effect was first observed during the laser ablation of metals with nanosecond pulses [24]. To verify this, the initial processing stage from 1 to 10 passes was further investigated with the optical microscopy images of processed surfaces after 1, 2, 3, 5, 10, and 100 passes of PLG, as shown in Figure 14. It can be seen that after one pass, there were only a few weak machining marks at the tool tip. With an increase in the number of passes, the longitudinal machining marks, with a periodic 20 μm pitch, became increasingly significant. At the tenth pass, the machining marks were at the same positions as that of first pass, and appeared to be deeper. Subsequently, after 100 passes of processing, these marks formed in the initial stage became shallow again, and the processed surface became relatively flat as the PLG processing progressed. This agrees with the X-coordinate results plotted in blue in Figure 10, which show a slight shift from 1 to 10 passes, but an obvious shift after 100 passes of scanning.
Figure 15 shows the proposed mechanism of machining mark formation under the condition of a 20 μm pulse pitch. After the first pass of processing, the ablation threshold of the positions irradiated by the laser decreased due to the incubation effect, so that in the subsequent passes (such as the second, third, fifth, and tenth passes in Figure 14), these parts were more readily processed. Although there were still some small shifts, it generally made the machining marks increasingly significant. However, after 100 passes, these small shift effects gradually accumulated, to a certain degree, flattening the surface, eventually resulting in an unsatisfactorily processed surface. Thus, even after the averaging effect of the next 900 passes, the initially formed deep marks were not completely erased. This preferential processing can also explain why the plasma luminescence was observed at 1000 passes, as shown in Figure 9.
Based on the above, theoretically, after sufficient passes of laser scanning, a smooth processed surface can be achieved regardless of the pulse pitch in each pass. However, the results show that a pulse pitch that is too large or too small contributes to the formation of a tool edge surface with low roughness. In the case of the small pulse pitch (0.2 μm) used in this study, it is considered that the oblique side effect caused excess machining (even deeper than the theoretical processed surface), leading to the irregular grooves and unsatisfactory roughness of the tool edge. On the other hand, when a relatively large pulse pitch was used, the incubation effect inhibited the fabrication of smooth surfaces. The phenomenon of this laser irradiation-induced ablation threshold decrease also occurred for a pulse pitch of 2 or 20 μm, and it can accelerate processing. Since it is generally reported that the incubation effect is more significant under conditions of high repetition rates, this might also explain the high processing rate of 0.2 μm. However, when the pulse pitch is large, the incubation effect occurs only on the laser-irradiated part, resulting in an ablation threshold periodically changing the surface, as shown in Figure 15. This non-uniform surface directly affects the subsequent theoretical random processing, and the deep longitudinal machining marks formed in the initial stage cannot be corrected. Therefore, we propose that it is crucial to select a moderate pulse pitch condition for the PLG processing of tool edges in order to avoid the high overlap caused by excess machining, and to simultaneously ensure the formation of a uniform laser-irradiated surface in the initial stage.
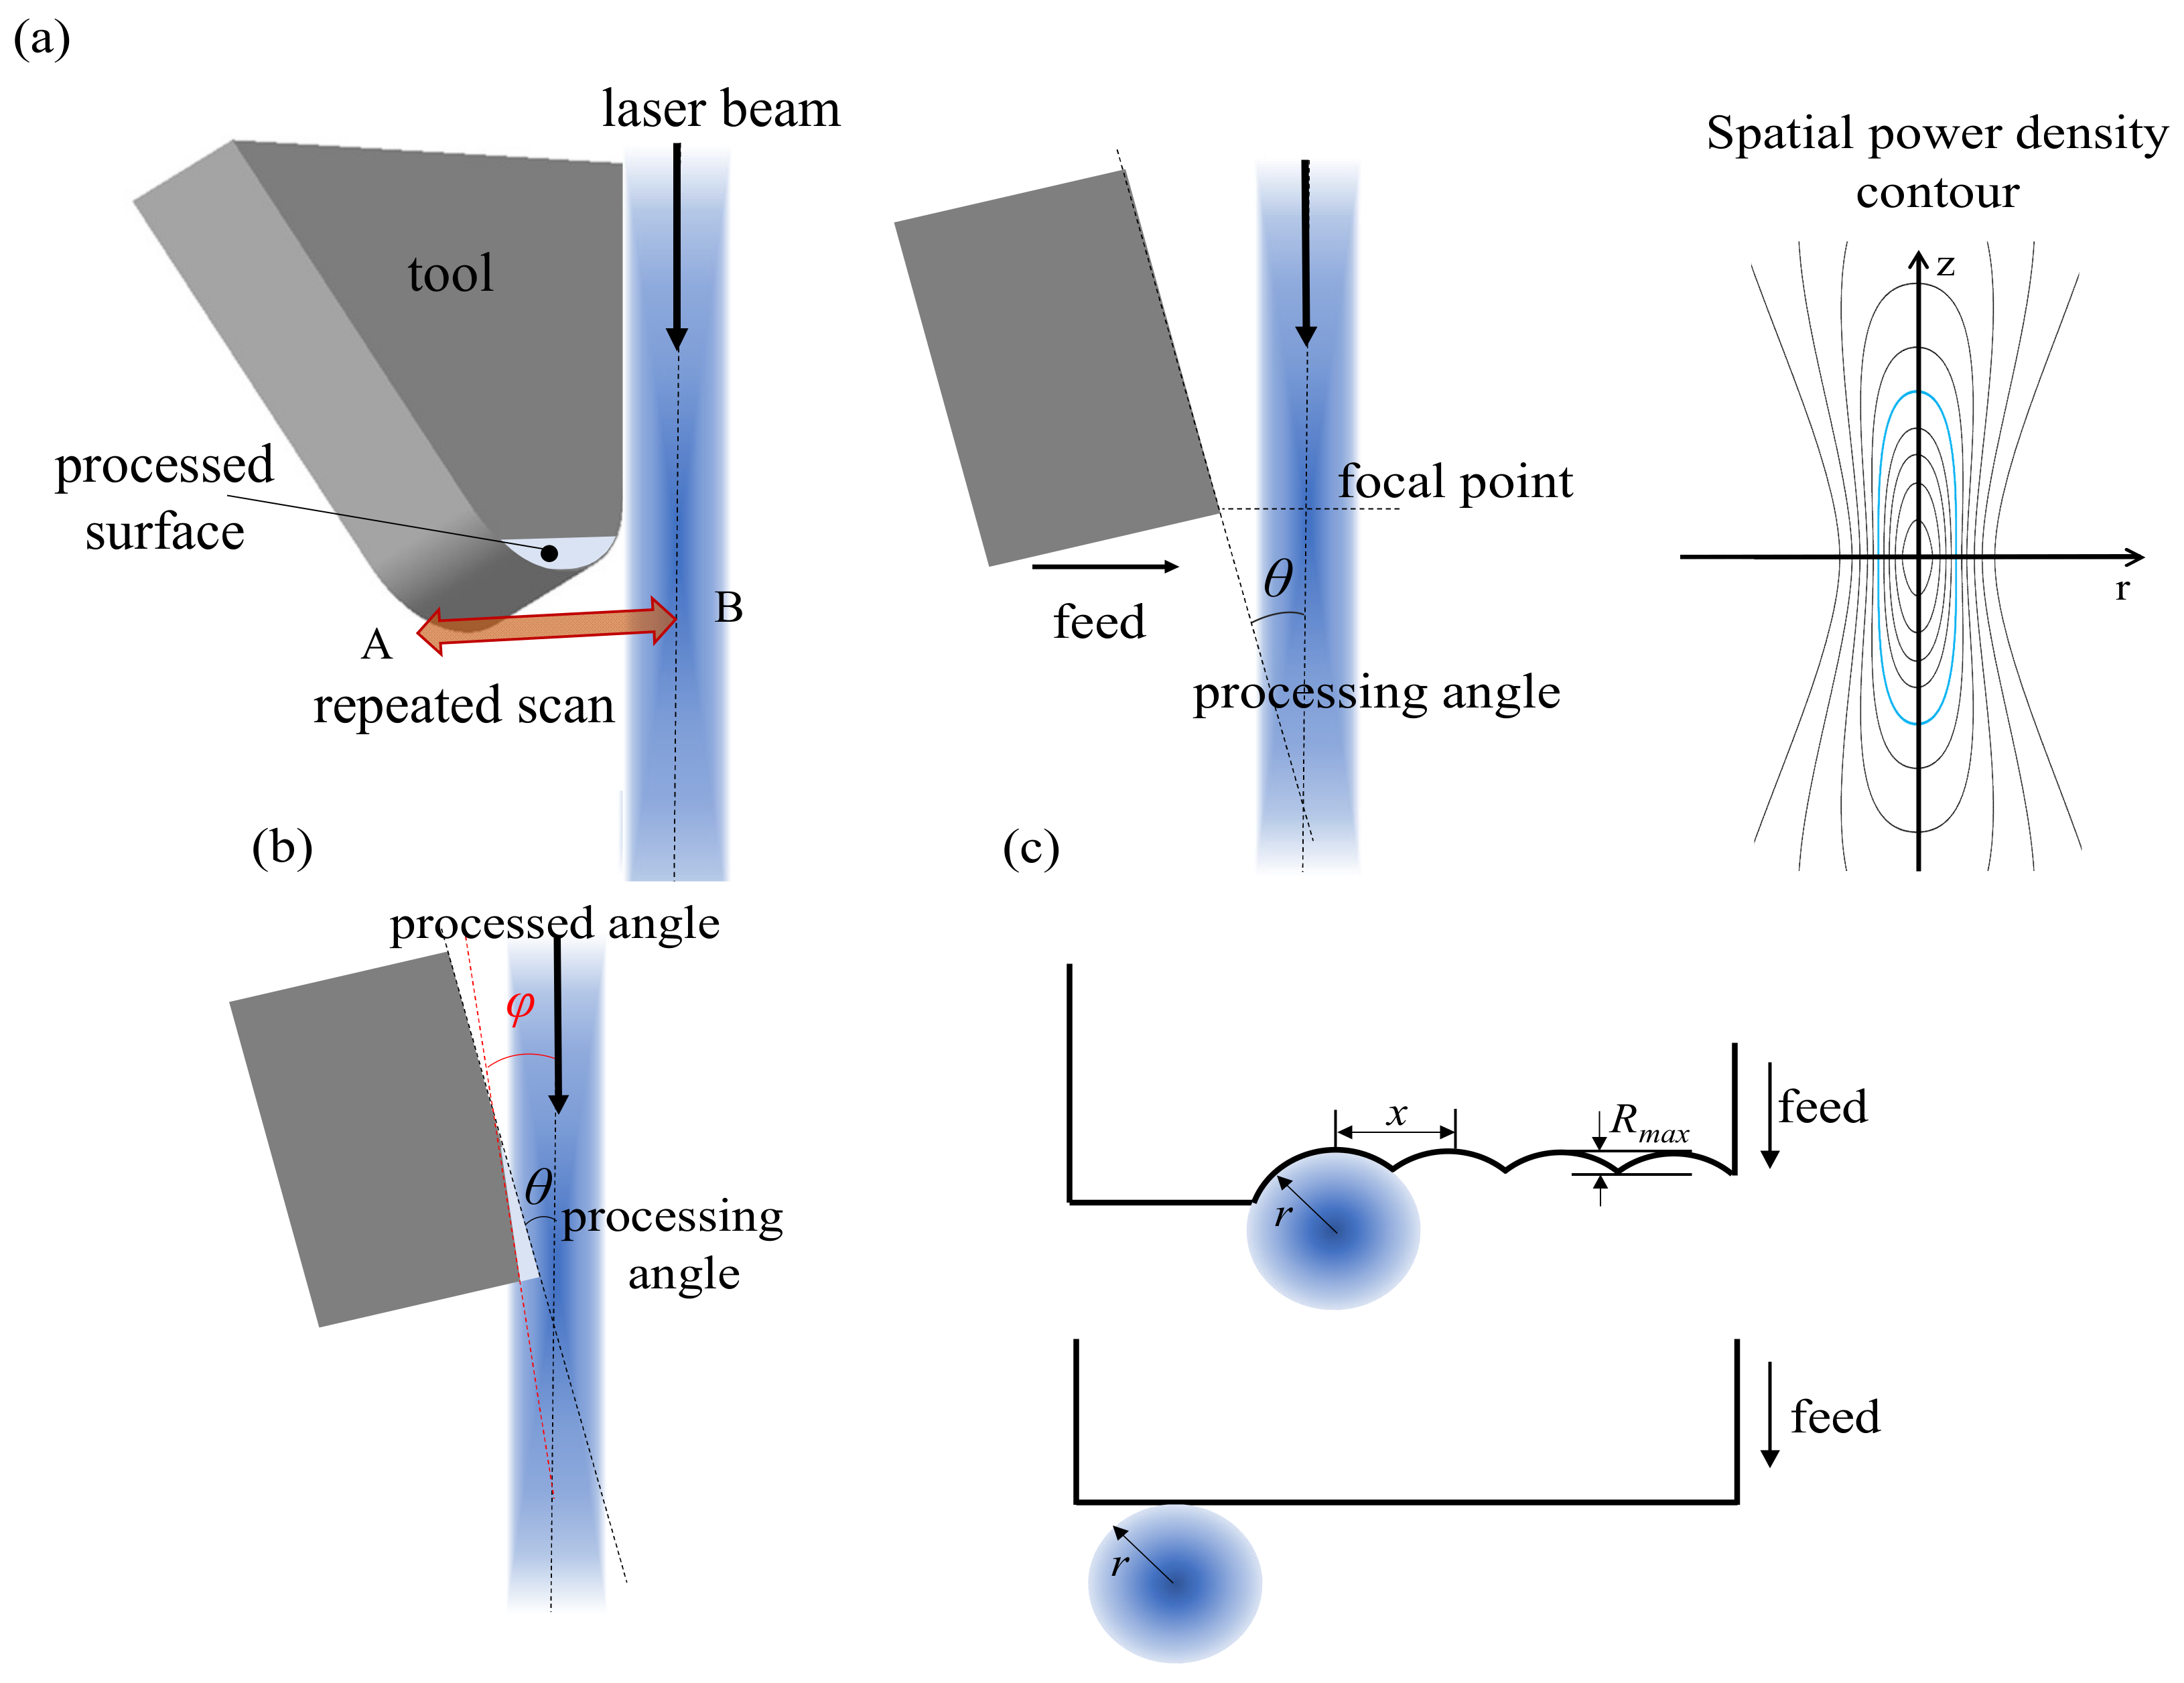
On the other hand, the laser pulse energy in this study was fixed at 200 μJ based on the previous results of PLG as a proper condition. For the effect of pulse energy, when increasing pulse energy, the crater processed by one pulse is higher, which leads to more longitudinal machining marks and higher roughness (the Rmax in Figure 1c would be higher) on the surface. By contrast, it seems that decreasing the pulse energy seems can help to obtain a smoother processed surface, but insufficient pulse energy limits the final processed angle as well as reducing processing efficiency. Therefore, a relatively sufficient but, not too high, pulse energy can better ensure the precision of PLG-processed surfaces, which was also proven by the experimental results in [14]. Moreover, employing a low pulse energy in the final stage of PLG, as a finishing process in conventional grinding, might further improve surface roughness.
In this study, the PLG processing progress was clarified in detail by observing plasma evolution using a high-speed camera. Based on the correlation of plasma intensity and ablation volume, an in situ modeling of the PLG tool edge formation process will be performed in subsequent research, and the optimization of the combination of pulse pitch and laser pulse energy is also expected. Furthermore, we found that there was still a lower limit value for the roughness of the PLG-processed surface. In addition to the motion error of the stage or the transverse variance of the material defects, for the tool material PCBN, we considered that the distinct ablation threshold of the cBN and the binder material TiN might also play a key role. According to recent research on the influence of pulse duration in the pulsed-laser ablation of PCBN tools [25,26], for the fine-grained low cBN content grade with Ti-based ceramic-based binder PCBN, which is quite similar to the one used in this study, when processed with a nanosecond laser, the melting and recrystallization of the binder material lead to a reduction in surface quality. This is probably due to the thermal impact; decreasing the pulse duration of the laser to ps or fs could suppress this significant effect. Hence, to further improve the surface integrity of the PCBN tool, PLG processing using a femtosecond laser is required.

4. Conclusions

In this study, an in situ visualization of the tool-edge shaping process was conducted by observing the plasma luminescence generated during the PLG process using a high-speed camera. The findings of this study are as follows:
  • In PLG processing, the initial material removal was not uniform, showing multi-point luminescence. Subsequently, the processing became even, and the machining center gradually moved towards the tool edge. Finally, it returned to an even finishing process, and a smooth surface was obtained.
  • PLG at a pulse pitch of 2 μm showed a roughness superior to the others. Under the condition of the same irradiated laser energy, the progression speed of the PLG decreased significantly with the increase in pulse pitch, which revealed that the different tool-edge processing modes were caused by the effect of the pulse pitch.
  • In the case of a pulse pitch of 0.2 μm, the roughness was mainly due to the excess machining caused by the oblique side effect, as proven by the asymmetrical plasma luminescence. These processed grooves, deeper than the theoretically processed angle φ, were not possible to correct in the subsequent process.
  • When the pulse pitch was 20 μm, the low overlap degree led to an ‘incubation effect’ during the PLG process, which could not uniformly cover the whole processed surface. Therefore, the ablation threshold was decreased partly and was preferentially removed in the next pass, resulting in longitudinal machining marks.

Author Contributions

Conceptualization, X.L. and F.I.; validation, X.N. and O.K.; formal analysis, X.N. and X.L.; investigation, X.N. and H.F.; data curation, X.N. and X.L.; writing—original draft preparation, X.L.; writing—review and editing, X.L. and S.M.; visualization, X.N.; supervision, F.I.; funding acquisition, X.L. All authors have read and agreed to the published version of the manuscript.

Funding

This research was funded by the Grant-in-Aid for Young Scientists (B) from JSPS KAKENHEI [grant number 19K14876].

Institutional Review Board Statement

Not applicable.

Informed Consent Statement

Not applicable.

Data Availability Statement

Not applicable.

Conflicts of Interest

The authors declare no conflict of interest.

References

  1. Tönshoff, H.K.; Friemuth, T. In-process dressing of fine diamond wheels for tool grinding. Precis. Eng. 2000, 24, 58–61. [Google Scholar] [CrossRef]
  2. Denkena, B.; Grove, T.; Behrens, L. Wear Mechanisms in Grinding of PCBN. Adv. Mater. Res. 2016, 1136, 555–560. [Google Scholar] [CrossRef]
  3. Konov, V. Laser in micro and nanoprocessing of diamond materials. Laser Photon-Rev. 2012, 6, 739–766. [Google Scholar] [CrossRef]
  4. Zahedi, A.; Tawakoli, T.; Azarhoushang, B.; Akbari, J. Picosecond laser treatment of metal-bonded CBN and diamond superabrasive surfaces. Int. J. Adv. Manuf. Technol. 2014, 76, 1479–1491. [Google Scholar] [CrossRef]
  5. Guo, B.; Zhang, J.; Wu, M.; Zhao, Q.; Liu, H.; Monier, A.; Wang, J. Water assisted pulsed laser machining of micro-structured surface on CVD diamond coating tools. J. Manuf. Process. 2020, 56, 591–601. [Google Scholar] [CrossRef]
  6. Denkena, B.; Grove, T.; Krödel, A.; Ellersiek, L. Increased performance in high speed turning of Inconel 718 by laser structuring of PcBN tools. Procedia CIRP 2018, 77, 602–605. [Google Scholar] [CrossRef]
  7. Walter, C.; Komischke, T.; Weingärtner, E.; Wegener, K. Structuring of CBN Grinding Tools by Ultrashort Pulse Laser Ablation. Procedia CIRP 2014, 14, 31–36. [Google Scholar] [CrossRef] [Green Version]
  8. Brecher, C.; Klocke, F.; Schindler, F.; Janssen, A.; Fischer, B.; Hermani, J.-P. Finishing of polycrystalline diamond tools by combining laser ablation with grinding. Prod. Eng. 2013, 7, 361–371. [Google Scholar] [CrossRef]
  9. Yang, Y.; Zhao, G.; Hu, M.; Li, L.; He, N.; Jamil, M. Fabrication of CVD diamond micro-milling tool by hybrid machining of laser-induced graphitization and precision grinding. Ceram. Int. 2019, 45, 24127–24136. [Google Scholar] [CrossRef]
  10. Suzuki, D.; Itoigawa, F.; Kawata, K.; Nakamura, T. Using Pulse Laser Processing to Shape Cutting Edge of PcBN Tool for High-Precision Turning of Hardened Steel. Int. J. Autom. Technol. 2013, 7, 337–344. [Google Scholar] [CrossRef]
  11. Saito, H.; Jung, H.; Shamoto, E.; Suganuma, S.; Itoigawa, F. Mirror Surface Machining of Steel by Elliptical Vibration Cutting with Diamond-Coated Tools Sharpened by Pulse Laser Grinding. Int. J. Autom. Technol. 2018, 12, 573–581. [Google Scholar] [CrossRef]
  12. Liu, X.; Natsume, K.; Maegawa, S.; Itoigawa, F. Micromachining of polycrystalline CVD diamond-coated cutting tool with femtosecond laser. J. Adv. Mech. Des. Syst. Manuf. 2020, 14, JAMDSM0059. [Google Scholar] [CrossRef]
  13. Liu, X.; Natsume, K.; Maegawa, S.; Itoigawa, F. Improvement of crystallization in CVD diamond coating induced by femtosecond laser irradiation. Diam. Relat. Mater. 2020, 107, 107883. [Google Scholar] [CrossRef]
  14. Liu, X.; Konda, O.; Furuhashi, H.; Natsume, K.; Maegawa, S.; Itoigawa, F. Development of High-Performance Polycrystalline CVD Diamond-Coated Cutting Tools Using Femtosecond Lasers. Int. J. Autom. Technol. 2021, 15, 413–421. [Google Scholar] [CrossRef]
  15. Seto, N.; Katayama, S.; Matsunawa, A. High-speed simultaneous observation of plasma and keyhole behavior during high power CO2 laser welding: Effect of shielding gas on porosity formation. J. Laser Appl. 2000, 12, 245–250. [Google Scholar] [CrossRef]
  16. Berthe, L.; Fabbro, R.; Peyre, P.; Tollier, L.; Bartnicki, E. Shock waves from a water-confined laser-generated plasma. J. Appl. Phys. 1997, 82, 2826–2832. [Google Scholar] [CrossRef]
  17. Amoruso, S.; Bruzzese, R.; Spinelli, N.; Velotta, R. Characterization of laser-ablation plasmas. J. Phys. B At. Mol. Opt. Phys. 1999, 32, R131–R172. [Google Scholar] [CrossRef]
  18. Suganuma, S.; Itoigawa, F.; Hayakawa, S.; Maegawa, S.; Nakamura, T. 0520 Enhancing Cutting Performance of Diamond Coating Tool by Edge Sharpening with Short Pulse Laser. In Proceedings of the International Conference on Leading Edge Manufacturing in 21st Century: LEM21, Kyoto, Japan, 18–22 October 2015; pp. 520–521. [Google Scholar]
  19. Mabuchi, Y.; Itoigawa, F.; Nakamura, T.; Kawata, K.; Suganuma, T. High Precision Turning of Hardened Steel by Use of PcBN Insert Sharpened with Short Pulse Laser. Key Eng. Mater. 2015, 656–657, 277–282. [Google Scholar] [CrossRef]
  20. Hidai, H.; Kuroki, Y.; Matsusaka, S.; Chiba, A.; Morita, N. Curved drilling via inner hole laser reflection. Precis. Eng. 2016, 46, 96–103. [Google Scholar] [CrossRef] [Green Version]
  21. Fabbro, R.; Chouf, K. Keyhole modeling during laser welding. J. Appl. Phys. 2000, 87, 4075–4083. [Google Scholar] [CrossRef]
  22. Ki, H.; Mohanty, P.S.; Mazumder, J. Multiple reflection and its influence on keyhole evolution. J. Laser Appl. 2018, 933, 933–942. [Google Scholar]
  23. Di Niso, F.; Gaudiuso, C.; Sibillano, T.; Mezzapesa, F.P.; Ancona, A.; Lugarà, P.M. Role of heat accumulation on the incubation effect in multi-shot laser ablation of stainless steel at high repetition rates. Opt. Express 2014, 22, 12200–12210. [Google Scholar] [CrossRef] [PubMed]
  24. Jee, Y.; Becker, M.F.; Walser, R.M. Laser-induced damage on single-crystal metal surfaces. J. Opt. Soc. Am. B 1988, 5, 648–659. [Google Scholar] [CrossRef]
  25. Denkena, B.; Krödel, A.; Grove, T. Influence of pulsed laser ablation on the surface integrity of PCBN cutting tool materials. Int. J. Adv. Manuf. Technol. 2018, 101, 1687–1698. [Google Scholar] [CrossRef]
  26. Denkena, B.; Krödel, A.; Grove, T. On the pulsed laser ablation of polycrystalline cubic boron nitride—Influence of pulse duration and material properties on ablation characteristics. J. Laser Appl. 2019, 31, 022004. [Google Scholar] [CrossRef]
Figure 1. (a) Schematic of PLG processing of tool edge; (b) processing angle θ and processed angle φ before and after PLG; (c) ideal surface roughness after PLG processing. In this study, a nanosecond laser with a wavelength of 355 nm, generated by the third harmonic of a Nd: YAG laser, was employed. The laser beam was focused using a lens with a focal length of 10 mm and a spot diameter of approximately 25 μm. The detailed PLG conditions are presented in Table 1. The pulse pitch was calculated by dividing scanning speed by repetition rate, and set as 2, 0.2, and 20 μm.
Machines 10 00196 g001
Figure 2. (a) PCBN cutting tools. (b) Optical microscope image of PCBN tool edge.
Machines 10 00196 g002
Figure 3. (a) Schematic of PLG system with a sync signal and high-speed camera for plasma visualization. (b) Image of plasma acquired by high-speed camera.
Machines 10 00196 g003
Figure 4. Evolution of typical plasma images for (a) first pass; and (b) changes with processing pass for PLG at a pulse pitch of 2 μm.
Machines 10 00196 g004
Figure 5. (a) Longitudinal distribution of typical plasma intensities with the evolution of processing passes for PLG at a pulse pitch of 2 μm. (b) Plasma intensity distribution of six randomly extracted images at 1st pass, (c) 20th pass, and (d) 100th pass.
Machines 10 00196 g005
Figure 6. Evolution of the PLG-processed surface of different processing pass numbers for PLG at a pulse pitch of 2 μm. (a) Optical microscope images of the PLG surfaces. (b) Roughness Ra of the middle part of the PLG-processed area parallel to the laser-scanning direction.
Machines 10 00196 g006
Figure 7. Cross-sectional profile perpendicular to the laser-scanning direction of different processing pass numbers shown in (ac) for PLG at a pulse pitch of 2 μm.
Machines 10 00196 g007
Figure 8. The PLG-processed surface at different pulse pitches of 0.2, 2, and 20 μm after the same number of effective irradiated pulses of 1250: (a) Optical microscope images and (b) roughness Ra.
Machines 10 00196 g008
Figure 9. Evolution of plasma intensity distribution in PLG processing at different pulse pitches.
Machines 10 00196 g009
Figure 10. The coordinates of the luminous center change with the effective irradiated pulse number: (a) X coordinate, (b) Y coordinate.
Machines 10 00196 g010
Figure 11. SEM image of the PLG-processed surface at the pulse pitch of 0.2 μm with a magnification of (a) 150 and (b) 500.
Machines 10 00196 g011
Figure 12. (a) Cross-sectional profile perpendicular to the laser scanning direction and (b) processed angle for PLG at a pulse pitch of 0.2 μm.
Machines 10 00196 g012
Figure 13. Schematics of the PLG mechanism at a pulse pitch of 0.2 μm: (a) longitudinally along the direction of the laser; (b) horizontally perpendicular to the direction of the laser; (c) processing angle θ and theoretical processed angle φ.
Machines 10 00196 g013
Figure 14. Optical microscope images of the PLG surfaces during the initial processing stage at a pulse pitch of 20 μm.
Machines 10 00196 g014
Figure 15. Schematics of the PLG mechanism at a pulse pitch of 20 μm.
Machines 10 00196 g015
Table 1. PLG processing conditions.
Condition No.123
Pulse energy, μJ200
Pulse width, ns7
Processing angle, deg6
Pulse repetition rate, kHz15151.5
Scanning speed, mm/s30330
Pulse pitch, μm20.220
Publisher’s Note: MDPI stays neutral with regard to jurisdictional claims in published maps and institutional affiliations.

