Article

Effect of Inlet Condition on the Performance Curve of a 10 MW Supercritical Carbon Dioxide Centrifugal Compressor

1
Tianjin Key Laboratory for Advanced Mechatronic System Design and Intelligent Control, School of Mechanical Engineering, Tianjin University of Technology, Tianjin 300384, China
2
National Demonstration Center for Experimental Mechanical and Electrical Engineering Education, Tianjin University of Technology, Tianjin 300384, China
3
Marine Engineering College, Jimei University, Xiamen 361000, China
*
Author to whom correspondence should be addressed.
Machines 2022, 10(5), 359; https://doi.org/10.3390/machines10050359
Submission received: 11 April 2022 / Revised: 29 April 2022 / Accepted: 4 May 2022 / Published: 10 May 2022
(This article belongs to the Section Turbomachinery)

Abstract

:
The influence of inlet condition upon the performance and stability for a 10 MW supercritical carbon dioxide centrifugal compressor is investigated using the computational fluid dynamics method. The inlet conditions which are considered are as follows, a constant inlet pressure of 8.0 MPa with varying inlet temperatures of 308.15 K, 308 K, 306 K, and 304 K, and a fixed inlet temperature of 308.15 K with different inlet pressures of 7.5 MPa, 8.0 MPa and 8.5 MPa. The numerical method with the k-omega based shear-stress-transport turbulence model is validated compared to the published experimental data. The numerical result shows that a small variation of temperature or pressure significantly has huge impact on the compressor performance operating near the critical point of supercritical carbon dioxide. As the compressor inlet pressure increases, the compression factor of the working fluid becomes lower, resulting in an enlargement of the pressure ratio. However, the decrease in inlet temperature leads to a higher compression factor of the working fluid and a reduced pressure ratio. The variation of the isentropic efficiency curve is mainly attributed to the change in the compressor inlet volumetric flow rate. The locations of the stall point and choke point are dependent on the values of inlet pressure and temperature.

1. Introduction

The supercritical carbon dioxide (S-CO2) Brayton power cycle, first proposed and studied in [1,2], has been recognized as one of the most promising power generation technologies. Nowadays, it has raised more and more attention and is widely applied in ship waste recovery, solar thermal power generation, industrial waste heat power generation, and other energy conversion fields. As reported in [3], when the working condition at the compressor inlet is around the critical point of S-CO2, a higher thermal efficiency of the S-CO2 Brayton cycle can be obtained due to less work consumption of the compressor. However, the physical properties of CO2 show a strong nonlinearity, especially where near the critical point. A subtle change in temperature or pressure leads to drastic variations in density, specific heat at a constant pressure around the critical point. Hence, the variation in inlet conditions for the S-CO2 centrifugal compressor will affect its aerodynamic performance and stability operation margin.
A great deal of research has been performed to develop a large-scale, high efficacy S-CO2 centrifugal compressor in recent years. The related experimental works are summarized as follows. Wright et al. [4] conducted the pioneering experimental trial of the 100-kW compressor in Sandia National Laboratory. Their test indicated that the S-CO2 centrifugal compressor could operate stably at an inlet condition in a supercritical or two-phase state near the critical point. Ahn et al. [5] performed the experimental tests for the 109-kW low-pressure and 69 kW high-pressure compressors for the simple recuperated Brayton cycle in Korea Atomic Energy Research Institute. Their preliminary test results showed that when CO2 entered the compressor, due to the shift from subcritical state to supercritical state, a higher rotating speed occurred, resulting in an obvious disturbance to the compressor stability. The simple 100-kW Brayton cycle experimental test was developed in U.S. Navy Nuclear Laboratory. The influences of inlet pressure and temperature on the S-CO2 centrifugal compressor were investigated in [2,6]. They revealed that when the state of CO2 at the compressor inlet was in the liquid-like phase region, a higher pressure ratio was achieved, and the isentropic efficiency and enthalpy increase were both higher than the values from the theoretical calculations. Recently, Zhu et al. [7] carried out the experimental test of a 1MW compressor in the Institute of Engineering Thermophysics, Chinese Academy of Sciences. They observed that the compressor isentropic efficiency was improved significantly when CO2 at the compressor inlet changed from saturated state to critical or supercritical state. Alongside the experimental studies, theoretical prediction works were also performed. Chen et al. [8] studied the impact of inlet boundary conditions based on the one-dimensional design model. They found that as the inlet pressure decreased or the inlet pressure increased, a higher pressure ratio could be obtained, and the S-CO2 compressor might be prone to stall.
The Computational Fluid Dynamics (CFD) method has been widely applied for the performance prediction, rotating stall margin calculation, and the internal flow field for air or gas compressors [9,10,11]. Unlike air or gas, the thermophysical properties of CO2 deviate violently from ideal working fluid, especially where near the critical point, which results in the questionable convergence in CFD simulations for S-CO2 compressors [12,13,14,15,16]. Therefore, the real thermophysical properties of CO2 should be obtained accurately and provided in CFD simulations. Rinaldi et al. [17] believed that the look-up table generation of the thermophysical properties by calling the software NIST Refprop could save computational time and guarantee the prediction accuracy, compared with direct solution of the real state equations. Jiang et al. [18] further discussed the impact of the look up table resolution in the CFD simulation for S-CO2 centrifugal compressors. They found that the thermophysical property tables with different resolutions had great impacts on the compressor performance, and the low-resolution table could not accurately describe the density variation with the change of temperature or pressure around the critical point. Hence, the proper resolution of the thermophysical property table is an important precondition for the accurate prediction for the S-CO2 compressor.
To the best of our knowledge, there is limited research on the influence of inlet conditions on the performance and stability of the S-CO2 centrifugal compressor using the CFD method. Herein, a 10 MW S-CO2 centrifugal compressor is focused and investigated numerically using the software NUMECA in this paper. The performance curves at different compressor temperatures and pressures at a constant rotating speed are obtained and discussed. We hope our research can provide theoretical basis and a different perspective to improve the performance of S-CO2 centrifugal compressors.

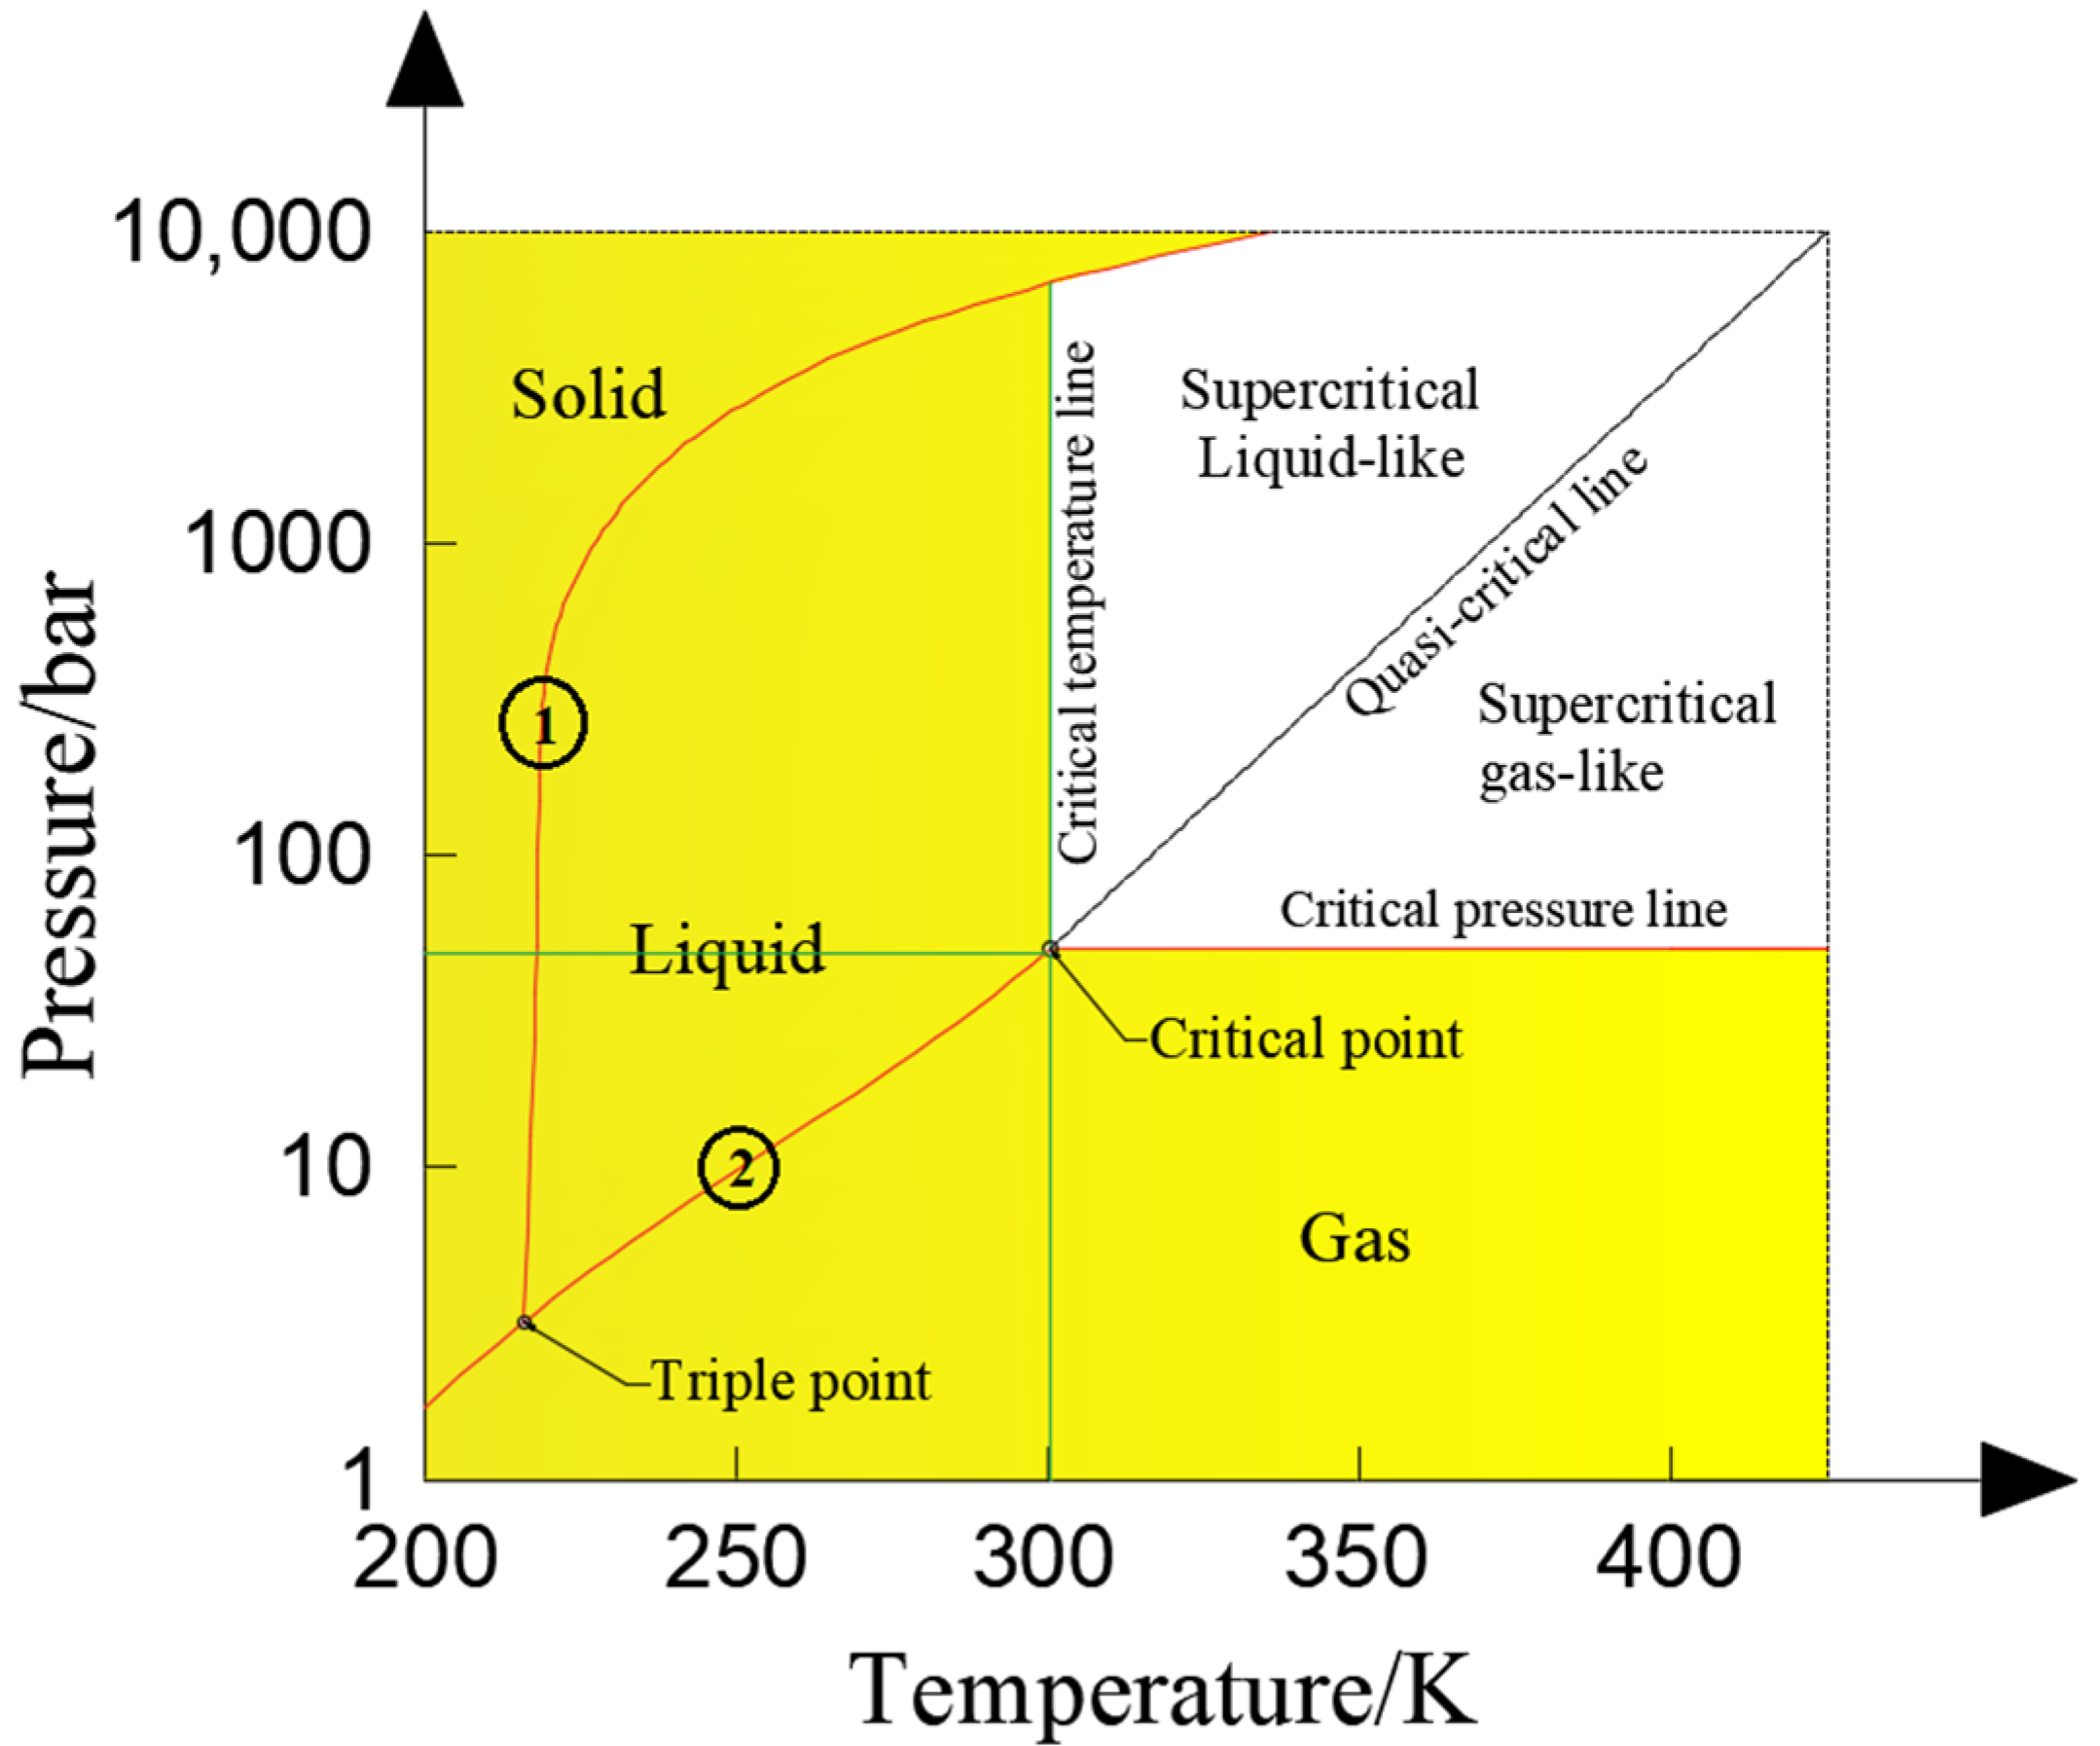
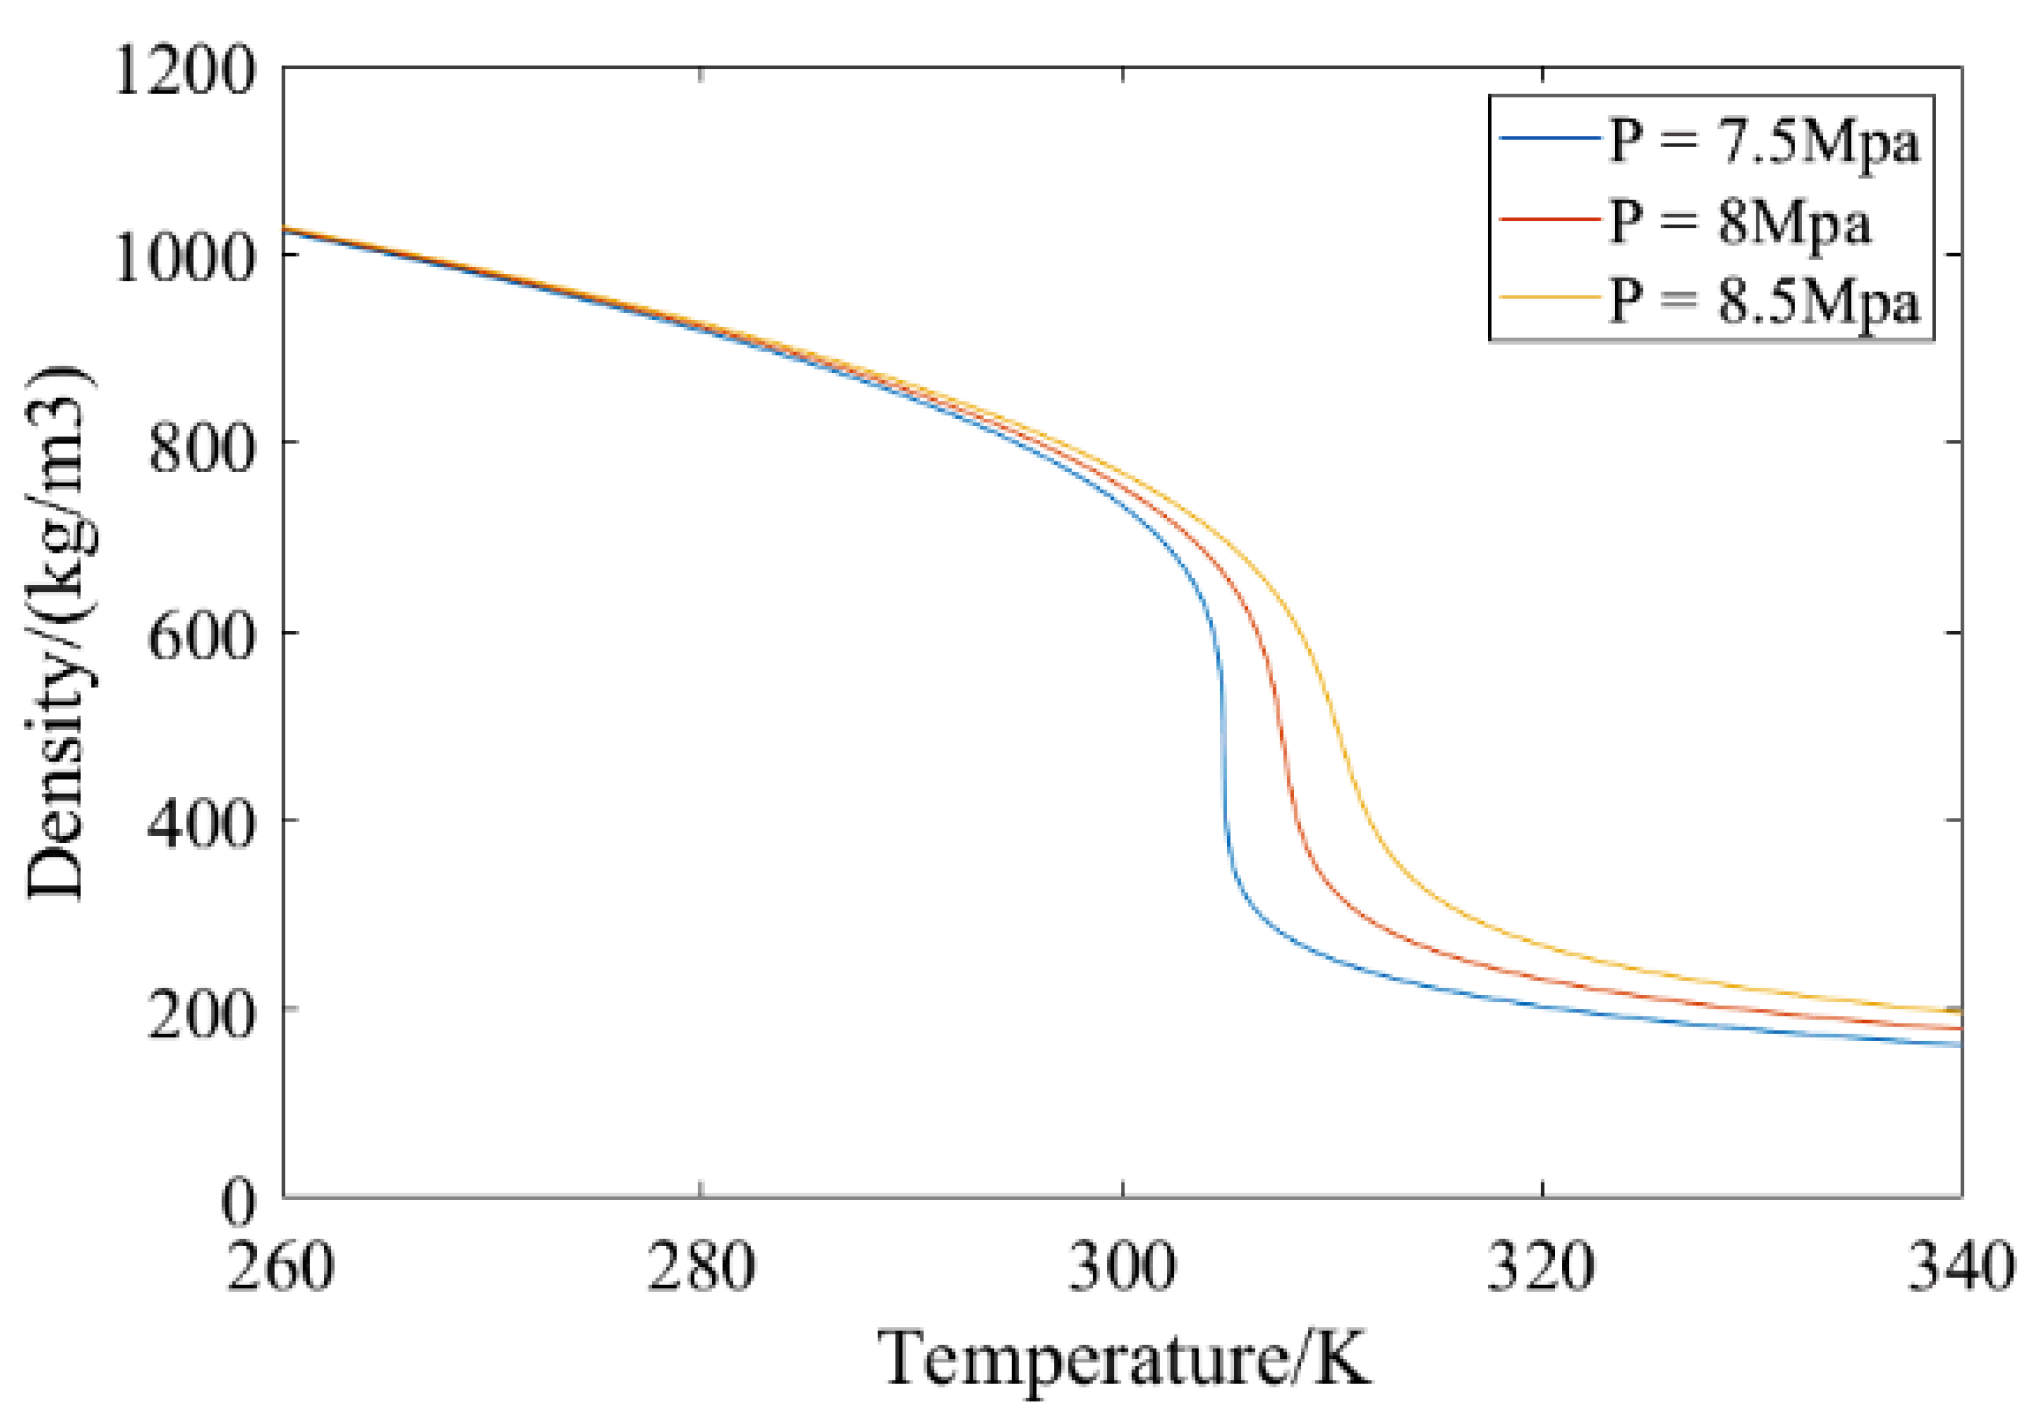
2. Thermophysical Property of S-CO2 near the Critical Point

The phase diagram of fluid CO2 is illustrated in Figure 1, including the solid, liquid, gas, and supercritical phases. The temperature and the pressure of the critical point are 304.13 K and 7.38 MPa, respectively. When the state point locates beneath the critical pressure line and the vapor line, the fluid is in the gas phase. The line ➀ represents the solid-liquid two-phase equilibrium line, also known as the melting line If the state point is surrounded by the melting line ➀, critical temperature line, and vapor line ➁, the fluid enters the liquid region. As pressures and temperatures are well above the relevant critical values, the fluid is said to be in the supercritical region. In the current study, two sub-sections, i.e., the supercritical liquid-like and gas-like ones, are further divided by the quasi-critical line.
According to the efficiency analysis for a simple recuperated Bryton cycle presented in [3], a peak cycle efficacy occurs under the compressor inlet conditions close to the critical point with a lower temperature and a higher pressure. However, the slight variation of compressor inlet conditions may result in the phase change. For example, when the temperature is below 304.13 K and the pressure is above 7.38 MPa, fluid CO2 changes from supercritical state to liquid state. This would veritably lead to remarkable changes in physical properties and greatly impact the centrifugal compressor’s performance map and stable operation. Figure 2 displays the density variation relative to the temperature at different isobars of 7.5, 8.0, and 8.5 MPa near the critical point. As the temperature rises, the density drops sharply and has a nearly changeless profile at either isobar line. Moreover, when the pressure increases, the slope of the density variation profile inversely declines. The changes in slope indicate the strong non-linear relationship between the temperature and pressure at the critical temperature.

3. Geometric Model and Numerical Setup

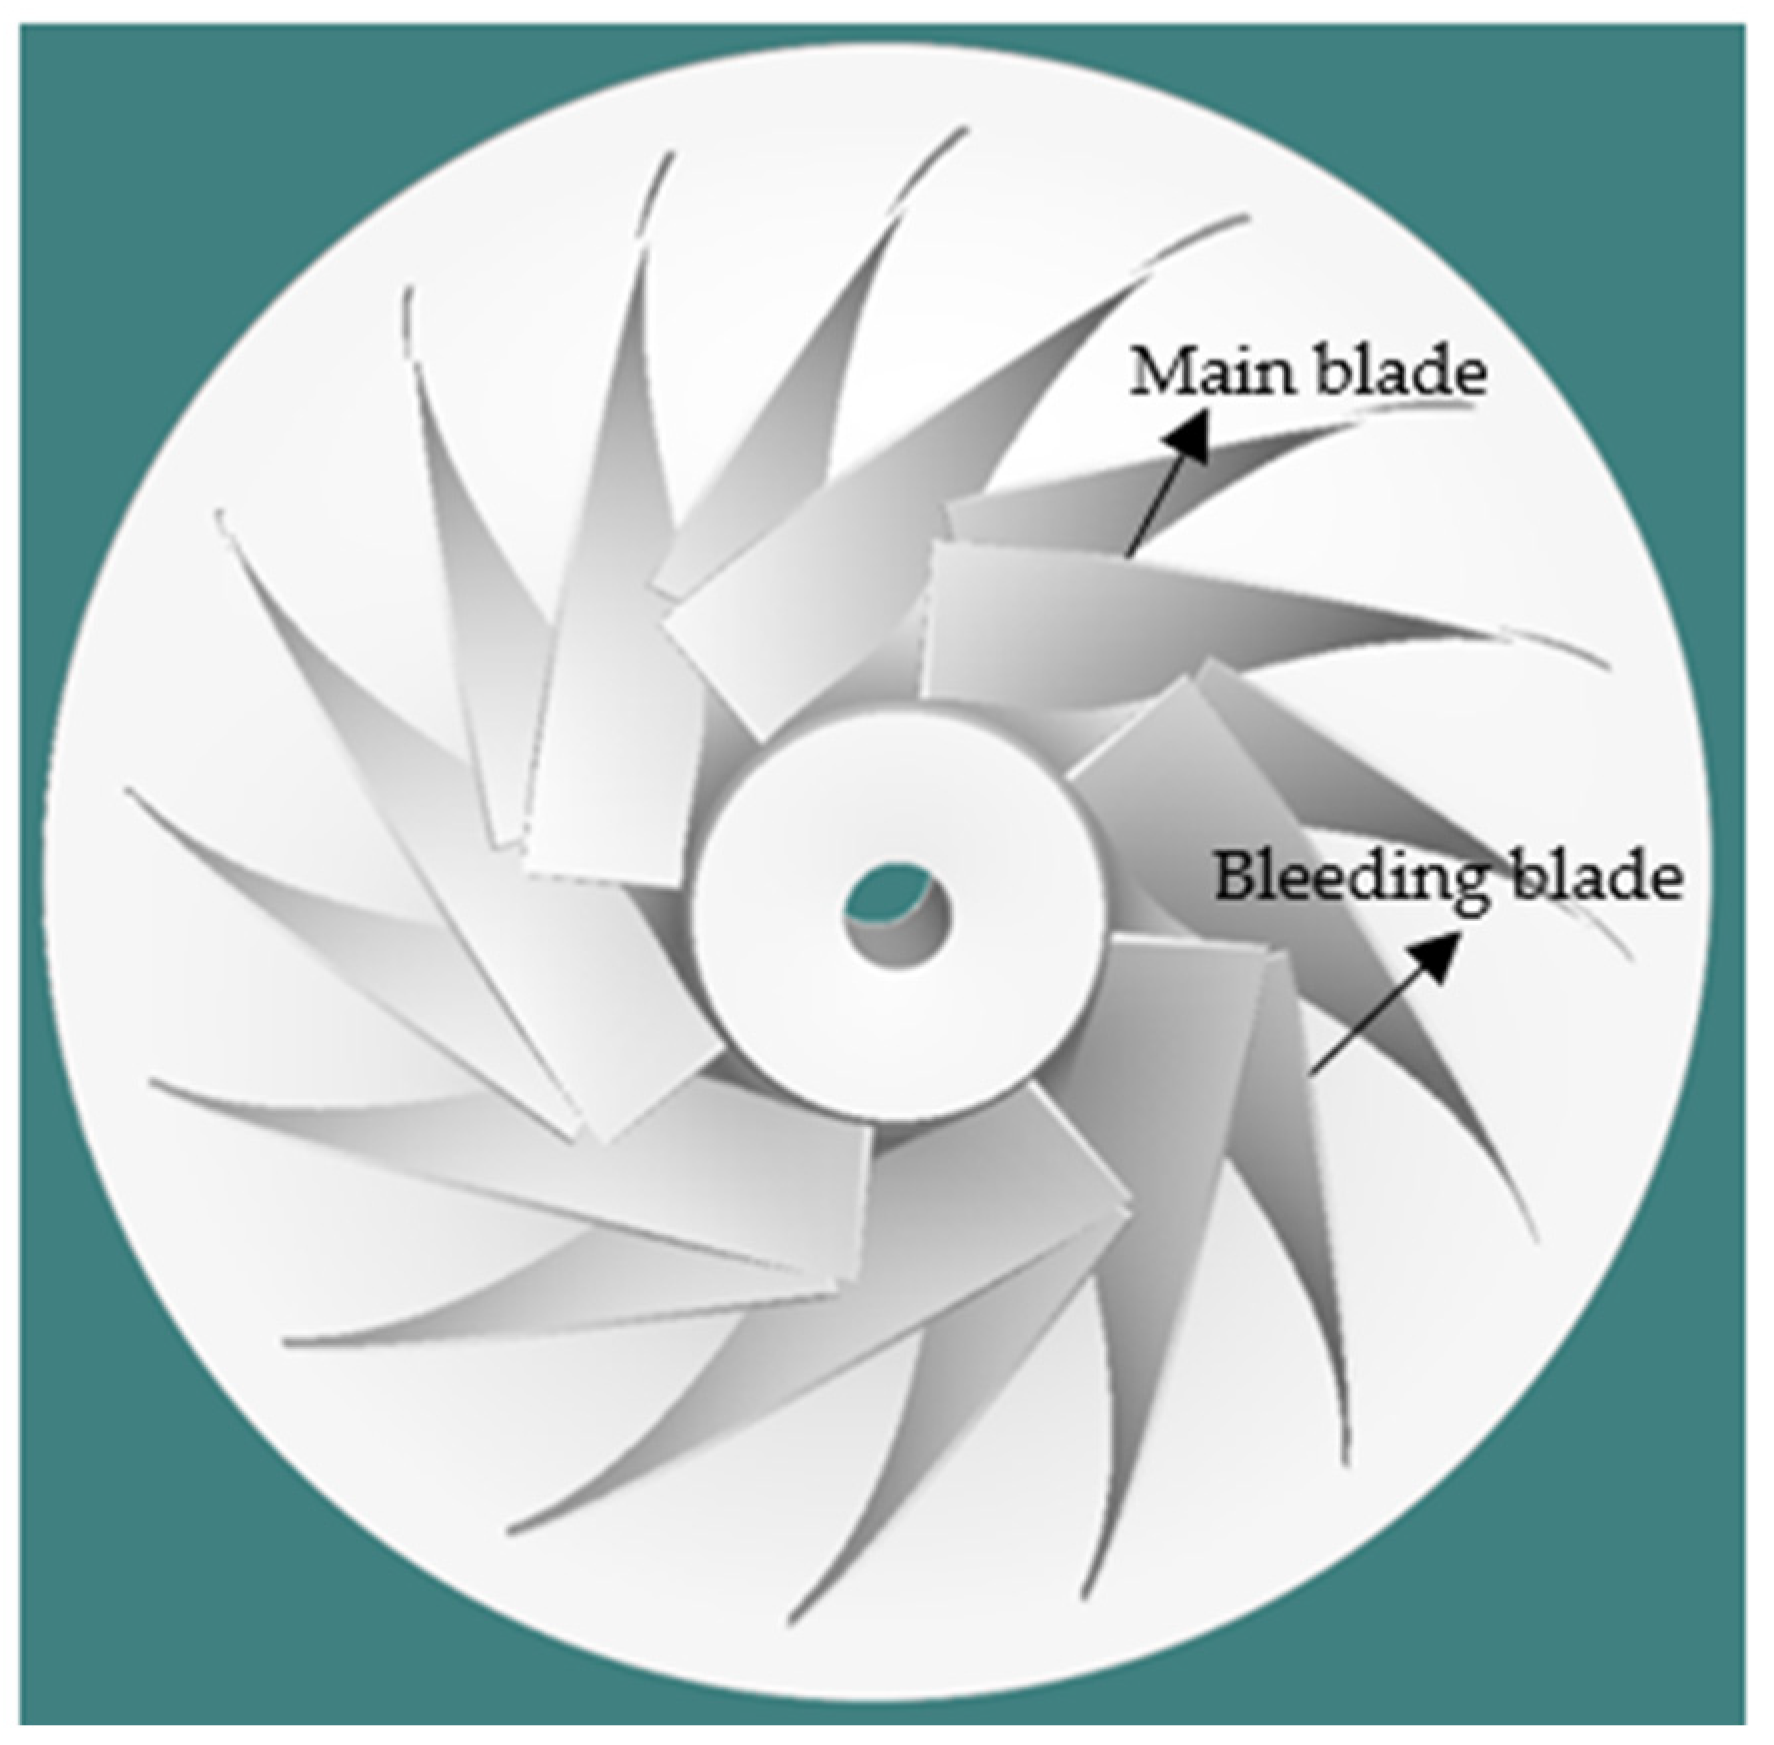
3.1. Geometric Model of the 10 MW Centrifugal Compressor

This paper focuses on a 10 MW S-CO2 centrifugal compressor in a simple recuperated Bryton cycle. The design specifications are listed in Table 1. At the nominal design point, the rotating speed is 16500 r/min, the mass flow rate is 75.0 kg/s, and the pressure ratio is 2.0. The compressor inlet has a total temperature of 308.15 K and a total pressure of 8.0 MPa, located in the supercritical gas-like region.
An inexpensive vaneless diffuser scheme is developed to provide considerable pressure recovery in our research. The bleeding blades are further employed to avoid the possible flow separation inside the flow passages. For the impeller, constant blade thickness and tip clearance are assumed as 1.0 and 0.4 mm, respectively. The main geometric parameters of the centrifugal compressor impeller are summarized in Table 2. The three-dimensional geometric model can be seen in Figure 3.

3.2. Resolution Verification of Thermophysical Properties

As outlined above, the assumption of an ideal gas in numerical works has resulted in a large error relative to the related experimental data. Hence, CO2 should be treated as the real fluid with accurate thermophysical properties. In the current study, the thermophysical property table methodology is employed. Several numerical works [19,20,21] pointed out that the resolution of thermophysical properties significantly impacts the CFD simulation efficiency, accuracy, and even convergence stability. Hence, the resolution of thermophysical property table generation should be verified first. Four sets of thermophysical properties are generated with different pressure and temperature ranges and resolutions by calling a software NIST Refporp [22], listed in Table 3. The corresponding pressure ratio and isentropic efficiency at the nominal design point for the studied centrifugal compressor are also tabulated in Table 3. Set 1 gives a higher pressure ratio and the lowest isentropic efficiency than the other three sets. Set 4 exhibits the finest resolution and the smallest pressure and temperature ranges. There are only slight deviations of pressure ratio and isentropic efficiency between set 3 and set 4. Hence, the thermophysical properties of set 3 are employed in the following simulations to ensure acceptable calculation accuracy and cost.

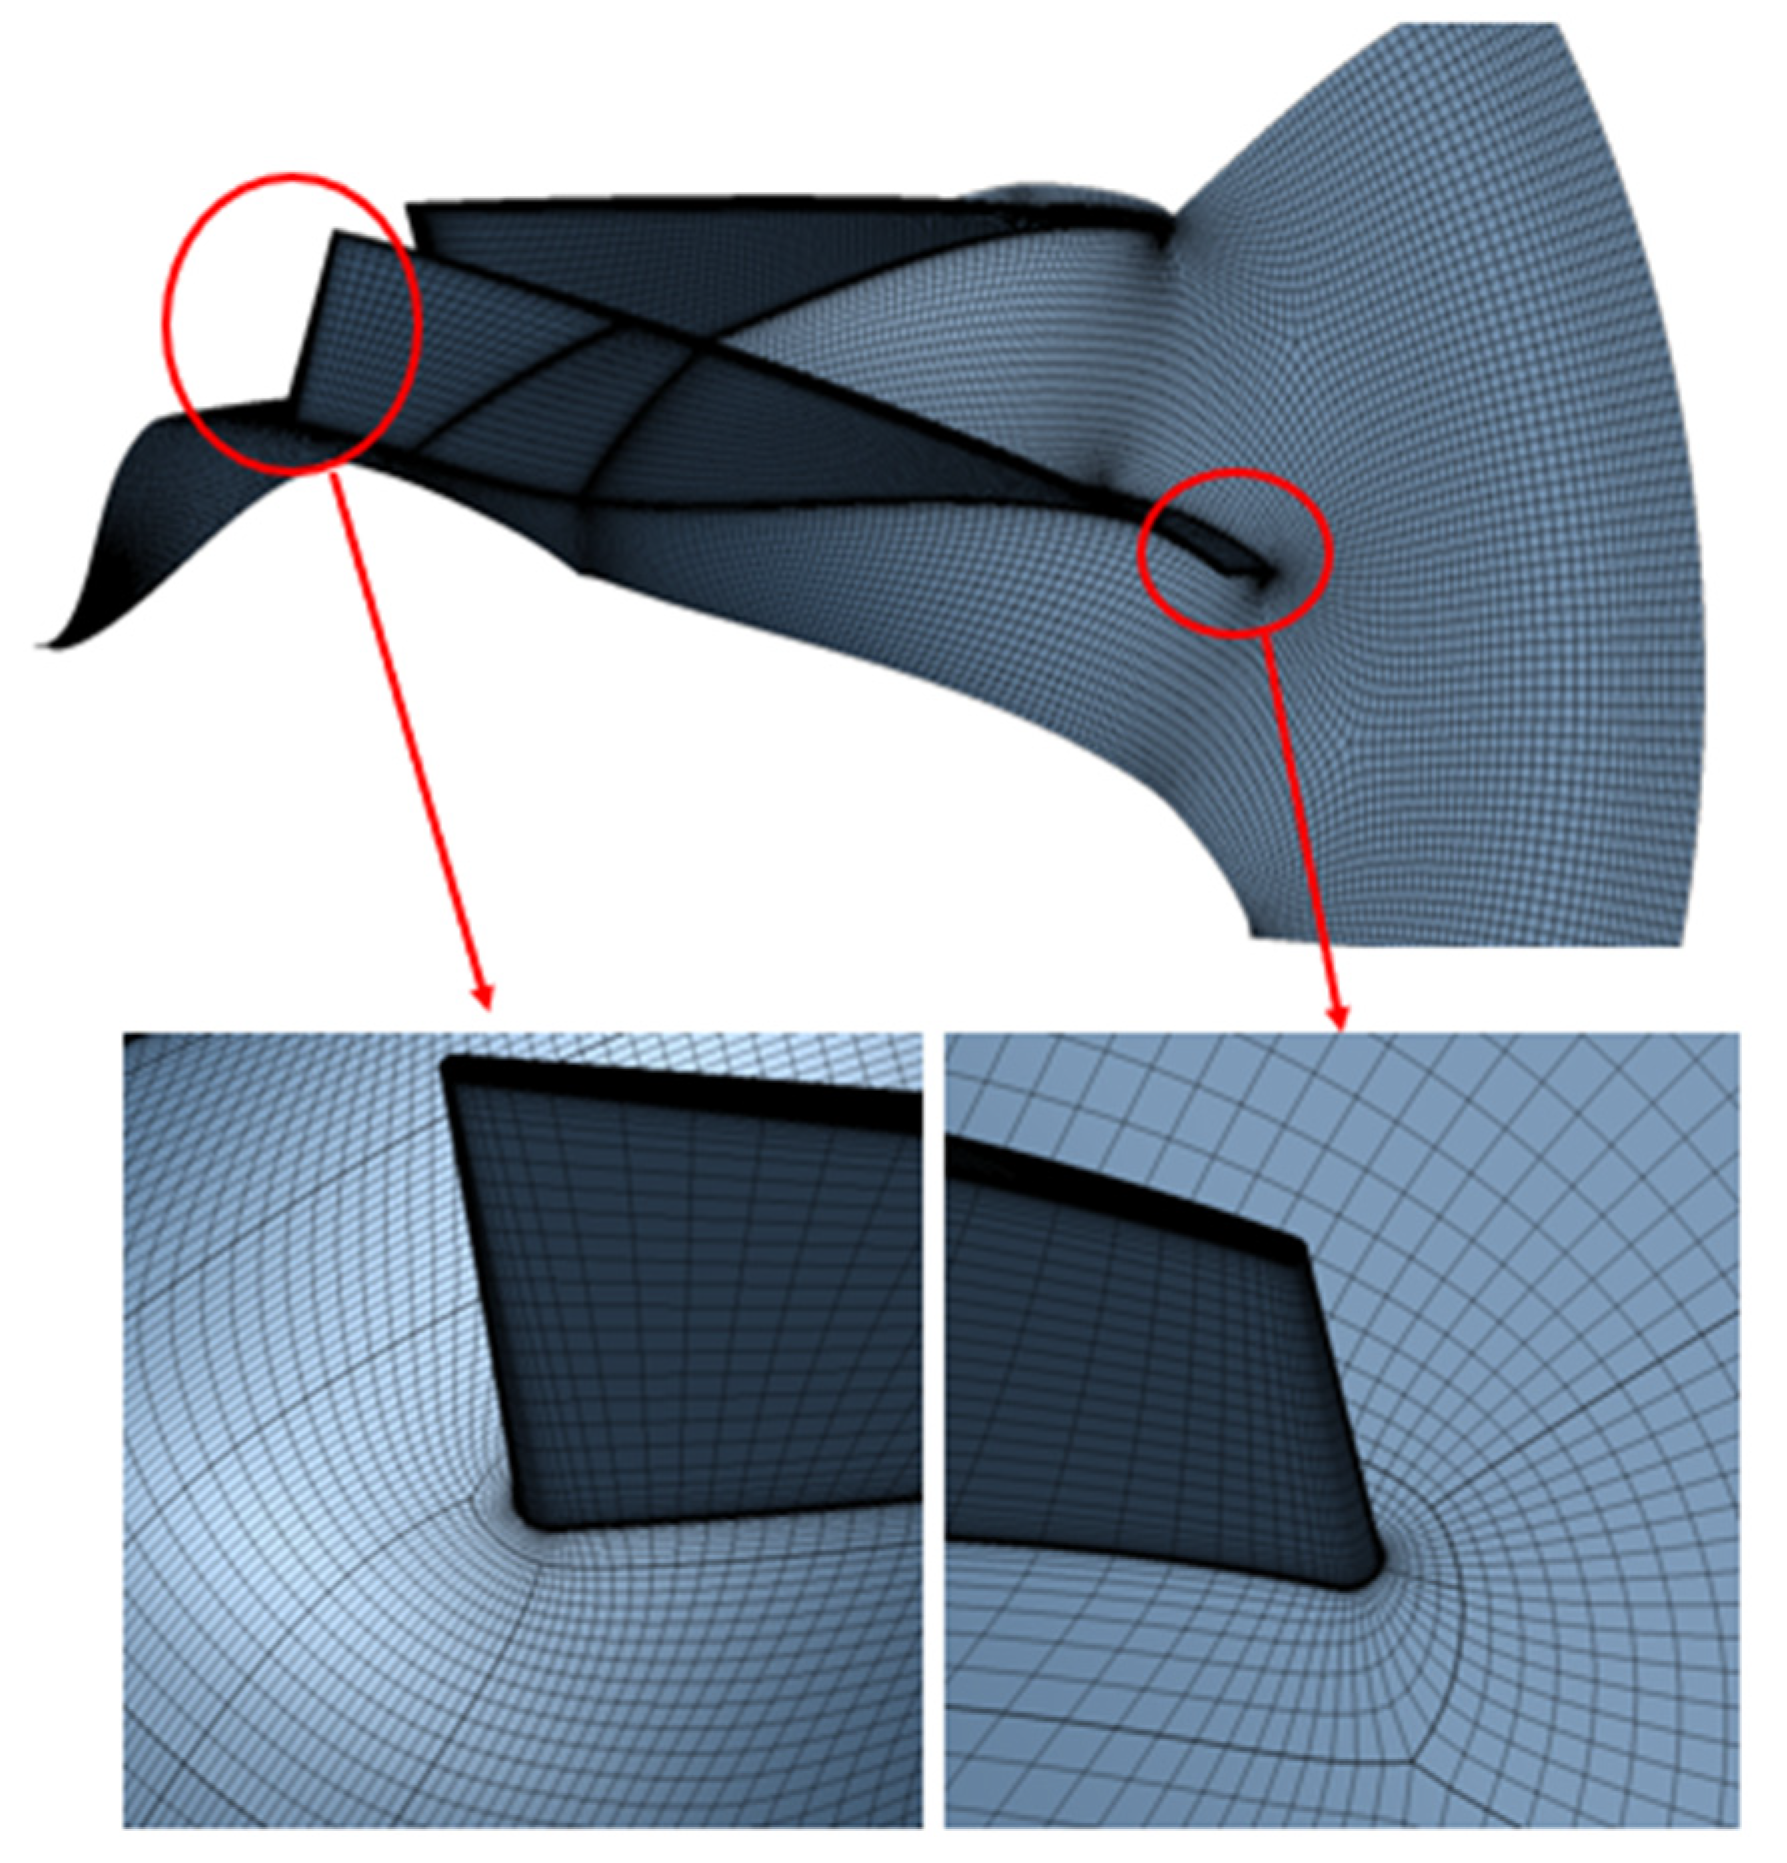
3.3. Numerical Method and Validation

The flow field and performance of the centrifugal compressor are obtained by performing three-dimensional, steady-state CFD simulations. The software NUMECA [22] is employed to solve the Reynolds-averaged Navier–Stokes equations by the finite volume method. The k-omega shear-stress-transport two-equation turbulence model with wall functions is selected for the turbulence closure. For this turbulence model, we need to give the inlet turbulence flow energy k and the turbulence dissipation rate ε. We generally use the formulas.
k = 3 2 ( T u U r e f ) 2
ε = C u u u t ρ r e f u k 2
for estimation. The inlet turbulence flow energy k and turbulence dissipation rate ε are calculated to be 7.26 m2/s2 and 558,370,000 m2/s2, respectively, according to the above formulas.
The second-order central difference scheme is used for the spatial discretization of the artificial viscosity term. Time discretization is solved iteratively by the fourth-order Runge–Kutta method. The three-layer multi-grid combined with the local time step and residual smoothing method is employed to accelerate the calculation process. Numerical convergence is achieved when the residual error is below 10−6 or the mass flow difference between the passage inlet and outlet is less than 1%.
In our study, one-eighth of the physical model is selected as the computation domain to save the computational cost. Periodic boundary conditions are set on both sides of the single passage. The total pressure and temperature conditions are provided at the inlet of the computational domain. A mass flow rate is given at the compressor outlet. All wall surfaces are set to adiabatic and non-slip boundary conditions.
An H-I topology is used for the impeller and vaneless diffuser flow passages to generate the structured computational grids. The grids are refined to sufficiently describe the boundary layer around the blade, hub, shroud, and tip surfaces. The details of the computational grids near the leading edge and the trailing edge of the impeller blade are shown in Figure 4. The distance of the first node from the wall surface is 1 × 10⁻⁶ m to meet the y+ (20~50) requirement of the selected turbulence model, controlled at about 30.
The computational grid independence test is conducted in advance to get trusted results from the CFD simulations. Table 4 demonstrates the pressure ratios and efficiencies for the compressor at the nominal design point which are predicted with four levels of computational girds. By varying the numbers of mesh layers and radial mesh layers of the boundary layer, the grid number varies from 0.81 to 1.93 million. The increase of the grid number leads to a decrease in the pressure ratio, and a first rise and then drop in isentropic efficiency. Hence, the grid level of 1.62 million is adopted for all the simulation works. The number of boundary layer mesh layers is 32.
Due to the absence of the available experimental data for 10 MW centrifugal compressors, the published data of the compressor in Sandia Laboratory [4] is selected for turbulence model validation. The nominal rotating speed of this compressor is 75,000 r/min but is limited to 55,000 r/min because of the assembly error and restricted experimental conditions. The three-dimensional geometric model is reconstructed based on the published main geometry parameters in [4]. The boundary conditions in the simulation are consistent with those in the experimental test. Figure 5 shows the comparison of the pressure ratio profile relative to the mass flow rate between the numerical result and experimental data at a rotating speed of 55,000 r/min. It is observed that the numerical prediction exhibits a consistent changing tendency with the experimental data with an overestimation of 3.25–7.99%. The higher deviations occur when the mass flow rate is less than 1.83 kg/s. The difference is mainly attributed to the simplified geometric model in the CFD simulation by omitting the accessory. Regardless, the predicted pressure ratio at the nominal design point is 1.82, overvalued by 1.28% compared with that in the preliminary design. Generally, the turbulence model is qualified for the accurate prediction for the S-CO2 centrifugal compressor performance. Hence, the reminders of CFD simulations are performed with the k-omega shear-stress-transport turbulence model.

4. Result and Discussion

4.1. Performance Prediction at the Nominal Inlet Condition

The performance curve for the 10 MW S-CO2 centrifugal compressor at the nominal inlet condition is depicted in Figure 6 in terms of pressure ratio and isentropic efficiency variations relative to the mass flow rate. As the mass flow rate varies from 43.94 to 89.92 kg/s, the relevant pressure ratio declines from 2.05 to 1.8, and the isentropic efficiency curve first rises and then drops with values larger than 82%, indicating a wide range of stable operation for the studied compressor. The compressor provides a pressure ratio of 1.955 at the nominal mass flow rate of 75 kg/s, slightly lower than the nominal pressure ratio of 2.0 in Table 1. The largest isentropic efficiency of 88.45% occurs at the nominal flow rate, implying the good performance at the nominal design condition for the studied S-CO2 centrifugal compressor design.

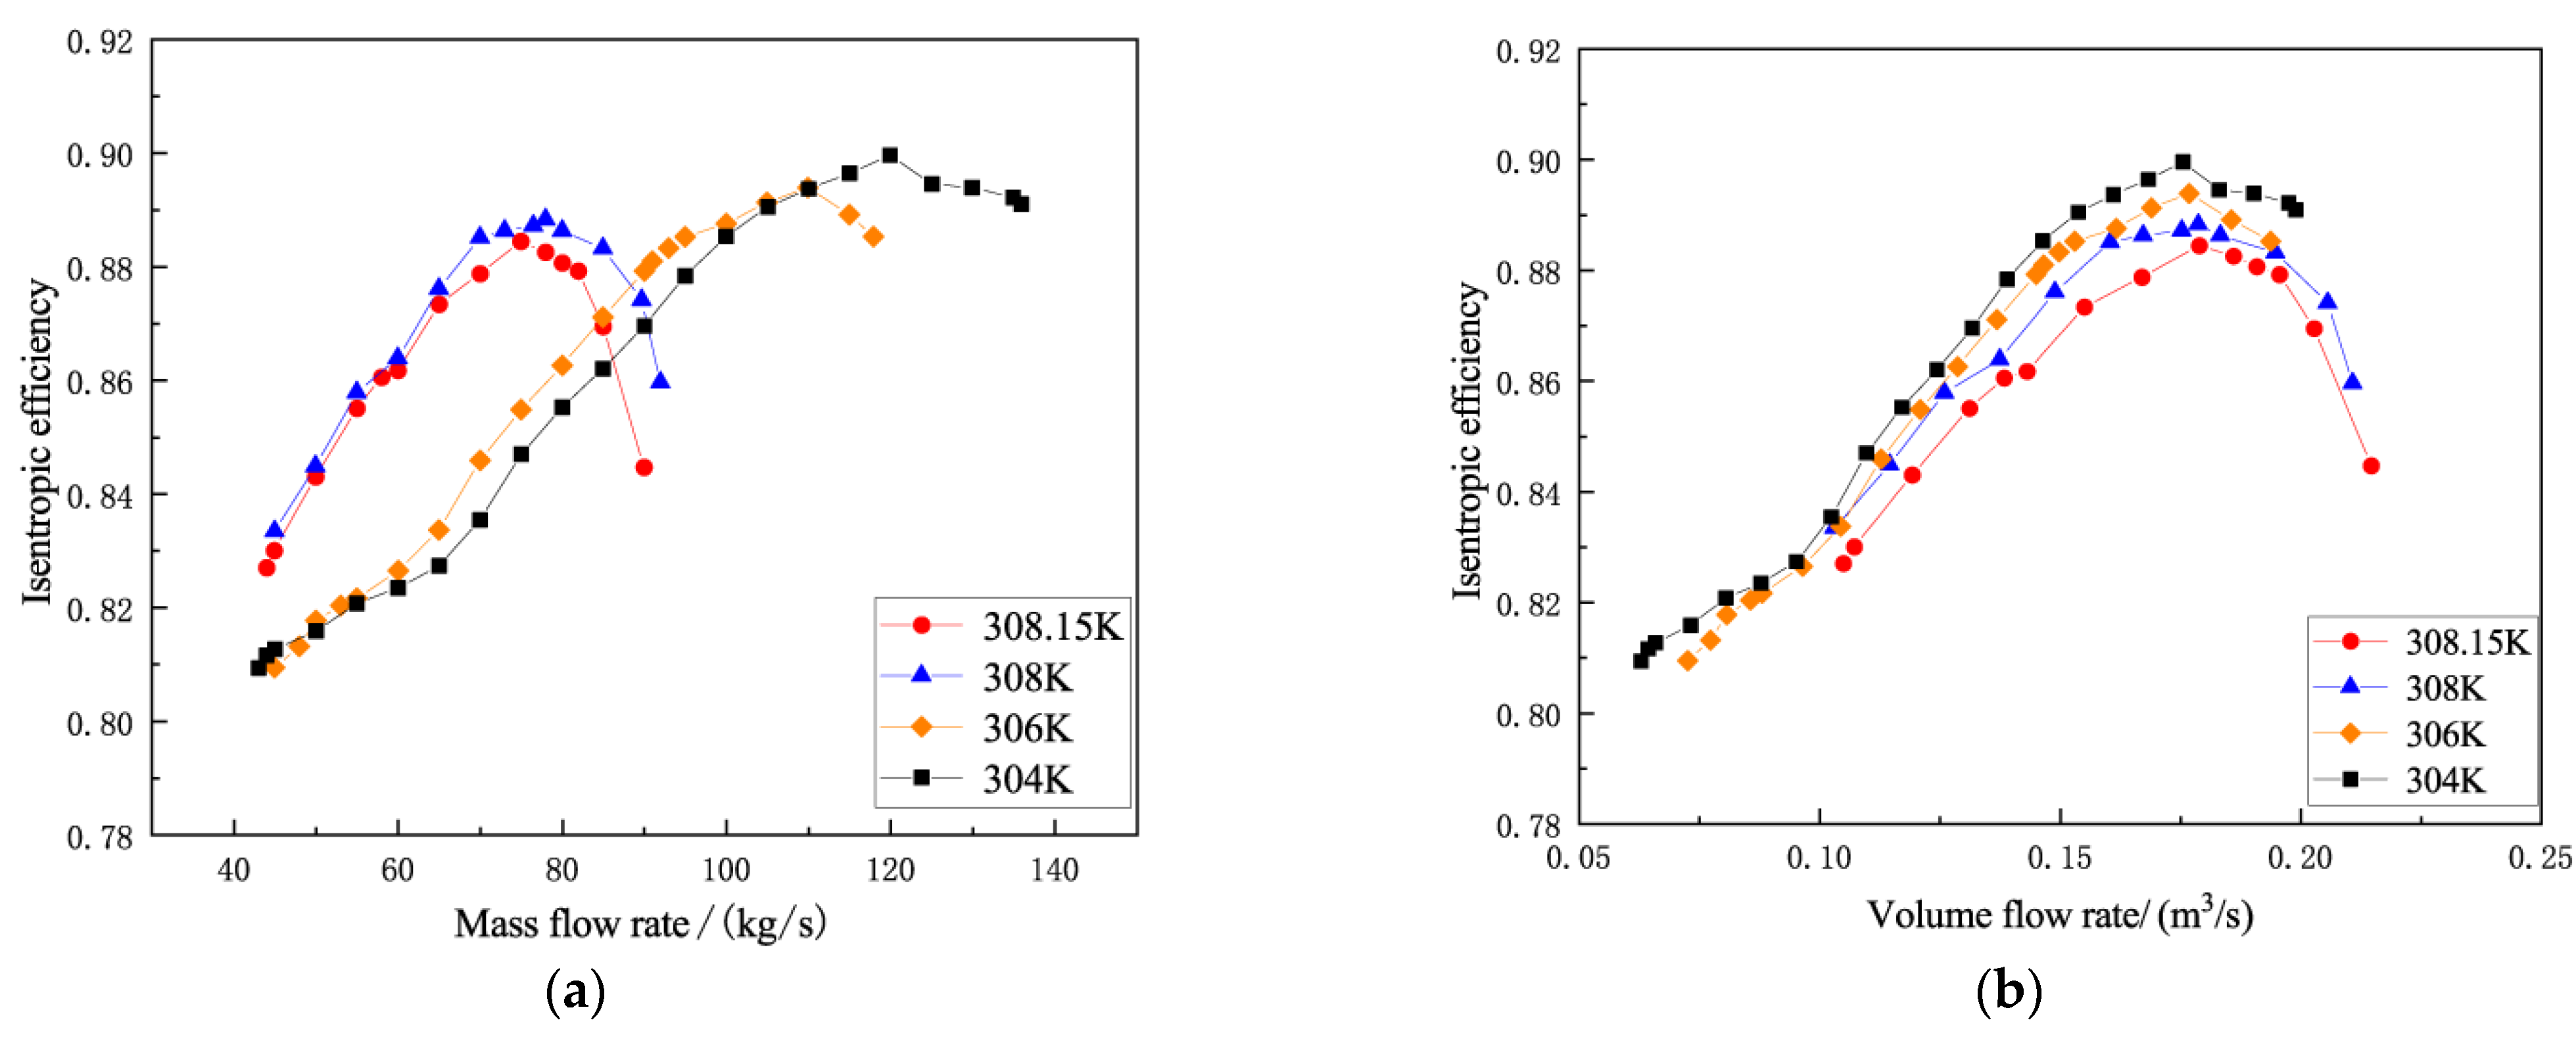
4.2. The Influence of Inlet Temperature

The impact of the inlet total temperature on the compressor performance is studied by performing four CFD simulations with the constant inlet total pressure. The total inlet temperatures are 304 K, 306 K, 308 K, and 308.15 K. The corresponding compressibility factors and total densities are listed in Table 5. The compressibility factor represents the departure of the real gas from the ideal gas, expressed as the ratio of the real gas volume to the ideal gas volume. As the compressor inlet temperature increases from 304.00 K to 308.15 K, the compressibility factor of CO2 ascends monotonously with an increased slope.
The variations of pressure ratio relative to the mass flow rate at various compressor inlet temperatures are shown in Figure 7. It is observed that the pressure ratio manifests a falling trend with the increase of mass flow rate at either total inlet temperature, which is similar to that for the traditional gas or air compressor. Moreover, when the compressor operates stably, the pressure ratio goes up with rising inlet total temperature at the same mass flow rate. This phenomenon can be attributed to the different compressibility factor of CO2 at the compressor inlet. If the compressibility factor is low, the fluid can be easily compressed, leading to higher pressure. Therefore, when CO2 is near the critical point and other boundary conditions are fixed, the lower the total inlet temperature becomes, the higher the pressure ratio for S-CO2 centrifugal compressors becomes.
It is well known that when an air compressor is running at a low mass flow, rotational stall or surge may occur, and choking happens when running at large mass flow rates. As can be seen from Figure 7, as the temperature rises, the compressor has a wider working range, especially the compressor is working stably at high flow rates. Therefore, changes in inlet temperature can affect the stable operating area of the S-CO2 compressor.
The variation trends of isentropic efficiency relative to the mass flow rate at different inlet total temperatures are represented in Figure 8a. As the inlet temperature decreases, the available range of mass flow rate enlarges, which is mainly attributed to the augmented density. Hence, to eliminate the impact of working fluid density at the compressor inlet, the performance curve of isentropic efficiency versus volumetric flow rate is further provided in Figure 8b. Apparently, the ranges of the volumetric flow rate at different inlet temperatures are remarkably narrower than those of mass flow rate. The changing trends of isentropic efficiency versus the volumetric flow rate are almost the same at different inlet temperatures. It should be pointed out that the highest values of isentropic efficiency are achieved at the volumetric flow rate of about 0.18 m3/s regardless of the compressor inlet temperature changes near the critical point, suggesting that the isentropic efficiency is mainly affected by the inlet volumetric flow rate. The performance curve of isentropic efficiency at either inlet temperature has a slightly rising but sharp falling trend. At the nominal volumetric flow rate, the relative flow angle almost equals the blade angle at the impeller inlet, and no incidence loss occurs, resulting in the highest isentropic efficiency. However, if the volumetric flow rate deviates from the nominal one, the relative flow angle is higher or lower than the blade angle, leading to an additional incidence loss and reduced isentropic efficiency. A negative incidence angle at a high volumetric flow rate leads to stronger flow separation at the blade pressure side, resulting in a larger incidence loss than a positive indigence angle at a low volumetric flow rate [11]. Hence, the isentropic efficiency decreases slowly with the increased volumetric flow rate bias at the volumetric flow rate less than the nominal one but drops severely at the volumetric flow rate higher than the nominal one.
Figure 8b shows that the compressor provides higher isentropic efficiency at a lower inlet temperature under the same volumetric flow rate. Similar phenomena were found in the experimental measurement performed by Fleming et al. [23]. The main reason is that when the inlet CO2 is in a liquid-like supercritical state, the compressor readily obtains higher performance under the same operating conditions. Regardless, the inlet temperature influences significantly on the surge and choking boundaries. The minimum and maximum volumetric flow rates appear at the surge and choking points when exhibiting divergent steady-state CFD simulations. As the temperature decreases, the closer the inlet temperature is to the critical temperature, the larger the surge margin becomes, but a smaller blockage margin gets. When the inlet temperatures are 304 K, 306 K, 308 K, and 308.15 K, the corresponding volumetric flow rates are 0.0628 m3/s, 0.0709 m3/s, 0.103 m3/s, and 0.1048 m3/s at surge point, and 0.2189 m3/s, 0.2107 m3/s, 0.2053 m3/s, and 0.1988 m3/ s at the beginning of choking, respectively.

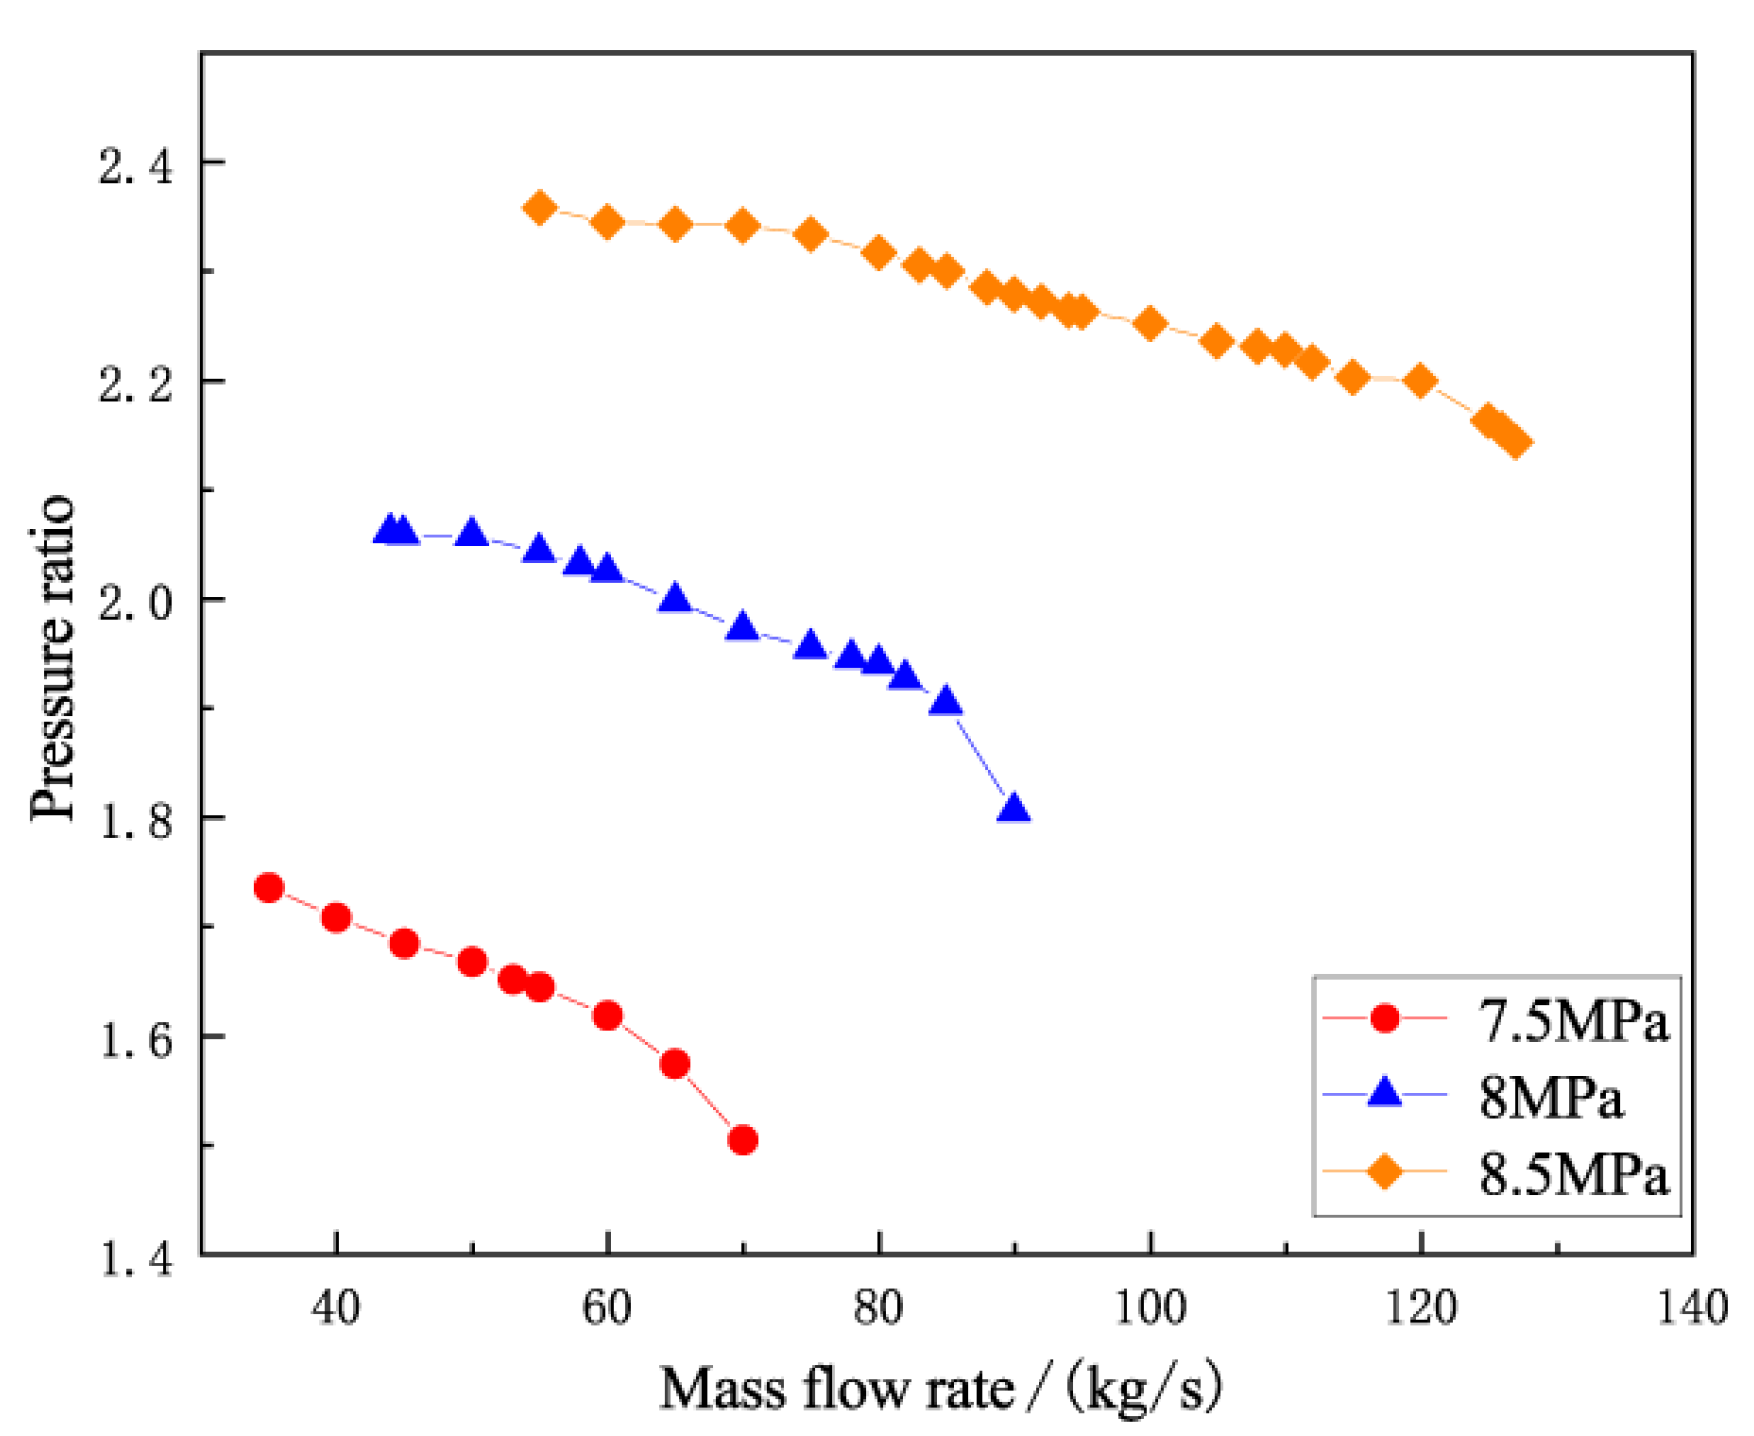
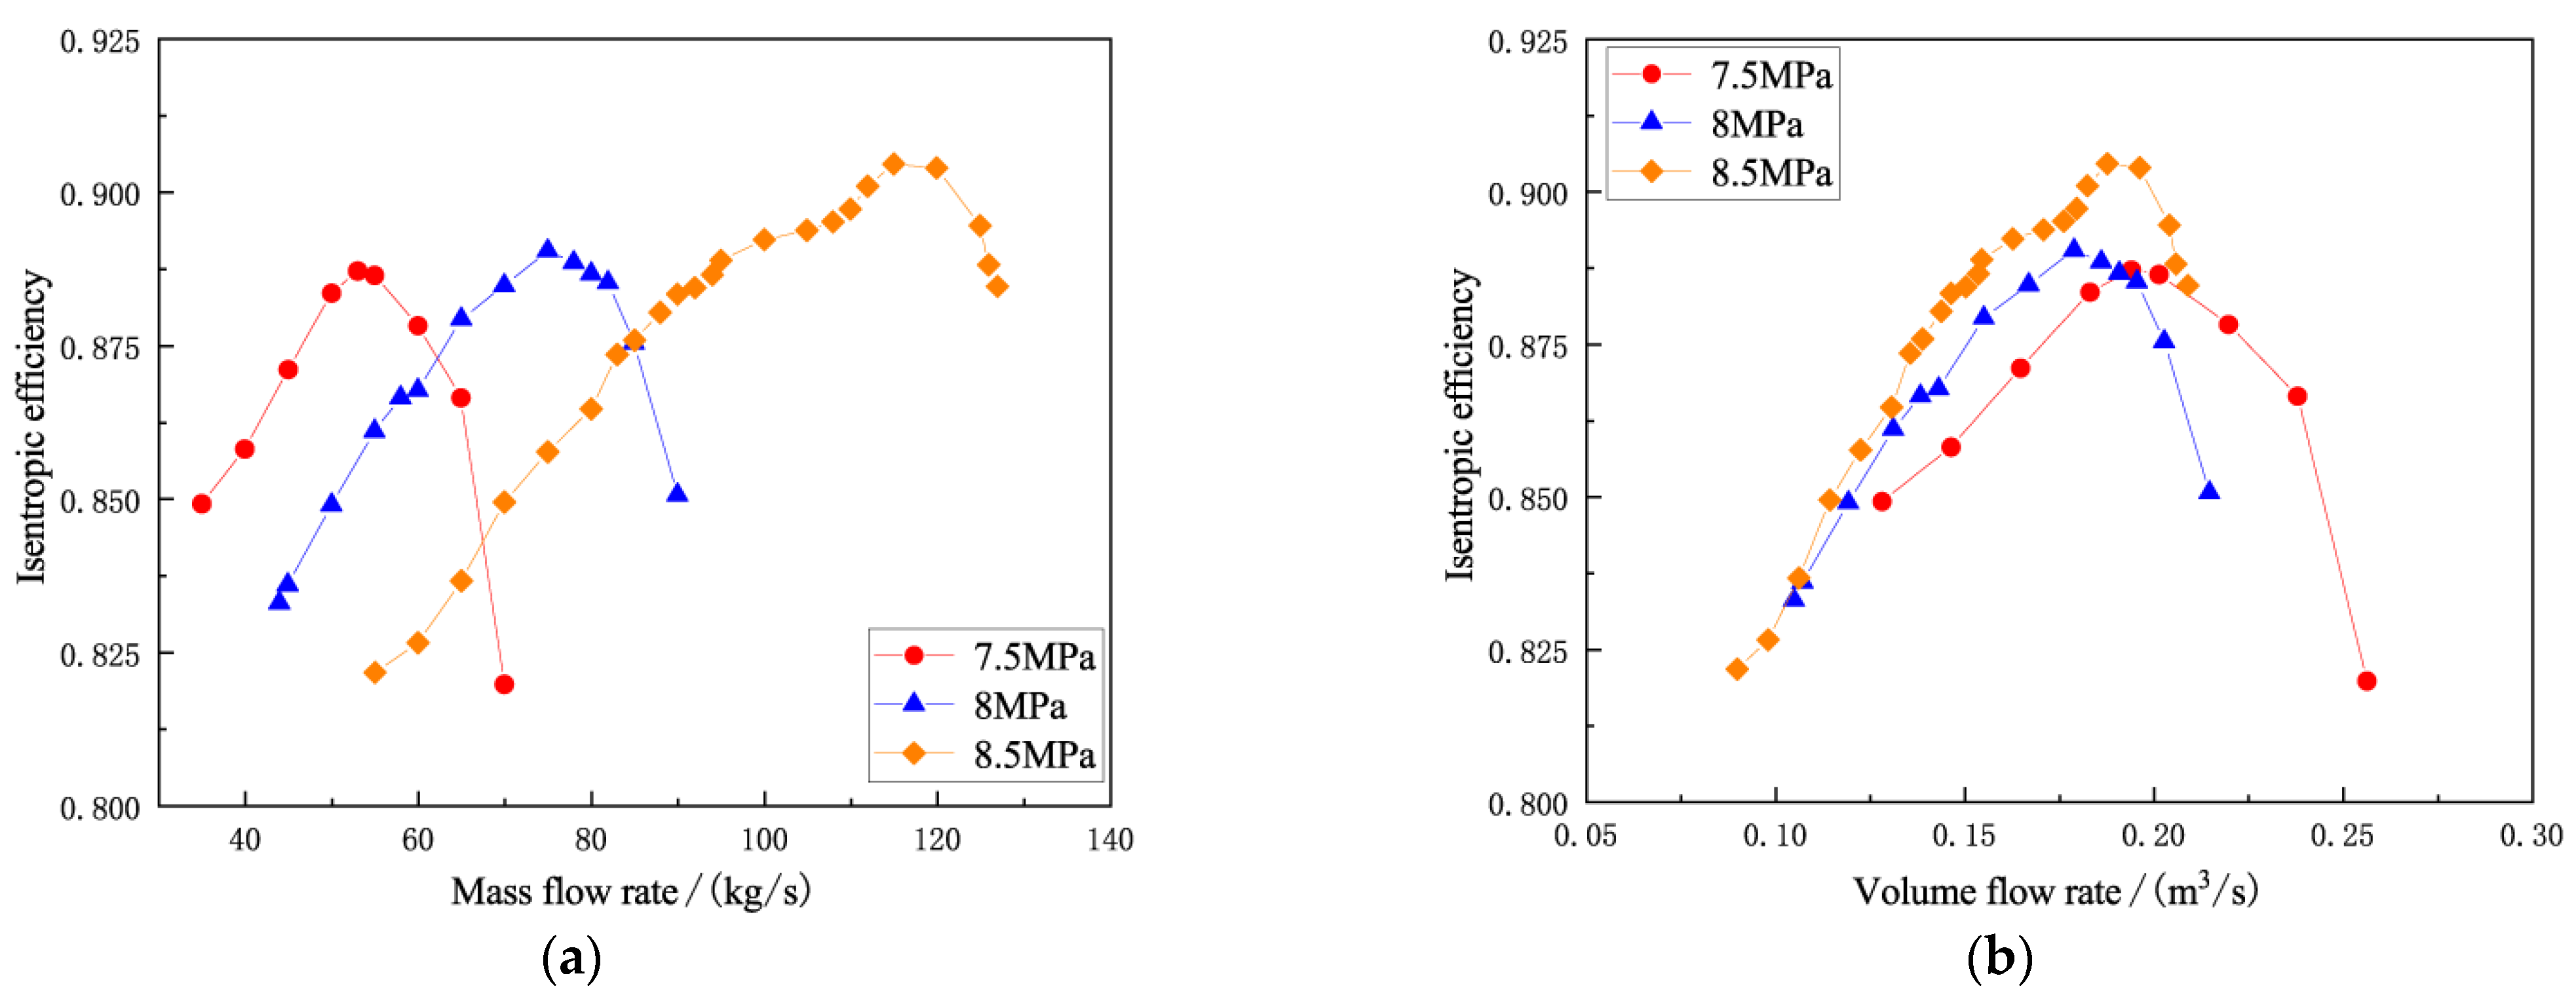
4.3. The Influence of Inlet Pressure

The inlet pressure of the S-CO2 centrifugal compressor is prone to be also affected by various factors in the closed Brayton cycle. The change of inlet pressure inevitably affects the performance and stability of the S-CO2 centrifugal compressor. In our study, the CFD simulation results are analyzed to investigate the influence of inlet pressure at three inlet pressures of 7.5 MPa, 8 MPa, and 8.5 MPa with a fixed inlet temperature of 308.15 K. The specific compressibility factors and total densities at different inlet conditions are given in Table 6. It is seen that the variation of inlet pressure nearby the critical pressure results in a greater impact on the thermophysical properties. As the inlet pressure rises, the compressibility factor varies with a negative and reduced gradient, but the total density with a positive and increased gradient.
Figure 9 shows the variation of pressure ratio relative to the mass flow rate at different inlet pressures. It can be seen that the pressure ratio increases monotonously with the increasing inlet pressure. As shown in Table 6, the compressibility factor of CO2 also falls along with the enlarging inlet pressure at a fixed inlet temperature of 308.15 K, resulting in the increscent pressure ratio. Furthermore, the non-linear variation of compressibility factor of CO2 at inlet pressure between 7.5 MPa and 8.5 MPa leads to the non-linear increment of pressure ratio. Considering that the pressure ratio also depends on the value of compressibility factor at the varying inlet temperature between 304 K and 308.15 K, it is concluded that the change of pressure ratio at different inlet temperatures or pressure is attributed to the variation of compressibility factor of CO2 at the compressor inlet.
As can be seen from Figure 9, with the increase in pressure, the stable working range of the compressor is constantly moving to the right, that is, when the mass flow is decreasing, the temperature increase is more likely to induce rotating stall or surge, and when the mass flow is continuously increased, the temperature decrease is more likely to triggerchoking. Therefore, changes in inlet pressure will affect the stable operating range of the S-CO2 compressor.
Figure 10 represents the changing trends of isentropic efficiency versus mass flow rate and volumetric flow rate at various inlet pressures. As the inlet pressure varies from 7.5 MPa to 8.5 MPa, the performance curves intersect because of the wide variation of mass flow rate, seen in Figure 10a. The volumetric flow rate is applied to replace the mass flow rate to eliminate the influence of drastic variation of inlet density near the critical pressure. As shown in Figure 10b, the performance curves of isentropic efficiency relative to the volumetric flow rate almost displays the same trend at various inlet pressures. The explanation of this coincidence is consistent with that for the influence of inlet temperature. It can also be observed in Figure 10b that the isentropic efficiency curve shifts upward with the increase in inlet pressure. When CO2 at the compressor inlet approaches the liquid phase, the S-CO2 compressor has higher isentropic efficiency under the same volumetric flow rate. The inlet pressure variation also influences the surge margin and the chocking margin with a fixed inlet temperature of 308.15 K. When the inlet pressure equals 7.5 MPa, 8 MPa, and 8.5 MPa, the corresponding inlet volumetric flow rates at the surge point are 0.128 m3/s, 0.1048 m3/s, and 0.0897 m3/s, respectively. The maximum available volumetric flow rates are 0.2562 m3/s, 0.2189 m3/s, and 0.2089 m3/s at the beginning of chocking. Hence, the surge margin widens with the increasing inlet pressure while the choking margin narrows.

5. Conclusions

Our study investigates the performance variation of the 10 MW S-CO2 centrifugal compressor at different inlet conditions based on the analysis of the CFD simulation results and theoretical explanation. A total of six inlet conditions are considered, including the nominal design condition, three different inlet temperatures of 304 K, 306 K, and 308 K, and two additional inlet pressures of 7.5 MPa and 8.5 MPa. It is found that the variation of inlet temperature or inlet pressure significantly influences the compressor performance and operating stability margin.
(1)
The higher pressure ratio of the S-CO2 centrifugal compressor can be obtained at a lower inlet temperature or a higher inlet pressure, mainly attributed to the smaller compressibility factor of CO2 at the compressor inlet;
(2)
When the inlet state of CO2 approaches the liquid-like phase, i.e., the inlet temperature decreases, or the inlet pressure decreases, the S-CO2 centrifugal compressor has a higher isentropic efficiency under the same volumetric flow rate;
(3)
Compared with the gas-like state, the wider surge margin but a narrower chocking margin occur for the S-CO2 centrifugal compressor at the inlet liquid-like state.

Author Contributions

Conceptualization, Z.T. and J.M.; methodology, Z.T. and X.Y.; software and validation, Z.T. and J.M.; formal analysis, Z.T. and J.M.; investigation, Z.T.; resources, Z.T.; data curation, X.Y.; writing—original draft preparation, Z.T. and X.Y.; writing—review and editing, C.Z. and Y.Z.; visualization, P.S.; supervision, J.M.; project administration, Z.T.; funding acquisition, Z.T. All authors have read and agreed to the published version of the manuscript.

Funding

This research was funded by the National Natural Science Foundation of China, grant number 51976139, the Scientific Research Foundation of Jimei University (Grant No. ZQ2021009), and Industry and university cooperation project of Fujian Province (Grant No. 2020H6015).

Conflicts of Interest

The authors declare no conflict of interest. The funders had no role in the design of the study; in the collection, analyses, or interpretation of data; in the writing of the manuscript, or in the decision to publish the results.

References

  1. Angelino, G. Carbon dioxide condensation cycles for power production. J. Eng. Power 1968, 90, 287–295. [Google Scholar] [CrossRef]
  2. Feher, E.G. The supercritical thermodynamic power cycle. Energy Convers. 1968, 8, 85–90. [Google Scholar] [CrossRef]
  3. Clementoni, E.M.; Cox, T.L. Effect of compressor inlet pressure on cycle performance for a supercritical carbon dioxide Brayton cycle. In Proceedings of the ASME Turbo Expo 2018, Oslo, Norway, 11–15 June 2018. [Google Scholar]
  4. Wright, S.A.; Radel, R.F.; Vernon, M.E.; Rochau, G.E.; Pickard, P.S. Operation and Analysis of a Supercritical CO2 Brayton Cycle; Report: SAND2010-0171; Sandia National Laboratories: Albuquerque, NM, USA; Livermore, CA, USA, 2010. [Google Scholar]
  5. Ahn, Y.; Lee, J.; Kim, S.G.; Lee, J.I.; Cha, J.E.; Lee, S.W. Design consideration of supercritical CO2 power cycle integral experiment loop. Energy 2015, 86, 115–127. [Google Scholar] [CrossRef]
  6. Lewis, J.; Clementoni, E.M.; Cox, T.L. Effect of compressor inlet temperature on cycle performance for a supercritical carbon dioxide Brayton cycle. In Proceedings of the 6th sCO2 Power cycle symposium, Pittsburgh, PA, USA, 27–29 March 2018. [Google Scholar]
  7. Zhu, Y.M.; Jiang, Y.Y.; Liang, S.Q.; Guo, C.H.; Guo, Y.X.; Gao, F.; Xia, H.F. Experimental research progress of supercritical carbon dioxide Brayton cycle compress. Therm. Power Gener. 2020, 49, 11–20. [Google Scholar]
  8. Chen, H.X.; Zhuge, W.L.; Zhang, Y.J.; Liu, H.D. Effect of compressor inlet condition on supercritical carbon dioxide compressor performance. In Proceedings of the ASME Turbo Expo 2019, Phoenix, AZ, USA, 17–21 June 2019. [Google Scholar]
  9. Liu, X.H.; Teng, J.F.; Yang, J.; Sun, X.F.; Sun, D.K.; He, C.; Du, J. Calculation of stall margin enhancement with micro-tip injection in an axial compressor. J. Fluids Eng. 2019, 141, 081109. [Google Scholar] [CrossRef]
  10. Zhang, L.; He, R.Y.; Wang, X.; Zhang, Q.; Wang, S.L. Study on static and dynamic characteristics of an axial fan with abnormal blade under rotating stall conditions. Energy 2019, 170, 305–325. [Google Scholar] [CrossRef]
  11. Zhang, L.; He, R.Y.; Wang, S.L.; Zhang, Q. A review of rotating stall in vaneless diffuser of centrifugal compressor. J. Therm. Sci. 2020, 29, 323–342. [Google Scholar] [CrossRef]
  12. Munroe, T.A.; Zaccaria, M.A.; Flaspohler, W.H. Fluent CFD steady-state predictions of a single stage centrifugal compressor with supercritical CO2 working fluid. In Proceedings of the sCO2 Power cycle symposium, New York, NY, USA, 29–30 April 2009. [Google Scholar]
  13. Pecnik, R.; Rinaldi, E.; Colonna, P. Computational fluid dynamics of a radial compressor operating with supercritical CO2. In Proceedings of the ASME Turbo Expo 2012, Copenhagen, Denmark, 11–15 June 2012. [Google Scholar]
  14. Kim, S.G.; Ahn, Y.; Lee, J.; Lee, J.I.; Addad, Y.; Ko, B. Numerical investigation of a centrifugal compressor for supercritical CO2 as a working fluid. In Proceedings of the ASME Turbo Expo 2014, Düsseldorf, Germany, 16–20 June 2014. [Google Scholar]
  15. Zhao, H.; Deng, Q.H.; Zheng, K.K.; Zhang, H.Z.; Feng, Z.P. Numerical investigation on the flow characteristics of a supercritical CO2 centrifugal compressor. In Proceedings of the ASME Turbo Expo 2014, Düsseldorf, Germany, 16–20 June 2014. [Google Scholar]
  16. Zheng, K.K.; Zhao, H.; Feng, Z.P. Analysis of internal flow characteristics of supercritical carbon dioxide centrifugal compressor. J. Eng. Thermophys. 2015, 36, 985–988. [Google Scholar]
  17. Rindldi, E.; Pecnik, R.; Colonna, P. Computational fluid dynamic simulation of a supercritical CO2 compressor performance map. J. Eng. Gas Turbines Power 2015, 137, 072602. [Google Scholar] [CrossRef]
  18. Jiang, X.F.; Tian, Y.; Shao, W.W.; Xiao, Y.H. Numerical simulation of supercritical CO2 compressor characteristics. J. Aerosp. Power 2018, 33, 1685–1694. [Google Scholar]
  19. Wright, S.A.; Pickard, P.S.; Fuller, R.; Radel, R.F.; Vernon, M.E. Supercritical CO2 Brayton cycle power generation development program and initial test results. In Proceedings of the ASME 2009 Power Conference, Albuquerque, NM, USA, 21–23 July 2009. [Google Scholar]
  20. Rinaldi, E.; Pecnik, R.; Colonna, P. Numerical computation of the performance map of a supercritical CO2 radial compressor by means of three-dimensional CFD simulations. In Proceedings of the ASME Turbo Expo 2014, Düsseldorf, Germany, 16–20 June 2014. [Google Scholar]
  21. Monje, B. Design of Supercritical Carbon Dioxide Centrifugal Compressor. Ph.D. Thesis, University of Seville, Sevilla, Spain, 2014. [Google Scholar]
  22. Wang, W.Y. Research on the Flow Characteristics of Supercritical Carbon Dioxide Centrifugal Compressor. Master’s Thesis, Nanjing University of Aeronautics and Astronautics, Nanjing, China, 2018. [Google Scholar]
  23. Fleming, D.; Holsschuh, T.; Conboy, T.; Rochau, G.; Fuller, R. Scaling considerations for a multi-megawatt class supercritical CO2 Brayton cycle and path forward for commercialization. In Proceedings of the ASME Turbo Expo 2012, Copenhagen, Denmark, 11–15 June 2012. [Google Scholar]
Figure 1. Phase diagram of CO2.
Machines 10 00359 g001
Figure 2. Density variation of CO2 at different isobars.
Machines 10 00359 g002
Figure 3. Three-dimensional geometric model.
Machines 10 00359 g003
Figure 4. Mesh details around the leading edge and trailing edge.
Machines 10 00359 g004
Figure 5. Numerical simulations validation.
Machines 10 00359 g005
Figure 6. Performance curve at nominal inlet condition. (a) Pressure ratio; (b) isotropic efficiency.
Machines 10 00359 g006
Figure 7. Pressure ratio versus mass flow rate at various inlet temperatures.
Machines 10 00359 g007
Figure 8. Performance curves at various inlet temperatures. (a) Isentropic efficiency versus mass flow rate; (b) isentropic efficiency versus volumetric flow rate.
Machines 10 00359 g008
Figure 9. Pressure ratio versus mass flow rate at various inlet pressures.
Machines 10 00359 g009
Figure 10. Performance curves at various inlet pressures. (a) Isentropic efficiency versus mass flow rate; (b) isentropic efficiency versus volumetric flow rate.
Machines 10 00359 g010
Table 1. Design specifications.
ParameterSpecificationParameterSpecification
Working fluidCO2Inlet total temperature (K)308.15
Rotating speed (r/min)16,500Inlet total pressure (MPa)8.0
Mass flow rate (kg/s)75.0Pressure ratio2.0
Table 2. Main geometric parameters.
ParameterValueParameterValue
Inlet hub radius (mm)2.5Tip clearance (mm)0.4
Inlet shroud radius (mm)43.76Inlet blade angle at tip (°)32
Outlet shroud radius (mm)96.53Outlet blade angle at tip (°)46
Blade height at outlet (mm)9.81Main blade number8
Blade thickness (mm)1.0Bleeding blade number8
Table 3. Thermophysical property table resolution verification.
SetPressure Range (MPa)Temperature Range (K)ResolutionPressure RatioIsentropic Efficiency (%)
10.005–800216.59–2000101 × 1011.97677.24
21–40220–1000101 × 1011..97986.78
31–40220–1000301 × 3011.95587.95
41–20220–500301 × 3011.95688.01
Table 4. Grid independence test.
Grid Number (Million)Pressure RatioIsentropic Efficiency (%)
0.811.78983.12
1.351.96387.16
1.622.03289.33
1.932.03589.38
Table 5. Total density and compressibility factor at various inlet total temperatures.
Inlet Total
Temperature (K)
Inlet Total Pressure (MPa)Compressibility
Factor
Inlet Total Density (kg/m3)
304.008.00.204683.31
306.008.00.223620.55
308.008.00.315436.24
308.158.00.328419.09
Table 6. Compressibility factors and total densities at various inlet pressures.
Inlet Total
Temperature (K)
Inlet Total Pressure (MPa)Compressibility
Factor
Inlet Total Density (kg/m3)
308.157.50.472272.97
308.1580.328419.09
308.158.50.239612.12
Publisher’s Note: MDPI stays neutral with regard to jurisdictional claims in published maps and institutional affiliations.

