1. Introduction
The electro-hydraulic servo valve has a complicated mechanical structure and high precision as the stability, reliability, and fastness largely determine the control performance of the electro-hydraulic servo system and even directly affect the stability and reliability of the whole hydraulic system [
1]. The pilot has been widely applied in the electro-hydraulic control system. For electro-hydraulic servo valves, the high coupling of complex components, flow and temperature fields are the main operating characteristics and the focus of research in electro-hydraulic control [
2,
3,
4,
5,
6]. In solid-fuel rockets, high-temperature gas is used to drive the turbine pump as the oil source for the valve servo system. Since most of the output power is absorbed by the hydraulic oil, it causes the oil temperature to rise rapidly with a temperature rise rate of 3 °C/s, which is a wide range of temperature shocks to the servo valve. According to the standard GJB150.5A-2009.3 and MIL-STD-810F 503.4, the temperature rise rate is more significant than 10 °C/min, which is a temperature shock, and the servo valve is subjected to a severe temperature shock from the hydraulic oil. The flow force on the flapper is the crucial cause of the self-excited oscillation of the armature assembly and induces noise. The extreme temperature environment will aggravate the self-excited phenomenon, which leads to the decline of the servo valve control precision.
During the operation of the servo valve, the deflection of the flapper and the output of the pilot stage is directly affected by the flow force [
7]. Thus, some researchers have investigated from the point of respect to flow. Zhang [
8] indicated that the flow force generated on the flapper is an essential cause of forced vibration in the torque motor assembly, which may lead to fatigue of the flexure tube in the torque motor. Aung [
9] demonstrated CFD simulations and the experimental validation of flow forces and energy loss characteristics in the pilot valve with different null clearances and inlet pressures. Moreover, the cavitation that occurs in the pilot stage generates deleterious effects, such as noise, vibration and erosion, reducing the performance and reliability of the servo valve [
2,
7]. The traditional flapper shape curves are caused by the diffusion of turbulent jets and subsequent extensive cavitation [
10]. The curved edge of the conventional flapper is mainly responsible for the cavitation phenomenon, and thus a new flapper shape is proposed to suppress the cavitation phenomenon [
11]. The main flow forces, lateral forces and cavitation were simulated and verified by CFD. The rectangle remarkably depresses the cavitation by decaying its straight and relatively long turbulent jets on the flat ground [
8,
9]. Moreover, Peng [
12] analyzed the mechanical properties of the innovated flapper shapes. According to the verified numerical model, the proposed innovative flapper shape maintains similar mechanical properties as the conventional shape. However, the experimental validation of the mechanical characteristics was not conducted to prove the efficiency of the optimized flapper shape. Then, the researchers promoted another method: the reduction of cavitation in the pilot valve is accomplished by decreasing radiation jet velocity [
9], while the micro-jet can accelerate the reduction of the jet velocity [
13].
There is a lack of research on the flow state and flow force of servo valves under temperature shock. With the occurrence of temperature shock, the flow evolves from a mixed state of laminar and turbulent flow to turbulent flow with a high Reynolds number, which causes significant changes in pressure, flow velocity and cavitation distribution patterns in the flow field, which in turn amplifies control errors and affects jet noise characteristics
The temperature change probably causes an unexpected drop in control valve performance, resulting in significant changes to oil viscosity, leakage and friction in the power stage spool, thus leading to erratic operation or even complete inoperability [
14]. In the launch vehicle, the hydraulic system has very limited space, the reservoir is small, and no cooling system is available. As the oil temperature increases, many internal factors of the electro-hydraulic servo valve are affected, which results in a remarkable decrease in control accuracy [
15]. Yin [
16,
17] and Zhang [
18] concentrated on the effect of temperature on the dimensions and fitting of mechanical components inside the servo valve and investigated the interior temperature distribution and flow coefficient of the pilot stage, as well as the flow field under extreme temperature conditions. Bordovsky [
19] investigated the steady-state flow force in spool valves of different geometries at different hydraulic oil temperatures. The verification and simulations demonstrated that the oil temperature leads to quantified deviations in the steady-state flow force. However, the flow force increasingly affects the valve opening more than the general fluid temperature, but an accurate model of the effect of temperature-related flow force may be needed to anticipate the operating force of the servo control system, although its impact is likely to be of secondary importance.
Moreover, when the temperature rises, the viscosity of the oil and the saturated vapor pressure of the oil vary with the temperature, causing cavitation in the flow field of the pilot stage. Cavitation disrupts the flow continuity and reduces its physical control properties. Moreover, in many special conditions, it can lead to unpredictable results, such as squeaks, vibrations and erosion of the flapper surface [
20,
21].
Cavitation not only breaks the flow continuity and degrades its physical performance of control but also, in many particular cases, results in unpredictable and undesirable consequences, such as squeak, vibration, and erosion of the surface of the flapper [
20,
21]. The cavitation phenomenon contributes an integral role to the flow force on the flapper. Within the force analysis of the flapper, it is essential to consider the cavitation phenomenon [
22]. This work aims to understand the temperature-induced model to investigate the temperature characteristics of the flow force and cavitation phenomenon of the pilot valve with different deflections.
The major contributions of the paper are summarized as follows.
(1) Considering the influence of temperature and pressure loss comprehensively, a theoretical mathematical model is established to describe the flow force of the electro-hydraulic servo valve pilot stage.
(2) On this basis, the effects of temperature, the deflection position of the flapper, and the inlet pressure on the electro-hydraulic servo valve pilot stage are analyzed and the cavitation phenomenon is observed.
(3) An experimental device is designed, including the establishment of experimental conditions for temperature variation and the measurement of flow force, to validate the mathematical model of flow forces and to observe the cavitation phenomenon of the nozzle flapper servo valve.
2. Mathematical Mode
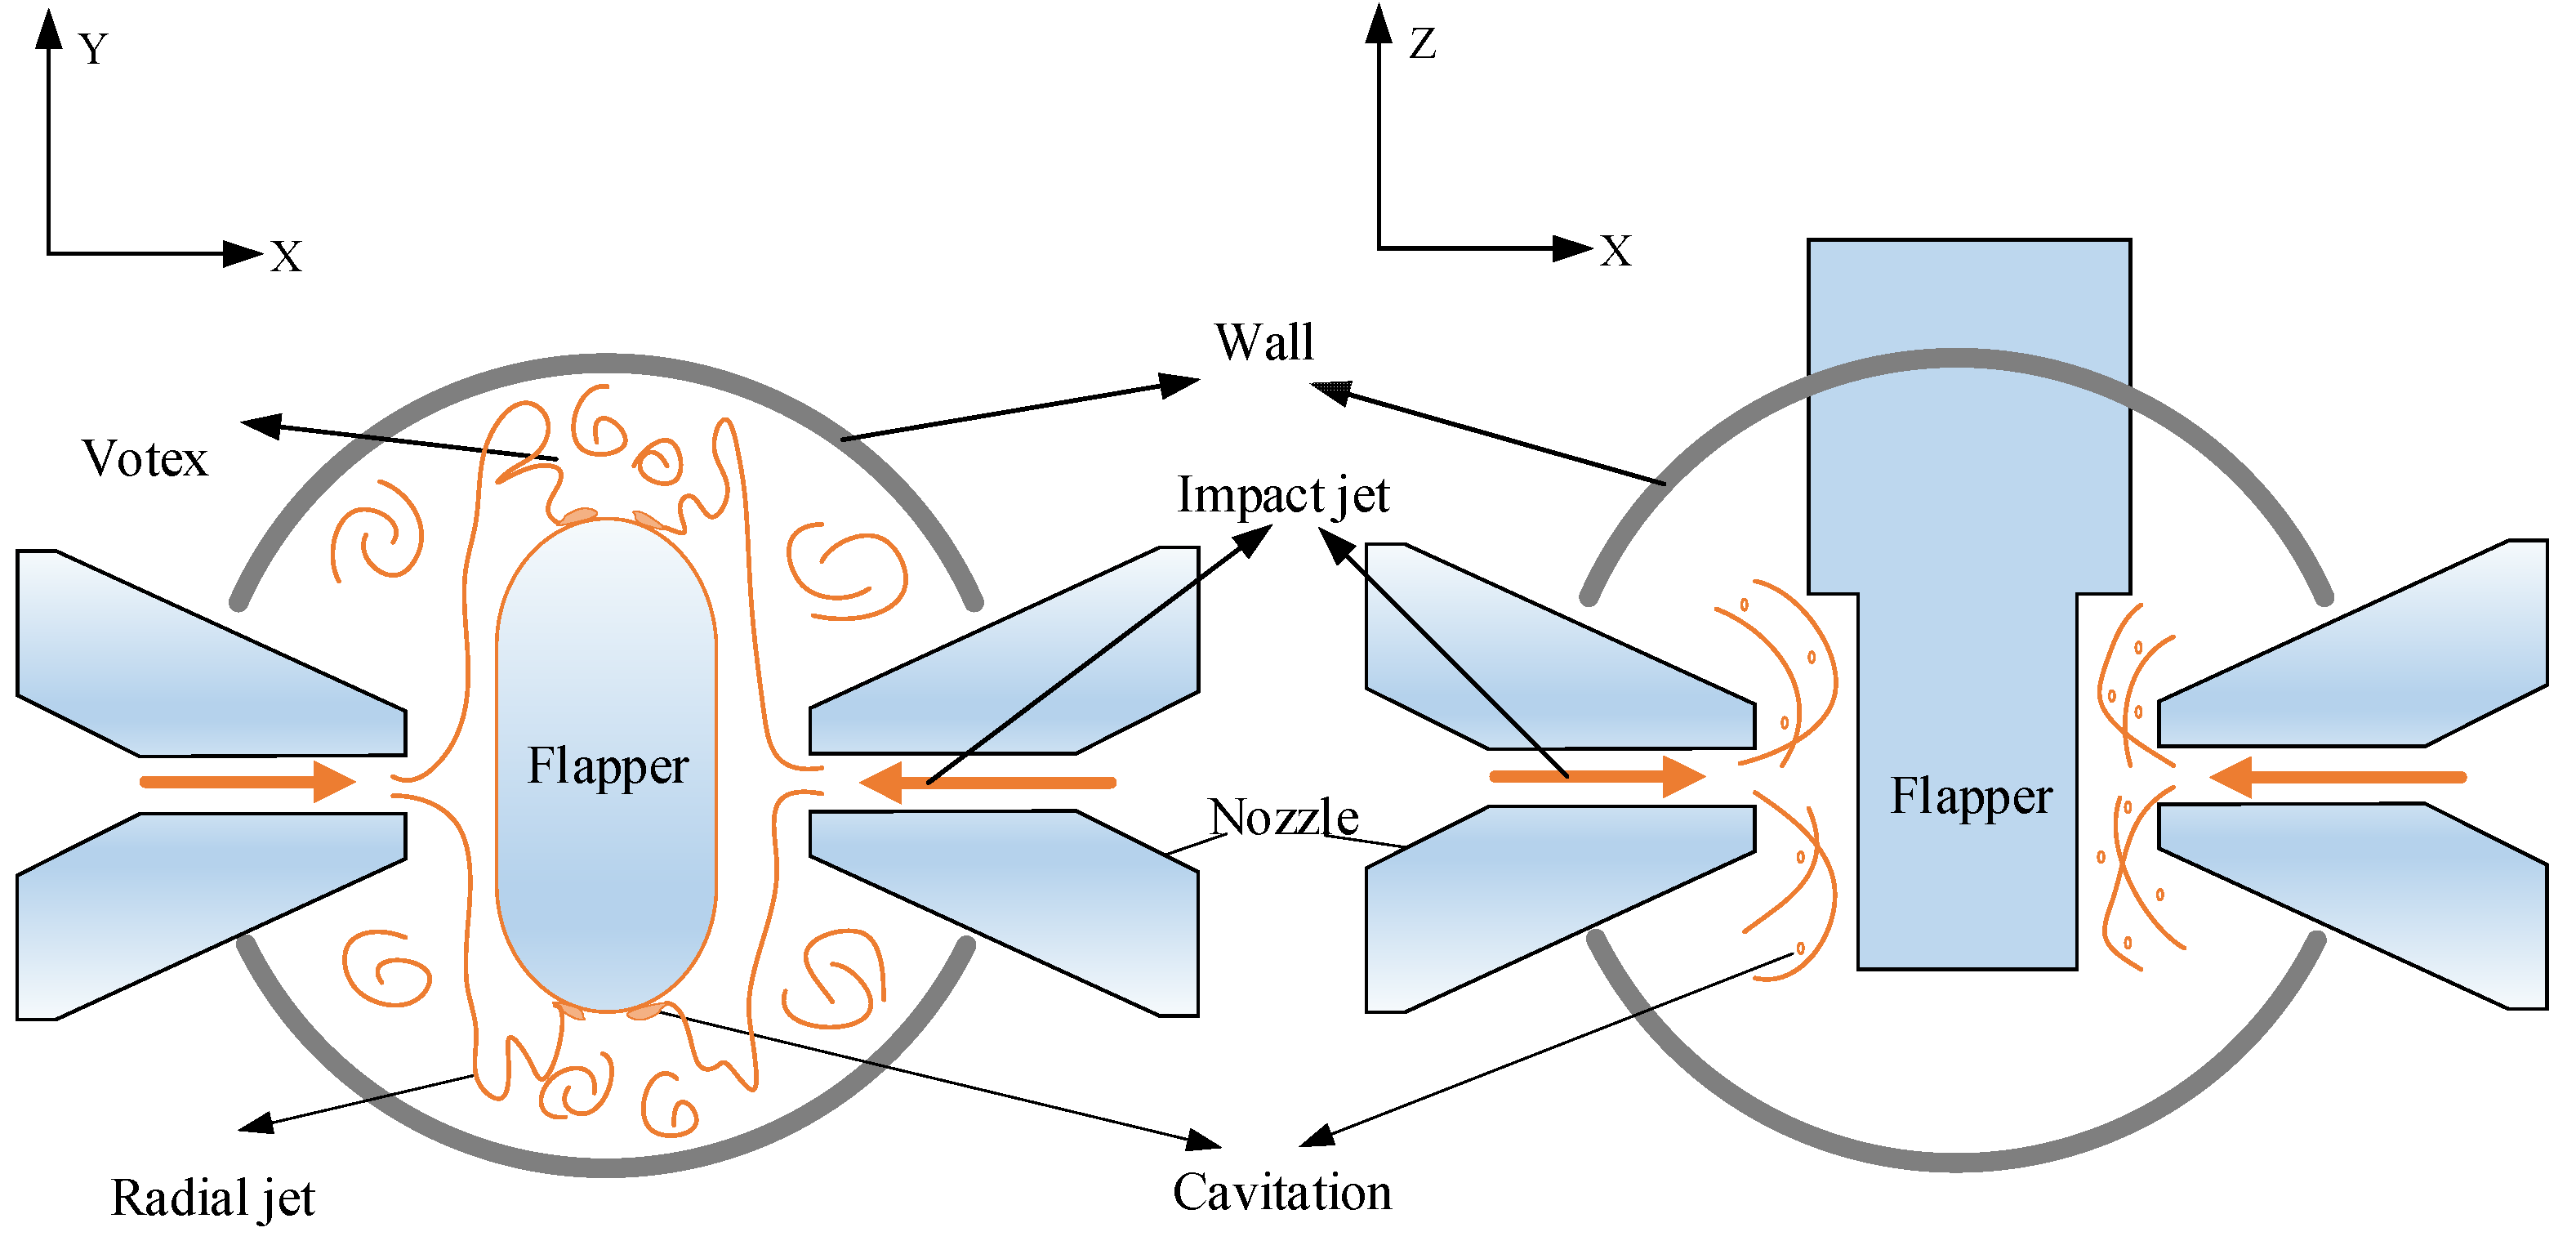
The schematic diagram of the flow field of the pilot stage along the horizontal and vertical planes of the nozzle outlet is illustrated in
Figure 1. As seen in
Figure 1, the internal flow field has the characteristics of a free jet, impact jet, and radial jet simultaneously [
20,
23]. The oil ejected from the nozzle has the characteristics of a free jet. After the fluid is jetted from the nozzle at the speed of
, it flows along the axis of the nozzle, other fluids are also pumped for lateral pulsation, and the width of the jet continues to expand. Therefore, the whole flow field exhibits the characteristic that the jet fluid continuously exchanges mass and momentum with the surrounding fluid while driving the surrounding fluid together to move forward to the flapper. In this process, more and more fluid mass is driven by the jet, the jet velocity gradually decreases, and the core area that maintains the axial velocity
gradually decreases. Then, the jet fluid is wall impacted with the flapper. After the velocity of the fluid on the flapper surface is reduced to zero, the entire flow field continues to flow along the flapper wall [
24], as shown in
Figure 2.
Assuming a uniform distribution of oil velocity at the nozzle, the jet thickness, the maximum velocity of the jet in the flow field, the jet axis direction distance, and the jet pole to the nozzle exit distance are required to satisfy the Equations (1)–(5) [
24,
25]. For the free jet with a circular cross-section, the semi-expansion is:
For wall impact jets with a circular cross-section, the jet semi-expansion thickness is:
In which,
is semi-expansion thickness,
,
is the maximum jet velocity,
is the initial jet velocity,
is the distance from the jet pole to the nozzle outlet,
is the distance from the direction of the free jet to the nozzle outlet,
is the diameter of the nozzle,
is the distance from the direction of the wall impingement jet to the nozzle outlet,
is wall pressure,
is the inlet pressure of the nozzle, and
is the distance from the nozzle outlet to the flapper. According to the experimental results of reference [
25],
,
,
,
,
.
When the flow impinges on the surface of the flapper, it flows radially around to form a jet flow field, and cavitation is generated in some positions. The schematic diagram of the jet flow field in the single-sided nozzle area is shown in
Figure 3. After the radial jet impinges the wall, it attaches to the curves of the flapper. The jet impinges on the surface around the flapper to form a vortex between the cavity wall and the surface around the flapper. When the flapper is located in the center of the twin nozzles, the flow velocity and pressure of the flow impacting the flapper are the same, and the jet flow field formed by the outflow is symmetrical. When the servo valve works, under the action of the torque output by the torque motor, the flapper shifts to one side, making the gap between the twin nozzles and the flapper different. Thus, the pressure and flow force induced by the flow impact flapper are unequal. The flow force received by the flapper will change with the displacement of the flapper.
The distance between the nozzle flapper and the diameter of the nozzle is very tiny in the pilot stage. The flow ejects from the nozzle at high velocity and impinges the surface of the flapper vertically, generating the main flow force on the flapper. To simplify the calculation, only the impact force on the left side is calculated, which is the schematic diagram of the main flow force received by the left side of the flapper.
According to the reference [
26], the flow force of the pilot stage can be obtained:
where
is the control chamber pressure,
is the velocity of the nozzle,
is the oil density,
is the nozzle area.
Equation (6) is derived from the Bernoulli equation, but Equation (6) only considers inviscid, incompressible fluids, which are ideal fluids. However, the actual fluid flow will cause frictional resistance due to the oil viscosity, as shown in
Figure 4. The frictional resistance requires the power or energy of the driving fluid to become the frictional loss of the tube flow.
Simplify the flow pipe of the nozzle into three parts, as shown in
Figure 5. Section 1-1’ to the section 2-2’ and section 4-4’ to the section 5-5’ is the pipe flow. According to the Darcy–Weisbach formula [
27], the head loss can be expressed as:
where
is the length of the pipe,
is the diameter of the pipe, and the friction coefficient is
.
At the fixed orifice of sections 2-2’ to 4-4’, it contains two parts of abrupt change in the cross-sectional area. One part of the pressure loss is generated in the convergent pipe along the flow direction, as indicated in
Figure 6. The fixed orifice with sections 2-2’ to 3-3’ of the convergent flow will not cause flow separation due to the decrease in pressure along the flow direction, so only the pipe friction loss needs to be considered. Since the
and
, the head loss
in sections 2-2’ to the section 3-3’ can be expressed as:
In which, .
The other part is the flow at cross-section 3-3’ to 4-4’, where the cross-sectional area suddenly expands from
to
. The fluid enters the larger diameter pipe in the form of a jet, which generates pressure loss due to the surrounding fluid being wrapped to form a vortex, as shown in
Figure 7. The head loss
of the sudden expansion of the pipe is:
where
.
The variable orifice with sections 5-5 ‘to 6-6’ is the convergent pipe. The head loss
in section 5-5’ to section 6-6’ can be expressed as:
In which .
The total pressure loss is:
Moreover, after the temperature increases, the viscosity of the hydraulic oil, the size of the pilot stage and the total head loss changes with increasing temperature. The velocity and the flow force changed with temperature variation.
The increase in the temperature will affect the tiny orifice assembly. It is assumed that the material expands inward as the temperature increases since the orifice is fabricated using an interference fit. The diameter of the orifice can be deduced by:
where
is the coefficient of thermal expansion of nozzle and flapper,
is the diameters of the nozzle at the initial temperature and
is the wall thickness.
Additionally, the clearance between the nozzle and flapper, as indicated in
Figure 8, is affected by the expansion of the material. Taking into account that the material of the flapper is the same as the nozzle. With the temperature changes, the thickness of the clearance
can be represented by:
In which, is the clearance between the nozzle and flapper, and are the flapper thickness and the free end’s length at the initial temperature, respectively.
Flow coefficient is an exponential function of temperature variation [
15], that is:
According to the momentum equation of the X-direction in
Figure 3, the flow force can be obtained:
Submitting Equation (16) to Equation (17) yields:
Therefore, Equation (18) can be regarded as a theoretical foundation for calculating the flow force on the flapper at extreme temperatures.
4. Results and Analysis of the Simulation and Tests
4.1. Characteristics of the Jet Flow Field at Different Temperatures
Assuming that the flapper is in the central position, the jet inlet pressure is 21 MPa, and the axial pressure distribution at the centerline of the AI section is displayed in
Figure 12. It can be seen from
Figure 12 that the pressure loss is viscous friction-induced along the large cross-section AB with the lower velocity. When the oil passes through the fixed orifice, the pressure is reduced due to the contraction of the cross-section, which results in the increase in flow, the increase of kinetic energy and the local energy loss generated by the contraction process. The increase in flow velocity induces the pressure losses which include friction-induced losses and the additional losses due to changes in fluid momentum. With the combined effect of the linear pressure loss and additional pressure loss, the pressure in the CF section decreases rapidly at first and then tends to be stable. Moreover, the linear pressure loss in the EF section increases. When the oil passes through the variable orifice, the pressure in the FI section decreases due to the contraction of the cross-section. This again leads to increased velocity, kinetic energy, and the local energy loss produced by the contraction process.
The axial velocity distribution at the centerline of the AI section is illustrated in
Figure 13a. The flow velocity is small in the AB section. When the oil passes through the fixed orifice, the contraction of the cross-section results in a sharp increase in the flow velocity due to the small diameter of the fixed orifice, and then the flow velocity rises slowly. It tends to be stable after entering the CF section of the control chamber in the gentle development section. After passing through the variable orifice, the flow velocity increases again because of the contraction of the cross-section. Therefore, high-velocity jet flows are generated at both the fixed orifice and the nozzle flapper variable orifice. Since the diameter of the jet nozzle is larger than that of the fixed orifice, the velocity of the variable orifice in the FI section is smaller than that of the CD section of the fixed orifice.
In the nozzle jet orifice, the velocity decreases sharply when the fluid flows into the annular gap JJ’KK’ due to the contraction of the flow section. The increase of kinetic energy and the local energy loss from the contraction process makes the pressure decrease, after which the fluid diffuses and attaches to the wall, the flow cross-section increases, the flow velocity becomes lower, and gradually decreases to the outlet pressure under the effect of viscous force.
As can be seen from
Figure 12 and
Figure 13a, when the hydraulic fluid is at a low temperature of −20 °C, the oil viscosity is large, the maximum flow velocity at the fixed orifice is about 180 m/s, and the maximum flow velocity at the nozzle flapper variable orifice is about 50 m/s. The pressure change in the supply oil chamber is small, and the pressure decreases sharply after the fixed orifice. The pressure at the inlet of the control chamber is about 2.97 MPa, and the pressure at the end of the control chamber is about 2.8 MPa due to the pressure loss along with the chamber. The maximum velocity in the Z direction of the XZ section is about 68 m/s, as displayed in
Figure 13b. With the increase in oil temperature, the oil viscosity decreases and the flow velocity through the fixed and variable orifice increases. When the temperature rises to 50 °C, the maximum flow velocity at the fixed orifice is about 192 m/s, and the maximum flow velocity at the nozzle flapper variable orifice is about 55 m/s. The pressure is reduced rapidly after the fixed orifice, the pressure at the inlet of the control chamber is about 5.71 MPa, and the pressure at the end of the control chamber is about 5.61 MPa due to linear pressure loss. The maximum velocity in the Z direction at the XZ section is about 95 m/s, as depicted in
Figure 13b. Between −20 °C and 50 °C, temperature greatly influences viscosity, and the change of oil viscosity has a larger influence on velocity and pressure. With the further increase in temperature, the variation of viscosity with temperature is small, and the velocity and pressure changes have a negligible effect on temperature.
When the flapper is in the central position, the comparison between the calculated results of Equation (6), Equation (18) and CFD simulated results is presented in
Figure 14. The flow force acting on the flapper is positively related to the variation of the flow coefficient with increasing temperature. As the temperature increases, Equation (18) comprehensively considers the linear pressure loss and the change of the parameters with temperature. Comparing the simulation results with the theoretical calculation results, it is observed that the flow force deduced from Equation (18) is in good agreement with the CFD simulation.
4.2. The Influence of Temperature Shock on Flow Force
The hydraulic oil is ejected from the jet nozzle with high velocity, and the flow force acting on the flapper is generated by the steady-state pressure on the flapper. When the flapper moves to a particular position, the oil tends to stabilize, and the main flow force acting on the flapper tends to stabilize. The flow force acting on the flapper is mainly related to the jet pressure, the clearance between the nozzle and flapper, and the temperature of the fluid.
The change of oil viscosity with temperature affects the change of the pilot stage flow coefficient with temperature. According to Equation (15), the change of the flow coefficient with temperature is displayed in
Table 2.
When the temperature is lower than 50 °C, the flow coefficient changes significantly with the increase of temperature, and when the temperature is higher than 50 °C, the change of flow coefficient with temperature is smaller; therefore, when the temperature is higher than 50 °C, the oil viscosity has less influence on the flow coefficient.
Temperature affects the oil velocity in the nozzle by influencing the change of oil viscosity. According to the theoretical equation of flow force, the change of flow force with temperature is positively correlated with the flow coefficient. With the deflection of the flapper and the increase of the oil temperature, the flow force on the flapper increases, as shown in
Figure 15. As the temperature rises, the viscosity of the fluid decreases rapidly, the velocity of the fluid rises, and the flow force on the flapper increases. When the temperature is above 50 °C, the influence of oil viscosity is small, and the flow force is almost unaffected by temperature. Owing to the combined effect of pressure loss and temperature on servo valve parameters, the flow force tends to decrease slightly.
With the deflection of the flapper and the increase of the oil temperature, the flow force on the flapper increases, as shown in
Figure 15. As the temperature rises, the viscosity of the fluid decreases rapidly, the velocity of the fluid rises, and the flow force on the flapper increases. When the temperature is above 50 °C, the influence of oil viscosity is small, and the flow force is almost unaffected by temperature. Moreover, owing to the combined effect of pressure loss and temperature on servo valve parameters, the flow force tends to decrease slightly.
When the servo valve is working, the flapper is deflected with the change of input current, which causes the distance between the nozzle and the flapper to change. With the same inlet pressure of 21 MPa, the flow force acting on the flapper increases with the movement of the nozzle toward the flapper.
Figure 16 illustrates the influence of inlet pressure on the flow force. It can be seen that with the fixed deflection distance and constant boundary conditions when the jet nozzle moves 25 μm toward the flapper, the variation of inlet pressure leads to the change of steady-state pressure in the flow field and the increase in the pressure difference between the nozzle and the flapper. With the rise of inlet pressure, the flow force acting on the flapper increases; the trend is consistent with the theoretical calculation results.
Comparing the theoretical and CFD simulation results in
Figure 15 and
Figure 16, there are differences between the theoretical and CFD simulated results, but their trends remain consistent.
4.3. The Influence of Temperature Shock on Cavitation
The cavity in the flow field of the servo valve pilot stage will produce an additional force on the flapper and the cavity wall. Moreover, it will corrode the surface, which will affect the size of the flow force on the flapper. Significantly, the formation of attached cavities on the flapper surface will seriously affect the stability of the flapper. Therefore, it is necessary to analyze the location of cavity formation and the size range of cavities in the flow field.
Assuming that the nozzle flapper clearance is in the middle position, the jet inlet pressure is 21 MPa, and the outlet pressure is 5000 Pa, the simulation results of cavitation at different temperatures are observed, as indicated in
Figure 17. In the XZ cross-section, weak cavitation occurs at the nozzle flapper gap at −20 °C. The local enlargement at the nozzle flapper is shown in
Figure 17a.
Figure 17a shows that the cavitation phenomenon is observed at the clearance between the nozzle and flapper, with a maximum cavitation intensity of 0.0858. With the increase of temperature, the oil viscosity decreases and the flow viscosity increases, while the saturation vapor pressure of the oil increases with the temperature rise. Thus, as the temperature increases, the strength of cavitation increases, the vapor volume fraction increases, and the cavitation area gradually increases and extends upward along the arc of the flapper. The gas content at the gap between the nozzle and the flapper is relatively tiny, and the cavitation area remains stable, while the area adjacent to the flapper arc gradually becomes larger with the increase of temperature and develops from a triangular shape to an elongated shape, as seen from (a) to (c). With the further increase in temperature, the cavitation area close to the circular arc extends upward along the flapper arc, and the area further increases. The cavitation area above the flapper is elliptical and spreads rapidly around, and the cavitation area above the side of the flapper is elongated and gradually becomes longer, as indicated by (d) to (h).
This is mainly because the lower oil viscosity will lead to a higher Reynolds number in the flow field of the pilot stage, which will inevitably cause a more intense turbulent jet phenomenon, resulting in the induction of stronger cavitation dynamics. Therefore, the higher the fluid temperature, the more pronounced the cavitation phenomenon in the flow field. When the oil temperature is lower, the cavitation phenomenon will be weakened, but a small range of temperature changes has little effect on the viscosity.
When the control current is input into the servo valve, the flapper assembly is deflected around the center of rotation, and the flapper is offset relative to the central position. The influence of the deflection position of the flapper on the cavitation strength for the same inlet pressure of 21 MPa at the XZ cross-section is presented in
Figure 18. In the central position, the cavitation phenomenon is mainly concentrated on the nozzle and flapper gap, close to the region of the flapper arc, as indicated in
Figure 17c. With the movement of the flapper toward the nozzle, the cavitation phenomenon is developed along the arc area, and the area gradually becomes larger, as displayed in
Figure 18a,b. In the subsequent motion, the cavitation phenomenon is mainly concentrated on the arc surface area of the flapper in
Figure 18c and even shrinks in
Figure 18d.
5. Conclusions Experiment Validation
In view of the complex internal structure of the electro-hydraulic servo valve pilot stage and the small size of the components, the flow force inside the pilot stage could not be measured directly. Hence, the nozzle and flapper of the test valve are removed from the completed servo valve, and the nozzle is recessed into the installation base. The dimensions and structural design of the flapper, nozzle filter and the fixed orifice are the same as the actual servo valve. The schematic diagram of the experimental system is displayed in
Figure 19.
The experimental device consists of a three-degree-of-freedom high-precision positioning platform, a high-precision electric rod, a micro force sensor and a nozzle assembly for the servo valve. As the actuator of the whole system, the electric rod is connected to the flapper after connecting the force sensor. The flow force test rig of electro-hydraulic servo valve is depicted in
Figure 20.
To establish a suitable temperature condition to evaluate the influence of temperature on the pilot stage of the electro-hydraulic servo valve, a high-temperature characteristic simulation test rig is required to control the experimental temperature. Moreover, it is necessary to mix the normal temperature hydraulic oil and the high-temperature hydraulic oil to reach the required temperature. Therefore, the precise temperature control system of the hydraulic oil for the test is performed by the mixing control system. The principle of the hydraulic oil temperature control system is illustrated in
Figure 21a. The high-temperature characteristic test rig is displayed in
Figure 21b.
In the experimental process, due to the experimental conditions, the oil temperature is limited to 120 °C. The nozzle and flapper are installed in the specified position, and the flapper is controlled by the high-precision positioning platform with the highest accuracy of 0.1 . The clearance of the nozzle and flapper is adjusted to measure the influence of flow force acting on the flapper.
The influence of the displacement between the nozzle and flapper and the variation of temperature on the flow force is demonstrated in
Figure 22. As the flapper moves toward the nozzle, the velocity of the fluid from the nozzle jet increases, and the flow force acting on the flapper tends to increase. As the temperature rises, the viscosity of the fluid decreases, but after a specific temperature is exceeded, the oil viscosity almost does not change, which shows that when the temperature exceeds 50 °C, the flow force changes slightly. Moreover, as a result of the comprehensive influence of pressure loss and temperature on servo valve parameters, the flow force shows a slightly decreasing trend.
As seen in
Figure 23, when the flapper position is at 25 μm, the pressure acting on the flapper decreases as the oil supply pressure decreases, resulting in a subsequent reduction in the flow force on the flapper. A comparison of
Figure 22 and
Figure 23 indicates that the experimental results are consistent with the simulation results.
In the process of the experiment, the cavitation phenomenon is present throughout the test. At room temperature, when the flapper moves to the nozzle from the specified position, the oil cavitation initiates rapidly, and the oil mist can be clearly observed, as displayed in
Figure 24a. As the flapper continues to move toward the nozzle, the ejected oil is more concentrated, and the cavitation phenomenon becomes more intense, as indicated in
Figure 24c,d. The trend of cavitation in
Figure 24 is in agreement with the simulation results in
Figure 18.
With the increase in temperature, a large number of micro-bubbles are generated along with the nozzle flapper, and the dispersion of the oil in the entire shield gradually increases, as displayed in
Figure 25a,b. When the temperature rises to 80 °C, it is almost impossible to visualize inside the shield, as presented in
Figure 25c–e. After stopping the test, it can be clearly observed that the microbubbles are mixed into larger bubbles owing to cavitation, as demonstrated in
Figure 24f. The generation of the cavitation phenomenon in servo valves will cause noise and vibration of servo valves, resulting in the degradation of servo valve performance or even failure.
6. Conclusions
To investigate the influence of temperature shock and pressure loss on the flow force acting on the flapper, a theoretical mathematical model which describes the flow force of the pilot stage of the electro-hydraulic servo valve is developed. As the temperature increases, the oil viscosity decreases rapidly, and the flow force acting on the flapper increases. When the temperature exceeds 50 °C, the effect of oil viscosity is small, and the flow force of the electro-hydraulic servo valve is less affected by temperature. Moreover, owing to the combined influence of pressure loss and temperature on the servo valve parameters, the flow force tends to decrease slightly.
When the servo valve is working, the flapper deflects with the change of input current, making the distance between the nozzle and the flapper change. As the supply oil pressure increases and the flapper moves toward the nozzle, the flow force acting on the flapper increases, and the trend is in accordance with the experimental results.
The lower oil viscosity will lead to a higher Reynolds number in the flow field of the pilot stage, which will inevitably cause a more intense turbulent jet phenomenon and thus induce stronger cavitation dynamics. The cavitation phenomenon is present throughout the test. The higher the fluid temperature, the more pronounced the cavitation phenomenon of the flow field. Extreme temperature environments could exacerbate self-excited oscillations and consequently lead to a decrease in the control accuracy of the electro-hydraulic servo valve.


