Article

The Investigation of Coupled Vibration of Automobile Transmission System and Its Intelligent Design

School of Mechanical and Electronic Engineering, Wuhan University of Technology, Wuhan 430070, China
*
Authors to whom correspondence should be addressed.
Machines 2022, 10(6), 428; https://doi.org/10.3390/machines10060428
Submission received: 2 April 2022 / Revised: 23 May 2022 / Accepted: 24 May 2022 / Published: 28 May 2022
(This article belongs to the Section Vehicle Engineering)

Abstract

:
Intelligent manufacturing is developing rapidly nowadays, promoting the efficiency of manufacturing. In comparison, the design process has become a bottleneck in the product life cycle. In order to address this problem, this research develops an intelligent design method based on the automobile transmission system. Firstly, a mathematical model of the coupled vibration between the drive shaft and the main reducer was developed, and the vibration responses of the transmission system were simulated based on this mathematical model. Then, a test rig was developed to measure the vibration responses of the system; the measured results correlated well with the simulation results, indicating that the mathematical model can be used to investigate the coupled vibration between the drive shaft and the main reducer. Furthermore, the multiple parameters of the transmission system were optimized based on the mathematical model using the intelligent optimization algorithm. In particular, software was developed based on the intelligent optimization algorithm for the convenience of analysis, and the optimized results were acquired. The analysis results show that the vibration responses can be reduced when the optimized parameters are applied, indicating that the intelligent design method developed in this research is effective for the intelligent design of transmission system.

1. Introduction

Intelligent manufacturing is developing rapidly, promoting the intelligent upgrading of the manufacturing industry. Recently, a smart-factory framework was developed and applied to the production of vehicle components, and the results showed that the application of this framework to automobile chassis smart factories could improve production efficiency and accelerate the process of enterprise transformation to intelligent manufacturing [1]. In comparison, the design process has become a bottleneck in the product life cycle. Taking the automobile transmission system as an example, it is necessary to update design methods to improve the design process. At the initial stage, the automobile transmission system is mainly designed using formalized software. For instance, multi-body dynamics software can be used to calculate the natural frequency and mode of automobile transmission system [2], and it can also be used to analyze the contact forces and transmission efficiency of automobile universal joints [3]. This kind of formalized software, however, is more like a black box, which is not suitable for intelligent design.
Although there is no universal definition for intelligent design, its basic meaning is that a customized product is designed to satisfy the customer’s individual and diversified requirements as quickly as possible and at as low a cost as possible [4]. However, it should be noted that the intelligent design of a system should be based on an effective mathematical model that has been verified by experiment measurement. For instance, an efficient analytical strategy for identifying the resonance sources and vibration transmissions for a bus has been illustrated, in which the resonance of the driveline is determined by mathematical methods; it was identified by experimental analysis that the coupled vibration of the powertrain and rear axle amplified the resonance of the whole driveline [5]. Recently, a model for the transmission system of automobiles was developed to analyze the reason why dramatic vibrations occur when engine rotation speeds reach a certain value; the results showed that the vibration was due to the resonance of the drive shaft and the transmission system. On the other hand, an experimental investigation on the effect of rotation speed on torsional vibration was also conducted to verify the mathematical model [6]. Moreover, a mathematical model was developed to investigate the effect of dual-mass flywheels on driveline torsional vibration in the engine start-up process, and it was verified by the measurement results of the time domain [7]. Furthermore, a dynamic model of the drive shaft main reducer was developed to study its noise vibration harshness performance, and the natural frequency of the transmission system was acquired, which was verified by the measured results [8]. It seems that mathematical models can simulate the actual situation, so it is feasible to conduct intelligent design based on mathematical models.
Parameter optimization based on intelligent optimization algorithms is widely used in automotive engineering. For instance, the shift law of dual-clutch transmissions is optimized by the particle swarm optimization algorithm (PSO), and the results show that the dynamic performance and economy of optimized shifts have improved [9]. Compared to the PSO, the main benefit of the genetic algorithm is to avoid slipping into the local optimum solution; it has good global search capabilities, self-adaptability, and the ability to find a global optimal solution without relying on initial conditions [10]. For this reason, the genetic algorithm is also widely applied to the performance optimization of automobiles. For example, the robustness of driveline torsional vibration has been analyzed using the genetic algorithm [11], and the dynamic performance and economy of two-speed powertrain transmissions can also be improved based on the genetic algorithm [12]. Furthermore, the genetic algorithm has been adopted to perform multi-objective optimization for the lightweight design of suspension components [13]. Therefore, it is feasible and effective for the multiple-parameter optimization design of automobile transmission system based on the genetic algorithm.
To sum up, an intelligent design of transmission system should be based on an effective mathematical model that has been verified by experiment measurement. In order to address this problem, an intelligent design method is developed based on the numerical analysis of a mathematical model and the experimental measurements of a test rig for automobile transmission system.

2. Methodologies

The transmission system is mainly to transfer the engine power to the wheels; it includes the gearbox, the intermediate drive shaft, the intermediate support, the main drive shaft, and the rear axle, as shown in Figure 1.
This research mainly includes three parts: Firstly, a mathematical model that can describe the coupled vibration of the torsional vibration of shafts and the planar vibration of the main reducer is developed. Using this model, the horizontal and vertical vibration responses of the transmission system are simulated. Furthermore, a test rig is developed to measure the vibration responses of the transmission system, and the measured results are compared with the simulated results. Finally, the multi-parameters of the transmission system are optimized using the intelligent optimization algorithm based on the mathematical model and experimental analysis.

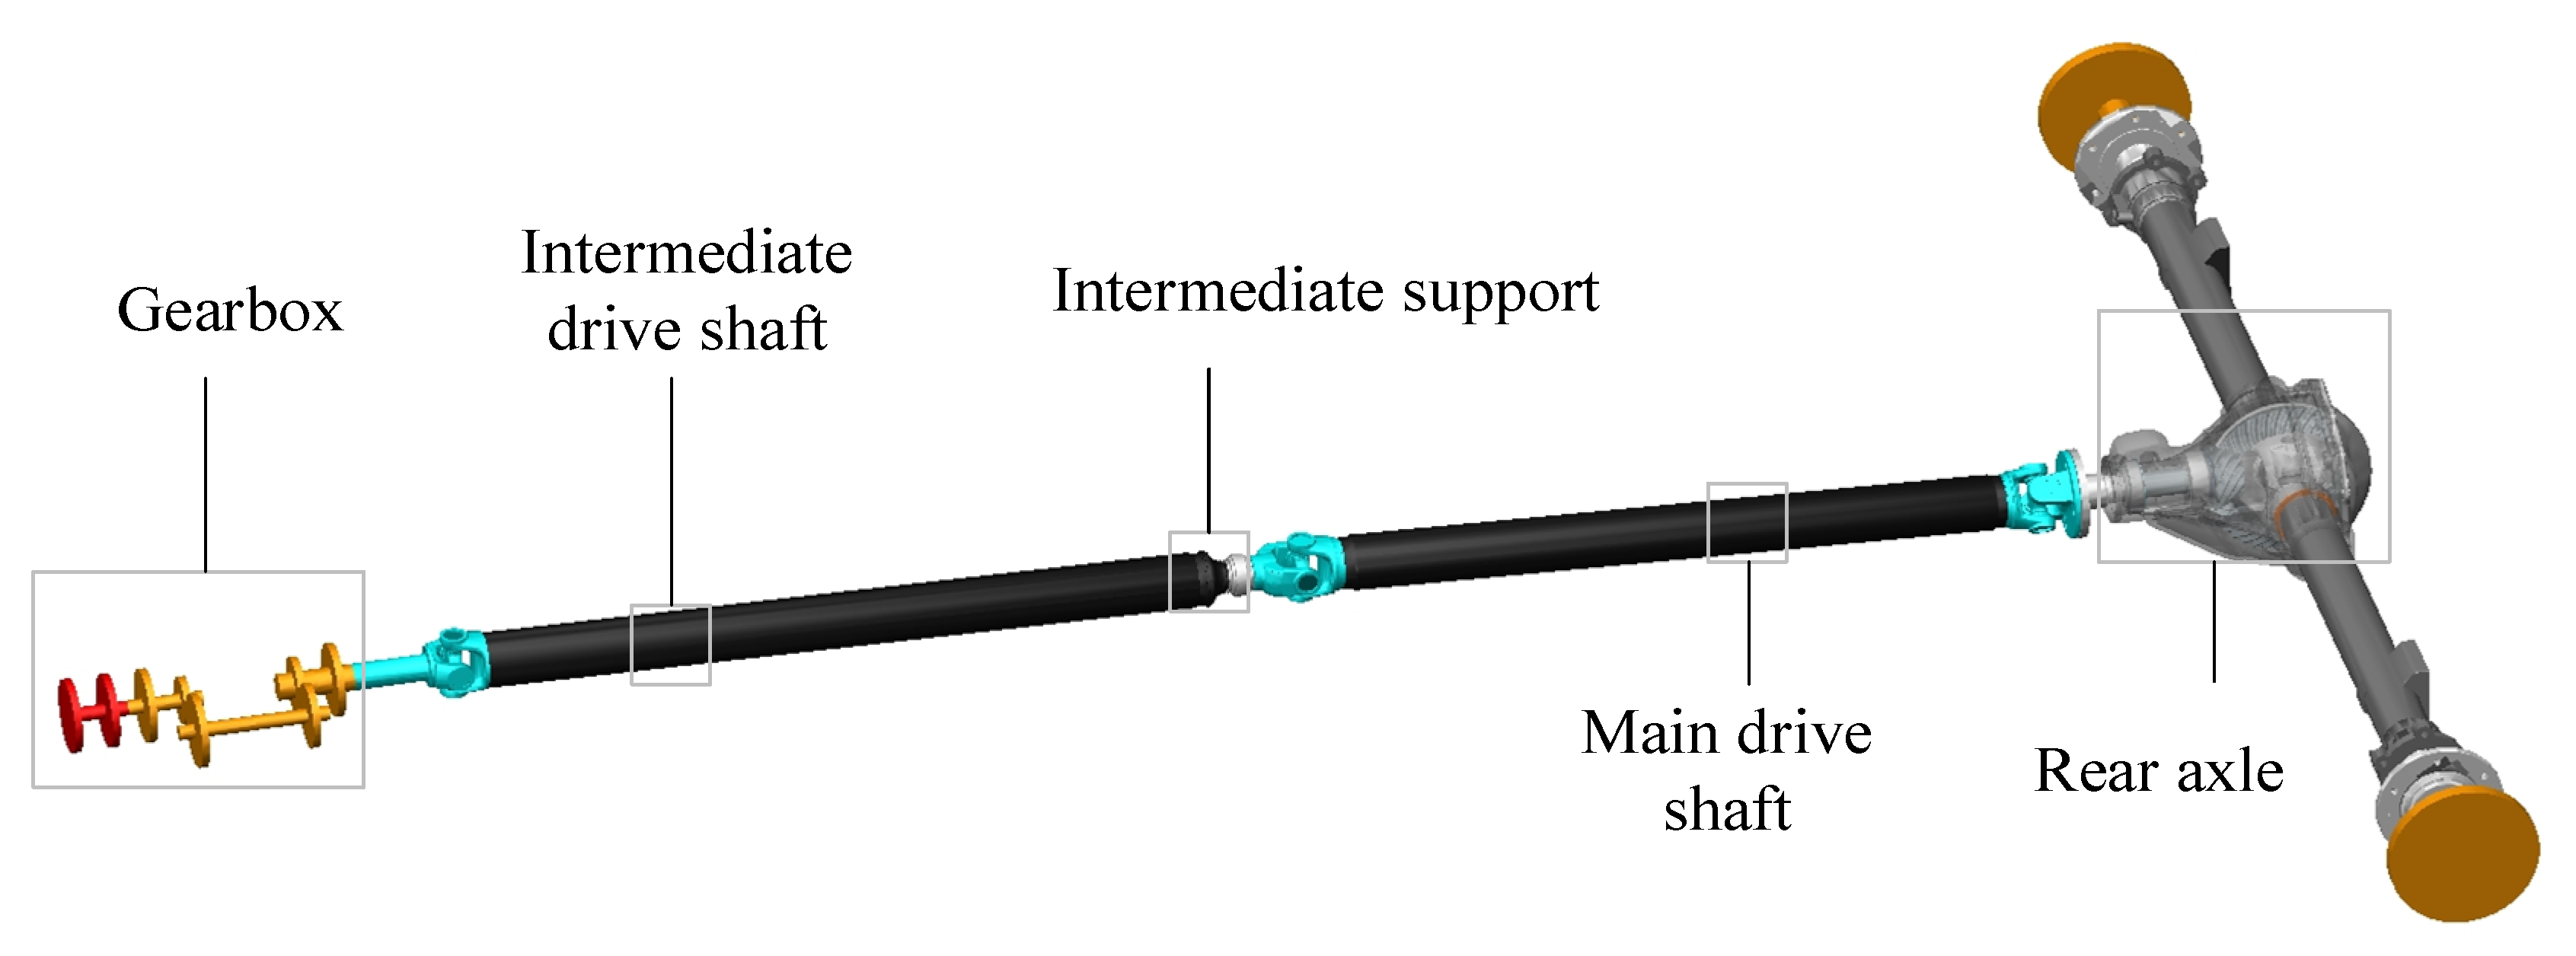
2.1. Mathematical Model of Transmission System

When the transmission system transmits torque, it generates both the torsional vibration of shafts and the planar vibration of the main reducer, which are coupled together. Therefore, a mathematical model of the transmission system that includes this kind of coupled vibration is developed in this section, which mainly includes a model of the drive shaft and a model of the rear axle.

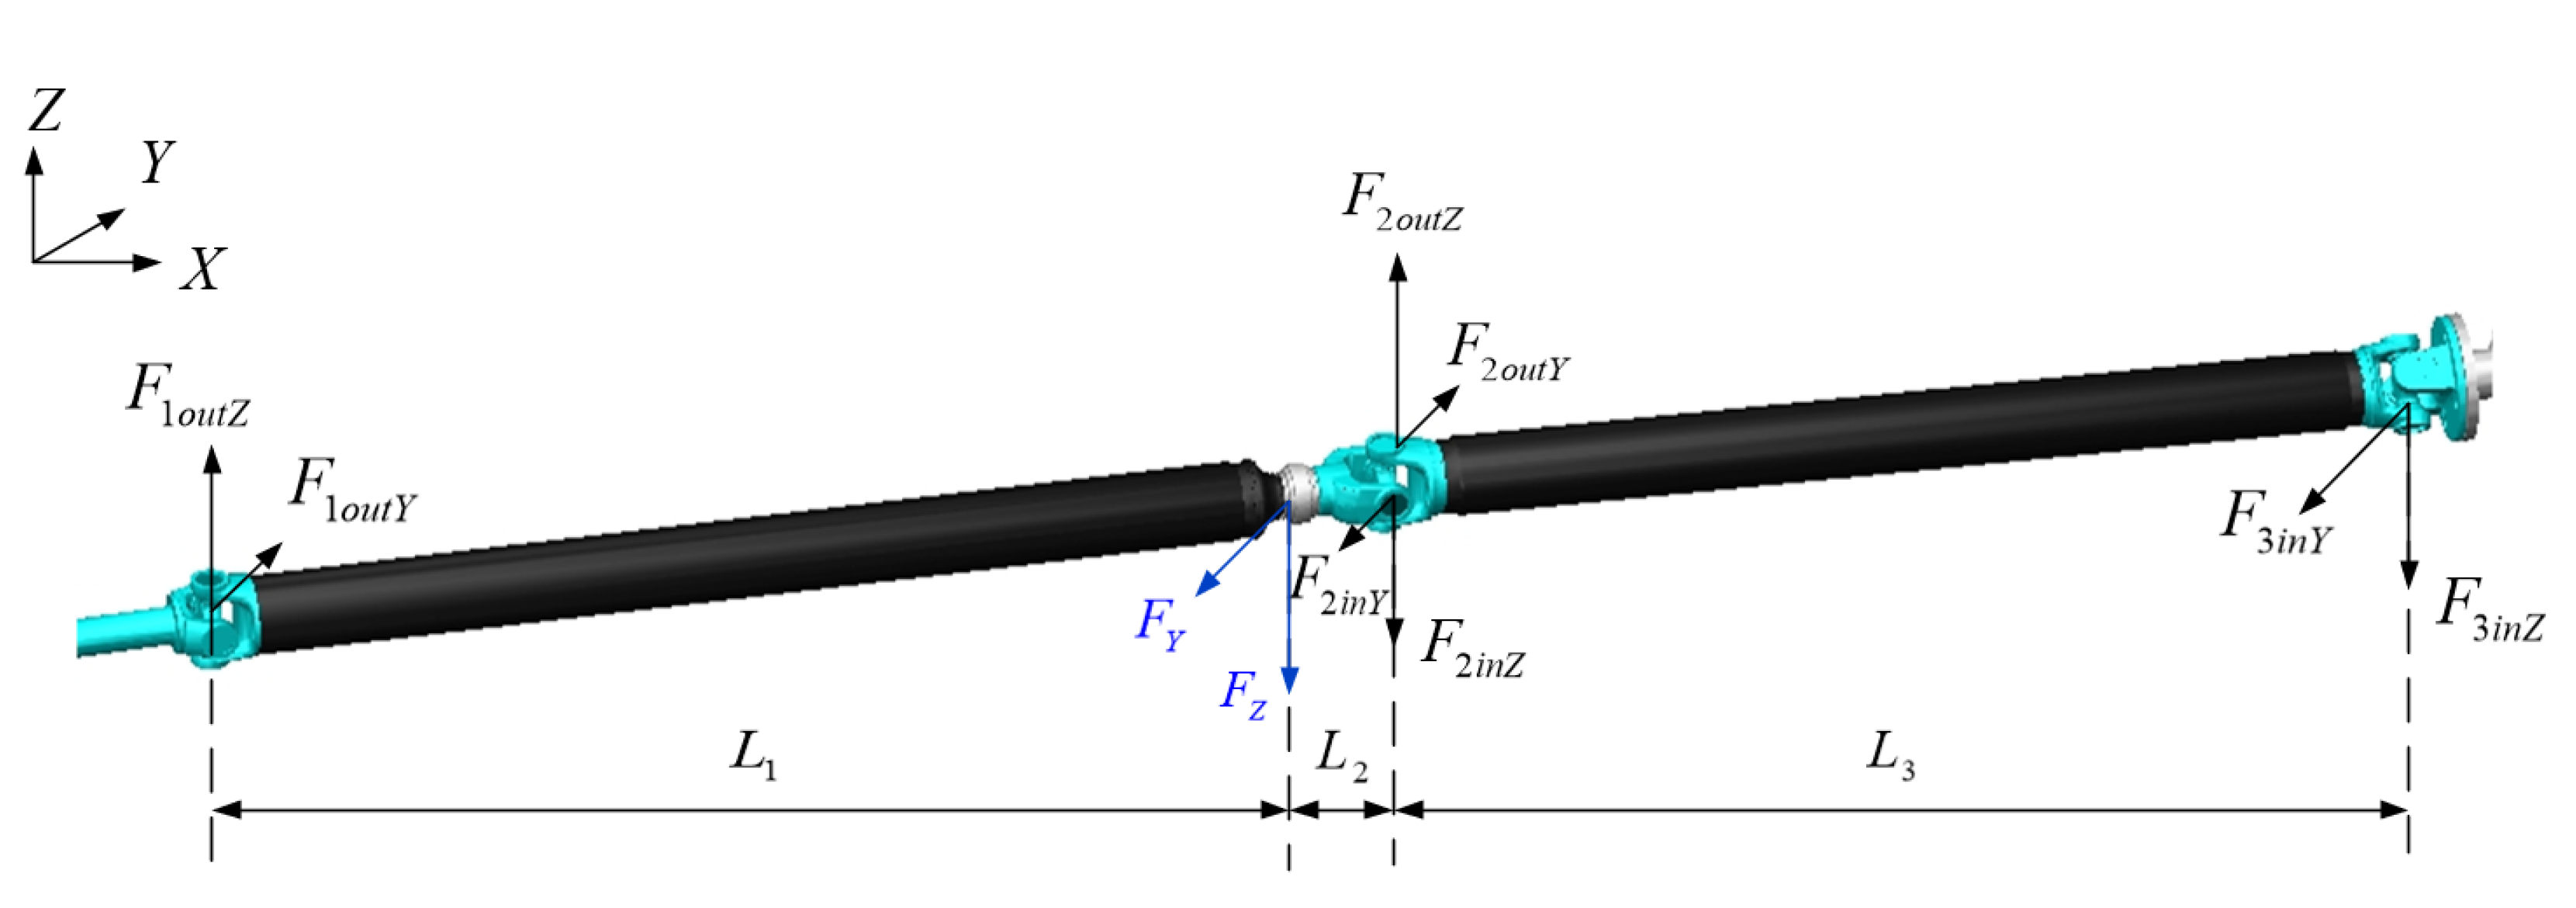
2.1.1. Mathematical Model of Drive Shaft

In order to investigate the vibration responses of the transmission system, a vibration model of the drives haft is presented in Figure 2.
The mathematical model of the drive shaft in Figure 2 can be expressed as,
m m y ¨ m + c Y y ˙ m + k Y y m = F Y m m z ¨ m + c Z z ˙ m + k Z z m = F Z J 1 θ ¨ 2 + c 1 ( θ ˙ 2 θ ˙ 3 ) + k 1 ( θ 2 θ 3 ) = T 2 J 2 θ ¨ 3 + c 1 ( θ ˙ 3 θ ˙ 2 ) + k 1 ( θ 3 θ 2 ) = T 3 J 3 θ ¨ 4 + c 2 ( θ ˙ 4 θ ˙ 5 ) + k 2 ( θ 4 θ 5 ) = T 4 J 4 θ ¨ 5 + c 2 ( θ ˙ 5 θ ˙ 4 ) + k 2 ( θ 5 θ 4 ) = T 5
where m m is the mass of the intermediate support; y m , y ˙ m , and y ¨ m are the displacement, velocity, and acceleration of the intermediate support in the Y direction; z m , z ˙ m , and z ¨ m are the displacement, velocity, and acceleration of the intermediate support in the Z direction; J i ( i = 1 , 2 , , 6 ) is the equivalent moment of inertia and T i ( i = 1 , 2 , , 6 ) is the torque of the concentration point; θ i ( i = 1 , 2 , , 7 ) , θ ˙ i , and θ ¨ i are the angular displacement, velocity, and acceleration of the concentration point, respectively; k 1 , k 2 , and k 3 are the equivalent torsional stiffness of the intermediate drive shaft, the main driveshaft, and the pinion shaft, respectively; c 1 , c 2 , and c 3 are the equivalent torsional damping of the intermediate drive shaft, the main drive shaft, and the pinion shaft, respectively; F Y and F Z are the excitation forces of the intermediate support in the Y and Z directions; k Y and k Z are the stiffness of the intermediate support in the Y and Z directions; c Y and c Z are the damping of the intermediate support in the Y and Z directions.
The equivalent stiffness of the driveshaft k i ( i = 1 , 2 , 3 ) in Equation (1) can be acquired with,
k i = π G p ( D i 4 d i 4 ) 32 l i
where G p is the shear modulus of elasticity; D i and d i are the outer diameter and inner diameter of the driveshaft, respectively; l i is the length of the drive shaft.
At the same time, the damping of the drive shaft c i ( i = 1 , 2 , 3 ) in Equation (1) can be expressed as,
c i = 2 ς k i 1 J i + 1 J j
where ς is the damping coefficient of the drive shaft, whose value is between 0.005 and 0.075; k i is the stiffness of the drive shaft; J i and J j are the inertia of two ends of the drive shaft. The corresponding parameters of the drive shaft are listed in Table 1.
The bearing, bracket, and rubber damping ring of the intermediate support can be equivalent to a series system composed of springs and damping, and their combined stiffness k Y in Equation (1) can be acquired with [14],
k Y = k b k s k b + k s
where k b is the equivalent stiffness of the bracket and bearing, whose value is 475 N/mm; k s is the equivalent stiffness of the rubber damping ring, whose value is 45 N/mm after measurements.
The excitation forces of the drive shaft are affected by the small angles α 1 , α 2 , and α 3 between the universal joints, which are presented in Figure 3.
Under the effect of excitation forces, the reaction forces F Y and F Z of the drive shaft are generated,
F Y = F 1 o u t Y F 2 i n Y + F 2 o u t Y F 3 i n Y F Z = F 1 o u t Z F 2 i n Z + F 2 o u t Z F 3 i n Z
where F i i n Y , F i i n Z ( i = 1 , 2 , 3 ) are the excitation forces generated by the input drive shaft of the i th universal joint in the Y and Z directions; F i o u t Y , F i o u t Z ( i = 1 , 2 , 3 ) are the excitation forces generated by the output drive shaft of the i th universal joint in the Y and Z directions.
The excitation forces in the Y and Z directions can be acquired by decomposing the excitation forces on the drive shaft,
F 1 o u t Y = F 1 o u t cos θ 2 F 1 o u t Z = F 1 o u t sin θ 2 F 2 i n Y = F 2 i n cos θ 3 F 2 i n Z = F 2 i n sin θ 3 F 2 o u t Y = F 2 o u t cos θ 3 F 2 o u t Z = F 2 o u t sin θ 3 cos α 2 F 3 in Y = F 3 in cos θ 3 F 3 in Z = F 3 in sin θ 3 cos α 2
where F j o u t ( j = 1 , 2 , 3 ) is the excitation force of the output shaft on the j th universal joint; F j i n ( j = 1 , 2 , 3 ) is the excitation force of the input shaft on the j th universal joint; θ i ( i = 1 , 2 , 3 ) is the angular displacement of the drive shaft; α 2 is the angle of the second universal joint.
The forces excited by the additional torques of the universal joint can be acquired with,
F j o u t = T j o u t L j F j i n = T j i n L j
where T j o u t ( j = 1 , 2 , 3 ) is the torque of the output shaft on the j th universal joint; T j i n ( j = 1 , 2 , 3 ) is the torque of the input shaft on the j th universal joint; L j ( j = 1 , 2 , 3 ) is the distance between the j th universal joint and the intermediate support.
The vibration of the transmission system is affected by four additional torques, including the additional torques T 1 o u t , T 2 i n , T 2 o u t , and T 3 i n ,
T 1 o u t = T 1 cos θ 1 sin α 1 1 + sin 2 θ 1 tan 2 α 1 T 2 i n = T 2 sin θ 2 tan α 2 T 2 o u t = T 2 cos θ 2 sin α 2 1 + sin 2 θ 2 tan 2 α 2 T 3 i n = T 3 sin θ 3 tan α 3
where α 1 , α 2 , and α 3 are the angles of the first, second, and third universal joints, respectively.
According to Equation (8), the additional torques T 1 o u t , T 2 i n , T 2 o u t , and T 3 i n are also affected by the angular displacements θ i of the drive shaft, so it is necessary to investigate the torsional vibration of the drive shaft. Taking the second universal joint as an example, as there is an angle α 2 between the intermediate drive shaft and the main drive shaft presented in Figure 2, the input angular displacement θ 4 of the main drive shaft is different from the output angular displacement θ 3 of the intermediate drive shaft,
tan θ 3 = tan θ 4 cos α 2
By modifying Equation (9), the angular displacement θ 4 can be described as,
θ 4 = arctan tan θ 3 cos α 2
By taking the derivation of Equation (10), the output angular velocity θ ˙ 4 of the second universal joint can be acquired,
θ ˙ 4 = cos α 2 1 + cos 2 α 2 2 1 cos 2 α 2 2 cos 2 θ 3 θ ˙ 3
Two parameters A and B are introduced here to simplify Equation (11),
A = 1 + cos 2 α 2 2 cos α 2 B = 1 cos 2 α 2 2 cos α 2
Then, Equation (11) can be simplified as,
θ ˙ 4 = 1 A B cos 2 θ 3 θ ˙ 3
Similarly, the output angular velocity θ ˙ 2 of the first universal joint can be acquired with,
θ ˙ 2 = 1 C D cos 2 θ 1 θ ˙ 1
where C = 1 + cos 2 α 1 2 cos α 1 , D = 1 cos 2 α 1 2 cos α 1 .
At the same time, the output angular velocity θ ˙ 6 of the third universal joint can be expressed as,
θ ˙ 6 = 1 E F cos 2 θ 5 θ ˙ 5
where E = 1 + cos 2 α 3 2 cos α 3 , F = 1 cos 2 α 3 2 cos α 3 .
In addition, by taking the derivation of Equation (11), the angular acceleration θ ¨ 4 can be acquired with,
θ ¨ 4 = 1 A B cos 2 θ 3 θ ¨ 3 2 B sin 2 θ 3 ( A B cos 2 θ 3 ) 2 θ ˙ 3 2
Similarly, the output angular acceleration θ ¨ 2 of the first universal joint can be acquired with,
θ ¨ 2 = 1 C D cos 2 θ 1 θ ¨ 1 2 D sin 2 θ 1 ( C D cos 2 θ 1 ) 2 θ ˙ 1 2
At the same time, the output angular acceleration θ ¨ 6 of the third universal joint can be expressed as,
θ ¨ 6 = 1 E F cos 2 θ 5 θ ¨ 5 2 F sin 2 θ 5 ( E F cos 2 θ 5 ) 2 θ ˙ 5 2
As the frictions of bearings in the universal joints and the intermediate support are negligible, the relationship between the torques of the input shaft T 3 and the output shaft T 4 can be expressed as,
T 3 θ ˙ 3 = T 4 θ ˙ 4
By substituting Equation (13) into Equation (19), the output shaft T 4 can be acquired with,
T 4 = ( A B cos 2 θ 3 ) T 3
Similarly, the output torque T 2 of the first universal joint can be expressed as,
T 2 = ( C D cos 2 θ 1 ) T 1
At the same time, the output torque T 6 of the third universal joint can be acquired with,
T 6 = ( E F cos 2 θ 5 ) T 5

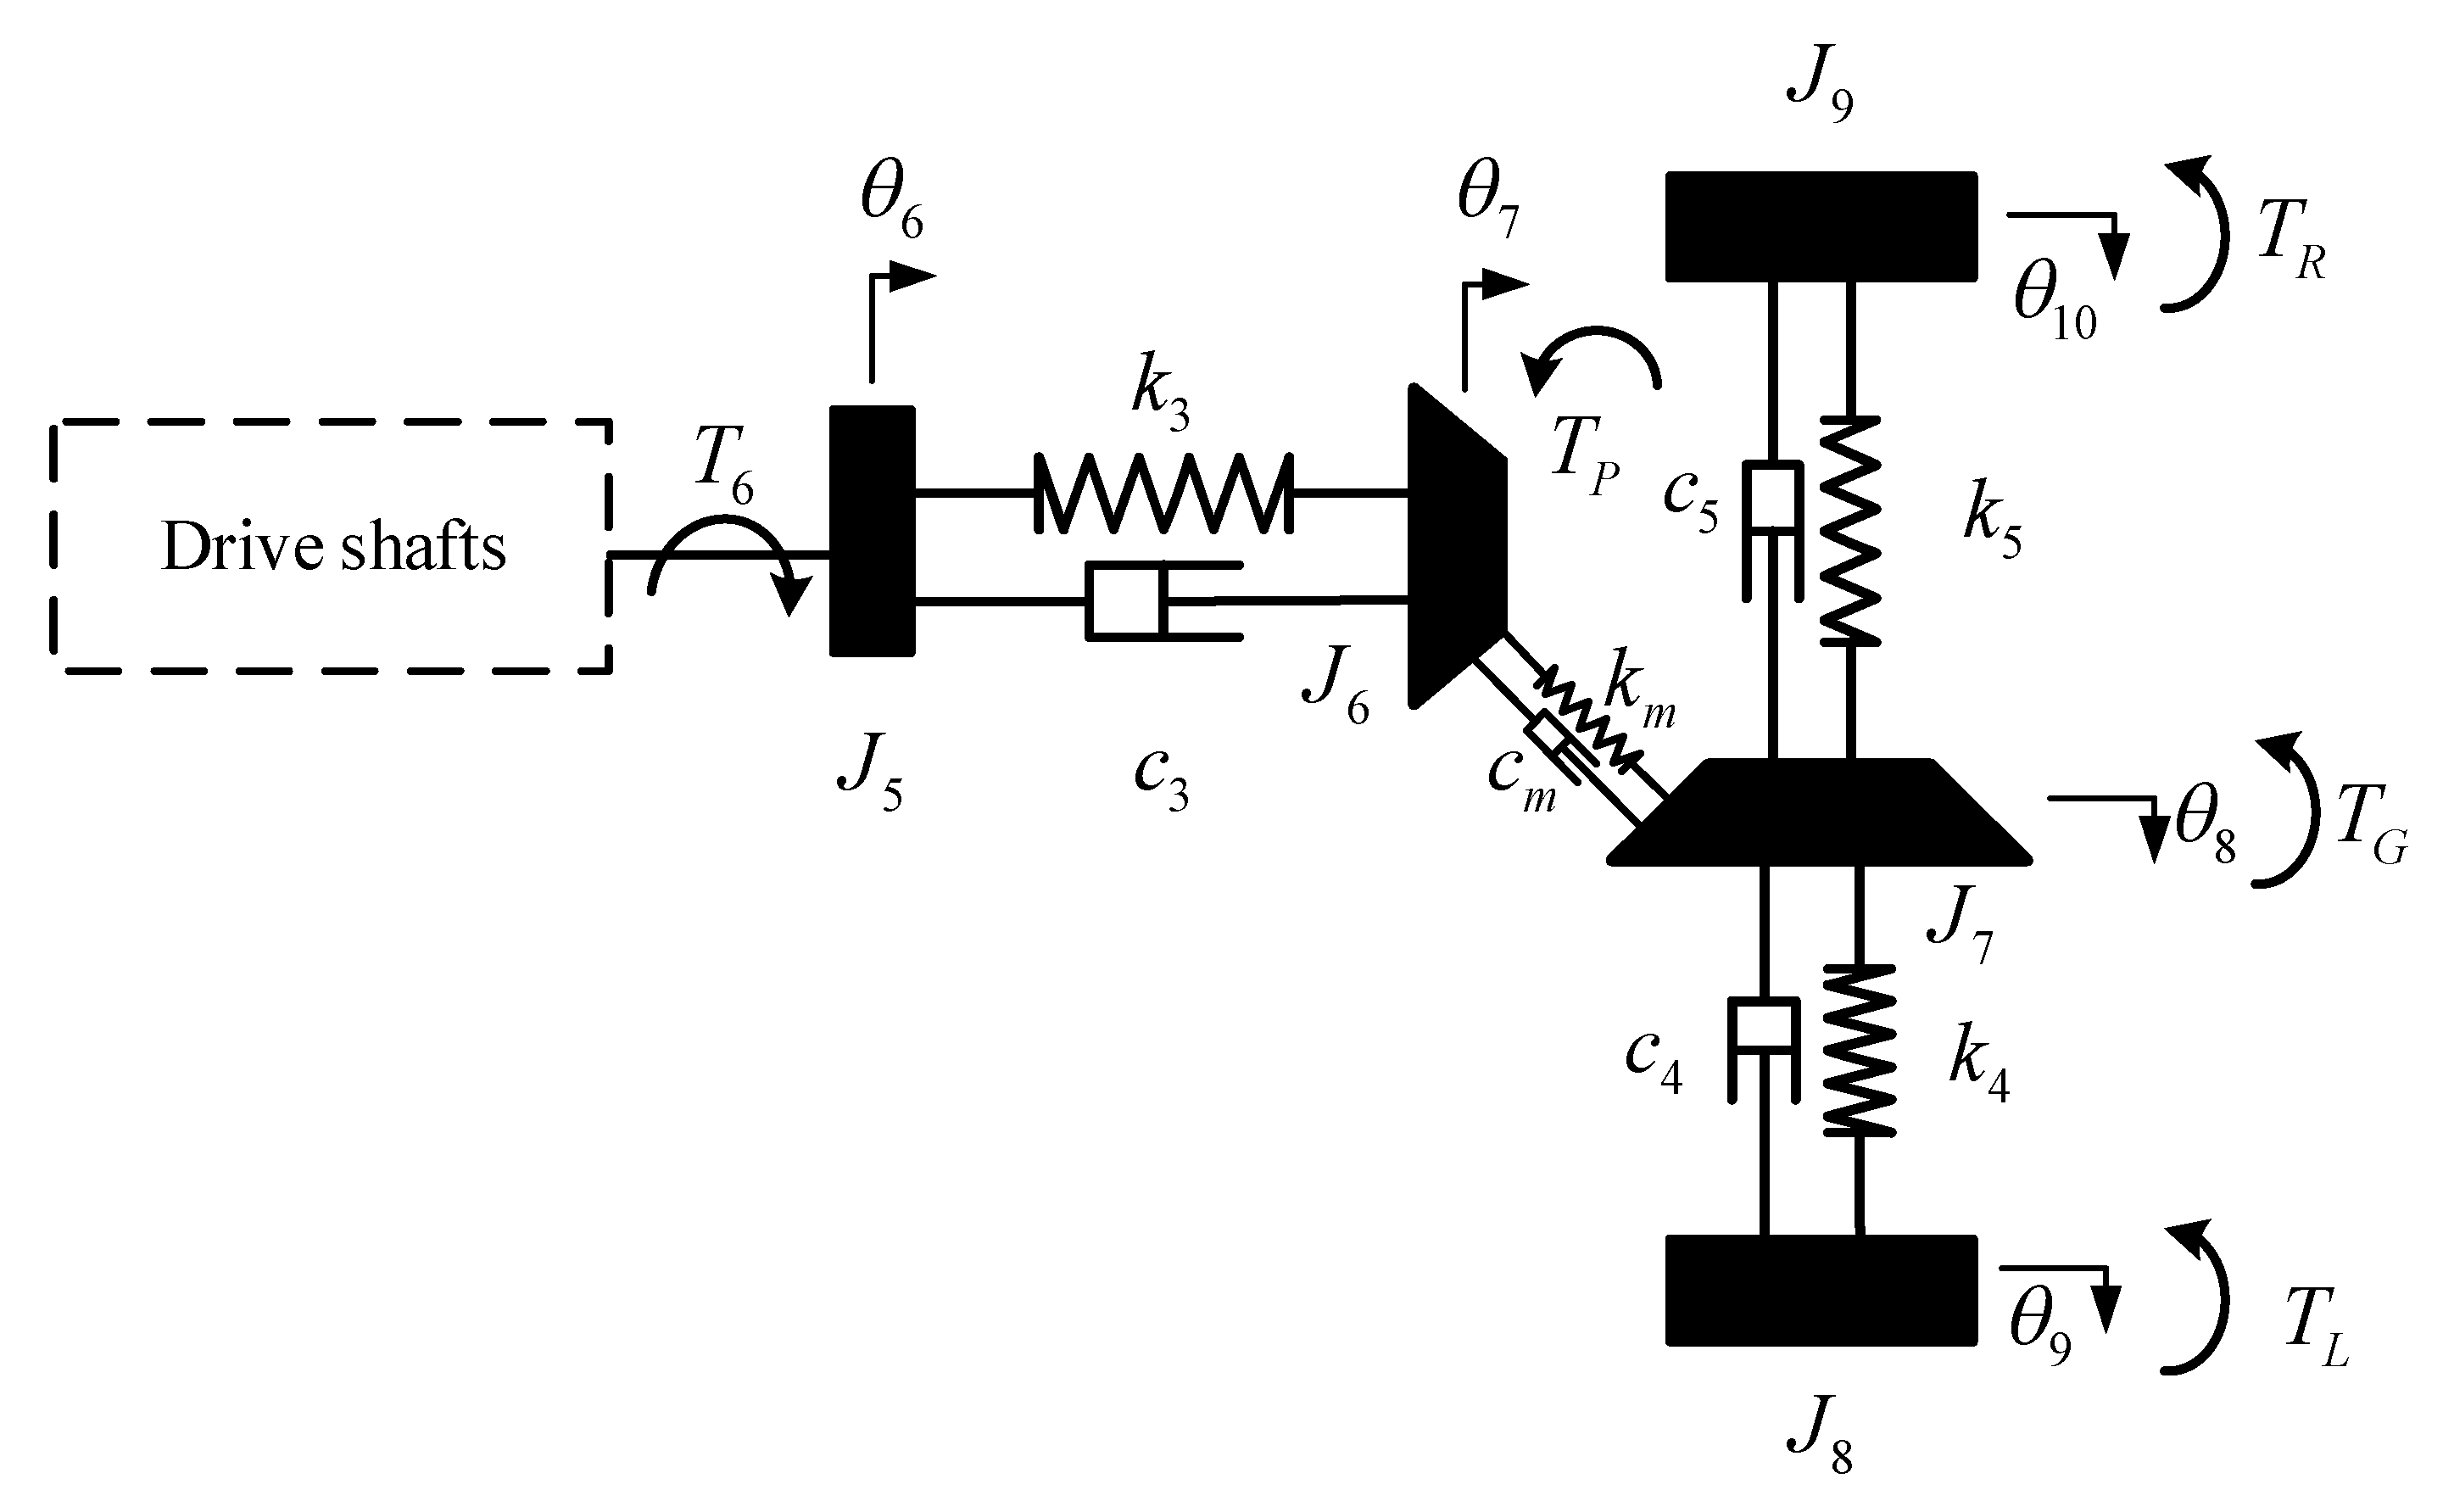
2.1.2. Mathematical Model of Rear Axle

The rear axle consists of the main reducer, the half axle, and the axle housing, and its vibration mainly includes the coupled vibration of the main reducer and the torsional vibration of the half axle. The vibration model of the rear axle is presented in Figure 4.
The mathematical model of the rear axle in Figure 4 can be expressed as [6],
J 5 θ ¨ 6 + c 3 ( θ ˙ 6 θ ˙ 7 ) + k 3 ( θ 6 θ 7 ) = T 6 J 6 θ ¨ 7 + c 3 ( θ ˙ 7 θ ˙ 6 ) + k 3 ( θ 7 θ 6 ) = T P J 7 θ ¨ 8 + c 4 ( θ ˙ 8 θ ˙ 9 ) + k 4 ( θ 8 θ 9 ) + c 5 ( θ ˙ 8 θ ˙ 10 ) + k 5 ( θ 8 θ 10 ) = T G J 8 θ ¨ 9 + c 4 ( θ ˙ 9 θ ˙ 8 ) + k 4 ( θ 9 θ 8 ) = T L J 9 θ ¨ 10 + c 5 ( θ ˙ 10 θ ˙ 8 ) + k 5 ( θ 10 θ 8 ) = T R
where T L and T R are the equivalent load torques of the left and right wheels; T P and T G are the equivalent torques of the pinion and gear; k 3 , k 4 , and k 5 are the equivalent torsional stiffness of the pinion shaft, the left half shaft, and the right half shaft; c 3 , c 4 , and c 5 are the equivalent torsional damping of the pinion shaft, the left half shaft, and the right half shaft, respectively.
As an important part of rear axle assembly, the function of the main reducer is to reduce the rotation speed and increase the torque of the motor. However, coupled vibration is generated during the meshing process of the main reducer, so it is necessary to analyze the vibrations of the main reducer. The coupled vibration model of the main reducer is developed as shown in Figure 5a [6], and the contact force of the pinion is presented in Figure 5b.
In the model, the main reducer is equivalent to mass and the moment of inertia, while the shaft is considered a massless rigid body and the bearing is considered as the massless spring and damping. R 1 and R 2 are the radii of the pitch circle of the pinion and gear at the meshing point; θ P and θ G are the torsional angular displacements of the pinion and gear.
As presented in Figure 5b, F n is the normal meshing force of the pinion [15]; F X , F Y , and F Z are the meshing forces of the pinion in the X , Y , and Z directions,
F n = k m ( t ) f ( x n ) + c m x ˙ n F X = F n cos α n sin β 1 cos δ 1 + F n sin α n sin δ 1 F Y = F n cos α n sin β 1 sin δ 1 F n sin α n cos δ 1 F Z = F n cos α n cos β 1
where α n is the average pressure angle of the pinion; β 1 is the average spiral angle of the pinion; δ 1 is the pitch cone angle of the pinion; k m ( t ) is the gear pair meshing stiffness function [16],
k m ( t ) = k m + i = 1 N k A i cos ( i w n t + φ k )
where k m is the mean value of meshing stiffness; k A i is the fluctuation amplitude of the i th order meshing stiffness; w n is the mesh frequency; φ k is the initial phase.
The c m in Equation (24) is the average damping of the main reducer that can be calculated with [17],
c m = 2 ξ k m 1 / m P + 1 / m G
where ξ is the meshing damping coefficient of the gear pair, whose value is between 0.03 and 0.17; m P and m G are the masses of pinion and gear, respectively.
The f ( x n ) in Equation (24) is the backlash function of the gear pair that can be calculated with [18],
f ( x n ) = x n b , x n > b 0 , b x n b x n + b , x n < b
where b represents half of the backlash; x n is the relative displacement between two gears in the normal direction of the meshing point, which can be expressed as,
x n = cos α n sin β 1 cos δ 1 sin α n sin δ 1 x P x G + cos α n sin β 1 sin δ 1 + sin α n cos δ 1 y P y G + cos α n cos β 1 z P z G + R 1 θ P R 2 θ G e t
where e ( t ) is the transmission error of the gear pair that can be calculated with [19],
e ( t ) = e m + i = 1 N e A i cos ( i w e t + φ e )
where e m is the constant amplitude and its value is set as zero; e A i is the fluctuation amplitude of the i th order; w e is the mesh frequency; φ e is the initial phase.
The corresponding parameters of the main reducer are listed in Table 2.
As presented in Figure 5, the sub-model of the main reducer can be expressed as (see [6]),
m P X x ¨ P + c P X x ˙ P + k P X x P = F X m P Y y ¨ P + c P Y y ˙ P + k P Y y P = F Y m P Z z ¨ P + c P Z z ˙ P + k P Z z P = F Z J 6 θ ¨ P F Z R 1 = T P m G X x ¨ G + c G X x ˙ G + k G X x G = F X m G Y y ¨ G + c G Y y ˙ G + k G Y y G = F Y m G Z z ¨ G + c G Z z ˙ G + k G Z z G = F Z J 7 θ ¨ G + F Z R 2 = T G
where x P , x ˙ P , x ¨ P are the displacement, velocity, and acceleration of the pinion in the X direction; y P , y ˙ P , y ¨ P are the displacement, velocity, and acceleration of the pinion in the Y direction; z P , z ˙ P , z ¨ P are the displacement, velocity, and acceleration of the pinion in the Z direction; m P X , m P Y , and m P Z are the equivalent masses of the pinion in three directions; m G X , m G Y , and m G Z are the equivalent masses of the gear in three directions; c P X , c P Y , and c P Z are the equivalent damping of the pinion supporting bearing in three directions; c G X , c G Y , and c G Z are the equivalent damping of the gear supporting bearing in three directions; k P X , k P Y , and k P Z are the equivalent stiffness of the pinion supporting bearing in three directions; k G X , k G Y , and k G Z are the equivalent stiffness of the gear supporting bearing in three directions.
According to the definition of bearing stiffness, the radial stiffness k r and axial stiffness k a of bearing can be expressed as [8],
k r = 7.253 l 1 0.8 Z 0.9 cos 2 α β F a 0 0.1 sin 0.1 α β k a = 29.011 l 1 0.8 Z 0.9 sin 1.9 α β F a 0 0.1
where l 1 is the nominal contact length of the roller; Z is the number of rolling elements; α β is the contact angle of bearing; and F a 0 is the axial preloading force.
At the same time, the damping of the bearing c b can be expressed as,
c b = c r 1 c r 2 c r 1 + c r 2
where c r 1 is the radial damping between the tapered roller and the bearing inner ring; c r 2 is the radial damping between the tapered roller and the bearing outer ring.
The pinion and gear of the main reducer are supported by two bearings, respectively, and the equivalent stiffness of the main reducer k P j , k G j ( j = X , Y , Z ) is given by [20],
k P X = k P 1 X 2 + k P 2 X 2 k P Y = k P 1 Y 2 + k P 2 Y 2 k P Z = k P 1 Z 2 + k P 2 Z 2 k G X = k G 1 X 2 + k G 2 X 2 k G Y = k G 1 Y 2 + k G 2 Y 2 k G Z = k G 1 Z 2 + k G 2 Z 2
where k P 1 X , k P 2 X are the axial stiffness of the pinion supporting bearing; k G 1 Y , k G 2 Y are the axial stiffness of the gear supporting bearing, which can be calculated by the second formula of Equation (31); at the same time, k P 1 Y , k P 2 Y , k P 1 Z , k P 2 Z are the radial stiffness of the pinion supporting bearing, and k G 1 X , k G 2 X , k G 1 Z , k G 2 Z are the radial stiffness of the gear supporting bearing, which can be calculated by the first formula of Equation (31).
Similarly, the equivalent damping c P j , c G j ( j = X , Y , Z ) can be expressed as,
c P X = c P 1 X 2 + c P 2 X 2 c P Y = c P 1 Y 2 + c P 2 Y 2 c P Z = c P 1 Z 2 + c P 2 Z 2 c G X = c G 1 X 2 + c G 2 X 2 c G Y = c G 1 Y 2 + c G 2 Y 2 c G Z = c G 1 Z 2 + c G 2 Z 2
where c P 1 X , c P 2 X are the axial stiffness of the pinion supporting bearing; c G 1 Y , c G 2 Y are the axial stiffness of the gear supporting bearing; c P 1 Y , c P 2 Y , c P 1 Z , c P 2 Z are the radial stiffness of the pinion supporting bearing; and c G 1 X , c G 2 X , c G 1 Z , c G 2 Z are the radial stiffness of the gear supporting bearing, which can be calculated by Equation (32). These values are listed in Table 3.

2.2. Experimental Method

As shown in Figure 6, a test rig of an automobile transmission system driven by a motor and two magnetic powder brake devices was developed in a semi-anechoic chamber to measure the vibration responses.
The configuration of the test rig is shown in Figure 7, in which the speed of the motor is measured by the speed sensor and the vibrations of the transmission system are measured by the acceleration sensors 1 and 2.
In particular, the placement methods of the speed sensor and acceleration sensors are shown in Figure 7. Acceleration sensors 1 and 2 are placed in the horizontal and vertical directions of the intermediate support, respectively. The corresponding values for relevant parameters of the test rig are listed in Table 4.

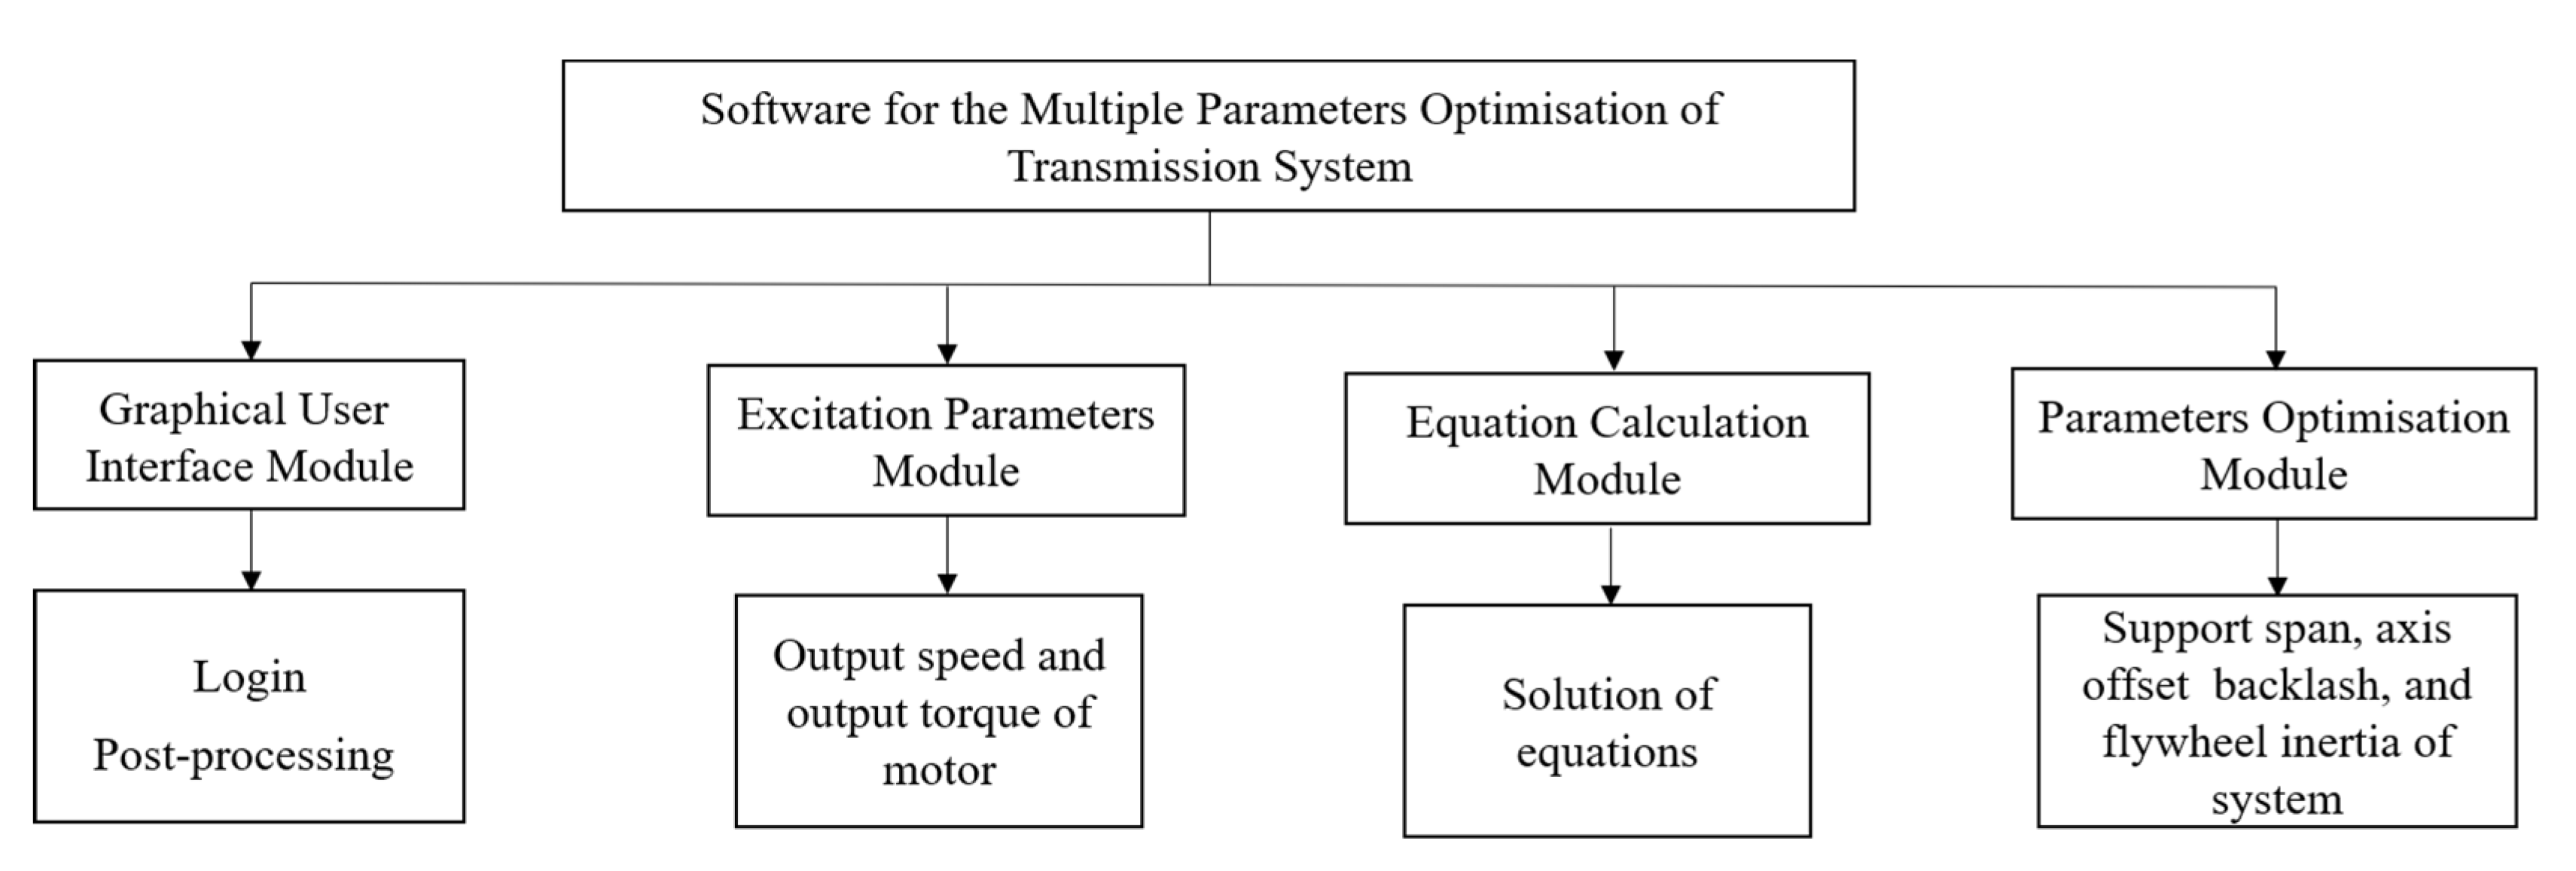
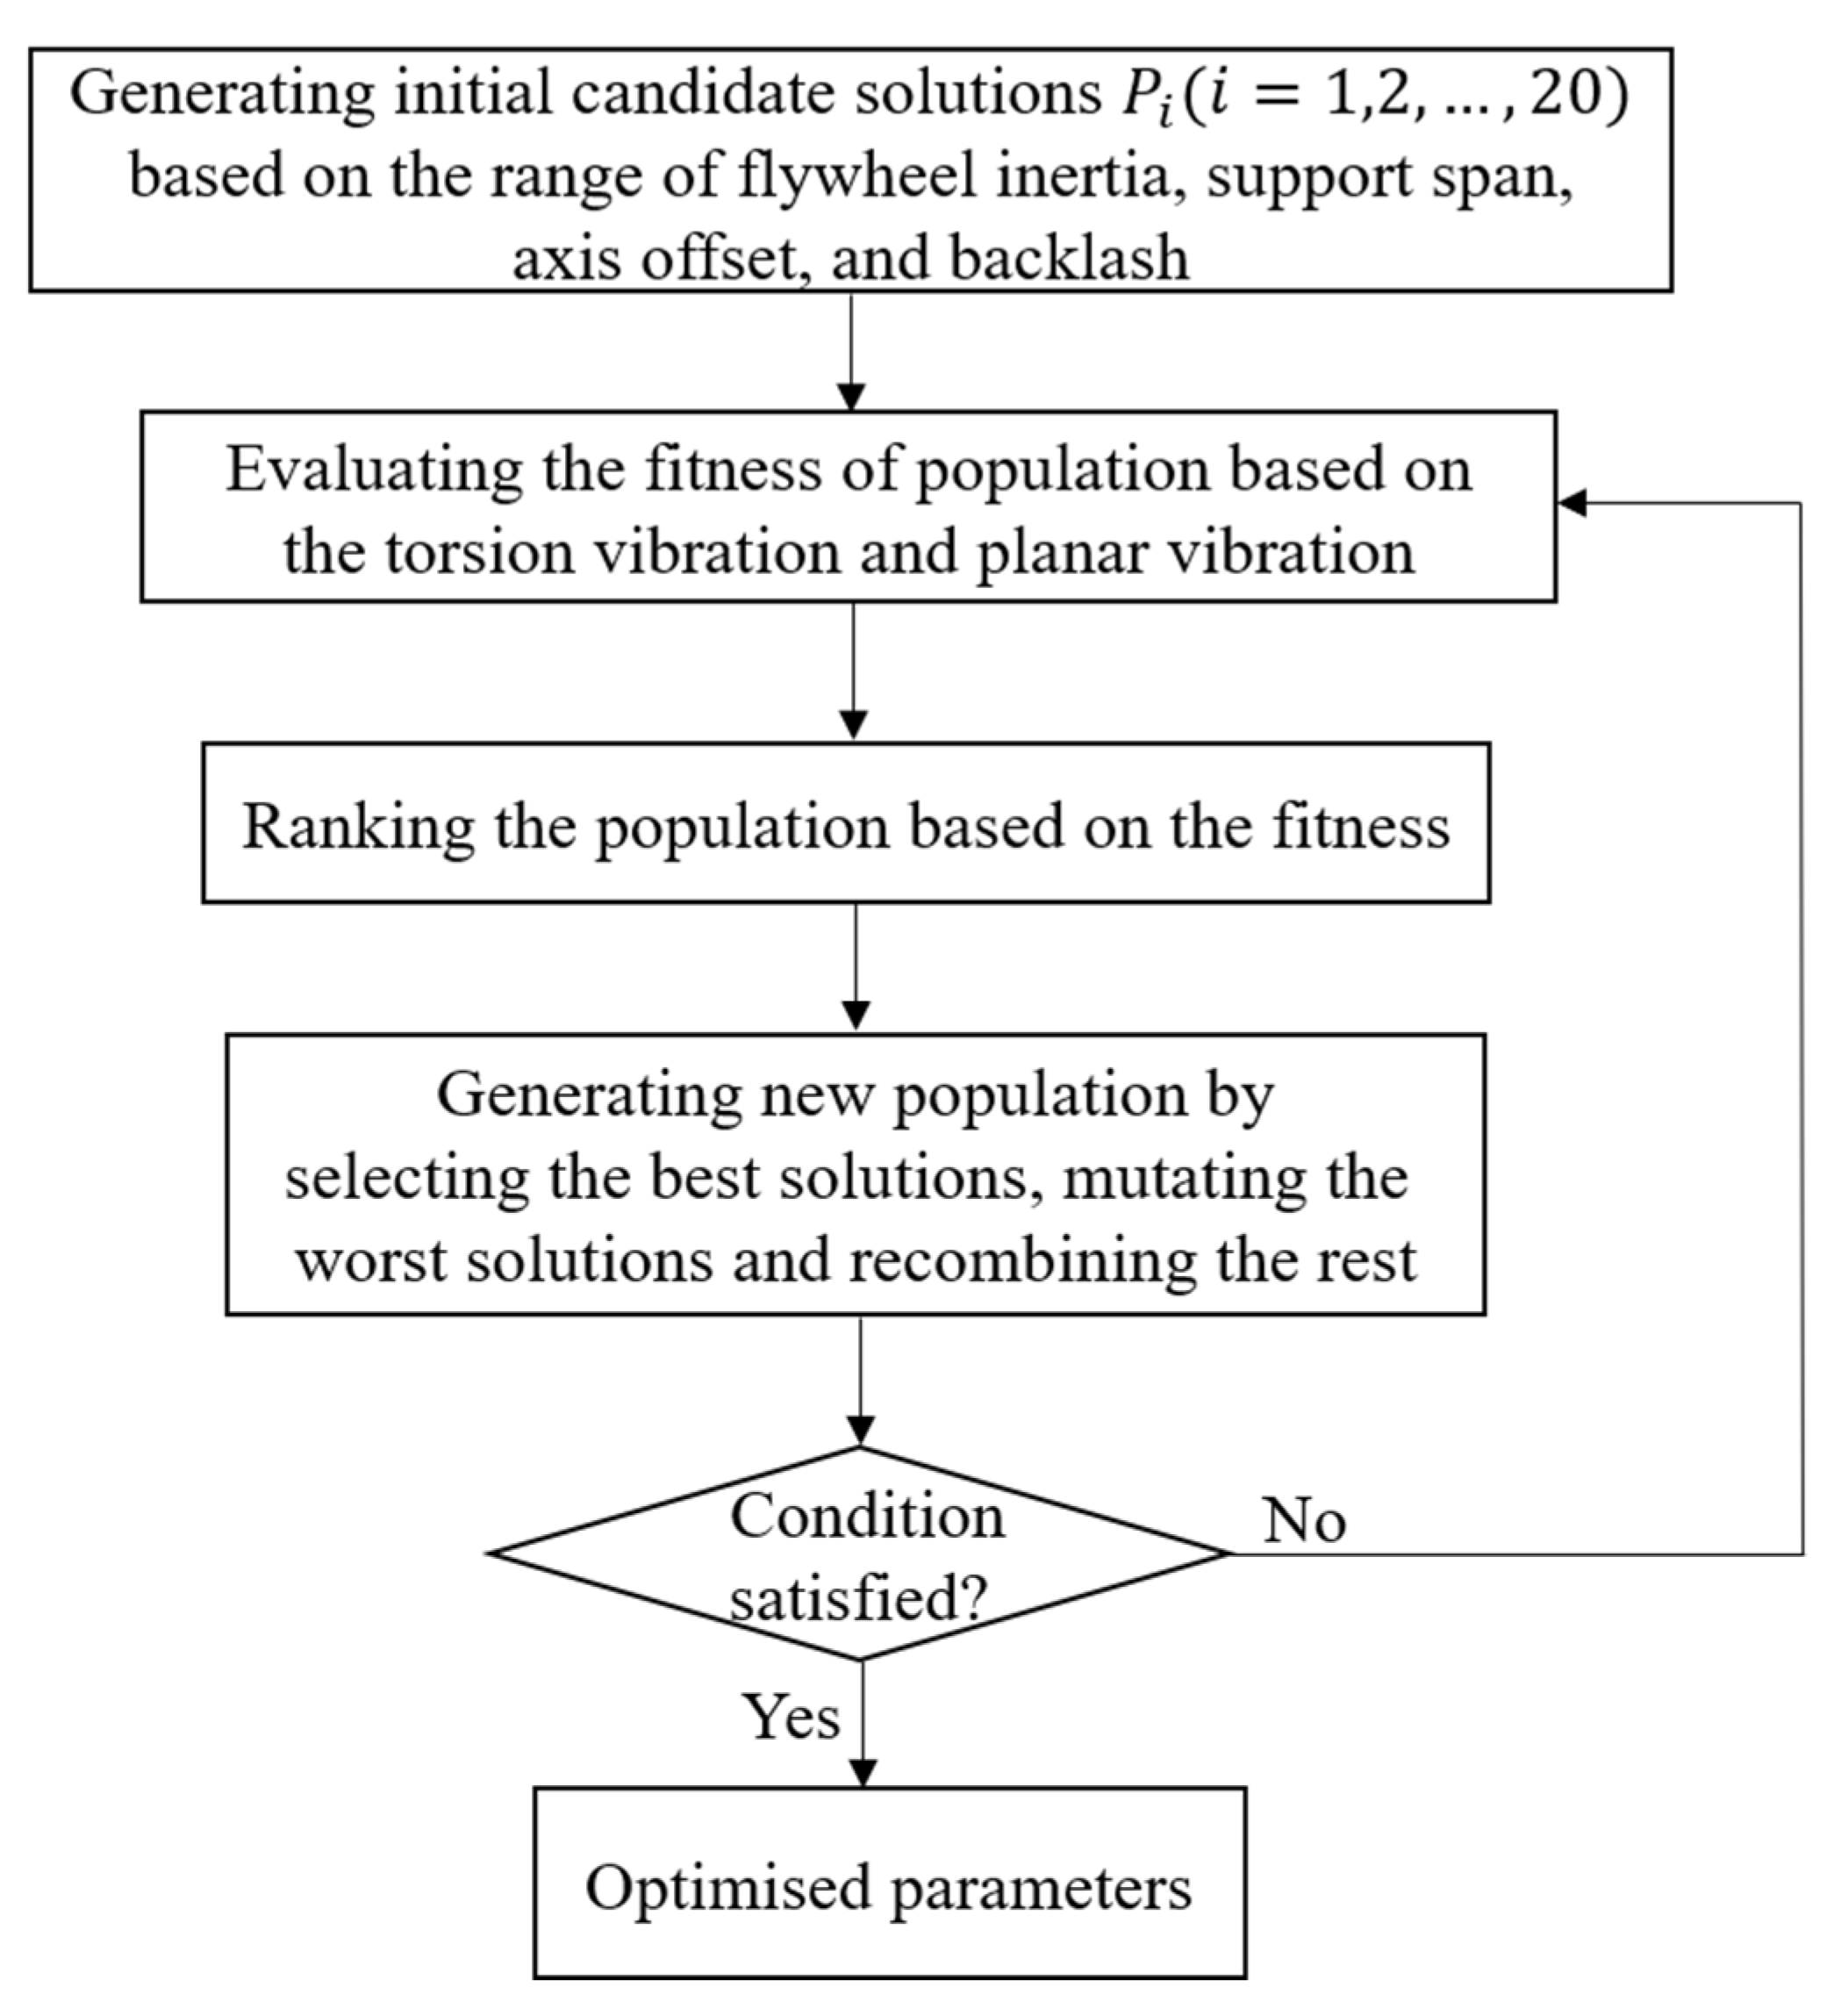
2.3. Optimization Design

The vibration of a transmission system is affected by different parameters, and the parameters can affect each other. Therefore, software for the multiple-parameter optimization of a transmission system was developed based on the genetic algorithm, as shown in Figure 8.
The software consists of a graphical user interface module, an excitation parameters module, an equation calculation module, and a parameter-optimization module. The graphical user interface module mainly includes a login interface and a post-processing interface; the excitation parameters module is used to set the output speed and torque of the motor; the equation calculation module is mainly used for the solving of mathematical equations of the mathematical model developed in this research; the parameter-optimization module is used for the optimization of the four parameters of the transmission system based on the genetic algorithm, and the specific optimization process is presented in Figure 9.
The flow chart of the parameter-optimization module using the genetic algorithm is shown in Figure 9. The parameters of flywheel inertia, support span, axis offset, and backlash to be optimized are firstly coded into candidate solutions P i ( i = 1 , 2 , , 20 ) , and the initial population is formed according to the range of optimization variables. Then, the fitness of candidate solutions in the population to torsion vibration and planar vibration is evaluated, and the population is ranked based on the fitness. In order to generate a new population, the best solutions are directly transferred to the next generation and the worst solutions are mutated, while the rest are recombined by crossover. Finally, the optimized parameters are acquired when the termination condition is satisfied. The detailed optimization process of using the genetic algorithm based on the mathematical model is illustrated in Section 4.

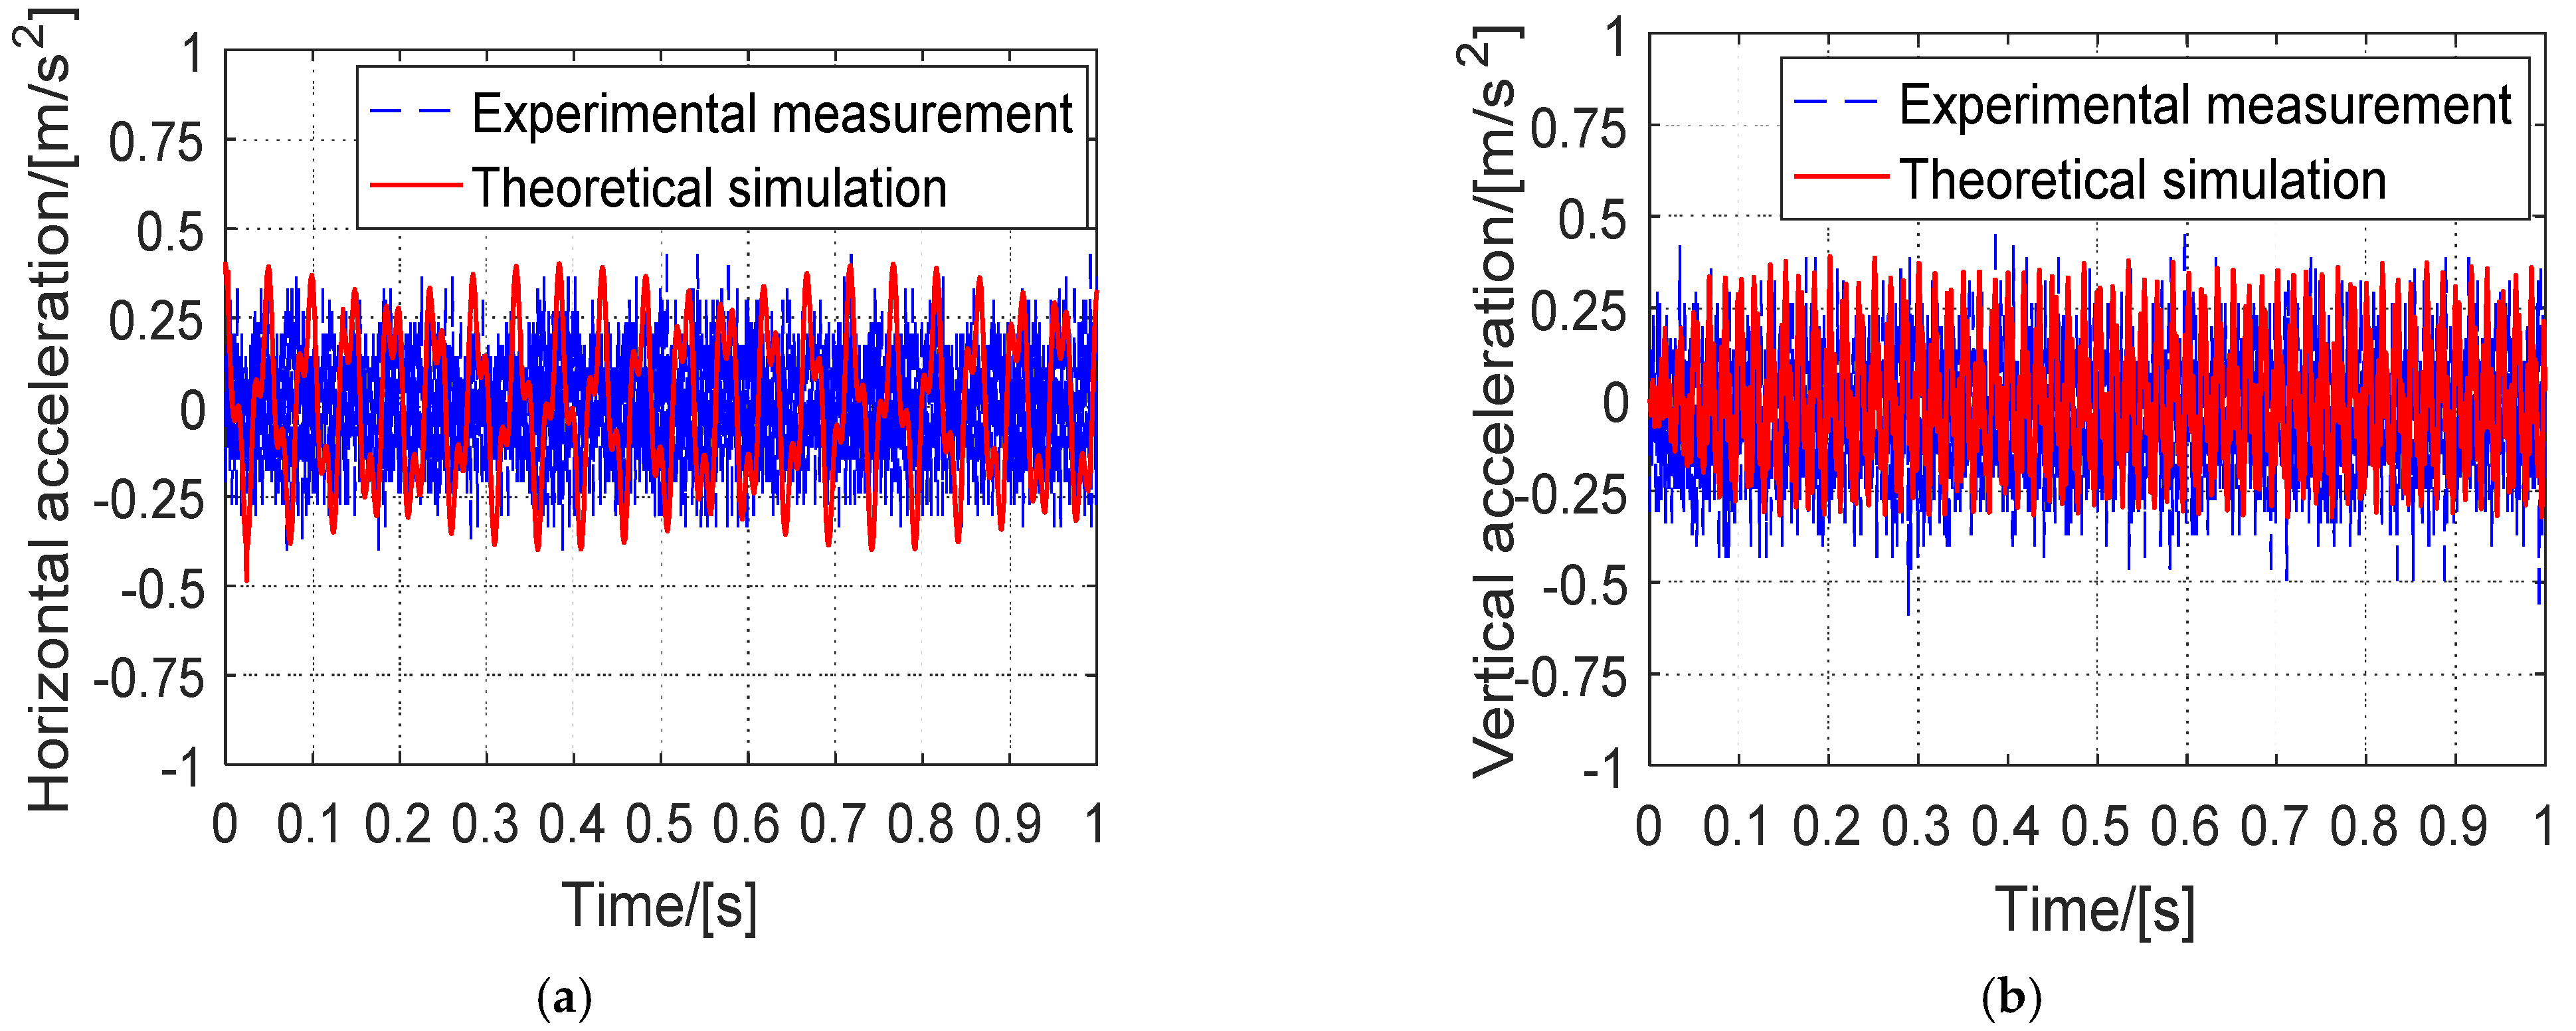
3. Simulations and Experimental Measurements

When the output torque of the motor is 50 N·m and the output speed is 1500 RPM, the vibration responses of the intermediate support are simulated based on the mathematical model. In order to verify the mathematical model, the vibration responses of the intermediate support are measured using the test rig presented in Figure 6, and the results of horizontal and vertical accelerations from both model simulation and experimental measurement are presented in Figure 10a,b, respectively.
As can be seen in Figure 10, the simulation results correlate well with the measured results. It seems that the mathematical model is effective in analyzing the transmission model of automobiles, so the model developed in this research can be applied to optimize the design of transmission system based on the vibration responses of transmission system.

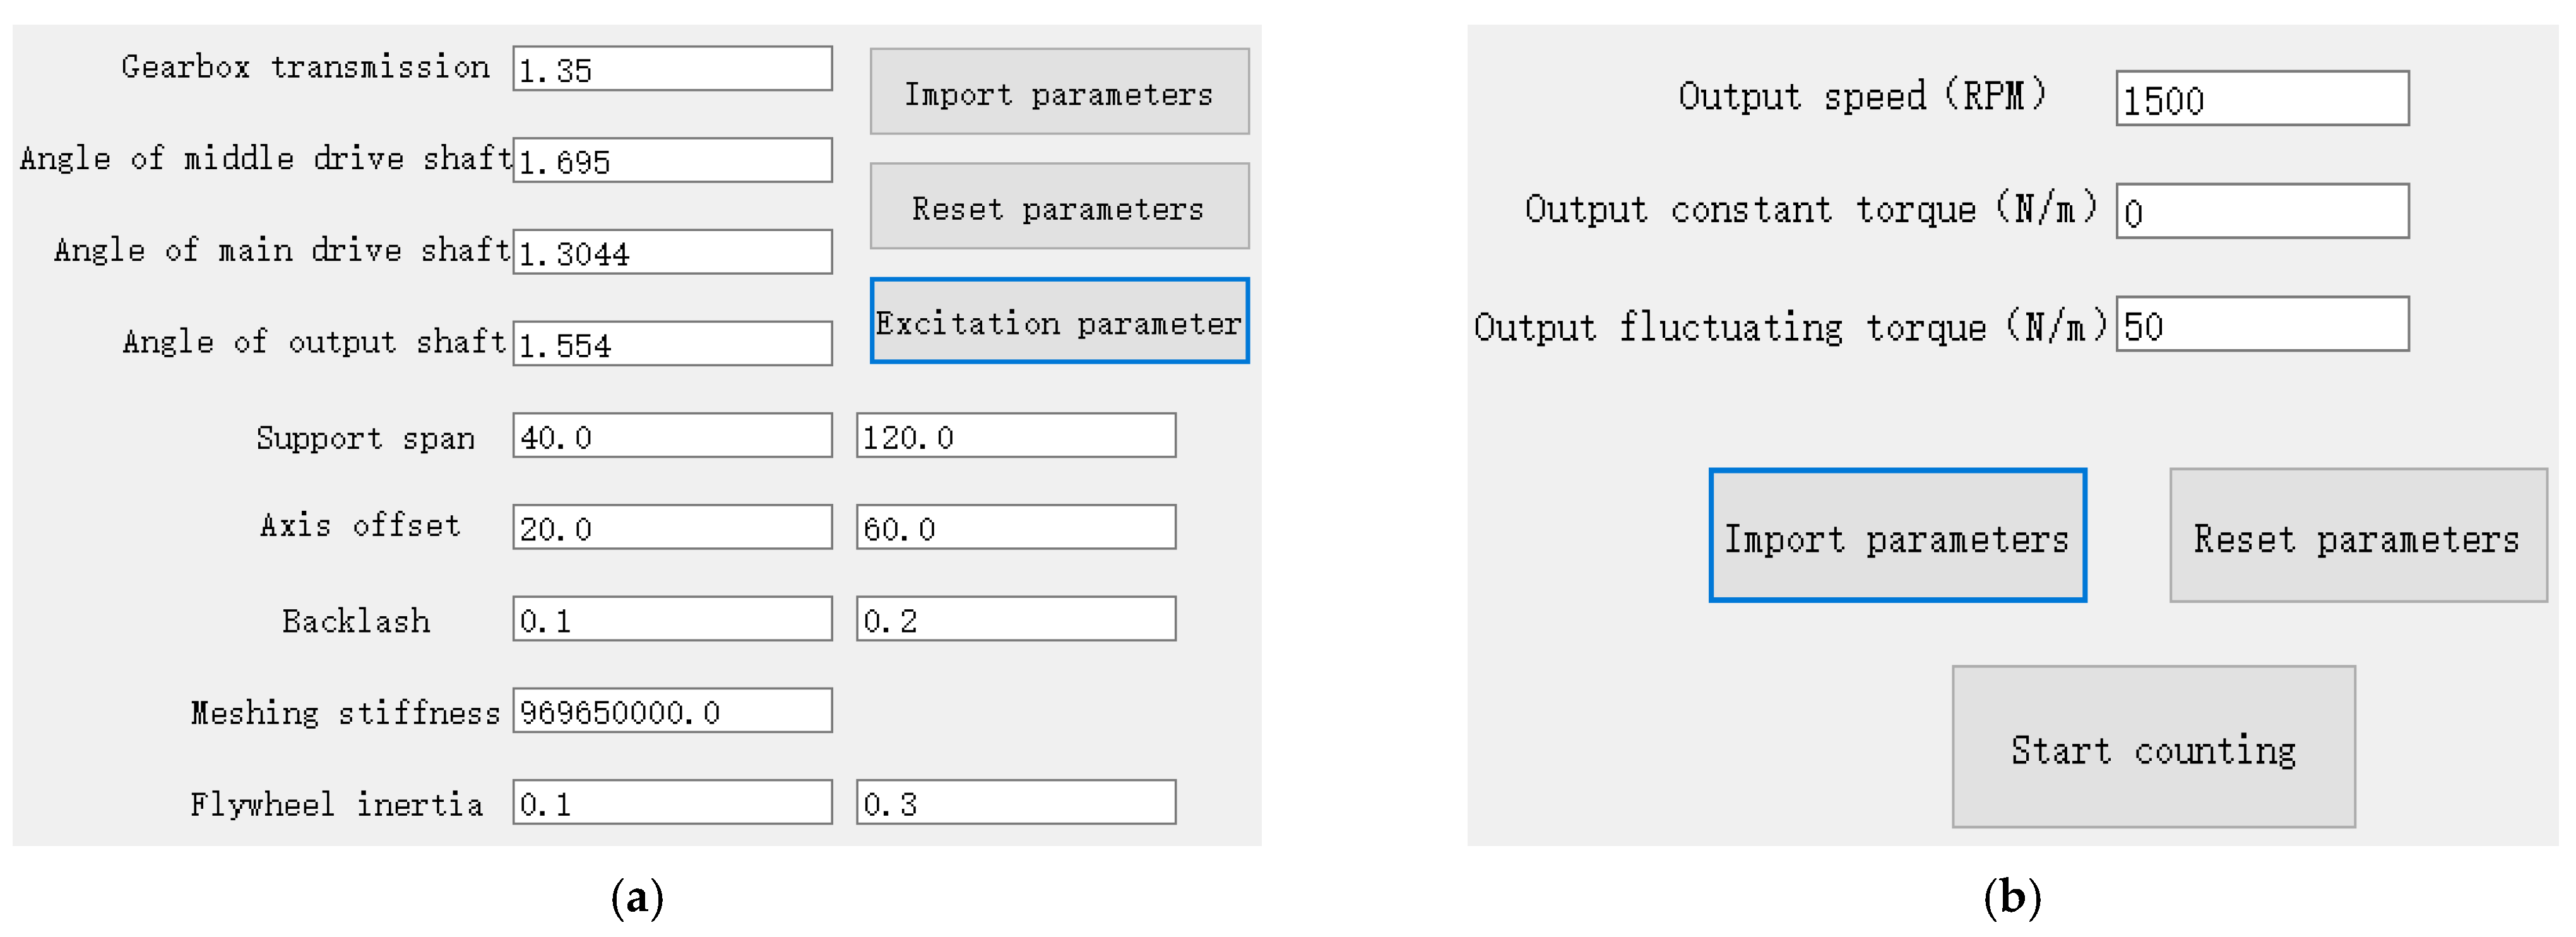
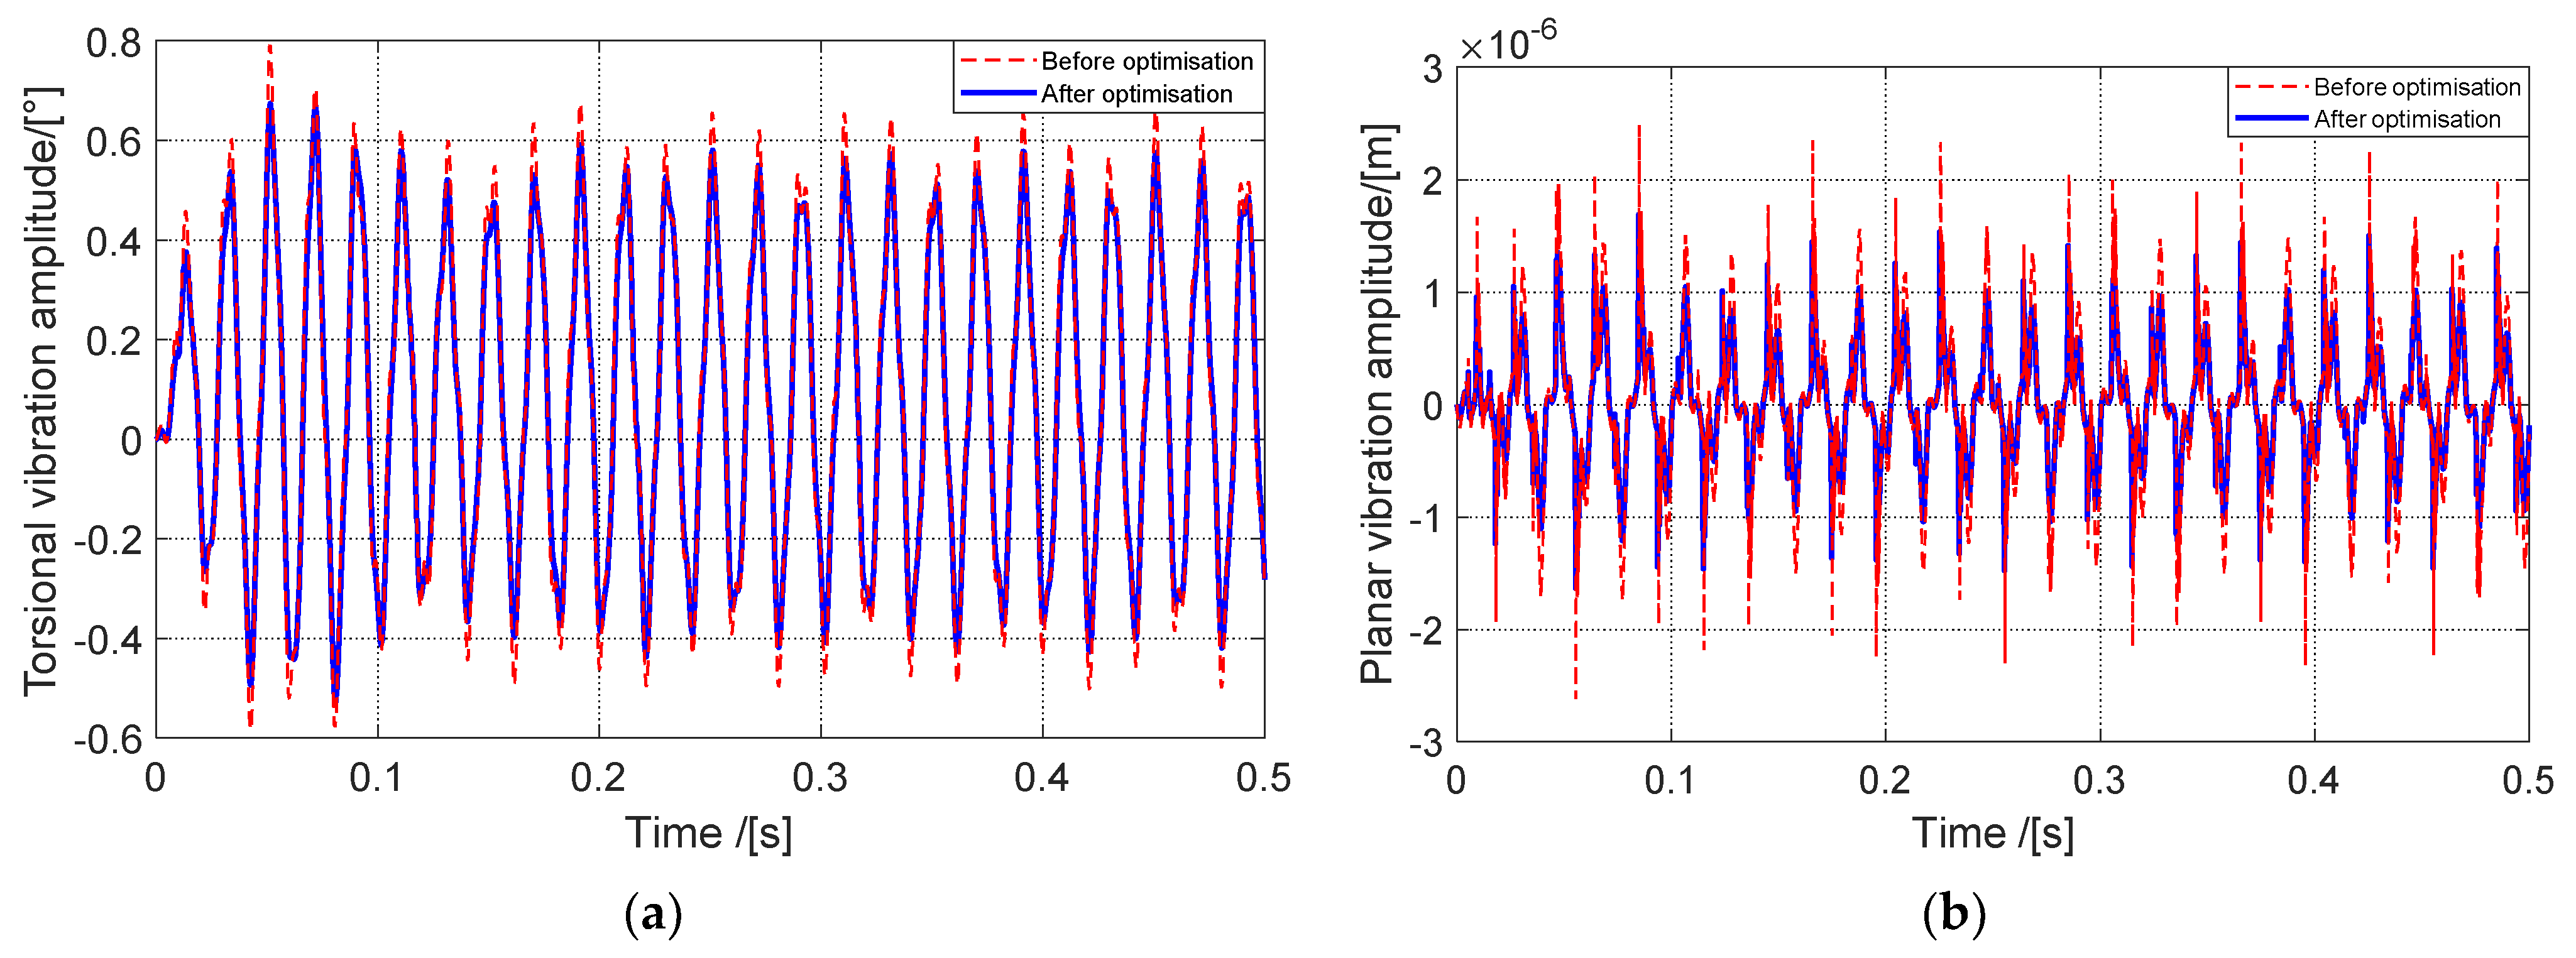
4. Optimization Based on the Mathematical Model

Since the vibration of transmission system is affected by different parameters, and the multiple parameters can also affect each other, it is necessary to introduce an intelligent optimization algorithm to optimize the transmission system with multiple parameters, which can be expressed as,
F ( x ) = min F 1 ( x ) , F 2 ( x ) , , F d ( x ) , , F n ( x ) X = x 1 , x 2 , , x d , , x n x d min x d x d max
where x d is the parameters of optimization, including flywheel inertia, support span, axis offset and backlash; X is the set of optimization parameters; F ( x ) is the set of target functions, including the torsion vibration and planar vibration of the system; x d min and x d max are the upper and lower limits of the parameters listed in Table 5.
Furthermore, intelligent design software was developed based on the intelligent optimization algorithm for the multiple-parameter optimization of the transmission system. The optimization parameters interface developed in this research is shown in Figure 11a, in which the ranges of the support span, axis offset, backlash, and flywheel inertia are set according to Table 5. The excitation parameters interface presented in Figure 11b is used to set the output speed, output constant torque, and output fluctuating torque of the motor.
Based on the developed model, these four parameters of the transmission system are optimized using the genetic algorithm. In particular, the torsion vibration results before and after the optimization of the main reducer are presented in Figure 12a, and the planar vibration results before and after the optimization of the main reducer are shown in Figure 12b.
It can be seen from Figure 12a that after 14 iterations, the torsional vibration amplitudes of the main reducer are the minimum, the value of which is 0.32°; while Figure 12b shows that after 14 iterations, the planar vibration amplitudes of the main reducer are the minimum, the value of which is 4.75 × 10⁻⁷ m. Under this condition, the flywheel inertia after optimization is 0.2959 kg·m2, the support span is 119.92 mm, the axis offset is 56.9 mm, and the backlash is 0.1 mm, respectively.
The optimized results are fed into the model for simulation, and the results of torsion vibration before and after optimization are acquired, as shown in Figure 13a; the planar vibration before and after the optimization results are shown in Figure 13b.
It can be seen in Figure 13 that after the multiple-parameter optimization, the torsion vibration and planar vibration amplitudes of the main reducer are reduced, indicating that the intelligent design method can be used to optimize the automobile transmission system based on its vibration response.

5. Conclusions

In this research, a mathematical model of transmission system, including the coupled vibration between the drive shaft and the main reducer, is developed. Using this model, the horizontal and vertical vibration responses of transmission system are simulated. In order to verify the mathematical model, a test rig was developed to measure the vibration responses of a transmission system, and the measurement results were compared with the simulation results, showing that the vibration amplitudes were mainly between −0.5 and 0.5 m/s2 and the simulation results correlated well with the measured results. Therefore, the mathematical model for the automobile transmission system can be used to investigate the coupled vibration between the drive shaft and the main reducer. Currently, the vibration responses of automobile transmission system under a single parameter have been studied; however, the vibration responses of automobile transmission system are affected by multiple parameters, and these parameters can affect each other. Therefore, an intelligent optimization algorithm has been developed in this research to optimize multiple parameters of automobile transmission system based on the mathematical model and experimental analysis. For the convenience of analysis, software has also been developed based on the intelligent optimization algorithm, and the results of multiple-parameter optimization were acquired. The results show that the vibration amplitudes of the system can be reduced when the optimized results are applied, indicating that the intelligent design method developed in this research can provide an efficient method for the rapid design of transmission system. Furthermore, this might also provide a reference for the intelligent design of other similar components.

Author Contributions

Conceptualization, X.L., D.X. and C.Z.; methodology, X.L., D.X. and C.Z.; investigation, X.L.; software, C.Z.; validation, D.X.; formal analysis, X.L. and D.X.; resources, F.H.; data curation, C.Z. and F.H.; supervision, X.L.; writing—original draft preparation, X.L., D.X. and C.Z.; writing—review and editing, X.L. and D.X. All authors have read and agreed to the published version of the manuscript.

Funding

This research was funded by the National Natural Science Foundation of China, grant numbers 51975436 and 51505352; the Ministry of Industry and Information Technology of the People’s Republic of China, grant number 2159999.

Institutional Review Board Statement

Not applicable.

Informed Consent Statement

Not applicable.

Data Availability Statement

Not applicable.

Acknowledgments

The authors appreciate the funding for this research from the National Natural Science Foundation of China [Grant numbers 51975436, 51505352], and the Ministry of Industry and Information Technology of the People’s Republic of China [Grant number 2159999].

Conflicts of Interest

The authors declare no conflict of interest.

References

  1. Liu, X.G.; Sun, X.R.; Xu, J.L. A case study of intelligent manufacturing for key components of vehicles. In Proceedings of the 4th International Conference on Mechanical, Electric and Industrial Engineering (MEIE2021), Kunming, China, 22–24 May 2021. [Google Scholar]
  2. Tang, X.L.; Zhang, J.W.; Zou, L. Study on the torsional vibration of a hybrid electric vehicle powertrain with compound planetary power-split electronic continuous variable transmission. Proc. Inst. Mech. Eng. Part C J. Mech. Eng. Sci. 2014, 228, 3107–3115. [Google Scholar] [CrossRef]
  3. Feng, H.Y.; Yin, Z.H.; Shangguan, W.B. Analysis and optimization for contact forces and transmission efficiency of an automotive ball joint. Proc. Inst. Mech. Eng. Part D J. Automob. Eng. 2020, 234, 3207–3223. [Google Scholar] [CrossRef]
  4. Zhang, S.Y.; Xu, J.H.; Gou, H.W. A Research Review on the Key Technologies of Intelligent Design for Customized Products. Engineering 2017, 3, 631–640. [Google Scholar] [CrossRef]
  5. Zeng, M.Y.; Tan, B.H.; Ding, F. An experimental investigation of resonance sources and vibration transmission for a pure electric bus. Proc. Inst. Mech. Eng. Part D J. Automob. Eng. 2019, 234, 950–962. [Google Scholar] [CrossRef]
  6. Liu, X.G.; Wu, Z.Y.; Lu, J. Investigation of the effect of rotation speed on the torsional vibration of transmission system. J. Adv. Mech. Des. Syst. Manuf. 2019, 13, JAMDSM0079. [Google Scholar] [CrossRef] [Green Version]
  7. He, L.P.; Xia, C.G.; Chen, S.D. Parametric Investigation of Dual-Mass Flywheel Based on Driveline Start-up Torsional Vibration Control. Shock Vib. 2019, 2019, 3171698. [Google Scholar] [CrossRef]
  8. Zou, L.; Lie, Y.J.; Jia, B. Research on coupled vibrations of driveshaft–rear axle system based on nonlinear hybrid model. J. Vib. Control 2021, 10775463211002628. [Google Scholar] [CrossRef]
  9. Zhang, H.Z.; Yang, X.T.; Sun, X.Q. Optimal Design of Shift Point Strategy for DCT Based on Particle Swarm Optimization. Machines 2021, 9, 196. [Google Scholar] [CrossRef]
  10. Liu, Q.Y.; Zha, Y.W.; Liu, T. Research on Adaptive Control of Air-Borne Bolting Rigs Based on Genetic Algorithm Optimization. Machines 2021, 9, 240. [Google Scholar] [CrossRef]
  11. Hao, Y.D.; He, Z.C.; Li, G.Y. Uncertainty analysis and optimization of automotive driveline torsional vibration with a driveline and rear axle coupled model. Eng. Optim. 2018, 50, 1871–1893. [Google Scholar] [CrossRef]
  12. Li, Y.H.; Zhu, B.; Zhang, N. Parameters optimization of two-speed powertrain of electric vehicle based on genetic algorithm. Adv. Mech. Eng. 2020, 12, 1687814020901652. [Google Scholar] [CrossRef]
  13. Jiang, R.C.; Jin, Z.C.; Liu, D.W. Multi-Objective Lightweight Optimization of Parameterized Suspension Components Based on NSGA-II Algorithm Coupling with Surrogate Model. Machines 2021, 9, 107. [Google Scholar] [CrossRef]
  14. Xu, J.L.; Zhu, J.W.; Wan, L. Effects of intermediate support stiffness on nonlinear dynamic response of transmission system. J. Vib. Control 2020, 26, 851–862. [Google Scholar] [CrossRef]
  15. Cui, T.Q.; Li, Y.N.; Zan, C.L. Dynamic Modeling and Analysis of Nonlinear Compound Planetary System. Machines 2022, 10, 31. [Google Scholar] [CrossRef]
  16. Wang, J.; Lim, T.C.; Li, M.F. Dynamics of a hypoid gear pair considering the effects of time-varying mesh parameters and backlash nonlinearity. J. Sound Vib. 2007, 308, 302–329. [Google Scholar] [CrossRef]
  17. Yi, Y.Y.; Qin, D.T.; Liu, C.Z. Investigation of electromechanical coupling vibration characteristics of an electric drive multistage gear system. Mech. Mach. Theory 2018, 121, 446–459. [Google Scholar] [CrossRef]
  18. Yavuz, S.D.; Saribay, Z.B.; Cigeroglu, E. Nonlinear time-varying dynamic analysis of a spiral bevel geared system. Nonlinear Dyn. 2018, 92, 1901–1919. [Google Scholar] [CrossRef]
  19. Farshidianfar, A.; Saghafi, A. Global bifurcation and chaos analysis in nonlinear vibration of spur gear systems. Nonlinear Dyn. 2013, 75, 783–806. [Google Scholar] [CrossRef]
  20. Li, Y.N.; Li, G.Y.; Zheng, L. Influence of Asymmetric Mesh Stiffness on Dynamics of Spiral Bevel Gear Transmission System. Math. Probl. Eng. 2010, 2010, 124148. [Google Scholar]
Figure 1. Structural model of the transmission system.
Machines 10 00428 g001
Figure 2. Vibration model of the drive shaft.
Machines 10 00428 g002
Figure 3. Forces analysis of the drive shaft.
Machines 10 00428 g003
Figure 4. Vibration model of the rear axle.
Machines 10 00428 g004
Figure 5. Analysis of the main reducer: (a) coupled vibration model of the main reducer; (b) force analysis of pinion.
Machines 10 00428 g005
Figure 6. Assembled test rig in a semi-anechoic chamber.
Machines 10 00428 g006
Figure 7. Configuration of the test rig.
Machines 10 00428 g007
Figure 8. Structure diagram of parameter optimization software for transmission system.
Machines 10 00428 g008
Figure 9. Program flow chart of the genetic algorithm.
Machines 10 00428 g009
Figure 10. Comparison of simulation and measurement results: (a) horizontal acceleration; (b) vertical acceleration.
Machines 10 00428 g010
Figure 11. Results of design: (a) optimization parameters interface; (b) excitation parameters interface.
Machines 10 00428 g011
Figure 12. Results of iteration calculation: (a) torsional vibration of the main reducer; (b) planar vibration of the main reducer.
Machines 10 00428 g012
Figure 13. Comparing the results of before and after optimization: (a) results of torsional vibration; (b) results of planar vibration.
Machines 10 00428 g013
Table 1. Parameters of the drive shaft.
ParametersInertia (Kg·m2)Stiffness (N/m)Damping (N·s/m)
Intermediate drive shaft J 1 = 0.00095 J 2 = 0.00211 k 1 = 51 , 945 c 1 = 1.3
Main drive shaft J 3 = 0.00238 J 4 = 0.00198 k 2 = 30 , 031 c 2 = 1.3
Pinion shaft J 5 = 0.000955 J 6 = 0.0171 k 3 = 651.12 c 3 = 0.44
Table 2. Parameters of the main reducer.
ParametersPinionGear
The number of teeth1041
Pitch cone angle (°)12.7576.50
Average pressure angle (°)21.2521.25
Average spiral angle (°)47.9728.27
Radius of pitch circle (mm)18.871.7
Table 3. Parameters of the pinion and gear.
ParametersStiffness (N/m)Damping (N·s/m)Equivalent Mass (kg)
Pinion k P X 8.6 × 10⁸ c P X 1050 m P X 1.037
k P Y 1.6 × 10⁹ c P Y 1050 m P Y 1.037
k P Z 1.6 × 10⁹ c P Z 1050 m P Z 1.037
Gear k G X 2.8 × 10⁹ c G X 1000 m G X 6.162
k G Y 6.9 × 10⁸ c G Y 1000 m G Y 6.162
k G Z 2.8 × 10⁹ c G Z 1000 m G Z 6.162
Table 4. Parameters of the test rig.
ParametersValues
Output power of motor (kW)160
Rated torque of motor (N·m)509
Rated speed of motor (RPM)2979
Moment of inertia of motor (kg·m2)1.7256
Mass of motor (kg)1105
Input power of reducer (kW)86
Input speed of reducer (RPM)1000
Output speed of reducer (RPM)125
Rated torque of magnetic powder brake (N·m)5000
Sampling frequency of speed sensor (Hz)40,000
Sensitivity of acceleration sensor 1 (pc/s2)4.77
Sensitivity of acceleration sensor 2 (pc/s2)4.94
Mass of flywheel (kg)328
Moment of inertia of flywheel (kg·m2)27
Table 5. Ranges of parameters.
ParametersCurrent ValuesSelection Ranges of Parameters
Flywheel inertia (kg·m2)0.20.1~0.3
Support span (mm)82.540~120
Axis offset (mm)3820~60
Backlash (mm)0.150.1~0.2
Publisher’s Note: MDPI stays neutral with regard to jurisdictional claims in published maps and institutional affiliations.

