Communication

Experimental Study and Numerical Analysis of the Tensile Behavior of 3D Woven Ceramic Composites

1
School of Aeronautic Science and Engineering, Beihang University, Beijing 100191, China
2
ShenYuan Honors College, Beihang University, Beijing 100191, China
*
Author to whom correspondence should be addressed.
Machines 2022, 10(6), 434; https://doi.org/10.3390/machines10060434
Submission received: 10 April 2022 / Revised: 13 May 2022 / Accepted: 27 May 2022 / Published: 1 June 2022
(This article belongs to the Special Issue Dynamic Stability Analysis of Aerospace Structures)

Abstract

:
In this work, the tensile responses of 3D woven quartz fiber silica matrix composites were experimentally and numerically investigated. The ceramic composites reinforced by 3D layer-to-layer angle interlock woven preforms were manufactured and tested under warp direction tension. A numerical method is proposed to model the mechanical response of the ceramic composites under tension. The method is based on a mesoscopic single layer unit cell for the composites, using a progressive damage analysis approach to account for damage evolution. The predicted results are compared with experimental data, and good agreement in the stress–strain response up to the ultimate tensile strength of the composites is obtained. It has been demonstrated that the proposed numerical model based on a simple single layer unit cell is both efficient and effective in characterization of the mechanical behavior of the 3D layer-to-layer woven ceramic composites.

1. Introduction

Ceramic matrix composite (CMC) is a type of composite materials based on ceramics, which has been gradually used in a variety of temperature-demanding aerospace structures in the last two decades [1,2]. Among them, quartz fiber reinforced silica matrix composites (SiO2f/SiO2) exhibit high strength, light weight, good heat resistance and excellent dielectric properties. Those characteristics make SiO2f/SiO2 composites an ideal material for radome, especially for those working under a high temperature environment [1,3].
The SiO2f/SiO2 composites are typically manufactured by the silicasol-infiltration-sintering method (solgel method) [4,5]. In this method, as illustrated in Ref. [5], the reinforcement was vacuum impregnated using colloidal silica solution precursor (35 vol% SiO2) for 0.5 h, then the pressure of the container was increased to 10 bars and maintained for 1 h. This infiltration process was repeated 10 times with each infiltration dried to remove the water content of the gel solution. Finally, the dried reinforcement was sintered in an oven at 450 °C for 2 h in order to remove the coupling agent and bound water. Similarly, Xu el.al used this method to manufacture unidirectional SiO2f/SiO2 composites, along with other similar work [6]. It is noted that with the solgel method, the manufactured SiO2f/SiO2 are highly porous.
Recently, several kinds of SiO2f/SiO2 textile composites have been developed, including 2D woven [4], 2.5D woven [7], 3D orthogonal [8], and four-directional [7,9], five-directional braided composites [9]. Compared with 2D woven composites, the 3D woven composites significantly simplify the composite manufacturing by using near-net-shape preforms and removing the 2D woven ply layup process, which is quite labor-intensive. At the same time, due to the presence of third-dimensional yarns, it will be more difficult for 3D woven composites to form delamination under out-of-plane loading as seen in conventional laminates [10,11]. Research on woven SiO2f/SiO2 composites are focused on their dielectric properties, thermophysical properties [12] and mechanical properties [4,7,8]. For mechanical properties, either failures under flexural loading and shear loading [8] or tensile behaviors of 2D twill woven SiO2f/SiO2 composites [6] have been studied, while the tensile behaviors of 3D layer-to-layer angle interlock woven SiO2f/SiO2 composites, in particular the corresponding numerical models, are seldom noticed, which may differ with 2D woven composites as a result of complex fiber architecture in the 3D preforms.
For 3D woven composite materials, the design variables of their preforms are enormous with a large number of candidates in the 3D spatial reinforcement architecture [13,14]. Understanding the effect of the fiber architecture of 3D woven composites on their mechanical properties is fundamental to the structure design. 3D woven composites are of multiple hierarchies, and therefore multiscale modelling techniques have been widely used in modelling of composite structures. As most of the failure criteria are only applicable for unidirectional composites [15,16], a mesoscopic representation of the material in the FE model, e.g., incorporating all the whole fiber architectures for textile composites is required. In this mesoscale, the geometric parameters of the preforms can be obtained from the manufacturing data, by microscopic images or micro-computational tomography (μCT) [17]. In regard to the latter, it will be closer to the realistic fiber architectures as reinforcements are subjected to deformation during manufacturing. According to the obtained geometric parameters, a geometric model can be established with CAD software or textile modelers, like CATIA [18] and TexGen [19]. Based on the constructed geometric model and mesh, in conjunction with a damage modelling strategy, the mechanical properties can be simulated using finite element analysis.
As for the damage modelling of composites, progressive damage analysis method [20,21] has been an effective way and widely used in mesoscale simulations of textile composites over the past decades [22,23]. To establish such a model, a damage initiation criterion and laws of damage evolution applied to the stiffness matrix are essential. In Ref. [24], the initial damage is analyzed by Hashin criterion and the damage evolution is identified by damage variables defined by equivalent displacement, and thus the 2D progressive damage model can be established. Nobeen et al. [25] proposed a modelling method for the progressive damage of braided composites based on an instantaneous damage model, in which an instantaneous reduction in the material constants was applied once the damage for the impregnated yarns was predicted. However, it should be noted that although some of the widely used failure criteria for unidirectional composites were proposed several decades ago, modelling their complex failure mechanisms is still the subject of current research [16], as none of the leading failure criteria have been proved to accurately predict failure within all the test cases examined by the World-Wide Failure Exercise [26].
The warp yarns in 3D layer-to-layer angle interlock woven composites are highly undulated and complex compared to others in the preform. The purpose of this paper is to investigate the tensile properties of 3D layer-to-layer woven SiO2f/SiO2 composites under warp direction through both experiments and numerical methods. Ceramic composites reinforced by 3D layer-to-layer angle interlock woven preforms were manufactured and tested under warp tension to characterize their mechanical behavior (Section 2). On the other hand, A numerical method is proposed to model the mechanical response of the ceramic composites under tension. X-ray micro-computed Tomography (µCT) was used to provide realistic geometric data for the unit cell model (Section 3.1), and the associated relative displacement boundary conditions for the unit cell are introduced in Section 3.2. The determination of material properties is described in Section 3.3 along with a progressive damage model given in Section 3.4, which has been implemented into a user material subroutine. Finally, the simulation results are compared with the experiment data in Section 4.

2. Materials, Manufacture and Testing

The 3D woven quartz fiber preforms for the composites were manufactured by Nanjing Fiberglass Research & Design Institute based on a typical 3D layer-to-layer angle interlock woven pattern (no straight warp yarns). The quartz fiber yarn (XYT/QC190) is from SinoType Optoelectronic Technology Co., LTD (Wuhan, China), which is made of continuous quartz fiber with a silicon dioxide content ≥ 99.95% and diameter of 7.4 microns through twisting. The solgel method, as introduced in the Introduction, was used to manufacture the quartz fiber reinforced silica composites. The preforms have gone through heat treatment and infiltration of the silica sol, before being sintered. This infiltration and sintering process were made several times to obtain the final composites. A fiber volume fraction and porosity fraction of approximately 45% and 20%, respectively, for the 3D woven SiO2f/SiO2 composite was achieved, obtained by theoretical estimation based on weights and densities of composites and constituent materials.
Quasi-static tensile tests were performed on the manufactured specimens with a loading rate of 1mm/min using an Instron universal testing machine (Figure 1). The specimens were initially manufactured as a panel and then cut along the warp direction (16 × 16 × 250 mm). The specimens were loaded under the warp yarn direction and three specimens were tested. The testing results obtained will be presented and employed to validate the proposed numerical model in the following section.

3. Finite Element Modelling

3.1. Geometric Modelling

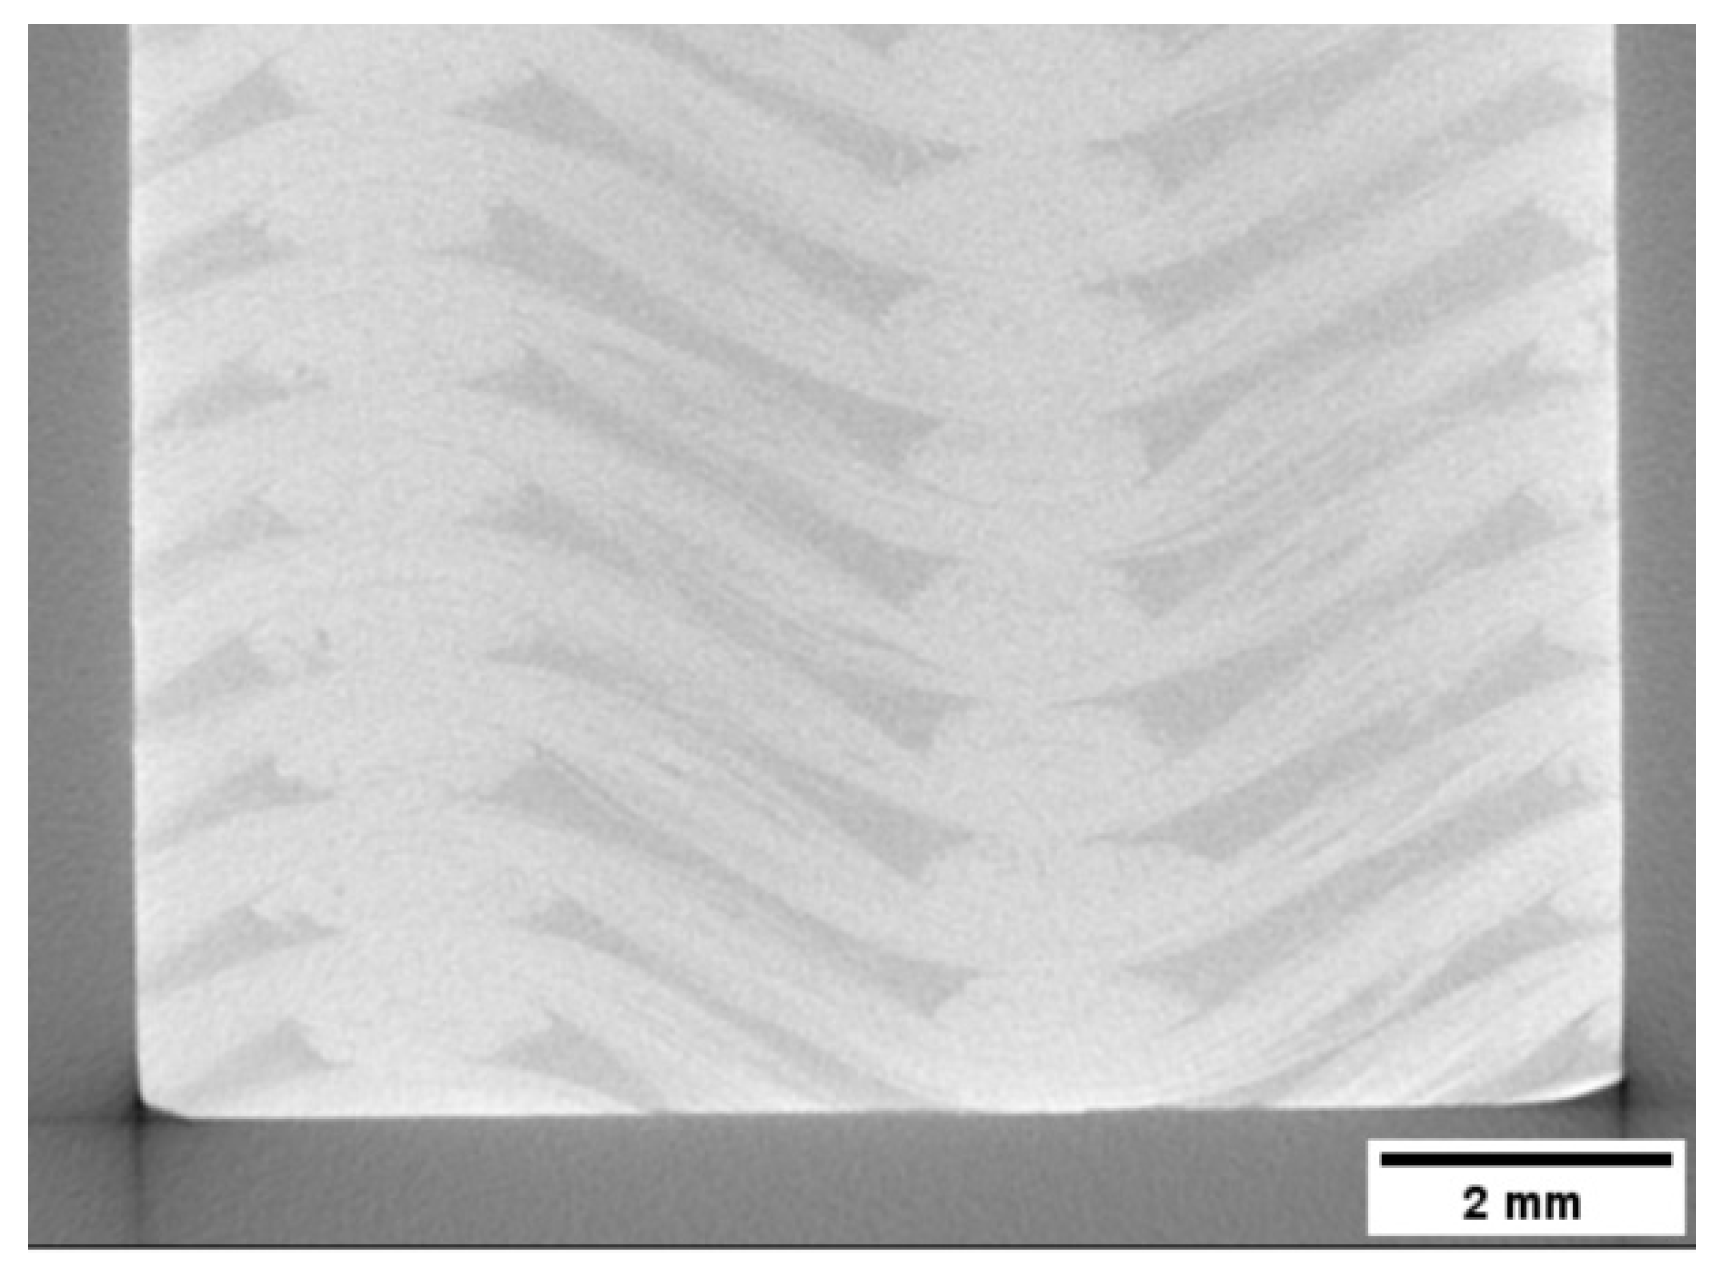
To acquire high accuracy in the prediction of the mechanical properties of the composites, a precise model with realistic reinforcement geometric structure, which is of great significance in the meso-scale finite element analysis, should be established [27,28,29]. To facilitate the construction of a realistic geometric model, a μCT scan was performed on a representative cutoff of the specimen (Figure 2), from which the geometric parameters of the preform are measured. According to the high-resolution images of 30 μm/pixel, parameters including heights, widths and spacing of the warp yarns and weft yarns were obtained as shown in Table 1. Meanwhile, the cross-sections and yarn paths could also be reflected in μCT images. To simplify the geometric modelling process, constant cross-section shapes were assumed for the warp and weft yarns, respectively. As periodicity is a significant feature for 3D woven composites, in this study, only a unit-cell size of the geometry has been created through Abaqus, as shown in Figure 3. For details on the selection of the size of a unit cell for textile composites, it is advised to refer to Ref. [30]. A tetrahedral mesh of approximately 0.10 mm, after a mesh convergence study (Appendix A), was used in discretizing the geometry. In the mesh, the yarns and matrix are perfectly bonded (shared nodes at the interface). It is noted that in order to apply the boundary conditions derived from symmetries in the woven preform, the nodes on corresponding surfaces of the unit cell are required to match each other through projecting the mesh seeds between the surfaces.

3.2. Boundary Conditions

According to Ref. [30], the translational symmetries of relative displacements decide the boundary conditions, the formulas of which are as below:
{ u v w } | ( x , y , z ) { u v w } | ( x , y , z ) = ε 0 Δ x = [ ε x 0 0 0 γ x y 0 ε y 0 0 γ x z 0 γ y z 0 ε z 0 ] { Δ x Δ y Δ z }
where (x, y, z) and (x’, y’, z’) are coordinates of two points on translational symmetrical planes; { u ,   v , w } T is the corresponding displacement for the give points. To the right of the equation, ε 0 stands for the average strain field; Δ x is the distance between point (x, y, z) and point (x’, y’, z’), which can be defined as
Δ x = { Δ x Δ y Δ z } = { x x y y z z }
The relative displacement boundary conditions for the built unit cell are presented in Table 2. There are four axes with translational symmetries for the 3D layer-to-layer angle interlock composites, and the readers are referred to Ref. [30] for more details.

3.3. Material Properties

As the warp yarns and weft yarns used in the preform are in different filament counts, the intra-yarn fiber volume fraction ( V f y a r n ) are different to each other. In this work, different intra-yarn Vf are considered in the finite element model through the measured yarn cross-sections areas by μCT as below.
V f y a r n = k × π d f 2 / 4 A s e c t i o n
where yarn in V f y a r n denotes warp or weft, k is the filament count, d f 2 is the quartz fiber diameter, A s e c t i o n is the area of the cross-section of a yarn (measured from μCT).
The properties of the yarn elements are approximated by the properties of a homogenized unidirectional (UD) composite with a fiber volume fraction equivalent to the V f y a r n . Similar to dealing with laminates, the homogenized yarn is assumed to have transversely isotropic properties, which can be obtained either by the micro-scale unit cell modelling or an analytical solution based on micromechanics. Some of the key materials properties of pristine quartz fiber and silica matrix are listed in Table 3 (Taken from Ref. [6]).
The Chamis model [31] was used to calculated the homogenized properties for warp and weft yarns, respectively. Due to the absence of data for the strengths of the homogenized yarn and the porous silica matrix, similar values from the Ref. [6] for a 2D woven SiO2f/SiO2 composites are used here, in which the properties of the porous matrix were obtained by discounting the properties of solid silica. For warp and weft yarns, although their V f y a r n are slightly different, the strengths are assumed to be identical. All the properties used for the homogenized yarns and porous matrix in the finite element analysis are listed in Table 4.

3.4. Damage Model

For damage in the homogenized yarn material, the Tsai–Wu criterion [32,33] was used for damage initiation. The Tsai–Wu criterion is as follows:
f = F 11 σ 11 2 + F 22 σ 22 2 + F 33 σ 33 2 + F 44 σ 23 2 + F 44 σ 23 2 + F 55 σ 13 2 + F 66 σ 12 2 + 2 F 12 σ 11 σ 22 + 2 F 13 σ 11 σ 33 + 2 F 23 σ 22 σ 33 + F 1 σ 11 + F 2 σ 22 + F 3 σ 33 = 1
All the Fs are material properties as follows:
F 11 = 1 S 1 t S 1 c ,   F 22 = F 33 = 1 S 2 t S 2 c , F 44 = 1 S 23 2 , F 55 = F 66 = 1 S 12 2 , F 12 = F 13 = 1 2 F 11 F 22 , F 23 = 1 2 F 22 F 33 ,   F 1 = 1 S 1 t 1 S 1 c , F 2 = F 3 = 1 S 2 t 1 S 2 c
During the stage from the initiation of the failure to the ultimate failure, there are still residual stiffness remaining in the material. To take the residual stiffness under consideration, a damage evolution law proposed by Matzenmiller et al. [34] was used here. In addition, the stiffness degradation is represented by an exponential law as below:
E = E 0 · ( 1 ω )
ω = 1 exp [ 1 f m m ]
where E0 is the original modulus; E is the residual tangent modulus; ω is the damage variable; f is the failure index; m is a material constant.
In this study, the degradation factor m = 0.3, and it controls the rate and tendency of stiffness degradation. Additionally, as modeling the damage in porous matrix is challenging, the matrix material was considered as linear elastic for simplicity, as the yarns bear most of the load though there might be local damage in the matrix. Yarn/matrix interface debonding (delamination) has also been considered as an important failure mode for textile composites, due to the complex stress states at the interface resulting from the fiber interlacing. Though modelling the debonding in 3D woven polymer composites has been demonstrated in the previous work [22] through the cohesive zone method, in this work it has not been implemented as the fracture properties for ceramic composites are not readily available due to the lack of relevant research so far and the experimental characterization of the debonding for validation purposes has been not performed in this work. Future work is highly recommended on this aspect due to its importance.

4. Results and Discussion

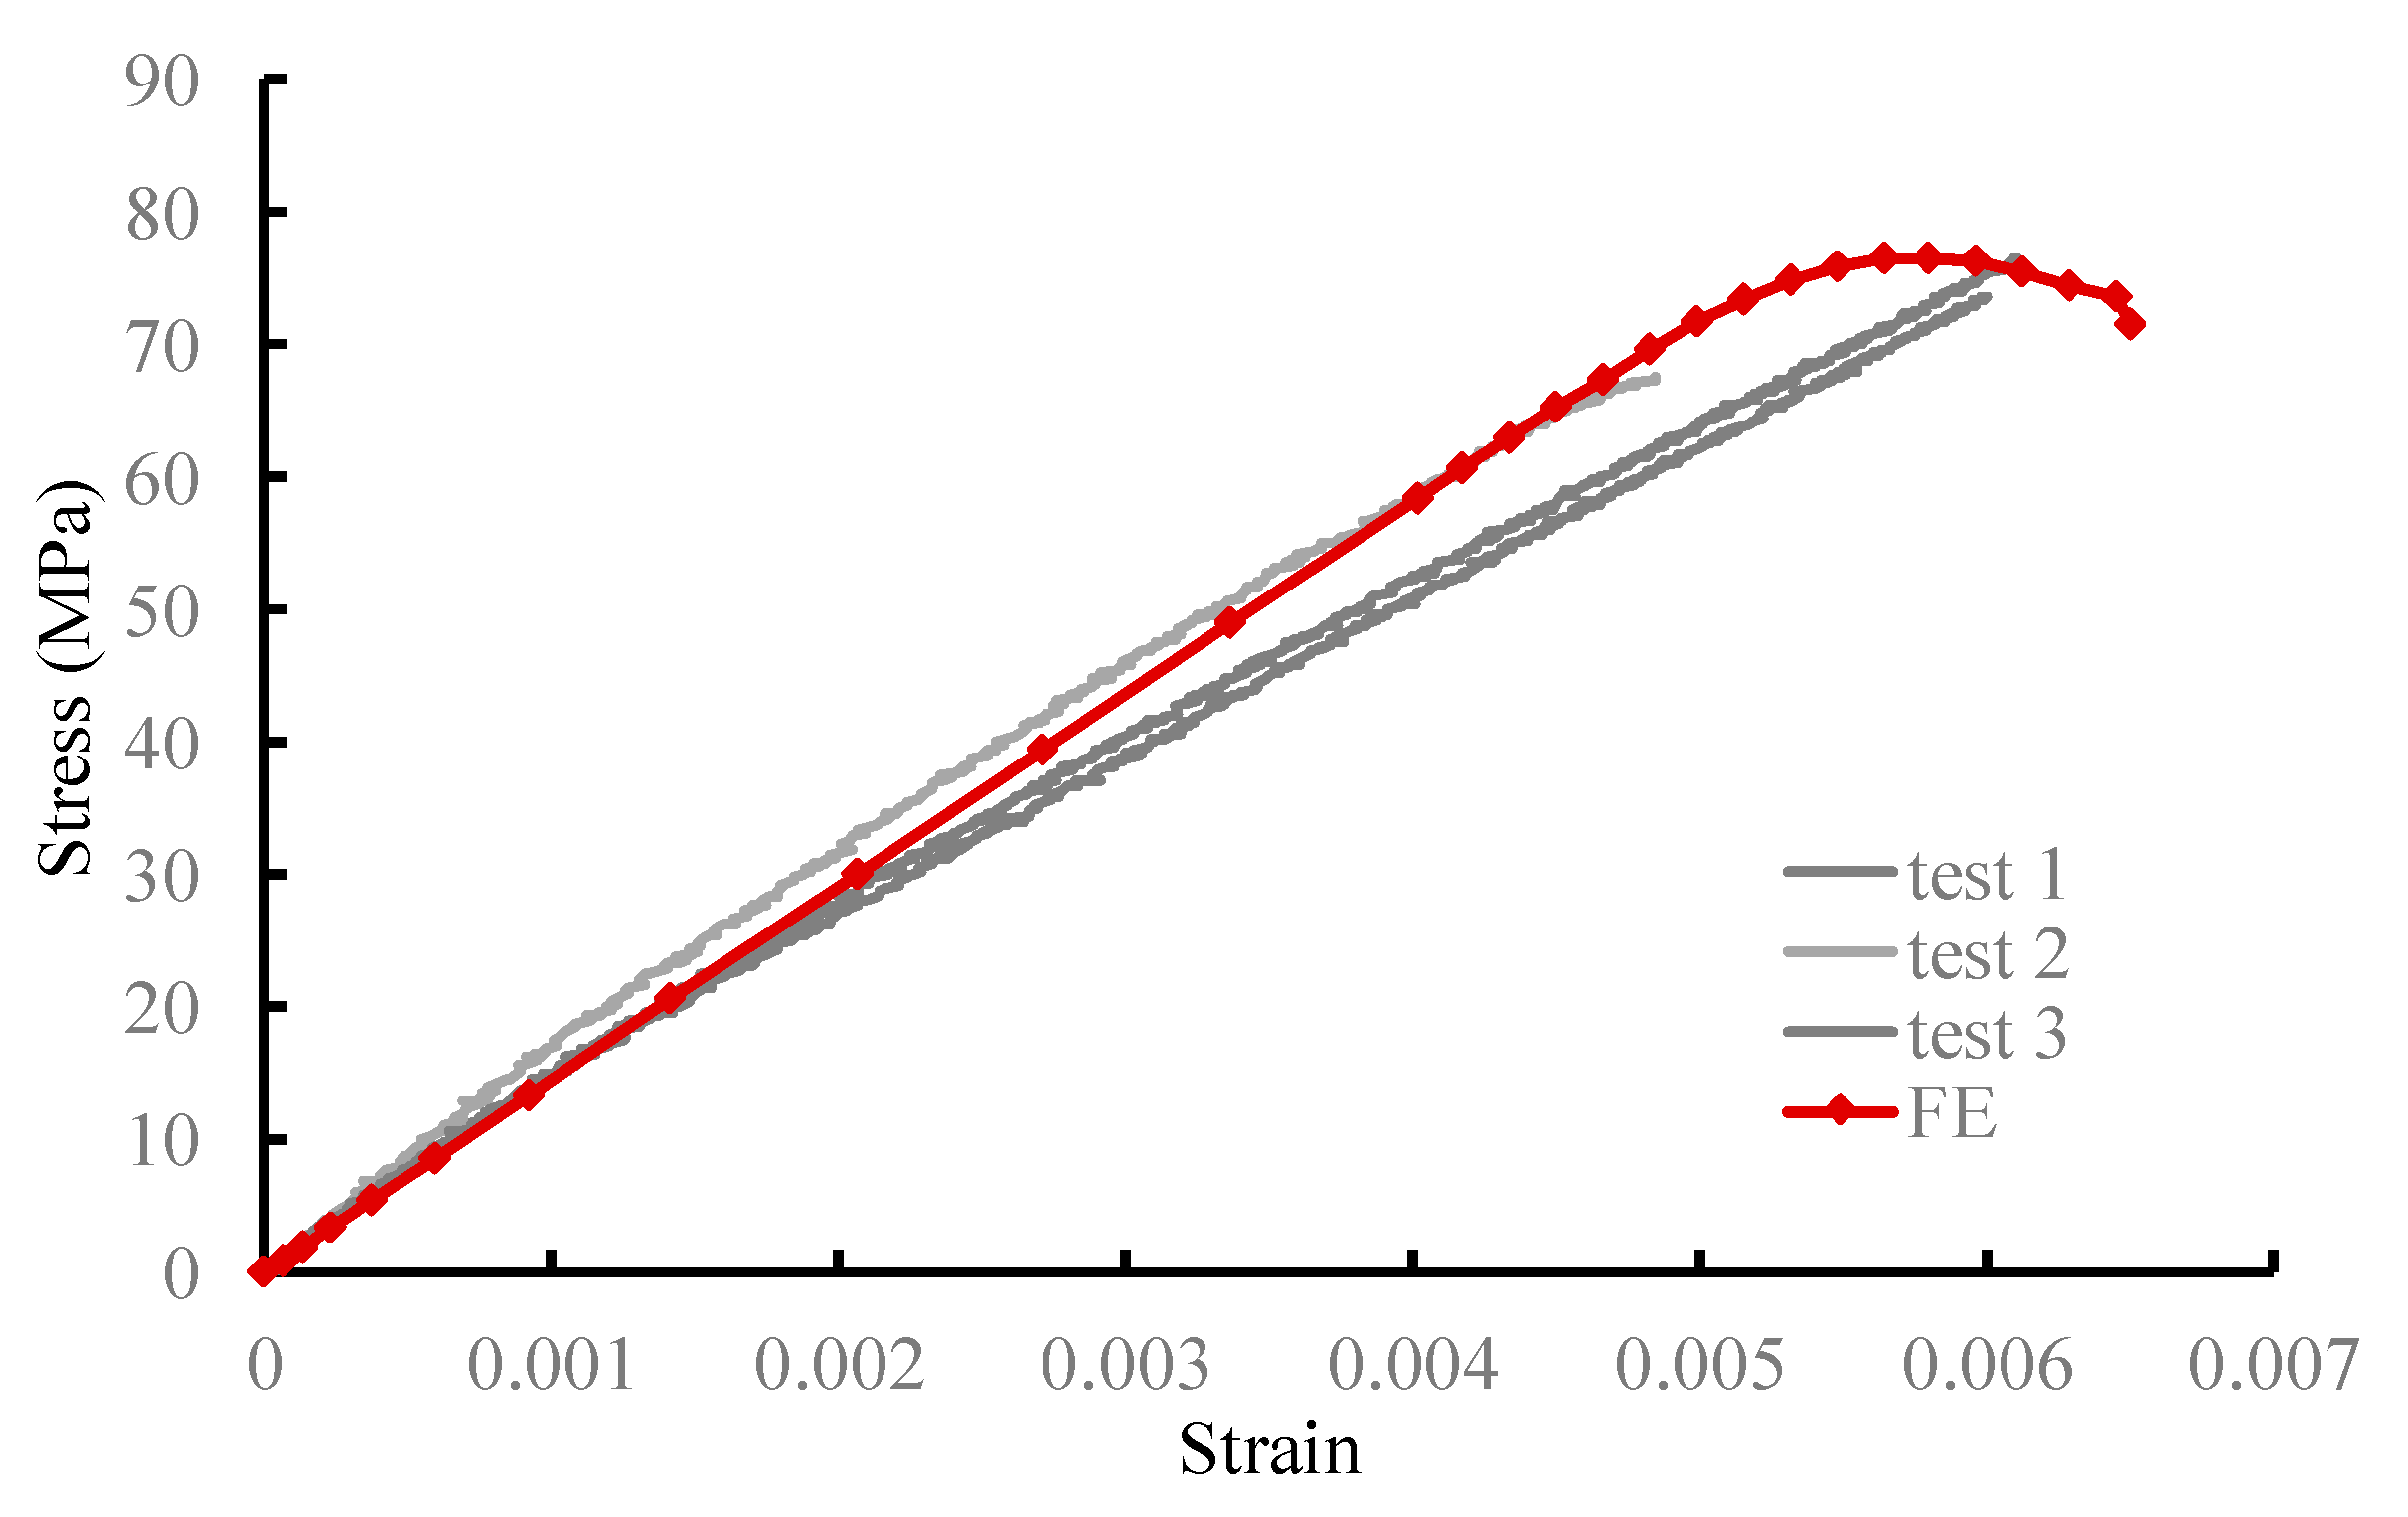
FE models were solved by Abaqus Standard 2021 with a user-defined material subroutine (UMAT) for constituent materials with behavior defined in Section 3.4. The predicted mechanical behavior from the adopted FE method for modelling the 3D woven SiO2f/SiO2 composites under warp tension is compared to the experimental results. Figure 4 shows the comparison of predicted and experimental stress–strain responses for 3D woven SiO2f/SiO2 composites under warp tension.
It can be seen that the stiffness predicted by the FE model, especially at the initial state, is in good agreement with the experiment. As the FE model was based on a unit cell geometry, it can not only improve the efficiency in computation, but also give satisfactory accuracy in the initial stiffness. Although the 3D woven SiO2f/SiO2 composites have surface layers that are not in the same topology of the unit cell geometry, their effect on the stiffness is negligible when the thickness of the specimens is significant. The predicted ultimate tensile strength for the 3D woven SiO2f/SiO2 composites is 76.61 MPa, which agrees well with the experiment, at a strain level of 0.58%. The macroscopic stress–strain curve from the FE model shows that the behavior of the ceramic composites is brittle, similar to the behavior shown in the testing, although local damage has already developed before the ultimate tensile strength.
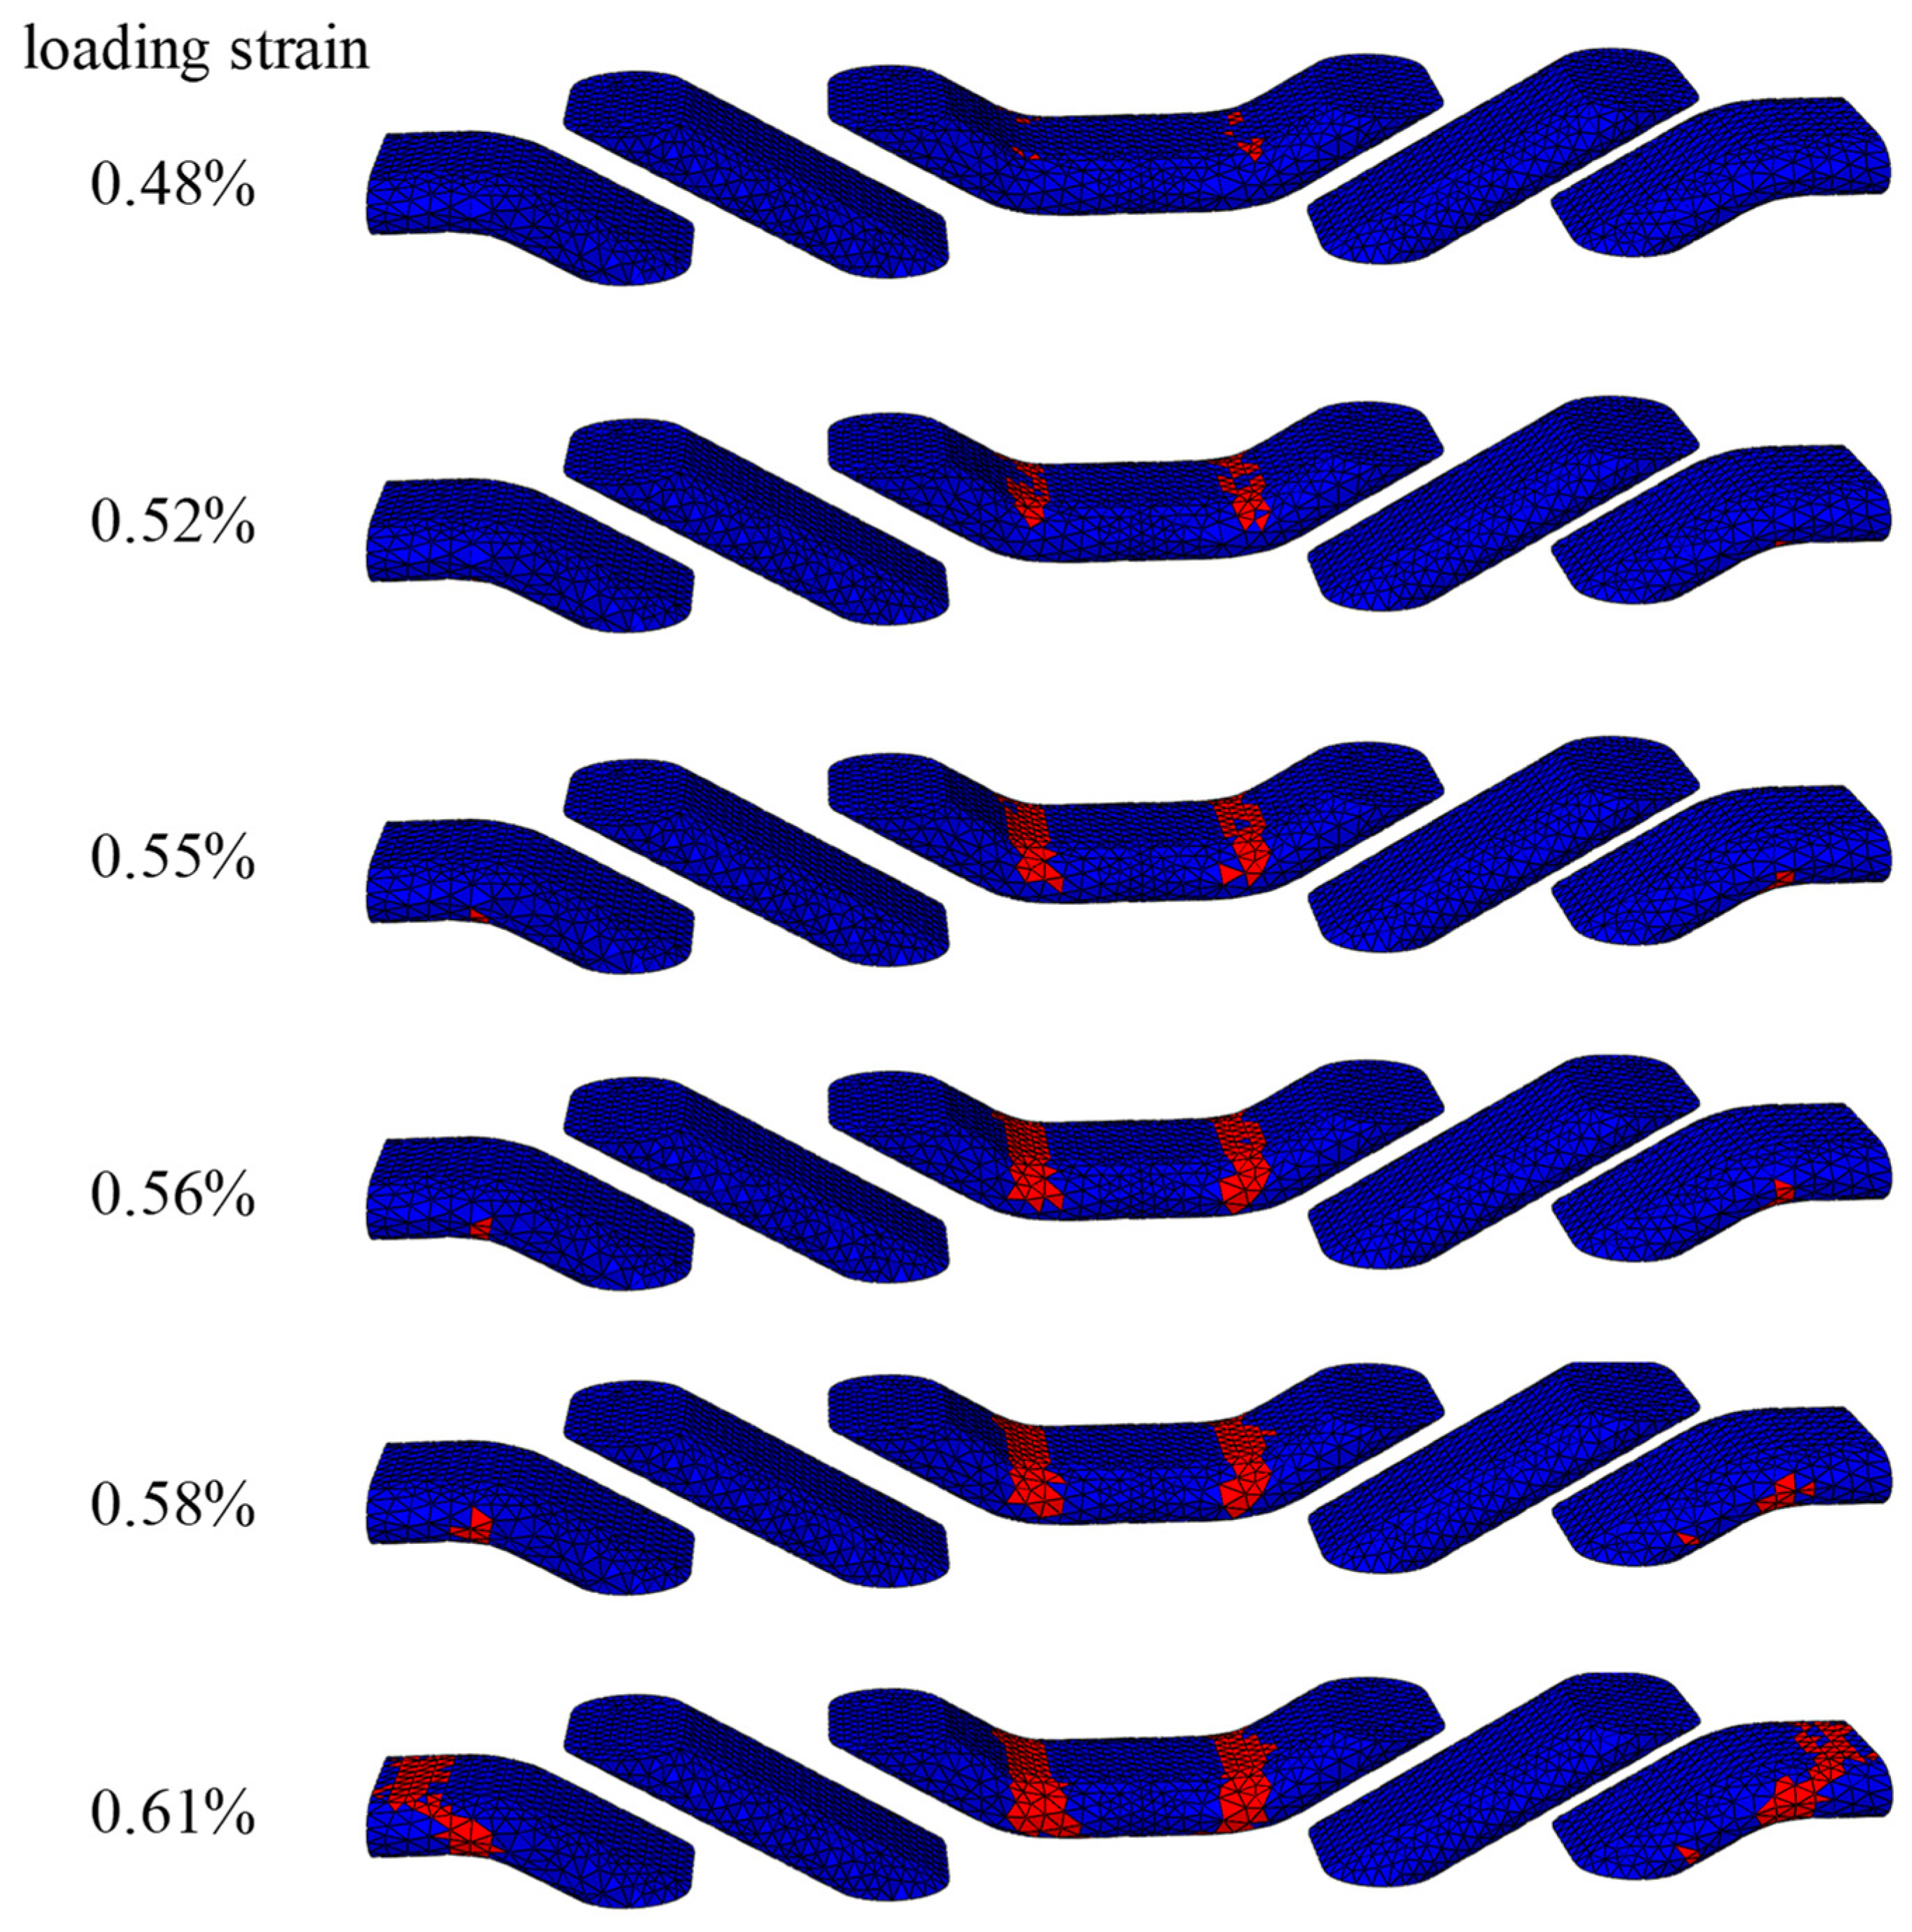
Figure 5 shows the development of local damage on the warp yarns during the loading, which are the load-bearing constituents of the composite. The local damage starts at a load level of 0.48% strain, near the curvature part of the yarn. The damage evolves rapidly and at the load level of 0.58% strain, the composite reached its ultimate tensile strength. Unfortunately, the fractographic analysis of the failed specimens was not performed after the test, which leads to the lack of evidence for the whereabouts of the failure locations.
At a loading strain of 0.58% (corresponding to the ultimate strength), the stress contour in the weft yarns, dominated by the transverse component, is presented in Figure 6 (top), along with the damage parameter contour shown in the bottom. Most parts of the weft yarn elements are still at a low stress level, except for those near the edges.
In addition, it should be noted the geometry in the adopted unit cell is an ideal model, which did not consider the preform deformation caused by the weaving and forming process. This limitation along with the ignorance of matrix damage in the model would lead to the discrepancy in the prediction of the mechanical behavior of the ceramic composites.

5. Conclusions

The mechanical behavior of 3D woven SiO2f/SiO2 composites under warp tension was experimentally and numerically investigated. The ceramic composites reinforced by 3D layer-to-layer woven preforms were manufactured through the solgel method and tested. A mesoscale finite element model was proposed to simulate the mechanical behavior of the composites. The model started with the construction of a single layer unit cell for the complex 3D woven preform, assisted by the μCT characterization of the realistic fiber architecture. Damage modelling was based on Tsai–Wu failure criterion in conjunction with a progressive damage approach based on the Matzenmiller model. Predicted results are in good agreement with experimental data in terms of initial failure, brittle stress–strain response and ultimate tensile strength of the material, which demonstrated that the proposed unit cell model is effective in the evaluation of the mechanical behavior of the 3D woven SiO2f/SiO2 composites at a low computational cost.

Author Contributions

Methodology, H.L. and Y.L.; investigation, H.L. and Y.L., writing- original draft preparation, H.L., Y.L.; Writing-review and editing, S.Y. All authors have read and agreed to the published version of the manuscript.

Funding

This research received no external funding.

Data Availability Statement

Not applicable.

Conflicts of Interest

The authors declare no conflict of interest.

Appendix A

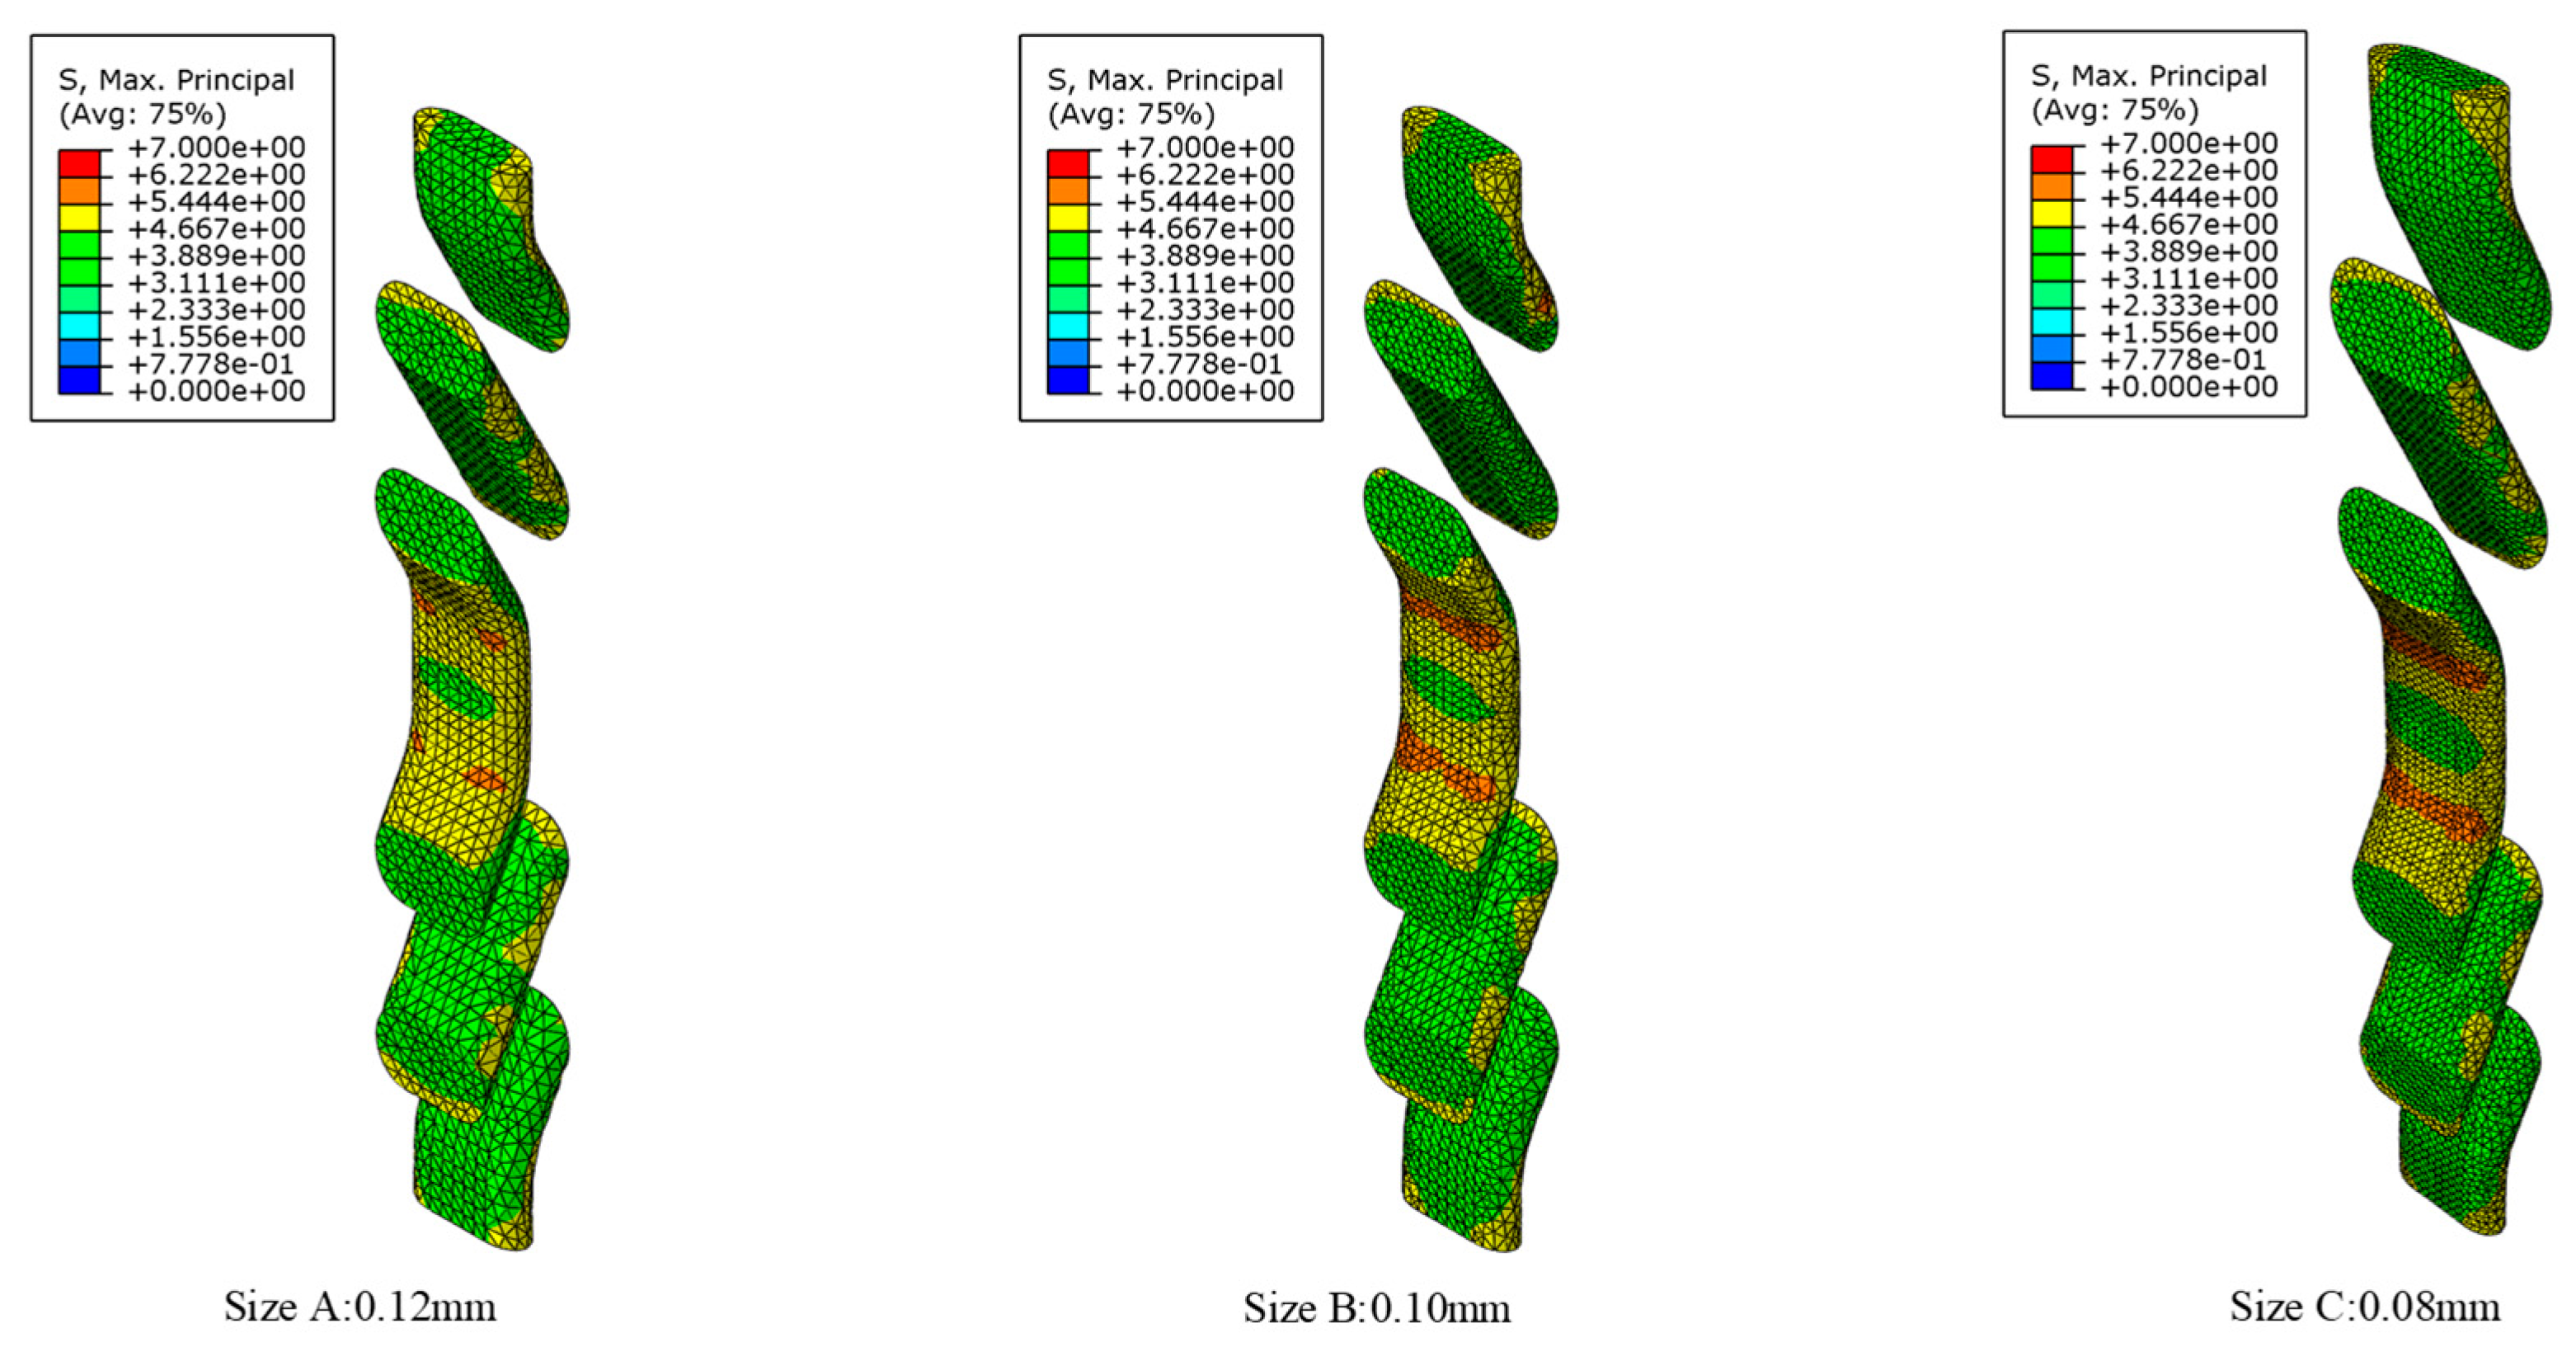
A converge study for the mesh size of the unit cell model was performed. Three different mesh sizes, 0.12 mm, 0.10 mm and 0.08 were used in the study. The local mesh examples for the three models are shown in Figure A1. The mesh details and obtained initial stiffness from the convergence study are presented in Table A1. The comparison of maximum principal stress contours for warp yarns at a loading strain of 0.013% in the convergence study is shown in Figure A2. It can be seen that contour for mesh size of 0.10 mm is close to the contour for mesh size of 0.08 mm, and therefore a size of 0.10 mm was adopted in this work to achieve a balance between accuracy and computational cost.
Figure A1. Local mesh examples (warp direction cross-sectional view) in the mesh used in convergence study.
Machines 10 00434 g0a1
Table A1. Results on mesh convergence study for the unit cell.
Mesh SizeTotal Number of NodesStiffness
0.12 mm12,88214.38 GPa
0.10 mm20,57114.54 GPa
0.08 mm34,25014.40 GPa
Figure A2. Comparison of maximum principal stress contours for warp yarns at a loading strain of 0.013% in the mesh convergence study.
Machines 10 00434 g0a2

References

  1. Kandi, K.K.; Thallapalli, N.; Chilakalapalli, S.P.R. Development of silicon nitride-based ceramic radomes—A review. Int. J. Appl. Ceram. Technol. 2015, 12, 909–920. [Google Scholar] [CrossRef]
  2. Mahmoudi, M.; Wang, C.; Moreno, S.; Burlison, S.R.; Alatalo, D.; Hassanipour, F.; Smith, S.E.; Naraghi, M.; Minary-Jolandan, M. Three-dimensional printing of ceramics through “carving” a gel and “filling in” the precursor polymer. ACS Appl Mater. Interfaces 2020, 12, 31984–31991. [Google Scholar] [CrossRef] [PubMed]
  3. Miao, X.G.; Qu, Y.R.; Ghezzo, F.; Fang, X.W.; Yue, Y.T.; Zhao, Z.Y.; Liu, R.P. Fused silica ceramics and composites for radome applications. Adv. Mater. Res. 2014, 900, 123–129. [Google Scholar] [CrossRef]
  4. Xu, C.-M.; Wang, S.; Huang, X.; Guo, J. Processing and properties of unidirectional SiO2f/SiO2 composites. Ceram. Int. 2007, 33, 669–673. [Google Scholar] [CrossRef]
  5. Liu, Y.; Zhu, J.; Chen, Z.; Jiang, Y.; Li, C.; Li, B.; Lin, L.; Guan, T.; Chen, Z. Mechanical properties and microstructure of 2.5D (shallow straight-joint) quartz fibers-reinforced silica composites by silicasol-infiltration-sintering. Ceram. Int. 2012, 38, 795–800. [Google Scholar] [CrossRef]
  6. Shi, D.; Liu, C.; Cheng, Z.; Li, Z.; Yang, X.; Chen, H. On the tensile behaviors of 2D twill woven SiO2f/SiO2 composites at ambient and elevated temperatures: Mesoscale analysis and in situ experimental investigation. Ceram. Int. 2021, 47, 12680–12694. [Google Scholar] [CrossRef]
  7. Liu, Y.; Zhu, J.; Chen, Z.; Jiang, Y. Mechanical behavior of 2.5 D (shallow straight-joint) and 3D four-directional braided SiO2f/SiO2 composites. Ceram. Int. 2012, 38, 4245–4251. [Google Scholar] [CrossRef]
  8. Li, C.; Chen, Z.; Zhu, J.; Liu, Y.; Jiang, Y.; Guan, T.; Li, B.; Lin, L. Mechanical properties and microstructure of 3D orthogonal quartz fiber reinforced silica composites fabricated by silicasol-infiltration-sintering. Mater. Des. 2012, 36, 289–295. [Google Scholar] [CrossRef]
  9. Liu, Y.; Chen, Z.; Zhu, J.; Jiang, Y.; Li, B.; Boafo, F.E. Comparison of 3D four-directional and five-directional braided SiO2f/SiO2 composites with respect to mechanical properties and fracture behavior. Mater. Sci. Eng. A 2012, 558, 170–174. [Google Scholar] [CrossRef]
  10. Aiman, D.; Yahya, M.; Salleh, J. Impact properties of 2D and 3D woven composites: A review. AIP Conf. Proc. 2016, 1774, 020002. [Google Scholar]
  11. Zou, X.; Yan, S.; Matveev, M.; Rouse, J.P.; Jones, I.A. Experimental and numerical investigation of interface damage in composite L-angle sections under four-point bending. J. Compos. Mater. 2020, 55, 187–200. [Google Scholar] [CrossRef]
  12. Hung, W.-C.; Horng, R.S.; Shia, R.-E. Investigation of thermal insulation performance of glass/carbon fiber-reinforced silica aerogel composites. J. Sol-Gel Sci. Technol. 2021, 97, 414–421. [Google Scholar] [CrossRef]
  13. Yan, S.; Zeng, X.; Long, A. Effect of fibre architecture on tensile pull-off behaviour of 3D woven composite T-joints. Compos. Struct. 2020, 242, 112194. [Google Scholar] [CrossRef]
  14. Yan, S.; Zeng, X.; Long, A. Experimental assessment of the mechanical behaviour of 3D woven composite T-joints. Compos. Part B Eng. 2018, 154, 108–113. [Google Scholar] [CrossRef] [Green Version]
  15. Kaddour, A.S.; Hinton, M.J. Maturity of 3D failure criteria for fibre-reinforced composites: Comparison between theories and experiments: Part B of WWFE-II. J. Compos. Mater. 2013, 47, 925–966. [Google Scholar] [CrossRef]
  16. Christensen, R.M. Failure criteria for fiber composite materials, the astonishing sixty year search, definitive usable results. Compos. Sci. Technol. 2019, 182, 107718. [Google Scholar] [CrossRef]
  17. Ritman, E.L. Current status of developments and applications of micro-CT. Annu. Rev. Biomed. Eng. 2011, 13, 531–552. [Google Scholar] [CrossRef]
  18. Zhang, W.; Yan, S.; Yan, Y.; Li, Y. A parameterized unit cell model for 3D braided composites considering transverse braiding angle variation. J. Compos. Mater. 2022, 56, 491–505. [Google Scholar] [CrossRef]
  19. Lin, H.; Brown, L.P.; Long, A.C. Modelling and simulating textile structures using TexGen. Adv. Mater. Res. 2011, 331, 44–47. [Google Scholar] [CrossRef]
  20. Tay, T.; Liu, G.; Tan, V.; Sun, X.; Pham, D. Progressive failure analysis of composites. J. Compos. Mater. 2008, 42, 1921–1966. [Google Scholar] [CrossRef]
  21. Li, Y.; Yan, S.; Yan, Y.; Zhang, W. Modelling of the compressive behavior of 3D braided tubular composites by a novel unit cell. Compos. Struct. 2022, 287, 115303. [Google Scholar] [CrossRef]
  22. Yan, S.; Zeng, X.; Long, A. Meso-scale modelling of 3D woven composite T-joints with weave variations. Compos. Sci. Technol. 2019, 171, 171–179. [Google Scholar] [CrossRef]
  23. Llorca, J.; González, C.; Molina-Aldareguía, J.M.; Segurado, J.; Seltzer, R.; Sket, F.; Rodríguez, M.; Sádaba, S.; Muñoz, R.; Canal, L.P. Multiscale modeling of composite materials: A roadmap towards virtual testing. Adv. Mater. 2011, 23, 5130–5147. [Google Scholar] [CrossRef] [PubMed]
  24. Lapczyk, I.; Hurtado, J.A. Progressive damage modeling in fiber-reinforced materials. Compos. Part A Appl. Sci. Manuf. 2007, 38, 2333–2341. [Google Scholar] [CrossRef]
  25. Nobeen, N.S.; Zhong, Y.; Francis, B.A.P.; Ji, X.; Chia, E.S.M.; Joshi, S.C.; Chen, Z. Constituent materials micro-damage modeling in predicting progressive failure of braided fiber composites. Compos. Struct. 2016, 145, 194–202. [Google Scholar] [CrossRef]
  26. Hinton, M.; Kaddour, A.; Pinho, S.; Vyas, G.; Robinson, P.; Huang, Z.; Zhou, Y.; Rotem, A.; Carrere, N.; Laurin, F. Special Issue: The Second World-Wide Failure Exercise (WWFE-II): Part B: Evaluation of Theories for Predicting Failure in Polymer Composite Laminates Under 3-D States of Stress; Comparison with Experiments Preface; Sage Publications Ltd.: London, UK, 2013. [Google Scholar]
  27. Isart, N.; El Said, B.; Ivanov, D.; Hallett, S.; Mayugo, J.; Blanco, N. Internal geometric modelling of 3D woven composites: A comparison between different approaches. Compos. Struct. 2015, 132, 1219–1230. [Google Scholar] [CrossRef]
  28. Green, S.D.; Matveev, M.Y.; Long, A.C.; Ivanov, D.; Hallett, S.R. Mechanical modelling of 3D woven composites considering realistic unit cell geometry. Compos. Struct. 2014, 118, 284–293. [Google Scholar] [CrossRef] [Green Version]
  29. Yan, S.; Zeng, X.; Brown, L.; Long, A. Geometric modeling of 3D woven preforms in composite T-joints. Text. Res. J. 2018, 88, 1862–1875. [Google Scholar] [CrossRef] [Green Version]
  30. Li, S.; Sitnikova, E. An Excursion into Representative Volume Elements and Unit Cells; Elsevier: Amsterdam, The Netherlands, 2017. [Google Scholar]
  31. Chamis, C.C. Simplified Composite Micromechanics Equations for Hygral, Thermal and Mechanical Properties. In Proceedings of the 38th Annual Conference of the Society of the Plastics Industry Reinforced Plastics/Composites, Houston, TX, USA, 7–11 February 1983. [Google Scholar]
  32. Tsai, S.W.; Wu, E.M. A general theory of strength for anisotropic materials. J. Compos. Mater. 1971, 5, 58–80. [Google Scholar] [CrossRef]
  33. Li, S.; Sitnikova, E.; Liang, Y.; Kaddour, A.-S. The Tsai-Wu failure criterion rationalised in the context of UD composites. Compos. Part A Appl. Sci. Manuf. 2017, 102, 207–217. [Google Scholar] [CrossRef]
  34. Matzenmiller, A.; Lubliner, J.; Taylor, R.L. A constitutive model for anisotropic damage in fiber-composites. Mech. Mater. 1995, 20, 125–152. [Google Scholar] [CrossRef]
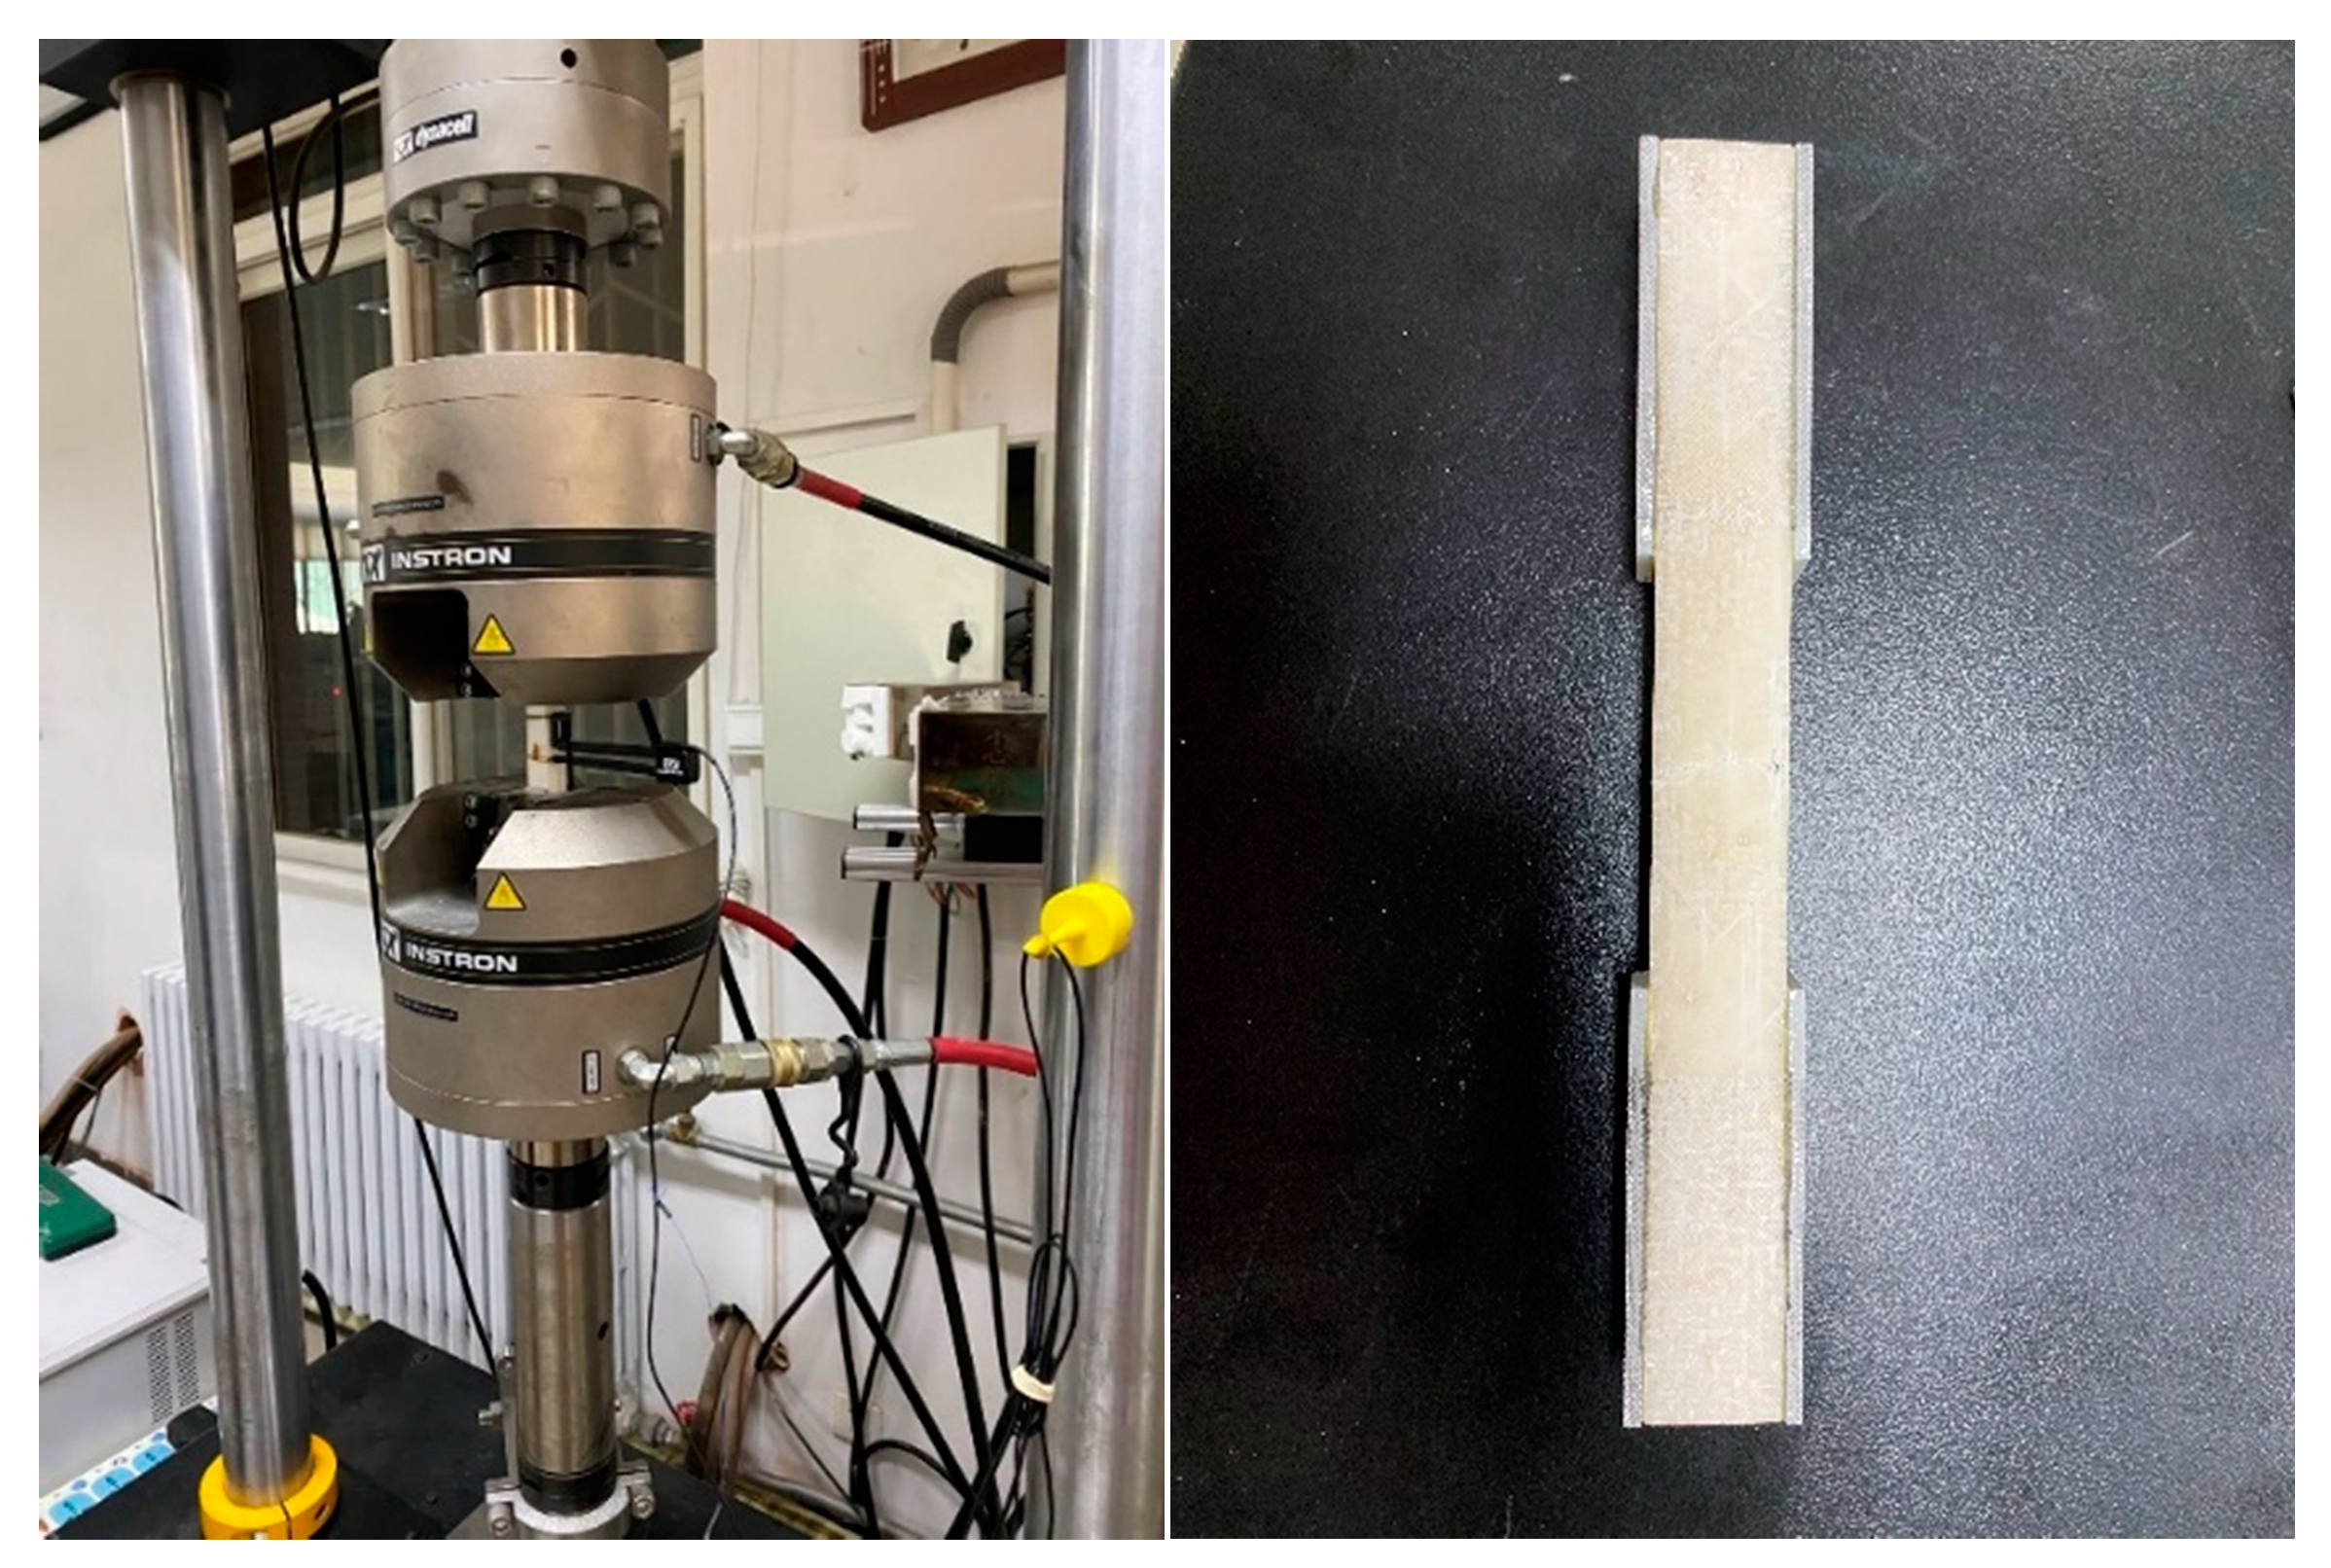
Figure 1. Experimental setup for the tensile testing of the specimens.
Machines 10 00434 g001
Figure 2. μCT scan images of the 3D woven SiO2f/SiO2 composites in this study.
Machines 10 00434 g002
Figure 3. A geometric model of the unit cell with matrix being hidden.
Machines 10 00434 g003
Figure 4. Predicted stress–strain response for the 3D woven SiO2f/SiO2 composites under warp tension in comparison with test results.
Machines 10 00434 g004
Figure 5. Warp yarn full damage contour predicted by the FE model at different loading levels, red color indicates full damage, defined as Equation (7) is greater than 0.9.
Machines 10 00434 g005
Figure 6. Transverse stress contour (top, S22) and damage parameter contour (bottom, denoted by SDV5 for Equation (7)) in weft yarns at a loading strain of 0.58% (ultimate strength).
Machines 10 00434 g006
Table 1. Measured geometric parameters of the 3D woven preform through μCT.
Warp YarnWeft YarnNumber of Measurements
Height (SD) in mm0.36 (±0.04)0.53 (±0.04)20
Width (SD) in mm1.11 (±0.07)1.76 (±0.08)20
Spacing (mm)0.16 (±0.03)2.53 (±0.10)20
Table 2. Relative displacement boundary conditions for the unit cell model.
DirectionsDistance VectorsBoundary Condition Equations
ξ-axis Δ x η = { W U C L 1 0 } Δ u η = { u u v v w w } = { W U C ε x 0 + L 1 γ x y 0 L 1 ε y 0 0 }
η-axis Δ x ξ = { W U C L 2 0 } Δ u η = { u u v v w w } = { W U C ε x 0 L 2 γ x y 0 L 2 ε y 0 0 }
y-axis Δ x y = { 0 L U C 0 } Δ u η = { u u v v w w } = { L U C γ x y 0 L U C ε y 0 0 }
z-axis Δ x z = { 0 0 H U C } Δ u η = { u u v v w w } = { H U C γ x y 0 H U C γ x y 0 H U C ε z 0 }
Table 3. Material properties of pristine quartz fiber and silica matrix.
Elastic ConstantsValues
Quartz fiberElastic modulus72–78 GPa
Poisson’s ratio0.25
Tensile strength1046 MPa
Silica matrixElastic modulus35–45 GPa
Poisson’s ratio0.26
Tensile strength 180–220 MPa
Table 4. The material properties for the homogenized yarns and porous matrix in the FE model.
Warp Yarn V f y a r n = 0.71
E 1 ( GPa ) E 2 = E 3 ( GPa ) G 12 = G 13 ( GPa ) G 23 ( GPa ) μ 12 = μ 13 μ 23
52.4312.616.074.660.280.35
Weft yarn V f y a r n = 0.60
E 1 ( GPa ) E 2 = E 3 ( GPa ) G 12 = G 13 ( GPa ) G 23 ( GPa ) μ 12 = μ 13 μ 23
451154.070.290.35
Warp and weft yarn strengths
S 1 t ( MPa ) S 2 t = S 3 t ( MPa ) S 1 c ( MPa ) S 2 c = S 3 c ( MPa ) S 12 = S 13 ( MPa ) S 23 ( MPa )
2008080804040
Porous Matrix
E m ( GPa ) μ
4.50.35
Publisher’s Note: MDPI stays neutral with regard to jurisdictional claims in published maps and institutional affiliations.