Article

Proximate Model of Gear Drive Units Based on Dimensional Analysis for Wear Process Evaluation

School of Mechanical Engineering, Shandong University of Technology, Zibo 255049, China
*
Author to whom correspondence should be addressed.
Machines 2022, 10(6), 474; https://doi.org/10.3390/machines10060474
Submission received: 15 May 2022 / Revised: 6 June 2022 / Accepted: 11 June 2022 / Published: 13 June 2022
(This article belongs to the Section Friction and Tribology)

Abstract

:
Excessive wear of gears will not only cause noise and vibration in the transmission system, but also reduce transmission efficiency and accuracy in severe cases, causing irreversible losses to the transmission system. It is desirable to develop a micro-gear unit model for evaluating the wear process and predicting the failure time of large gear units (such as wind turbine gear units), reducing losses due to sudden failures. Based on the Buckingham pi-theorem of dimensional analysis and Hertz formula, the similarity ratio of each parameter of the gear wear process was proposed. The maximum equivalent stress is calculated by establishing the FEM model and comparing it with the theoretical contact stress calculated by the Hertz formula, and the results were relatively consistent. Two pairs of gear friction and wear experiments with similar parameters were carried out to compare the wear evolution performance of two similar gears. The friction performance process of the test gears was observed by particle counter and analytical ferrograph. The results show that the friction and wear processes of the two groups of gears with similar parameters have a certain correlation, which was consistent with the proposed similarity model. The similarity model combined with the observation results of abrasive particles has a certain application value for the evaluation of the wear state of the transmission system.

1. Introduction

Fault monitoring of gears has become an increasingly important topic among related scholars. Taking the wind turbine gear unit as an example: the operating environment of the wind turbine is very harsh with changeable speed and difficult maintenance and the nacelle is usually located at a height of more than 60 m, which creates difficulties regarding the maintenance and fault monitoring of the wind turbine [1,2,3]. Therefore, for large gear units, reasonable design, fault monitoring, and maintenance of gearboxes are necessary. Research data showed that in the mechanical transmission system, the gear transmission system has a higher failure rate [4,5]. Compared with the failure of other components, for example, the failure of the electrical and control systems, the failure of the gear unit requires a long time for investigation and maintenance, especially for large equipment units, the gearbox is usually an important link in the transmission system and needs to withstand variable loads and other shock loads. Once a failure occurs, it needs to be shut down for maintenance. Long-term downtime for maintenance will lead to serious economic losses, and because the gear failure causes damage to the internal structure of the gearbox, the cost of maintenance and even replacement of parts will be higher. The wear failure of gears has a long cycle, which is not impossible to predict and avoid. Identifying the wear status of the gears and judging the operating status of the gearbox can effectively avoid losses caused by gear failures. Whether from the perspective of economic benefits, or from the perspective of reducing operational risks, a reasonable design of a gearbox and fault monitoring system and model that can troubleshoot and predict failure in time is very necessary.
The gear reducer is mainly designed based on many large gear units (such as ships, wind turbine transmission units, etc.) [6,7]. However, in actual operation—due to faults and unstable operation—large gear units must be assembled and tested. large gear units are large in size and high in power, making them difficult to simulate in an operating environment. Therefore, the actual test is more difficult, and the 1:1 model test will inevitably cause high risk, high investment, and long cycle, and may not achieve ideal test results. Designing a small miniature gear model has high feasibility, especially by establishing a model to predict the friction and wear of wind turbine gear units. At present, there is a lot of research on the fault monitoring and design model of gears. Many experts and scholars have published many research works on the fault monitoring and design model of gears. Ma and Yan et al. applied the singular spectrum analysis method of fault signal to the fault detection of gearbox in their research [8,9]. Liu et al. extracted the local impact features of gears based on EMD and sparse decomposition method [10], and the above method is based on vibration signal analysis to monitor gear failures. In terms of model design, Bashar Shboul et al. designed a hybrid system of a solar dish Stirling engine integrated with a horizontal axis wind turbine and evaluated it by building a model test [11], Bhimrao A. Shivsharan et al. conducted finite element simulation modeling analysis of wind turbines to prepare suitable models for rational development and design [12], Kamran Shirzadeh Ajirlo et al. mentioned testing and evaluating the design and performance of miniature horizontal-axis wind turbines (HAWT) by installing simulators in miniature wind turbines [13], Andreas et al. established a numerical model of the gear forming process chain based on forming experiments and verified it, results show that the process chain is very feasible [14]. However, a single vibration signal detection method cannot effectively identify the early wear failure of the gearbox, and a single model design method cannot judge the rationality of the model. Therefore, a more comprehensive gear fault monitoring and model design system needs to be developed.
Dimensional analysis is a very powerful general-purpose tool that can be used to analyze and understand a variety of engineering problems. Martin Giraud studied the grinding mechanism of ball mills by dimensional analysis [15]. Prakash M. Jadhav used Buckingham pi-theorem to model rolling bearings and detect bearing distribution defects [16]. The above studies provide new ideas for studying the friction and wear mechanism of large-scale gear units, but the dimensional analysis is rarely applied to the prediction of gear friction and wear. To analyze the operating state of gears more comprehensively, a scale model theory based on dimensional analysis is proposed, and the scale model research is carried out in combination with the oil wear particle analysis technology. In this research, starting from the fault monitoring direction of the gear unit, a similar scale model gear was established, which provides a basis for fault monitoring and failure prediction of gears in large-scale units.
Many variables and parameters are involved in the design of the gears of large-scale units, such as geometrical characteristic parameters, material characteristic parameters, and dynamic characteristic parameters. Considering a large number of parameters, based on the Hertz formula [17], Buckingham pi-theorem was used to conduct a dimensional analysis of the operation process of large-scale units to establish a reasonable similarity ratio. The research work through the size analysis of large-scale units, the modeling of similar ratio gears was first carried out, and the maximum equivalent stress was analyzed by finite element analysis to verify whether the similarity ratio established by Buckingham pi-theorem was theoretically feasible, and then established a scale model test platform [18,19]. During the test, the model gear runs continuously until the gear fails. In fault detection, ferrography, wear particle analysis, and scanning electron microscopy (SEM) were frequently used for gear failure detection. The oil in the scale-down gearbox test platform was sampled regularly, and the oil samples were analyzed by ferrography [20,21,22]. Particle count and composition analysis [23,24] were carried out to monitor the friction and wear of the gears state [25], and SEM was used to analyze and observe the causes of gear failure.

2. Selection of Similar Parameters

2.1. Similarity Criterion for Gears

There are many influencing factors in the process of gear meshing operation. The wear of the gear is due to the excessive stress on the tooth surface, which exceeds the yield limit of the tooth surface. There are two main calculation methods of gear tooth contact stress: Hertzian contact stress calculation and finite element contact simulation analysis calculation. Gears are involute gear teeth in contact, gear pitting usually occurs on the surface of the tooth root near the pitch line. Therefore, the contact fatigue strength calculation usually takes the node as the calculation point, and the Hertz contact stress calculation results are relatively similar. Therefore, this paper uses the Hertzian theory to calculate the contact stress, and the maximum contact stress of the gear teeth calculated using the Hertz formula is relatively consistent with the finite element analysis results.
σ H = K H F t b d 1 u + 1 u Z H Z E Z ε
where σH represents the maximum contact stress, KH represents the load coefficient, Ft represents the circular force, u represents the gear ratio, b represents the tooth width, d1 represents the diameter of the index circle, ZH represents the node area coefficient, ZE represents the elastic coefficient, and represents the coincidence degree factor. In the contact stress calculation formula, ZE represents affected by the elastic modulus of the material and Poisson’s ratio v, and the contact stress of the gear tooth surface is also related to the speed of the gearbox, the load of the gear, and other factors.
In this paper, dimensional analysis was used to speculate on the similarity criterion, and the parameters involved in the gear operation process were first determined. According to the analysis of the Hertz stress formula, the physical quantities involved in the gear wear process can be obtained. The functional relationship of each parameter in the gear meshing process can be given by
σ max = f ( d , m , b , z , β , ρ , E , v , F , n , t ) ,
where σmax represents the maximum equivalent stress during gear operation, d represents the gear index circle diameter, m represents the modulus, b represents the tooth width, z represents the number of teeth, β represents the helix angle of the helical gear, ρ represents the density of the material, E represents the modulus of elasticity, v represents the Poisson’s ratio, F represents the gear bears load during operation, n represents the speed, and t represents the running time.
In problems involving mechanics, the mass dimension (M), the length dimension (L), and the time dimension (T) are usually chosen as the basic dimensions. In the MLT system, the physical quantities involved can be represented by the basic dimensions as
[ X ] = L a M b T c
For example, pressure can be expressed as dim F = MLT−2. The physical parameters are divided according to the quality MLT dimension system, as listed in Table 1.
Buckingham pi-theorem states that if there are h independent physical quantities in n physical quantities (n > h), then n physical parameters can be composed of (n−h) dimensionless parameters: π1, π2...π(n−h). According to Buckingham pi-theorem, the MLT system Dimension matrix is listed in Table 2.
The above matrix is three-dimensional. Taking d, ρ, E as the basic quantity, Equation (4) can be obtained
| 0 1 1 1 3 1 0 0 2 | 0
According to the Buckingham pi-theorem, the number of similarity criteria in this system is 9, but since the z, β, and υ are dimensionless, the final number of similarity criteria obtained by removing these terms is 6.
The parameters of d, m, b, σ, ρ, E, F, n, and t can be represented by a1, a2, a3, a4, a5, a6, a7, a8, and a9. The matrix can be converted to the matrix listed in Table 3.
According to Buckingham pi-theorem and dimension matrix listed in Table 3, a homogeneous equation can be derived
{ a 4 + a 5 + a 6 + a 7 = 0 a 1 + a 2 + a 3 a 4 3 a 5 a 6 + a 7 = 0 2 a 4 2 a 6 2 a 7 a 8 + a 9 = 0
Taking a1, a5, and a6 as independent variables, Equation (5) can be simplified to Equation (6).
{ a 1 = a 2 a 3 2 a 7 + a 8 a 9 a 5 = 1 2 a 8 1 2 a 9 a 6 = a 4 a 7 1 2 a 8 + 1 2 a 9
There are nine parameters in Equation (5), and d, ρ, E (which are represented by a1, a5, a6) are selected as the basic dimensions. According to Buckingham pi-theorem, the remaining parameters are represented by the dimensionless parameter π, six similar criteria are obtained: π1~π6, which were represented by a2, a3, a4, a7, a8, a9, then Equation (7) can be obtained
{ d ( a 1 ) = π 1 π 2 2 π 4 + a 5 a 6 m ( a 2 ) = π 1 b ( a 3 ) = π 2 σ ( a 4 ) = π 3 ρ ( a 5 ) = 1 2 π 5 1 2 π 6 Ε ( a 6 ) = π 3 π 4 1 2 π 5 + 1 2 π 6 F ( a 7 ) = π 4 n ( a 8 ) = π 5 t ( a 9 ) = π 6
According to the Buckingham pi-theorem, a π matrix in the similar system can be obtained, as listed in Table 4.
The following similarity criteria can be deduced from the Buckingham pi-theorem matrix.
{ π 1 = m d π 2 = b d π 3 = σ E π 4 = F d 2 E π 5 = n d ρ E π 6 = t d E ρ
The functional relationship determined by similarity criteria is expressed as Equation (9).
F ( π 1 , π 2 , π 3 , π 4 , π 5 , π 6 ) = 0
According to Buckingham pi-theorem, the dimensionless function is expressed as (Equation (10)),
σ max E = f ( m d , b d , z , β , υ , F d 2 E , n d ρ E , t d E ρ )
where σ max E is the dimensionless dependent variable.
Prototype and model gear can be represented by subscripts p and m respectively, and λ represents the similarity ratio between the model and the prototype. Then the similarity ratio of each physical quantity can be divided into three categories.
Geometric feature similarity ratio.
λ d = d p d m λ m = m p m m λ b = b p b m λ z = z p z m λ β = β p β m
Material feature similarity ratio.
λ σ = σ p σ m λ ρ = ρ p ρ m λ E = E p E m λ υ = υ p υ m
Kinetic feature similarity ratio.
λ F = F p F m λ n = n p n m λ t = t p t m
The similarity criterion relationship between the prototype and the model is expressed in Equation (14). Besides, πnp = πnm, n = 1, 2, 3 …6.
F P ( π 1 P , π 2 P , π 3 P , π 4 P , π 5 P , π 6 P ) = 0 F m ( π 1 m , π 2 m , π 3 m , π 4 m , π 5 m , π 6 m ) = 0
According to the obtained similarity criterion, combining Equations (9)–(14), the similarity ratio of each parameter can be obtained, as listed in Table 5.

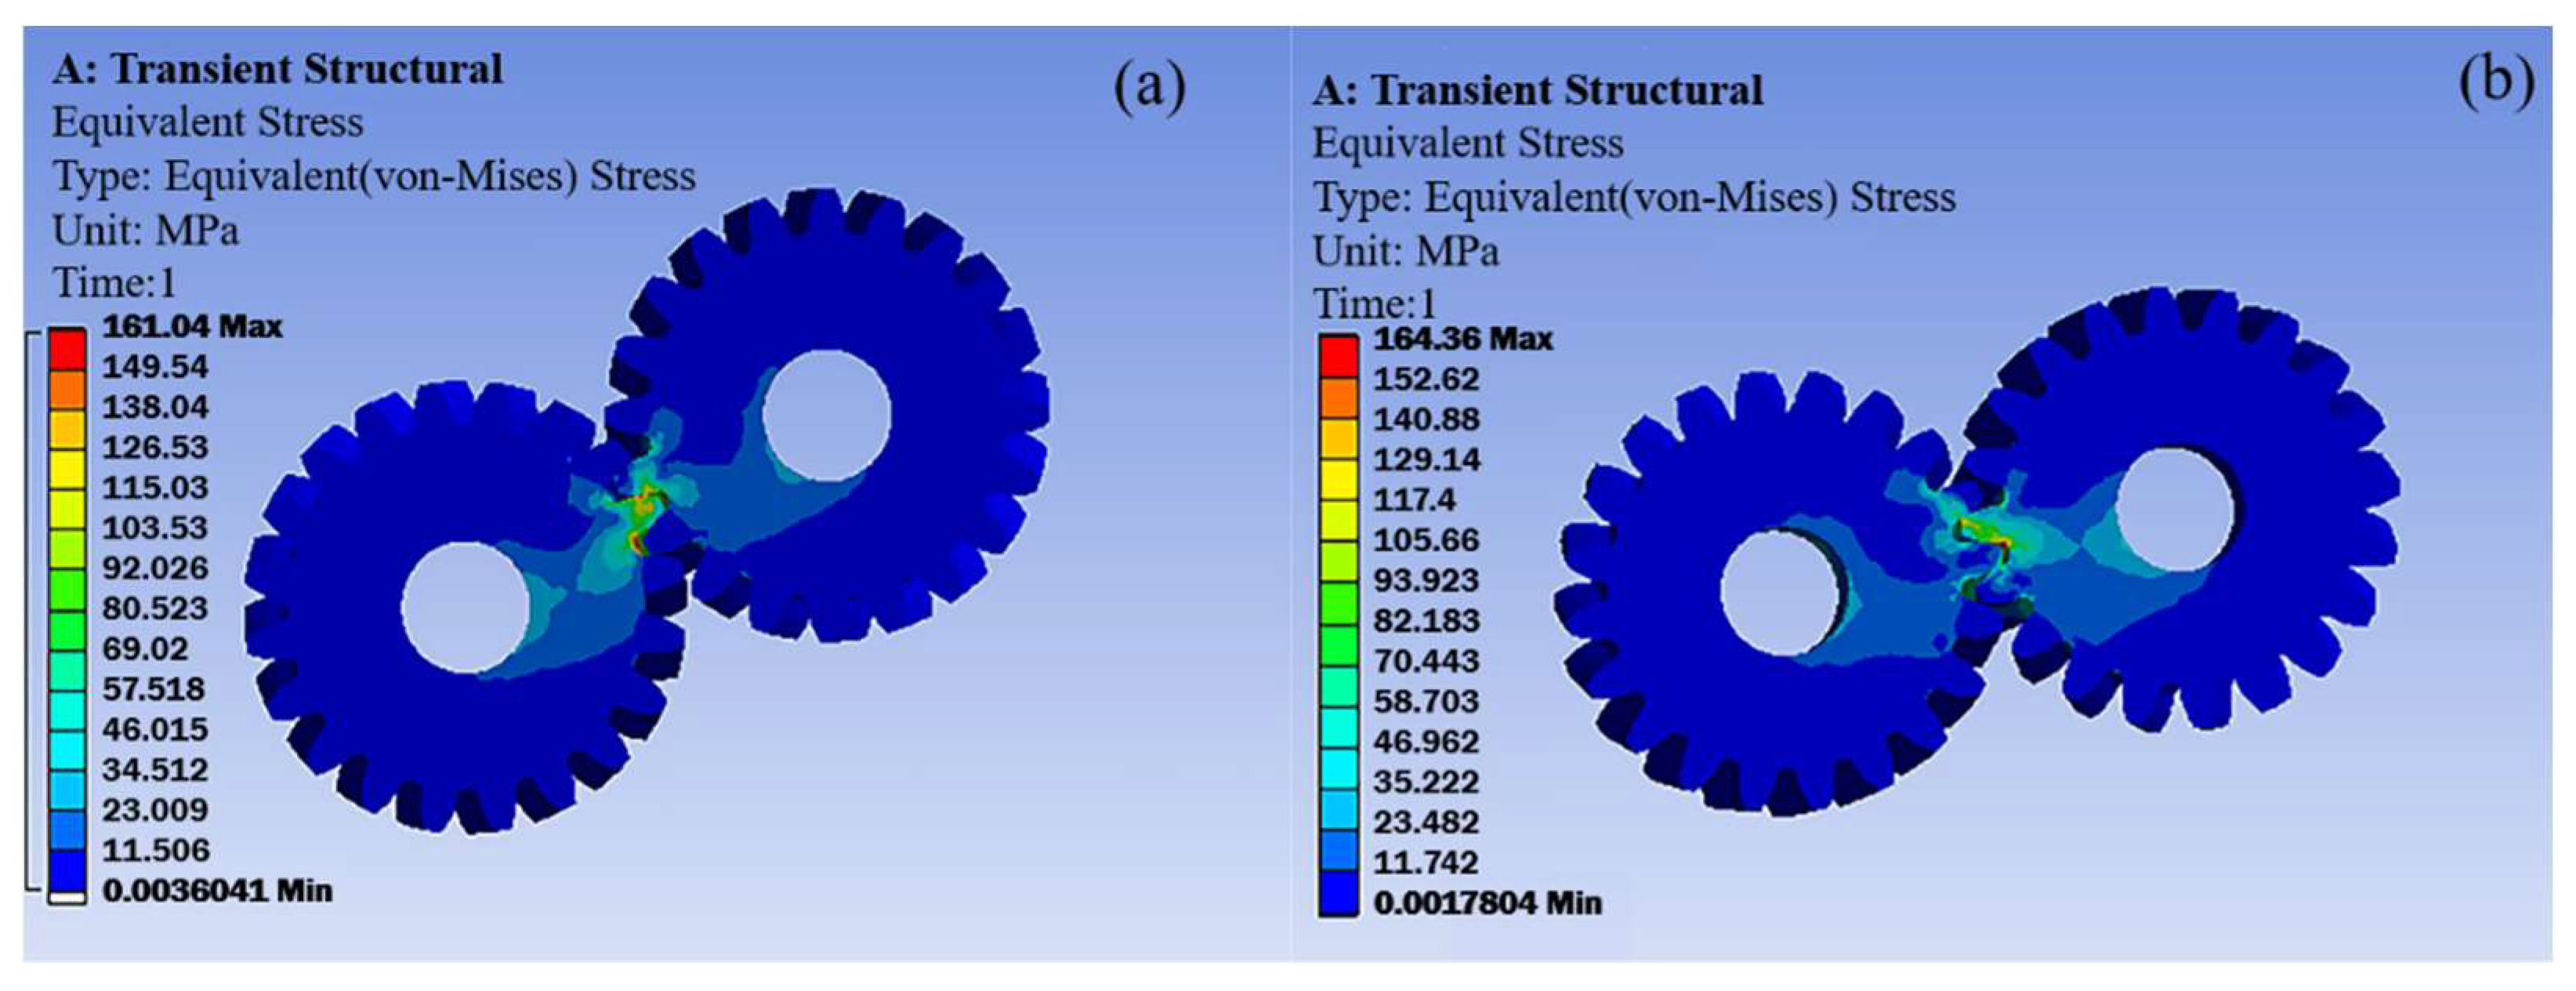
2.2. Finite Element Analysis to Verify

The experimental helical gear was modeled and meshed using 3D software. To reduce the number of grids and at the same time ensure the accuracy of grid calculation, three-in-one grid processing was performed on the transition part of the tooth root circle, the grid nodes of the next layer are one-third of the grid nodes of the previous layer, it can also ensure that the drawn grid was a quadrilateral grid, copy and rotate the partially bisected tooth-shaped 2D grid, and the rotation angle was the angle occupied by one gear tooth. In addition, the co-node processing is performed on the tooth shape boundary of the gear, the nodes within the range are displayed, and it was observed whether there are nodes on the first floor or redundant, and the node processing was being performed. Finally, map the 2D plane grid to form a hexahedral grid to determine auxiliary mapping points, lines, and surfaces, and determine the number of grid layers to obtain grids. Hide the 3D mesh in the Mask tree species, delete the 2D mesh, and obtain the meshing gear finite element mesh division as shown in Figure 1.
The model was analyzed by FEM, and the parameters of the solver are set as shown in Table 6.
The results (Figure 2) show that during the gear meshing process, the force analysis diagram at different positions of the gear. Figure 2a shows the stress distribution cloud diagram. Figure 2b shows the stress distribution on the bearing surface of the large gear. Figure 2c shows the stress distribution on the back of the large gear. Figure 2d shows the stress distribution at the tooth root of the stressed surface of the large gear. Stress concentration at the root of the tooth is more likely to be damaged and broken. The maximum equivalent stress obtained by the solution was 430 MPa. According to the theoretical calculation of Equation (1) Hertz formula, the theoretical maximum equivalent stress is 435.01 MPa, which is slightly larger than the 430 MPa of the finite element analysis result. This also shows that it is reasonable to use Hertz equivalent stress for theoretical analysis.
To verify the accuracy of the above similar relationship, two pairs of meshing gears were designed according to the similar relationship, and the equivalent stresses of the model and prototype gears were calculated by using finite element analysis to illustrate whether the similar relationship is accurate. According to the parameter ratio of similar models obtained above, the specific parameters of these two pairs of gears are listed in Table 7.
Finite element analysis is used to perform transient dynamic analysis on similar gears, adopting the same solver parameters and meshing method as in Figure 2. The speed of the prototype and model gears were set to 5 rad/s and 10 rad/s, and the torque was set to 40 N·m and 10 N·m. The maximum equivalent stress distribution of the prototype and model meshing gears is shown in Figure 3. The results of Figure 3a showed that the maximum equivalent stress during the meshing process of the prototype gear was 161.04 MPa, the results of Figure 3b show the maximum equivalent stress during the meshing process of the second wheel of the model was 164.36 MPa, the ratio of equivalent stress was 0.98, which is close to the relationship above similarity ratio 1 derived from the similar model, that means the similarity relationship derived in this article can be used for similar model experiments.

3. Experiment and Methods

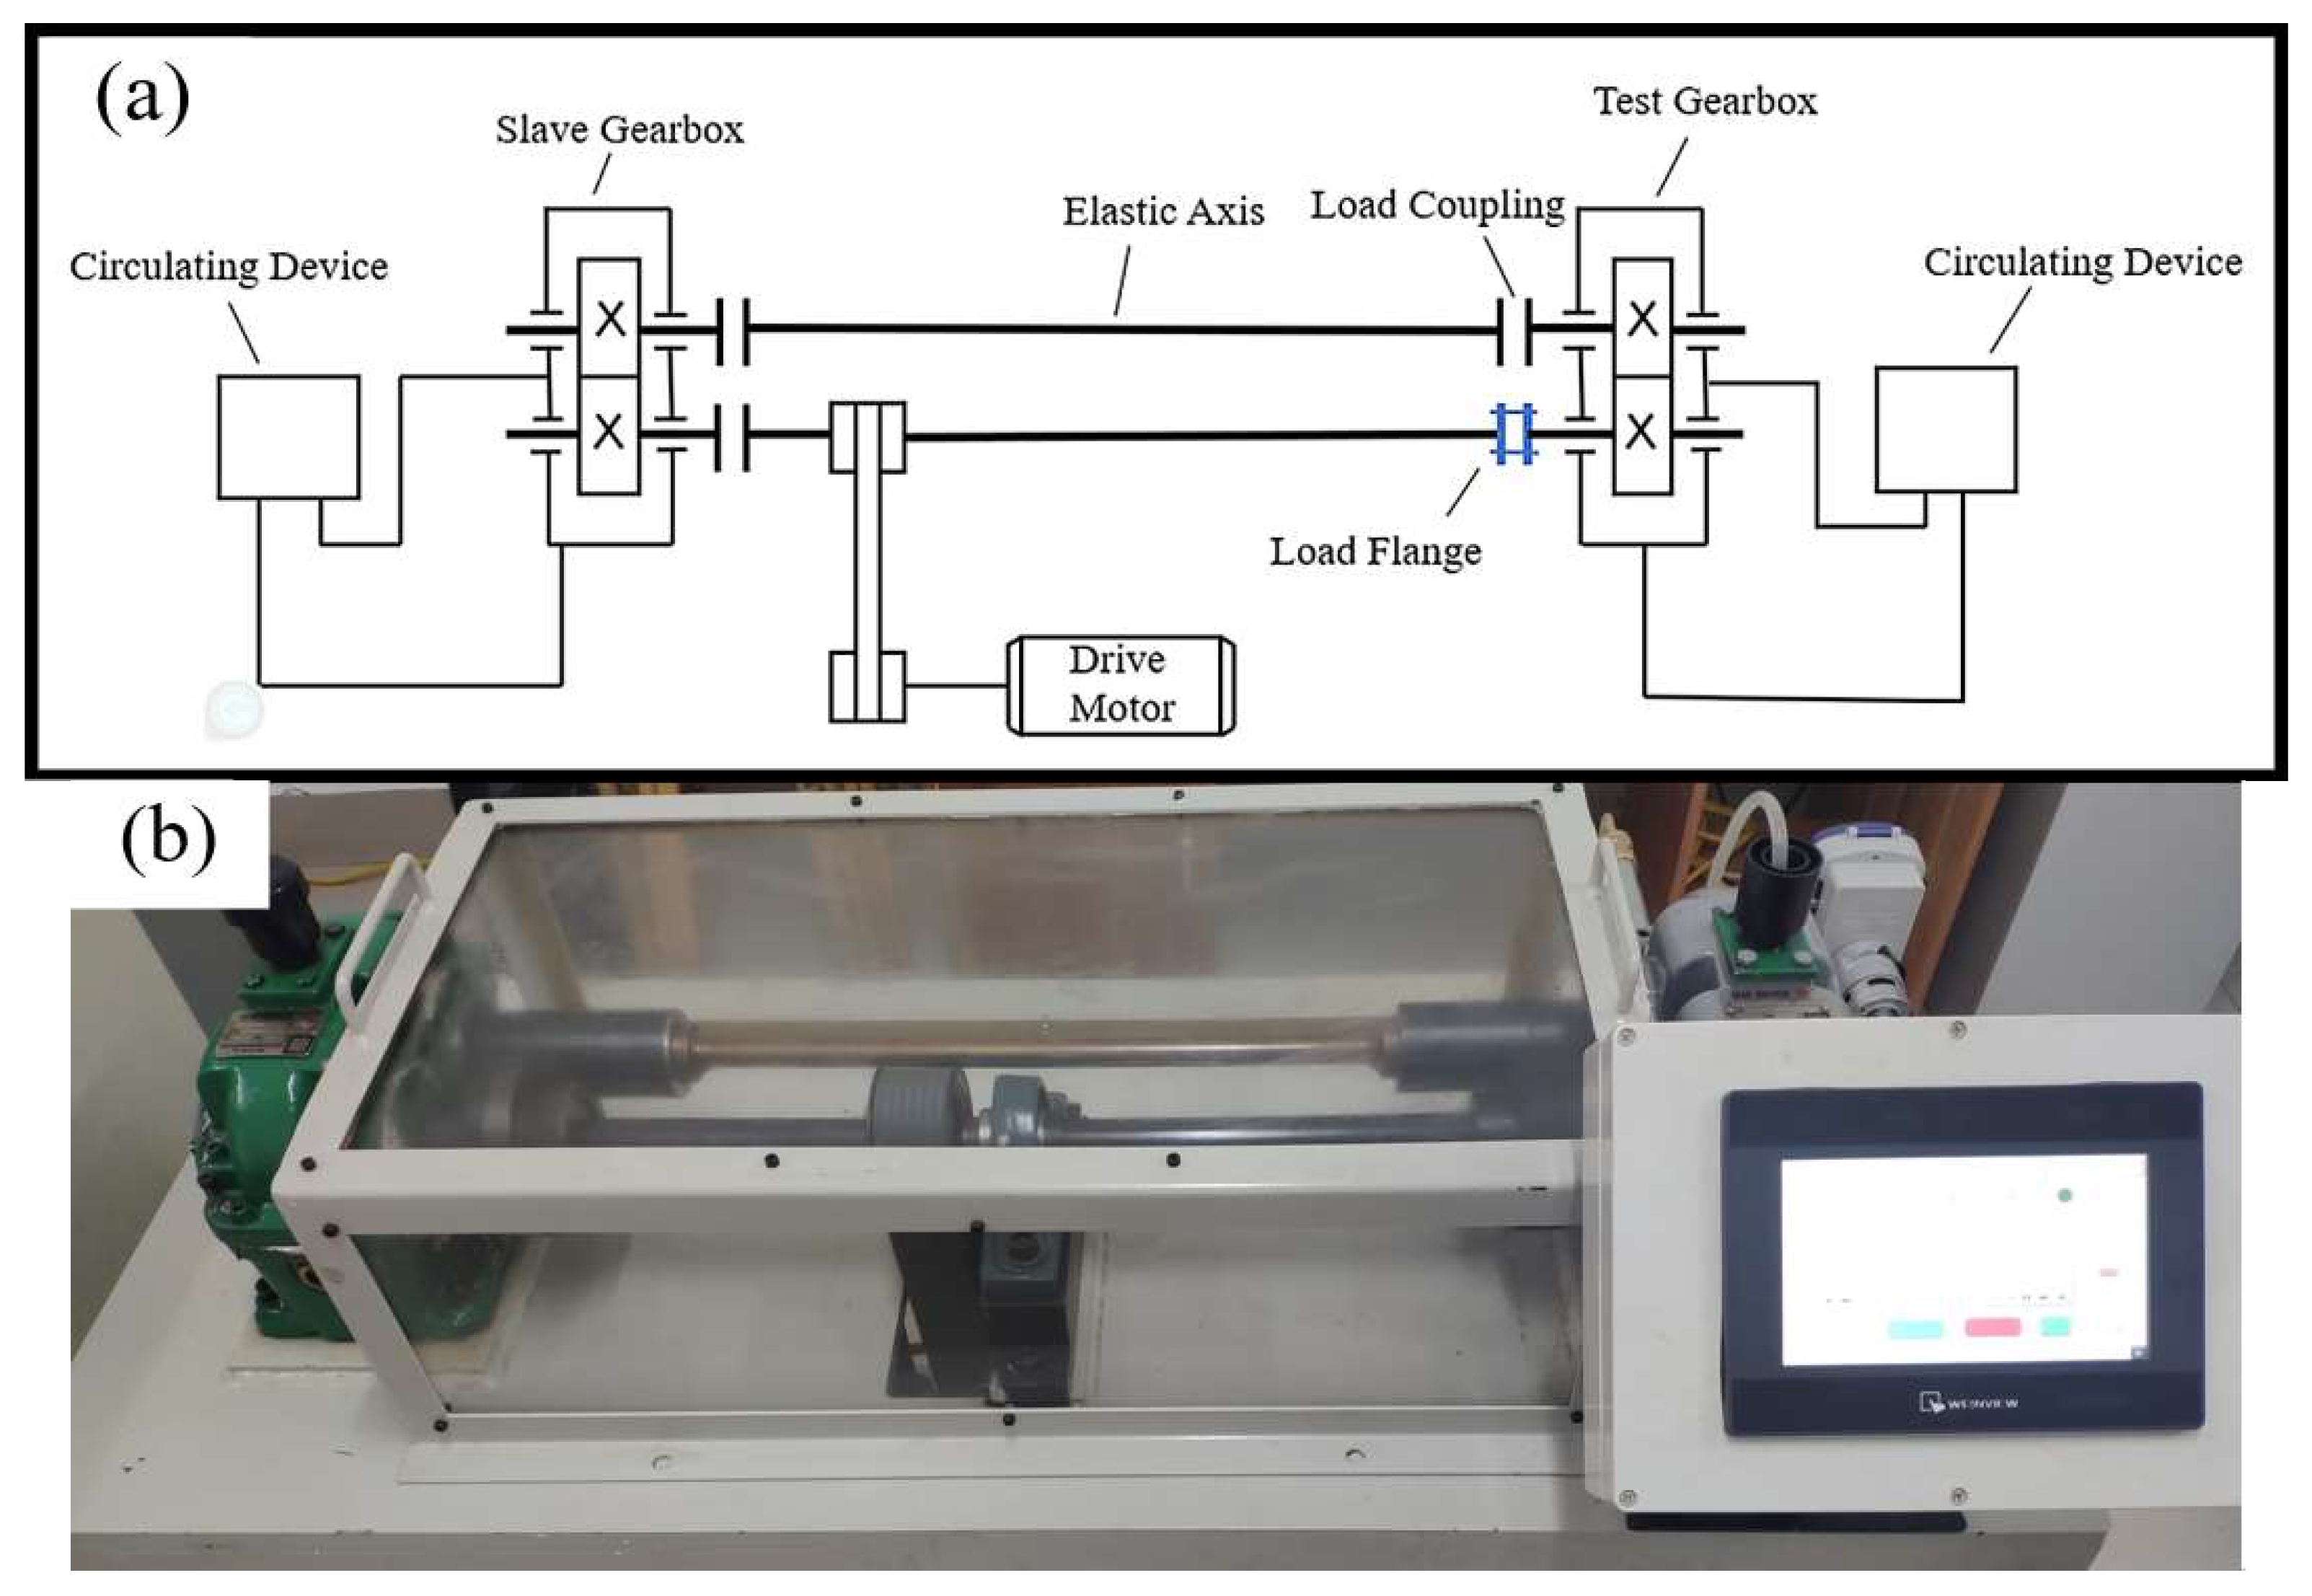
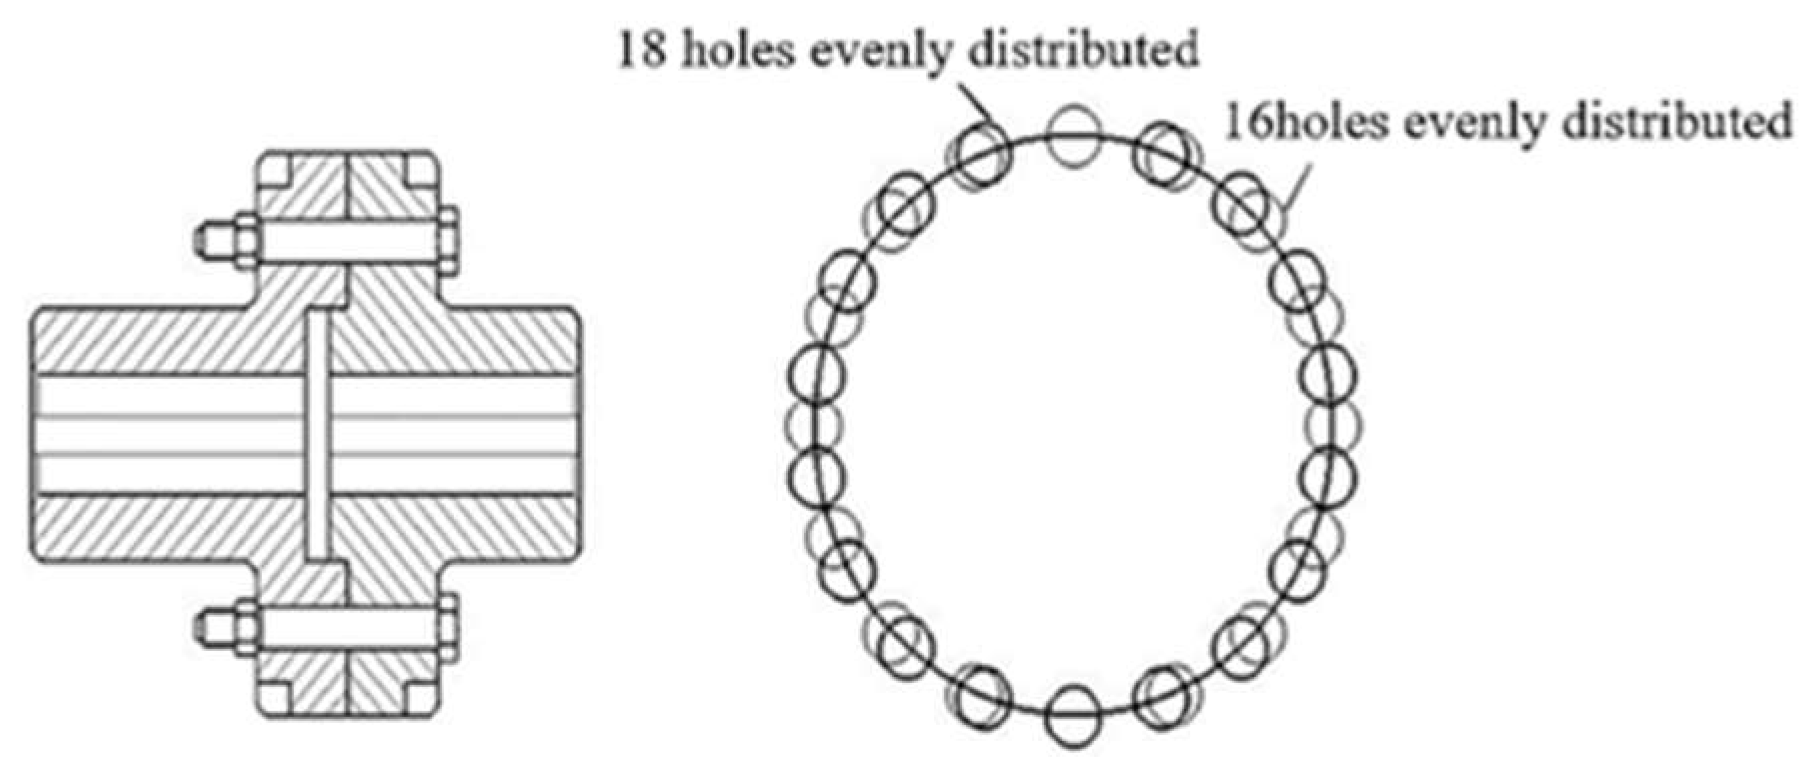
3.1. Gear Test Platform

The test platform (Figure 4) was a closed mechanical system, mainly composed of test gearboxes, slave gearboxes, loading equipment, etc. The elastic axis was connected to the gearboxes on both sides through a coupling, the load applied to the gear applies torque through the relative rotation of the loading flange.
The hole angles of the loading flange (Figure 5) differ by 2.5°. After rotating a certain angle, the threaded holes at both ends of the loading flange are aligned, and the two ends are fixed with bolts to complete the loading of the test gear. The larger the relative rotation angle between the two ends of the loading flange, the larger the loading force exerted on the test gear. The relationship between the angle of the loading flange and the loading torque is
y = 21.67943x − 14.36082
where y is the torque applied by the loading equipment, and x is the rotation angle of the loading flange.

3.2. Test Condition Set

According to the similarity ratio, two sets of comparative experiments were set up in the experiment, which was tooth width 10 mm, speed 1200 r/min, load 60 N; and tooth width 30 mm, speed 400 r/min, load 540 N. White oil with a viscosity of 32 m2/s was used as the lubricating oil in the test gearbox, whereas oil with a viscosity of 32 m2/s was used in the matching test gearbox. All the tests were full of oil bath lubrication. The experiment was planned to run for 160 h and was sampled once an hour. During the experiment, the oil in the test gearbox circulates continuously.
The test was carried out by the steps in Figure 6 for oil sample collection, processing, and testing. When the oil was being sampled, the oil circulation in the gearbox was suspended, and the circulation device was turned on, 300 mL of oil was taken out as a sample, and then an equal volume of pure lubricating oil was added to the gearbox, the total amount of lubricating oil in the gearbox remains unchanged. Since the wear characteristics of the gear in the early and late stages of operation were more obvious, the sampling time interval between the early and late stages was 1 h, and the intermediate stage was 2 h.

4. Results and Discussion

Particle count analysis was performed on the oil sample, and the curve of the number of abrasive particles per milliliter of oil sample is shown in Figure 7. Figure 7a is the trend chart of the concentration of 5–50 μm diameter particles. It can be seen that the concentration of 5–50 μm diameter abrasive particles in the 30 mm tooth width group was always slightly higher than that in the 10 mm tooth width group during the running-in period and the stable period, which was due to the larger frictional contact area of the 30 mm tooth width group. However, during the severe wear period, the abrasive particle concentration of 30 mm tooth width 5–50 μm diameter increased sharply, and the tooth was broken after about 20 h. During this period, there was a large vibration noise, and the 10 mm tooth width group was still in a stable period until the end of the experiment. Generally speaking, the concentration of large-diameter abrasive particles in the oil was low, and the increase in the concentration of large-diameter abrasive particles usually means that the gear friction and wear are severe, accompanied by severe three-body wear. Figure 7b shows the trend of the concentration of abrasive particles with large diameters of 50–100 μm. It can be seen that the diameter of 50–100 μm was higher in the initial wear stage, which was a normal phenomenon. The concentration of large-diameter abrasive particles will gradually decrease with the running-in process and maintain a normal and lower stable stage in the stable period. When the experiment was conducted for 100 h, the concentration of large-diameter abrasive particles in the 30 mm tooth width group increased rapidly, corresponding to Figure 7a and entering a severe wear period, while the 10 mm tooth width group remained stable. It can be seen from Figure 7 that the friction and wear processes of the gears determined according to the similarity ratio parameters show a similar relationship, and the running-in period and wear failure time was shortened in a similar proportion.
Figure 8 was obtained by ferrography analysis of the oil samples at Stage A, B, and C in Figure 7b. The shape of abrasive grains at the initial stage of running-in (Stage A) is shown in Figure 8a,d, with normal abrasive grains (Figure 9) being the main ones. With the continuous operation of the gear, the concentration of abrasive particles decreases continuously, and gradually trends stable at about 30 h, which indicated that the gear was in a stable wear state (Stage B), Figure 8b,e show the morphology of abrasive grains at this stage. At this stage, the abrasive grains—as well as discrete impurities and small abrasive grains with a diameter of several microns—indicate that the running-in stage has ended at this time. It is worth noting that the concentration of abrasive grains with a tooth width of 30 mm in Figure 8b was significantly higher than that of 10 mm in Figure 8e. The abrasive particle concentration of the tooth width was also reflected in Figure 7. From Stage C, the abrasive morphologies of the 30 mm tooth width group and the 10 mm tooth width group begin to show great differences, the abrasive grain chain becomes thicker and denser, which also contained more large particles, abrasive grains, many impurities, and friction polymers, abnormal abrasive grain chains and abrasive grains (Figure 10a), sliding abrasive particles generated by damage and falling due to the stress of the mixed shear layer on the surface of the gear exceeding the limit (Figure 10b), and due to the continuous extension of gear cracks, the surface material of the gear was fatigued off, resulting in a large number of fatigue flake abrasive particles (Figure 10c). The surfaces of the abrasive particles were bright and the number increases and black oxide polymers appear around the chains, illustrating that the gear has entered a very serious stage of wear. However, in Figure 8f, the abrasive grain morphology of the 10 mm tooth width group has not changed significantly, and it was still in the stable wear stage.
Experiments were continued on the 10 mm gear until the gear failed, and it was found that the 10 mm gear failed at the 318th hour (Figure 11). According to a similar theory, the gear failure time should be at the 360th hour, the failure time is 11.6% earlier than the theoretical practice. Before the failure of the 10 mm gear, an abrasive chain similar to the steady-state wear period of the 30 mm gear appeared (Figure 12a). And the abnormal abrasive particles (Figure 12b) appearing when the 10 mm gear was close to a failure were also similar to the abnormal abrasive particles when the 30mm gear was close to failure.
After the 30 mm tooth width gear failed and stopped running, the failed gear was sliced (Figure 13). The surface changes of the failed gear were observed through a metallurgical microscope and SEM. The failure and fracture position of the test gear appeared near the tooth root, and the section was uneven. Compared with the metallographic microscope photograph of the non-working surface (Figure 14b) of the test gear, the working surface of the test gear has heavier wear marks, forming deeper grooves and scratches (Figure 14a). From the metallurgical microscope photograph on the tooth surface near the index circle (Figure 14c), it can be seen that there were large areas of scratches, large flaking, and pitting. There was a large area of shedding near the tooth root, adhesive wear and adhesive phenomena (Figure 14d) indicate that the tooth root was under the greatest force. Continuous wear will cause the oil film to rupture.
Figure 15 is an SEM photograph of the surface of the failed gear. Figure 15a shows that the large and hard abrasive grains form severe scratches on the surface, and the cut surface of the abrasive grains was embedded with severe scratches. The lower right corner of Figure 15a was enlarged to obtain Figure 15b, some small pits can be seen and the distribution of the pits was circular in appearance, there was a tendency to expand each other to form larger pits. The tooth surface in Figure 15c was severely crushed, and many cracks appeared along the crack edge, more corrosion pits were developing, large pieces of material peel off at the larger cracks below, the peeling pits were filled with abrasive grains and sludge, and the filler was continuously squeezed to the surroundings under the action of the tooth surface pressure which caused the peeling pits to continue to spread around. Figure 15d shows severe fatigue wear, serious plastic flow on the tooth surface, and the material between the two grooves falls off and adheres, and gradually develops into the gully in Figure 15e. Figure 15f was an enlarged view of the edge, the material on the ditch boundary fell off and formed pits, which indicates that the ditch would continue to spread to the depths and surroundings, resulting in severe gear fractures.

5. Conclusions

Based on Buckingham pi-theorem and Hertz stress formula in dimensional analysis, the similarity ratio of each variable in the gear operation process was determined. The maximum contact stress of the tooth surface is calculated using the dynamic contact analysis model, and the Hertz theory calculation results are compared to verify the accuracy of the dynamic contact stress model of the tooth surface. Through the establishment of a gear set experiment with similar parameters, the influence of gear parameter variables on the friction and wear process was changed, and the conclusion is drawn as follows:
  • Two pairs of gears with similar parameters are established, and the finite element analysis results showed that the maximum equivalent stress ratio was 0.98, which was about 1, which showed that the similarity relationship derived from the Buckingham pi-theorem based on dimensional analysis was feasible for predicting the friction and wear process of gears in simulation.
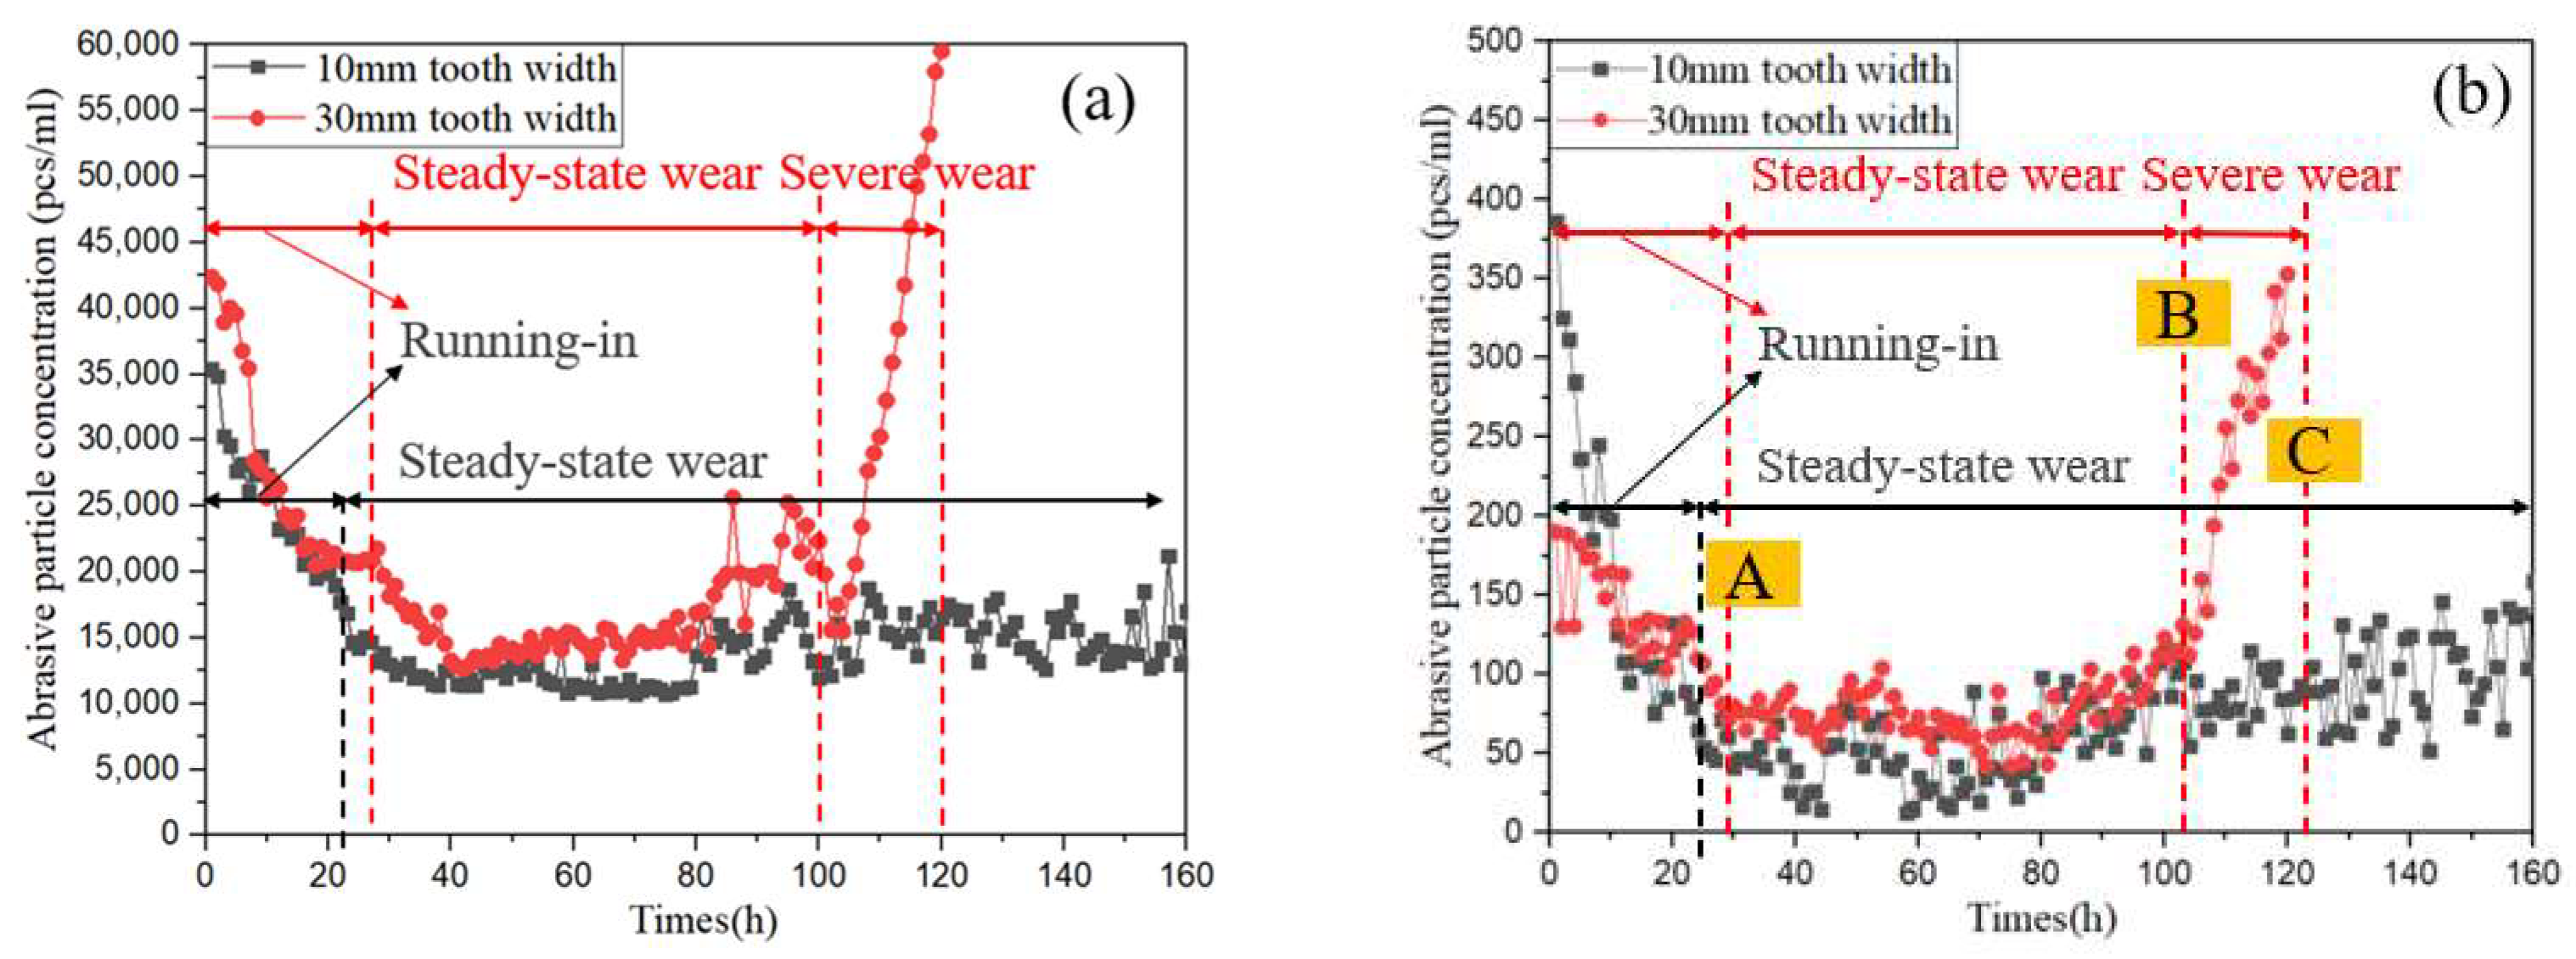
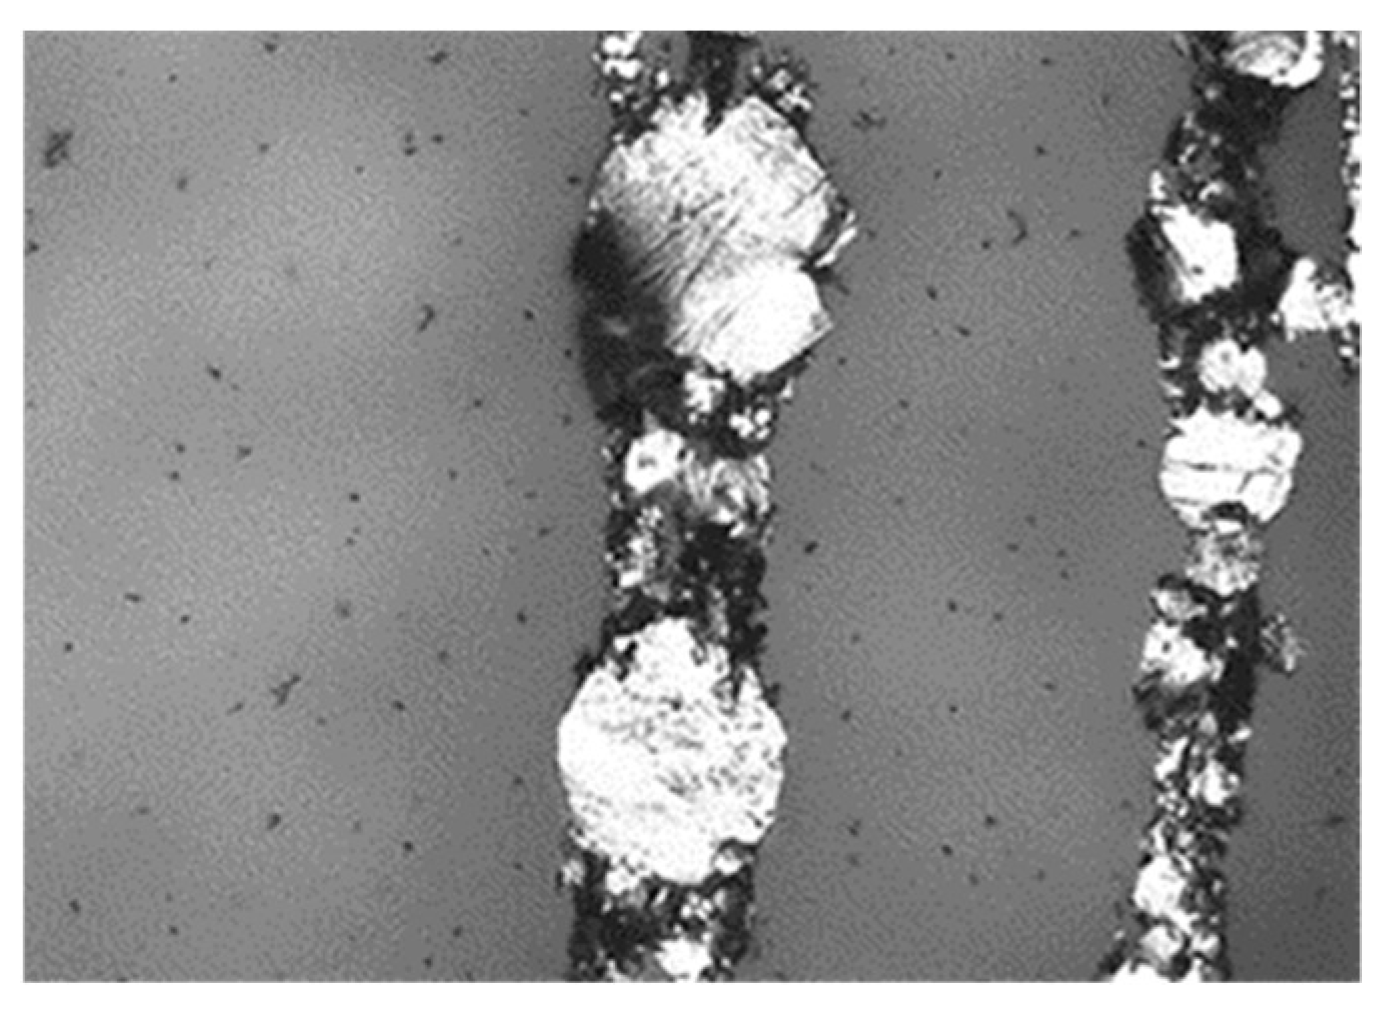
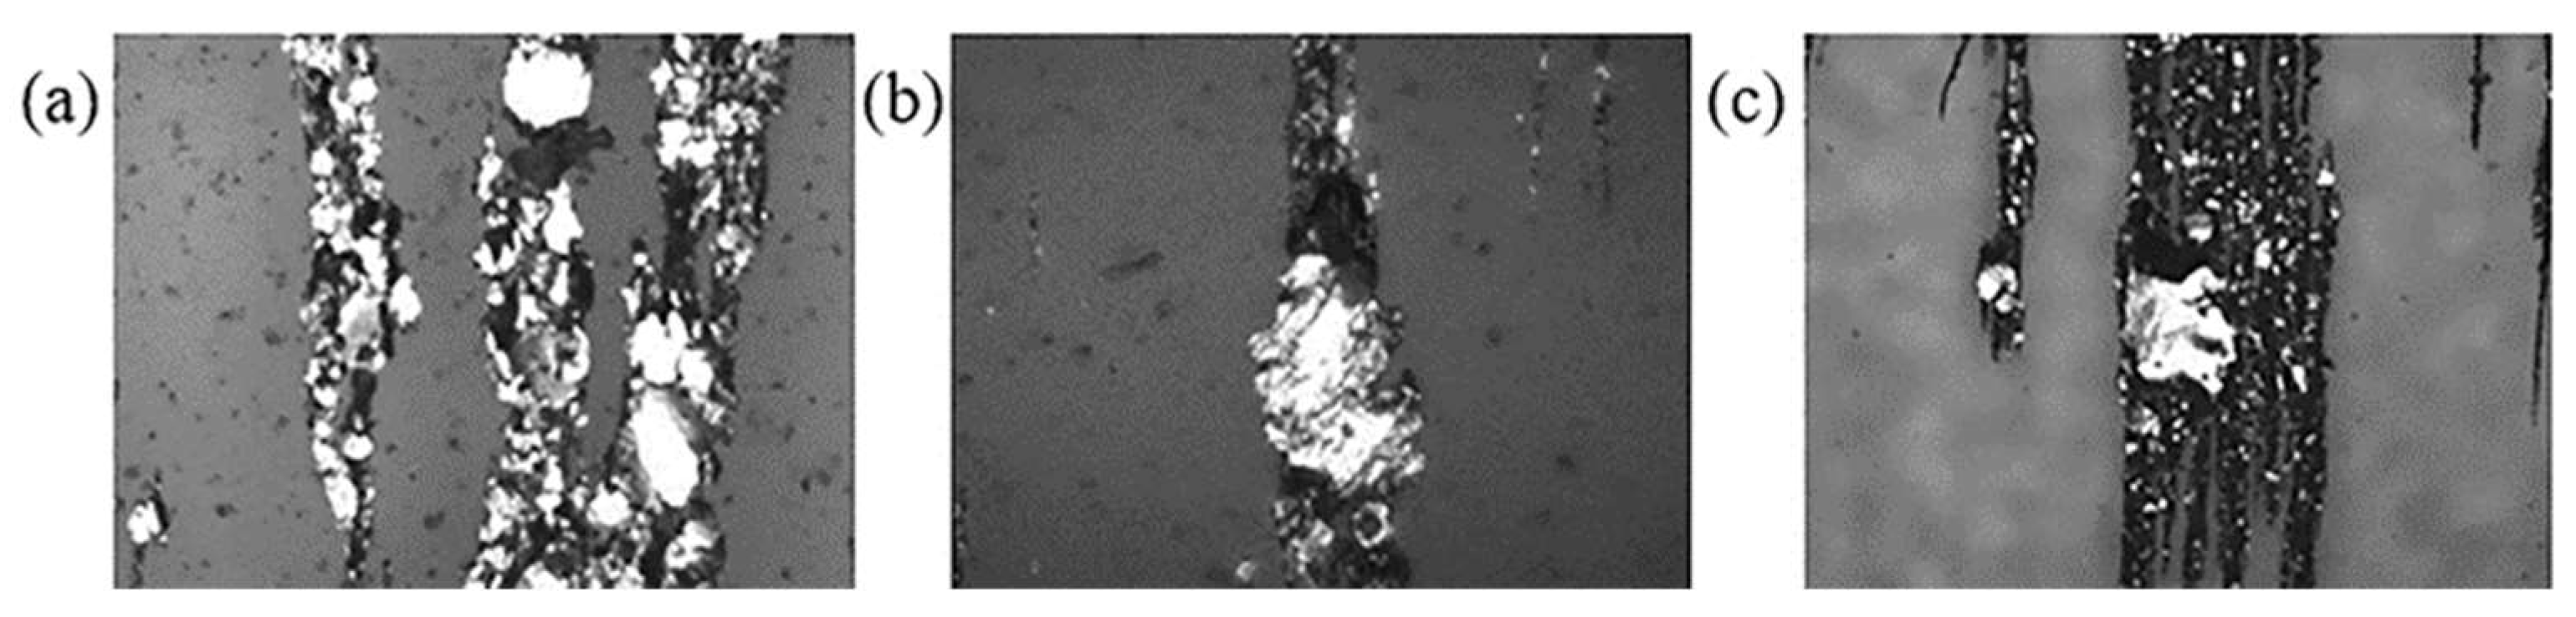
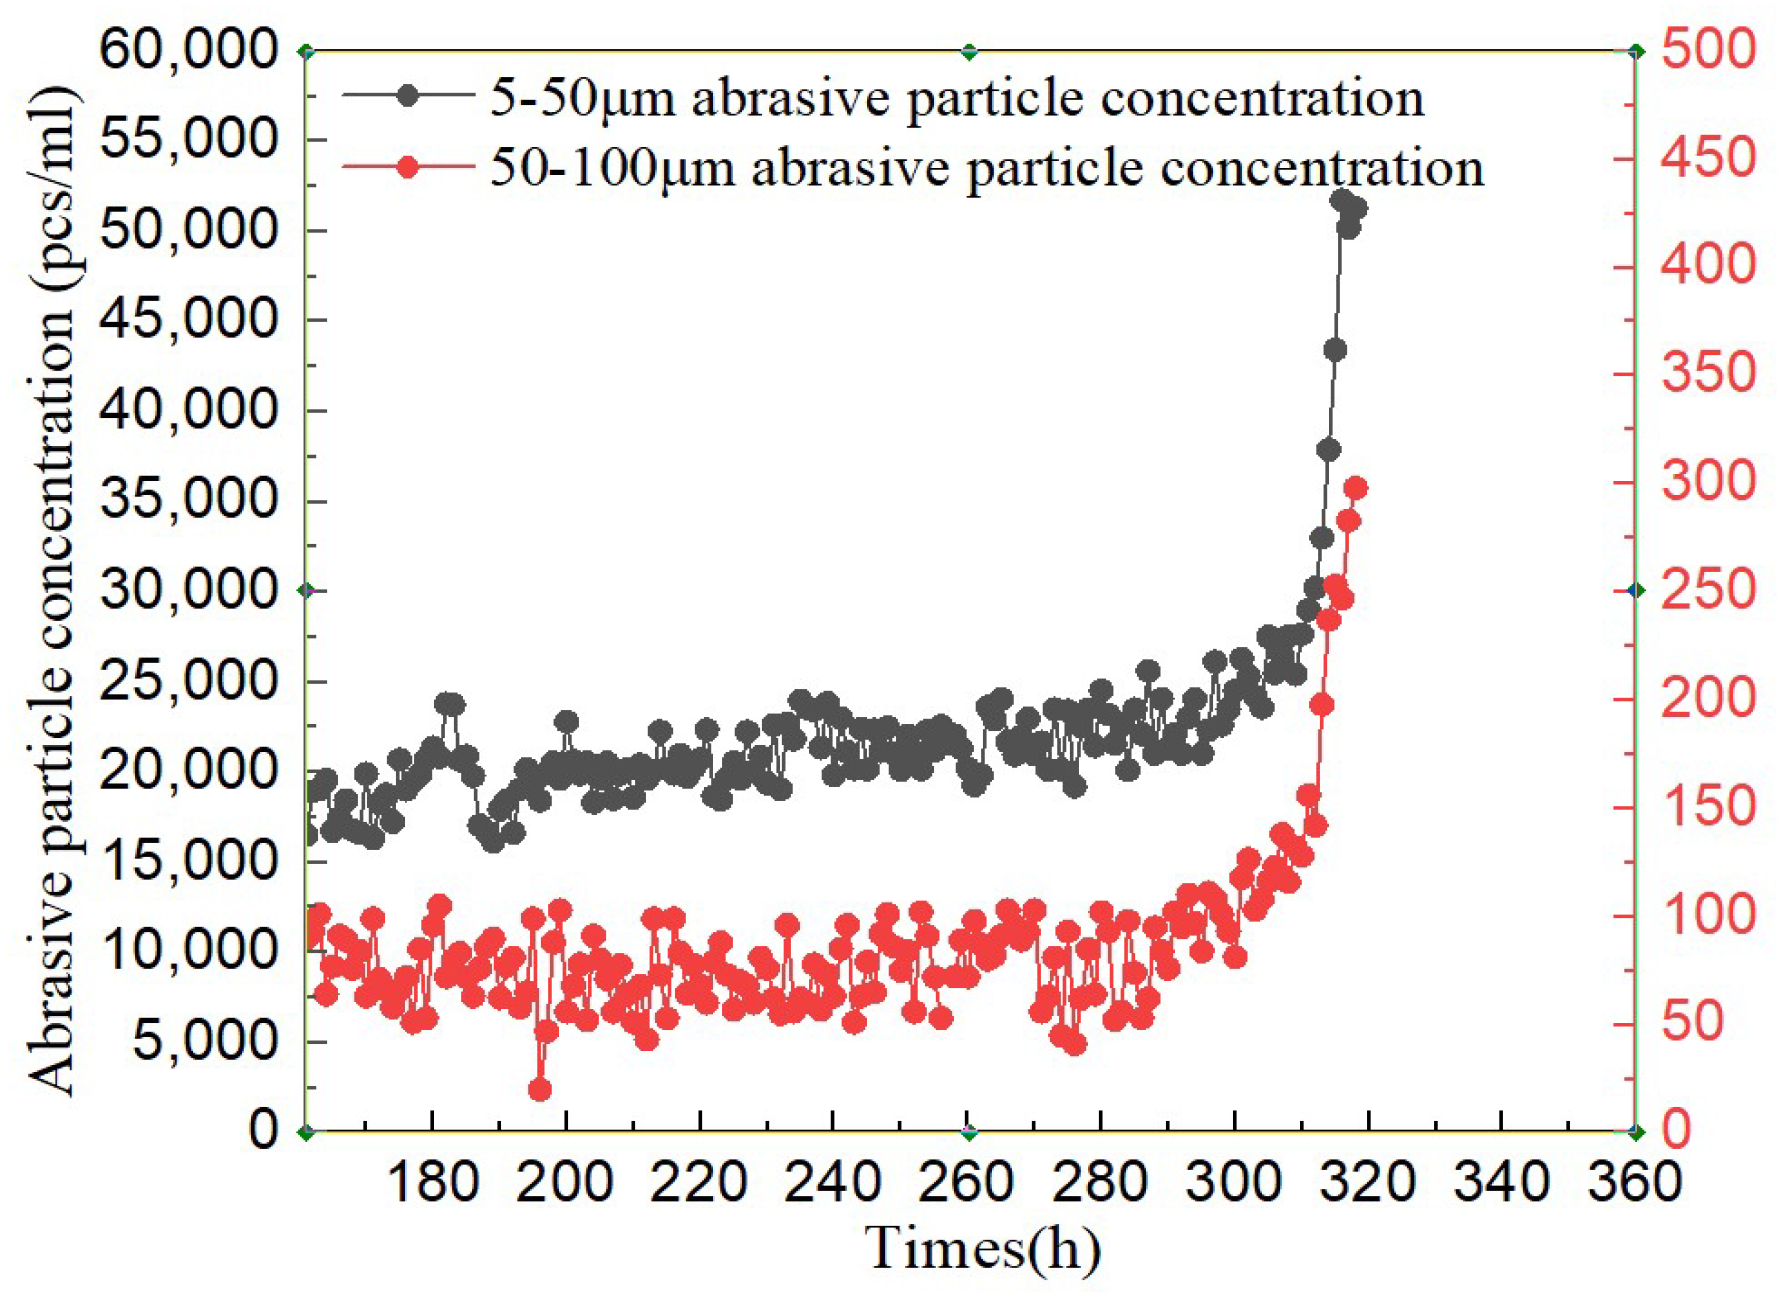
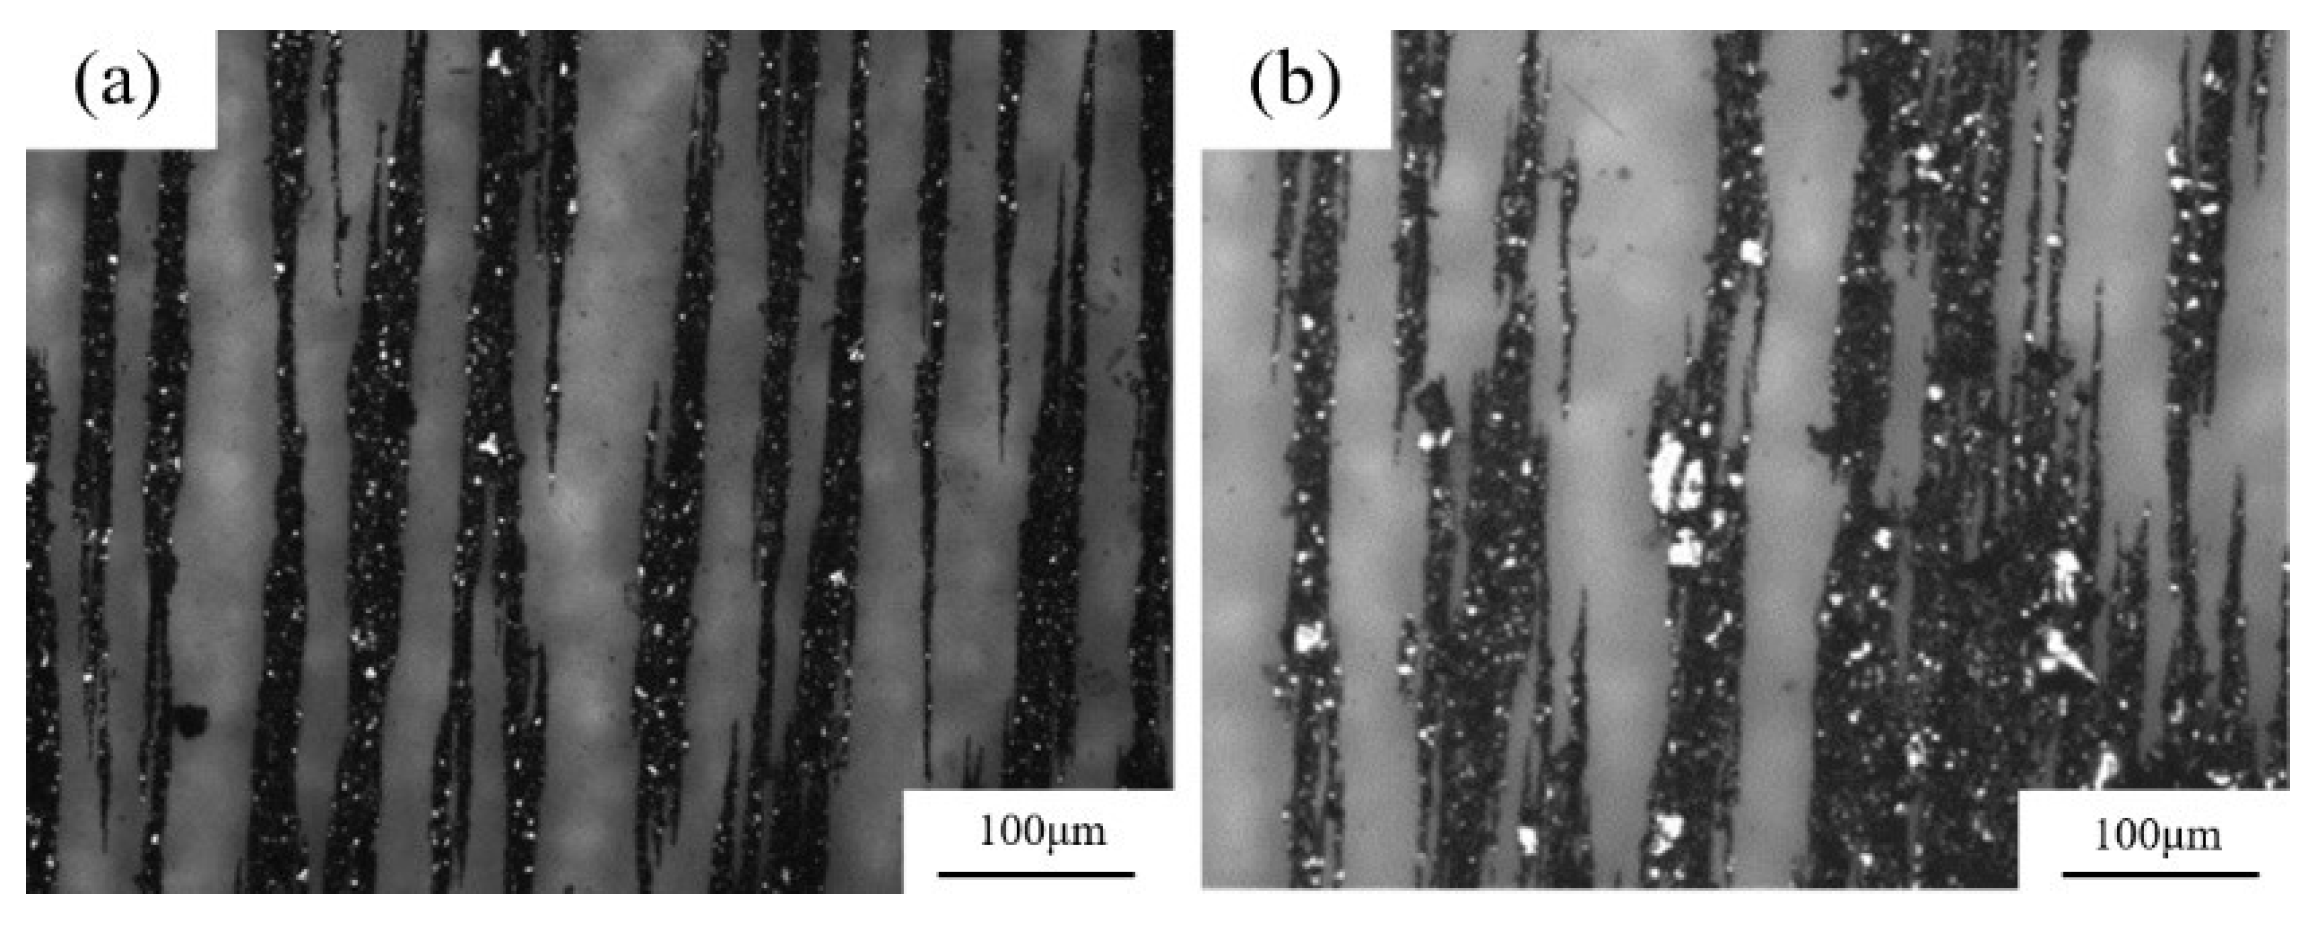
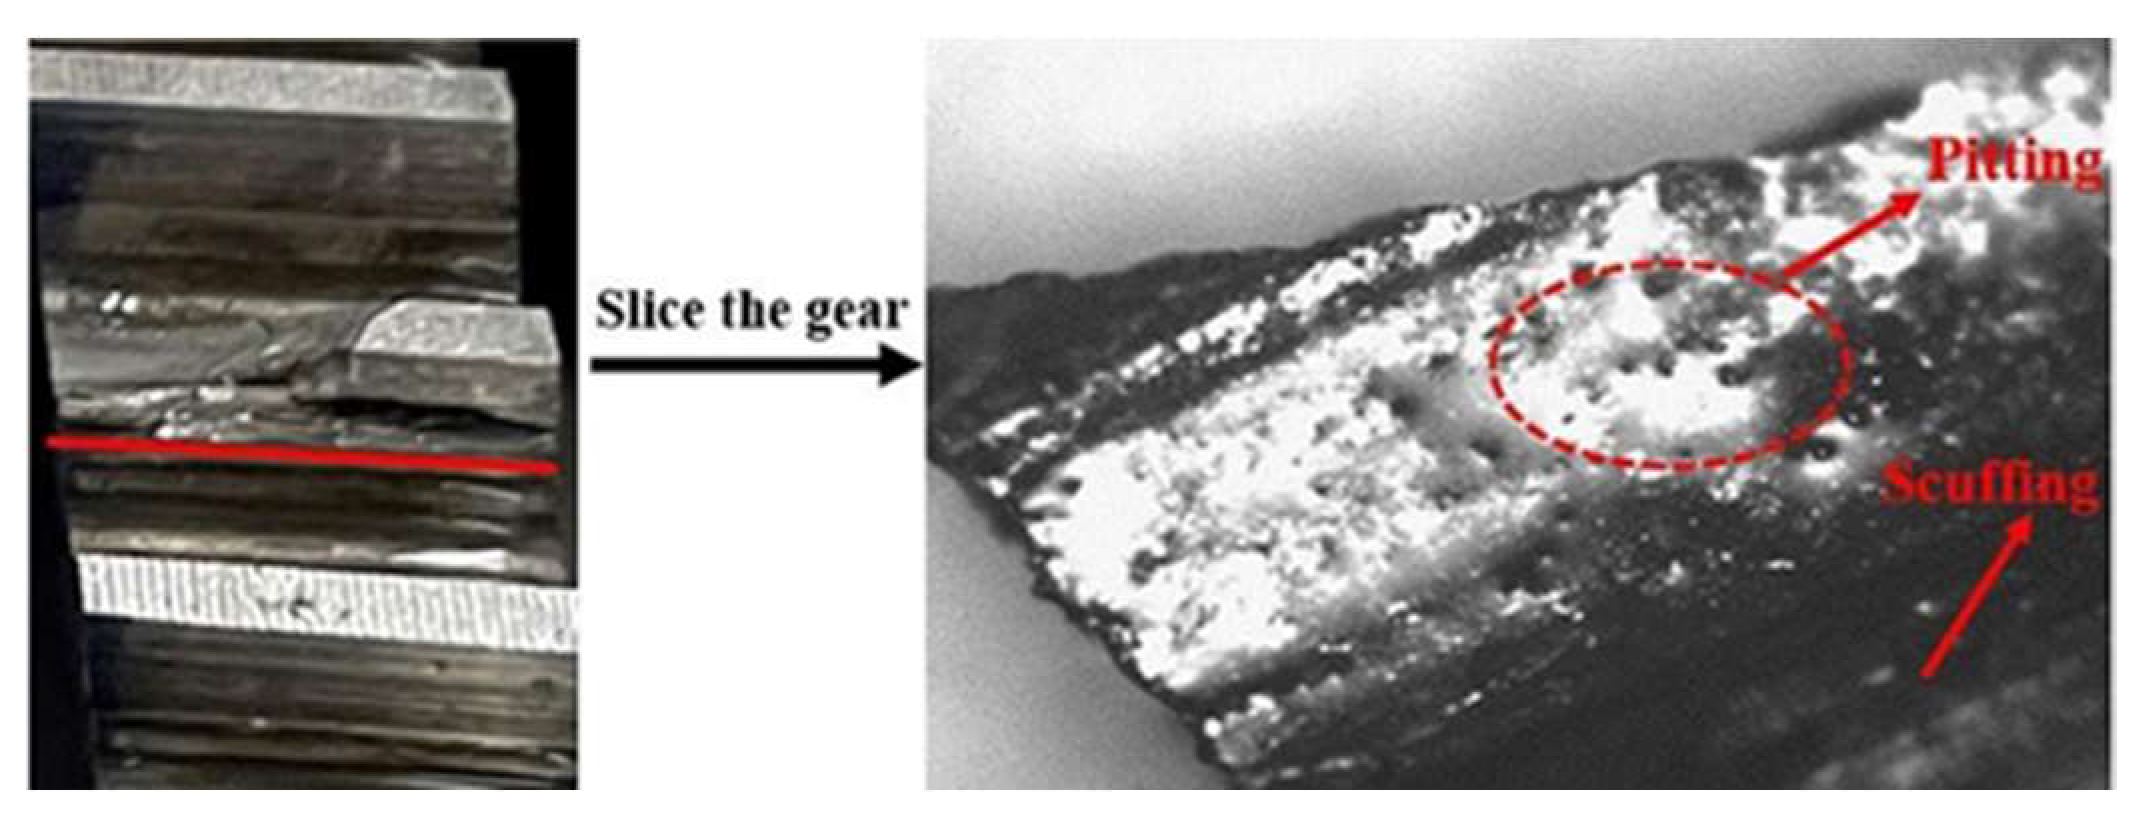
  • A gear wear test platform was established. By analyzing the change of the abrasive particle concentration in the test gear, three wear stages during the gear operation were obtained. The friction and wear process of the 30 mm tooth width gear set was shortened. Compared with the 10 mm tooth width gear and the similar ratio tend to be consistent. The wear situation reflected by the ferrogram was consistent with the three stages of abrasive particle concentration change. The increase in abrasive particle concentration during abnormal wear was related to the generation of large-sized abrasive particles.
  • By building a similar test model platform, the design and fault monitoring of similar ratio gears can be realized.
Based on the above conclusions, the similarity theory is introduced into the analysis of gear wear state, combined with the analysis of abrasive particles, the failure time can be predicted to a certain extent, which provides a new idea for the analysis of wear state of large mechanical equipment gearboxes. However, there are many uncertain factors in the actual operating environment. In the following work, the research on nonlinear factors should be expanded. The detection of abnormal abrasive particles should not be limited to the statistics of an abnormal number of abrasive particles, improving the accuracy of failure prediction.

Author Contributions

Conception and design of the study: W.W., W.Y. and X.Y. Acquisition of data: W.W., Y.Z. and H.W. Analysis and/or interpretation of data: B.C. and Y.Z. Drafting the manuscript: W.W. Revising the manuscript critically for important intellectual content: W.Y., Q.G. and B.C. Resources, funding acquisition, project administration: W.Y. and Q.G. All authors have read and agreed to the published version of the manuscript.

Funding

This work has been partly supported by the National Natural Science Foundation of China (nos. 51805299, 52075306), Key R&D project of Shandong Province (nos. 2019GGX104081, 2019GGX104033), Shandong Province’s Key Support Regions Introducing Urgently Needed Talent Projects, and Young Innovative Talents Introduction and Training Program Project of Shandong Provincial Department of Education.

Conflicts of Interest

There are no conflicts to declare. We declare that we have no financial and personal relationships with other people or organizations that can inappropriately influence our work, there are no professional or other personal interests of any nature or kind in any product, service, and/or company that could be construed as influencing the position presented in, or the review of, this manuscript.

References

  1. Yan, Y. Load characteristic analysis and fatigue reliability prediction of wind turbine gear transmission system. Int. J. Fatigue 2019, 130, 105259. [Google Scholar] [CrossRef]
  2. Nutakor, C.; Kłodowski, A.; Sopanen, J.; Mikkola, A.; Pedrero, J.I. Planetary gear sets power loss modeling: Application to wind turbines. Tribol. Int. 2017, 105, 42–54. [Google Scholar] [CrossRef]
  3. Fotso, H.R.F.; Kazé, C.V.A.; Kenmoé, G.D. Real-time rolling bearing power loss in wind turbine gearbox modeling and prediction based on calculations and artificial neural network. Tribol. Int. 2021, 163, 107171. [Google Scholar] [CrossRef]
  4. Kandukuri, S.T.; Klausen, A.; Karimi, H.R.; Robbersmyr, K.G. A review of diagnostics and prognostics of low-speed machinery towards wind turbine farm-level health management. Renew. Sustain. Energy Rev. 2016, 53, 697–708. [Google Scholar] [CrossRef]
  5. Wehrle, E.; Gufler, V.; Vidoni, R. Optimal In-Operation Redesign of Mechanical Systems Considering Vibrations—A New Methodology Based on Frequency-Band Constraint Formulation and Efficient Sensitivity Analysis. Machines 2020, 8, 11. [Google Scholar] [CrossRef]
  6. Dong, W.B.; Nejad, A.R.; Moan, T.; Gao, Z. Structural reliability analysis of contact fatigue design of gears in wind turbine drivetrains. J. Loss Prev. Process Ind. 2020, 65, 104115. [Google Scholar] [CrossRef]
  7. Hemalatha, S.; Selwyn, T.S. Computation of mechanical reliability for Sub- assemblies of 250 kW wind turbine through sensitivity analysis. Mater. Today Proc. 2020, 46, 3180–3186. [Google Scholar] [CrossRef]
  8. Ma, Y.; Cheng, J.; Wang, P.; Wang, J.; Yang, Y. A novel Lanczos quaternion singular spectrum analysis method and its application to bevel gear fault diagnosis with multi-channel signals. Mech. Syst. Signal. Process. 2021, 168, 108679. [Google Scholar] [CrossRef]
  9. Yan, X.; Liu, Y.; Xu, Y.; Jia, M. Multichannel fault diagnosis of wind turbine driving system using multivariate singular spectrum decomposition and improved Kolmogorov complexity. Renew. Energy 2021, 178, 724–748. [Google Scholar] [CrossRef]
  10. Liu, Z.; Ding, K.; Lin, H.; He, G.; Du, C.; Chen, Z. A Novel Impact Feature Extraction Method Based on EMD and Sparse Decomposition for Gear Local Fault Diagnosis. Machines 2022, 10, 242. [Google Scholar] [CrossRef]
  11. Shboul, B.; AL-Arfi, I.; Michailos, S.; Ingham, D.; AL-Zoubi, O.H.; Ma, L.; Hughes, K. Mohamed Pourkashanian Design and Techno-economic assessment of a new hybrid system of a solar dish Stirling engine instegrated with a horizontal axis wind turbine for microgrid power generation. Energy Convers. Manag. 2021, 245, 114587. [Google Scholar] [CrossRef]
  12. Shivsharan, B.A.; Magade, P.B.; Chavan, S.; Magade, S. Experimental design, development and testing of novel aluminum mini wind turbine. Mater. Today Proc. 2020, 43, 1304–1312. [Google Scholar] [CrossRef]
  13. Ajirlo, K.S.; Tari, P.H.; Gharali, K.; Zandi, M. Development of a wind turbine simulator to design and test micro HAWTs—ScienceDirect. Sustain. Energy Technol. Assess. 2021, 43, 100900. [Google Scholar]
  14. Rohrmoser, A.; Kraus, M.; Merklein, M. Forming of Components with Microgearings from Coil Material—Numerical Modeling of the Process Chain and Experimental V alidatio. Micromachines 2021, 12, 1456. [Google Scholar] [CrossRef] [PubMed]
  15. Giraud, M.; Gatumel, C.; Vaudez, S.; Nos, J.; Gervais, T.; Bernard-Granger, G.; Berthiaux, H. Investigating grinding mechanisms and scaling criteria in a ball mill by dimensional analysis. Adv. Powder Technol. 2021, 32, 2988–3001. [Google Scholar] [CrossRef]
  16. Jadhav, P.M.; Kumbhar, S.G.; Desavale, R.G.; Patil, S.B. Distributed Fault Diagnosis of Rotor-Bearing System using Dimensional Analysis and Experimental Methods. Measurement 2020, 166, 108239. [Google Scholar] [CrossRef]
  17. Patil, M.S.; Mathew, J.; Rajendrakumar, P.K.; Desai, S. A theoretical model to predict the effect of localized defect on vibrations associated with ball bearing. Int. J. Mech. Sci. 2010, 52, 1193–1201. [Google Scholar] [CrossRef]
  18. Roylance, B.J. Ferrography—Then and now. Tribol. Int. 2005, 38, 857–862. [Google Scholar] [CrossRef]
  19. Khan, M.A.; Starr, A.G. Wear debris: Basic features and machine health diagnostics. OR Insight 2006, 48, 470–476. [Google Scholar] [CrossRef] [Green Version]
  20. Pradhan, D.; Mishra, A.K. Analysis of ISO VG 68 bearing oil for condition monitoring collected from an externally pressurized ball bearing system. Mater. Today Proc. 2021, 44, 4602–4606. [Google Scholar] [CrossRef]
  21. Li, S. Experimental investigation and FEM analysis of resonance frequency behavior of three-dimensional, thin-walled spur gears with a power-circulating test rig. Mech. Mach. Theory 2008, 43, 934–963. [Google Scholar] [CrossRef]
  22. Feng, S.; Fan, B.; Mao, J.; Xie, Y. Prediction on wear of a spur gearbox by on-line wear debris concentration monitoring. Wear 2015, 336–337, 1–8. [Google Scholar] [CrossRef]
  23. Singh, D.K.; Kurien, J.; Villayamore, A. Study and analysis of wind turbine gearbox lubrication failure and its mitigation process. Mater. Today: Proc. 2020, 44, 3976–3983. [Google Scholar] [CrossRef]
  24. Marafona, J.D.; Marques, P.M.; Martins, R.C.; Seabra, J.H. Mesh stiffness models for cylindrical gears: A detailed review. Mech. Mach. Theory 2021, 166, 104472. [Google Scholar] [CrossRef]
  25. Li, S.; Kahraman, A. A scuffing model for spur gear contacts. Mech. Mach. Theory 2021, 156, 104161. [Google Scholar] [CrossRef]
Figure 1. (a) Model after meshing (b) mesh elements at the meshing of the gear teeth.
Machines 10 00474 g001
Figure 2. Force analysis diagram at different positions of the gear (a) local stress diagram, (b) stress distribution on the force surface of the large gear, (c) stress distribution on the back of the large gear, (d) root stress on the gear surface.
Machines 10 00474 g002
Figure 3. Stress distribution cloud chart (a) maximum equivalent stress of prototype gears, (b) maximum equivalent stress of model gear.
Machines 10 00474 g003
Figure 4. (a) Working principle diagram of the test platform, (b) experimental test bench.
Machines 10 00474 g004
Figure 5. Load flange and load coupling principle diagram.
Machines 10 00474 g005
Figure 6. Flow chart of oil treatment.
Machines 10 00474 g006
Figure 7. Variation trend of abrasive particle concentration (a) 5–50 μm abrasive particle concentration; (b) 50–100 μm abrasive particle concentration.
Machines 10 00474 g007
Figure 8. Ferrography of abrasive grains at different wear stages (ac, df are 30 mm tooth width, 10 mm tooth width corresponding to the ferrogram analysis of Stage A, B, and C).
Machines 10 00474 g008
Figure 9. Normal grain atlas.
Machines 10 00474 g009
Figure 10. Amplification photograph of abnormal abrasive grains (a) abnormal abrasive chain, (b) sliding abrasive, (c) fatigue flake abrasives.
Machines 10 00474 g010
Figure 11. Variation trend of abrasive particle concentration for 10 mm gear until failure.
Machines 10 00474 g011
Figure 12. Ferrography of abrasive grains for 10 mm gear at severe wear stages (a) abrasive particle diagram of 10 mm tooth width during stable wear period, (b) abrasive grain diagram of 10 mm tooth width near failure.
Machines 10 00474 g012
Figure 13. Failure gear of the end.
Machines 10 00474 g013
Figure 14. Slice diagram of 30 mm tooth width gear from tooth top to tooth root (a) the working surface of the gear, (b) the non-working surface of the gear, (c) tooth surface near the index circle, (d) adhesive wear phenomenon near the tooth root.
Machines 10 00474 g014
Figure 15. SEM photograph of gear tooth surface (a) abrasive particles embedded in the tooth surface, (b) pittings on the gear surface, (c) many pitting pits were generated at the crack edge, (d) plastic flow between two grooves, (e) serious grooves on the gear surface, (f) groove enlarged image.
Machines 10 00474 g015
Table 1. Table of physical dimensions in the system.
TypePhysical QuantitySymbolDimension
Pitch circle diameterdL
ModulusmL
Geometric featureTooth widthbL
Number of teethz--
Helix angleβ--
StressσML−1T−2
Material featureDensityρML−3
Elastic modulusEML−1T−2
Poisson’s ratioν--
LoadFMLT−2
Kinetic featureRotating speednT−1
TimetT
Table 2. MLT system dimension matrix.
dmbzβσρEυFnt
M000001110100
L11100−1−3−10100
T00000−20−20−2−11
Table 3. Dimensional matrix.
a1a2a3a4a5a6a7a8a9
M000111100
L111−1−3−1100
T000−20−2−2−11
Table 4. Buckingham pi-theorem matrix.
dmbσρEFnt
π1−110000000
π2−101000000
π300010−1000
π4−20000−1100
π51000 1 2 1 2 010
π6−1000 1 2 1 2 001
Table 5. Parameter similarity ratio.
ParametermbzβσυFnt
Similarity λ m λ b λ z λ β λ σ λ υ λ F λ n λ t
Contact λ d λ d 11 λ E 1 λ d 2 λ E 1 λ d λ E λ ρ 1 λ d λ ρ λ E
Table 6. Solver parameter settings.
Coordinate System TypeContactConstrainSolver Type
TypeLocationTypeLocation
Cylindrical
Coordinate System
Frictional:0.2Contact:
big gear
Joint-
moment
Axial surface of small gearEquivalent
stress
Interface
treatment:
adjust to touch
Target:
small gear
Axial surface of small gear
Table 7. Prototype and model gear parameter.
ParameterSymbolPrototype GearModel Gear
Pitch circle diameter (mm)d6030
Number of teethz2020
Tooth width (mm)b84
Modulus (mm)m31.5
Pressure angle (°)α2020
Helix angle (°)β1515
Publisher’s Note: MDPI stays neutral with regard to jurisdictional claims in published maps and institutional affiliations.

