
Effect of Strain Hardening and Ellipticity on Elastic–Plastic Contact Behaviour between Ellipsoids and Rigid Planes


1
School of Mechanical and Electrical Engineering, Xi’an Polytechnic University, Xi’an 710048, China
2
School of Chemical Engineering and Technology, Xi’an Jiaotong University, Xi’an 710049, China
*
Author to whom correspondence should be addressed.
Machines 2022, 10(6), 488; https://doi.org/10.3390/machines10060488
Submission received: 21 May 2022
/
Revised: 13 June 2022
/
Accepted: 15 June 2022
/
Published: 17 June 2022
(This article belongs to the Special Issue Rolling Bearing and Rotor System Modeling and Simulation, Monitoring and Control, and Performance Diagnosis)
Abstract
:The contact behaviour between an ellipsoid and a rigid plane is significant in research on bearing and assembly joint surfaces. However, an empirical relationship between an elastic–plastic ellipsoid and a rigid plane has not been established. In this study, the elastic–plastic contact behaviour between a deformable ellipsoid and a rigid plane was investigated by establishing a new finite element model. The proposed elastic–plastic ellipsoid contact model was designed considering the effects of the ellipticity and strain-hardening rate of the ellipsoid. The strain-hardening rate and ellipticity of the ellipsoid affected the contact area, load and mean pressure. Furthermore, the effect gradually increased with an increase in interference. New dimensionless empirical formulas for determining the contact load and contact area were proposed based on the analysis. The proposed model was validated by comparing the obtained results with previous experimental results and those of theoretical models. This study can be used to predict the elastic–plastic contact parameters between a single ellipsoid and a rigid body, such as bearings, gears and cams. It can also be used to investigate the elastic–plastic contact behaviour between anisotropic rough surfaces composed of asperities with different radii of curvature.
1. Introduction
The study of contact between an ellipsoid or sphere (special ellipsoid) and a rigid plane is significant for the design and maintenance of key parts of mechanical equipment [1,2,3]. The most common contact of bearings, gears and cams in mechanical equipment is equivalent to the contact between an ellipsoid and a rigid plane [4,5,6]. The surface of mechanical contact is microscopically rough and can be regarded as composed of many ellipsoidal asperities. Moreover, the contact between assembly joints at the microscopic level can be equivalent to the contact between an ellipsoidal asperity and a rigid plane [7,8,9]. The empirical relationship between the contact area, interference and load of assembly joints is of great significance for the study of friction, electrical conduction, heat conduction and wear [10,11]. The contact mechanical behaviour of assembly joints can be studied using mathematical methods such as fractal or statistics. This can extend the microscopic contact behaviour analysed between a single ellipsoid and rigid plane to the whole macroscopic contact surface [12]. Although Hertz (Hertz model) [13] gives the elastic contact solution between the ellipsoid and the rigid plane, elastic–plastic contact after the initial yield of the ellipsoid does not form a closed solution [14,15,16].
Greenwood and Williamson (GW model) [17] assumed that the contact surface is isotropic and that the asperity on the rough surface is composed of hemispherical asperities. Based on the Hertz theory [13], a contact elastic solution between the hemisphere and rigid plane was presented. Abbott and Firestone (AF model) [18] proposed a fully plastic hemispherical contact model using a truncation model. Chang et al. (CEB model) [19] proposed a hemispherical contact model based on volume conservation in the contact process between a hemisphere and rigid plane. The elastic–plastic contact behaviour was ignored in their model. Zhao et al. (ZMC model) [20] extended their work using the CEB model and used interpolation to predict the relationship between dimensionless contact parameters (contact area (A*), contact load (F*) and mean contact pressure (p*)) and the dimensionless interference (ω*) in the elastic–plastic range. Recent studies have proven that the ZMC, AF, GW and CEB models are inadequate [21,22,23]. Some researchers, such as Ovcharenko et al. [24], Bartier et al. [25] and Chaudhri et al. [26] experimentally studied the contact behaviour between a deformable sphere and a hard plane. They presented the relationship between F*, ω* and A* of copper, stainless steel and brass balls with different diameters when pressed by a sapphire plane or SiC ceramic plane (hard plane). Popov [27] studied the contact behaviour between a conical asperity and plane based on the method of dimension reduction (MDR). They found that hardness is inversely proportional to the indentation radius. Lyashenko [28] proposed a numerical model and showed the influence of the normal velocity recovery coefficient on the contact behaviour of hemispherical asperity with a deformable plane. Because the finite element method (FEM) can accurately simulate the contact behaviour between an asperity and a plane, several researchers have studied the contact behaviour of hemispherical asperities and rigid planes using the FEM.
Kogut and Etsion (KE model) [29] established a hemisphere-contact FE model. Empirical formulas for predicting elastic–plastic contact parameters were presented based on finite element analysis (FEA) results. The model was relatively simple; however, the disadvantage was its discontinuity. Jackson and Green (JG model) [30] presented a formula to predict the initial yield of a hemisphere in contact with a rigid plane. This was used to evaluate the convergence of the FE model and normalize the FEA results. They extended their work using the KE model and presented continuous formulas. However, this formula was complicated because continuity was guaranteed. Subsequently, Quicksall et al. [31] confirmed the validity of the KE and JG models for materials with different elastic–perfectly plastic properties.
Most materials used in engineering are elastic–plastic materials, considering that the strain hardening rate and the tangent modulus (Et) are not zero [32]. The JG and KE models predicted the hemispheric contact parameters of elastic–perfectly plastic materials without considering the effect of Et. Shankar and Mayuram (SM model) [33,34] extended the work predicted by the JG and KE models and analysed the effect of Et on the contact behaviour of a hemisphere with a rigid plane. They determined the deviation between the contact behaviour of the hemisphere and rigid plane under general elastic–plastic (Et ≠ 0) and elastic–perfectly plastic (Et = 0) contact conditions. In addition, their prediction results were compared with experimental results, which verified the feasibility of their hemispherical FE model.
This hemispherical contact model was mainly based on the assumption of isotropic contact on a rough surface. Different machining methods can produce asperities with different curvatures because rough surface textures are oriented according to the direction of the tool’s motion relative to the rough surface [35]. Bush et al. [36] speculated that a rough surface consists of ellipsoidal asperities with an anisotropic distribution. Some researchers, such as Horng [37], Jamari and Schipper [38], Wen and Tang et al. (WT model) [39,40] and Jeng and Wang (JW model) [41] extended the hemispheric model of Chang and Zhao et al. [19,20] to the contact of ellipses to consider the influence of asperity anisotropy. However, the effects of ellipsoid ellipticity (ke) were ignored in the prediction results. Chung [42] established a three-dimensional (3D) elastic–perfectly plastic ellipsoid contact FE model and analysed the evolution behaviour of the plastic zone at the contact area of the ellipsoid with varying ke. However, an expression for predicting the contact parameters was not provided. Li and Zhou et al. [43] established a 3D semi-analytical model of the contact between a rigid ellipsoid and a deformable plane and studied the von Mises stress evolution. Notably, the contact behaviour of the rigid ellipsoid pressing the deformable plane was different from that of the rigid plane pressing the deformable ellipsoid. Jackson and Kogut [44] demonstrated this. Becker and Kamlah [45] studied the contact behaviour between lithium nickel manganese cobalt oxide ellipsoids during loading and unloading. They presented the relationship of the force–interference. Lin and Lin (LL model) [46] established an FE model for the contact between an ellipsoid and rigid body. They presented a formula to predict the initial yield of the ellipsoid during contact. This was used to evaluate the convergence of the FE model. Furthermore, they concluded that the contact parameters and elastic–plastic range were related to the ellipticity of the ellipsoid. However, the effect of the tangent modulus on the contact parameters was ignored in their study.
Thus, an empirical relationship between an elastic–plastic ellipsoid and a rigid plane has not been established. This can be done based on the FE model of the structures under different tangent moduli and ellipticities of the ellipsoid. In this study, based on the FEM, the effect of the tangent modulus on the ellipsoid elastic–plastic contact parameters between the ellipsoid and rigid plane under different ellipticities of the ellipsoid was investigated. The values selected in this study were E, 0.1E, 0.075E, 0.05E, 0.025E and 0. The effects of varying E, Y and ν on the relationship between elastic–plastic contact parameters have been neglected in the present study. The main reason is that it has been proven in previous models [47,48,49] that when ω* is less than 150, varying E, Y and ν has little influence on the relationship between elastic–plastic contact parameters. The empirical relationships amongst the dimensionless interference, contact load and contact area in the contact process between an ellipsoid and rigid body are presented based on the analysis. The accuracy of the current work was verified by comparison with previous models and experimental results. This study can be used to predict the elastic–plastic contact parameters between a single ellipsoid and a rigid body, such as bearings, gears, and cams. It can also be used to investigate the elastic–plastic contact behaviour between anisotropic rough surfaces composed of asperities with different radii of curvature.
2. Numerical Model
The ellipsoid was in contact with the rigid flat before and after, as shown in Figure 1. Variables cR (1 ≤ c ≤ ∞) and R are the lengths of the semi-major and semi-minor axes of an ellipsoid, respectively. The ellipticity of the ellipsoid is defined as ke, ke = R/(cR) = 1/c. The ellipticities used in this study were ke = 1/5, 1/2 and 1. The LL model [46] presented critical contact parameters corresponding to the initial yield of the ellipsoid. This was used to determine the convergence of the FE model. However, to obtain a generalized solution, all the contact parameters in their study were normalized using the critical contact parameters corresponding to the initial yield of the hemisphere. The same dimensionless scheme was adopted in this study: ω* = ω/ωs, F* = F/(Fs∙c1/2), A* = A/(As∙c), p* = F*/A* and p/Y = F/(AY). The ωs, Fs and As are the critical deformation, contact load and contact area corresponding to the initial yield of the hemisphere, respectively. They are presented by the JG model [30], expressed as follows
where ν, E and Y are Poisson’s ratios, Young’s modulus and yield strength of the hemisphere, respectively.
A 3D ellipsoid contact model was established using the commercial software ANSYS 18.2 Workbench to simulate frictionless normal contact between an ellipsoid and a rigid body. Using the symmetry of the model, as shown in Figure 2, the complete ellipsoid contact problem was simplified to a 1/8 ellipsoid contact with a rigid body, saving calculation time. The following boundary conditions were applied to the ellipsoid model to simulate the contact of the ellipsoid with the rigid flat: The nodes on the cuboid were constrained in all the directions. A downward uniform displacement of 150 ω* was loaded onto the upper surface of the ellipsoid in 300 sub-steps. The nodes on the ellipsoid symmetry planes x = 0 and z = 0 in the x and z directions, respectively, were constrained. Ellipsoids with ellipticities of 1/5, 1/2 and 1 were considered in this study. The corresponding material parameters are listed in Table 1. The material yield strength (Y), Poisson’s ratio (ν) and Young’s modulus (E) were 0.7 GPa, 0.3 and 207 GPa, respectively. The stress–strain (σ–ε) curves of isotropic materials are shown in Figure 3. The stress-to-strain ratio in the elastic range is the E of the material. The σ in the elastic range of the material was less than Y. The σ increases with ε, and the material initially yields when σ equals Y. For an elastic–perfectly plastic (Et = 0) material without strain hardening, the σ after initial yield is equal to Y. However, few materials exhibit elastic–perfectly plastic properties. Usually, owing to strain hardening, σ will exceed Y after initial yielding [33]. The Et values selected in this study were E, 0.1E, 0.075E, 0.005E, 0.025E and 0. For the pure elastic material (Et = E), we only defined the elastic modulus (E = 207GPa) and Poisson’s ratio (ν = 0.3) in the material parameter setting. High-order, 3D, 10-node SOLID187 elements were used to discretize the FE model. The total numbers of nodes corresponding to ellipsoids with ellipticities of 1/5, 1/2 and 1 were 1,735,351, 1,454,265 and 1,111,001, respectively. The mesh of the contact tip accounted for 60% of the entire mesh. It was found that solution accuracy could not be improved significantly by excessively increasing the number of nodes. To allow negligible penetration between contact surfaces, the contact stiffness coefficient was set to 50–100. Because this contact problem made the analysis highly nonlinear, a large deflection was activated, and the augmented Lagrange algorithm was selected. The augmented Lagrange algorithm is regarded as an improvement of the iterative series penalty algorithm. For this algorithm, the Lagrange multiplier algorithm will be used if the penetration is greater than the defined tolerance in the contact. This guarantees that the penetration of the convergent solution is less than the specified tolerance [30]. For the difficult convergence problem, the iterative scheme was selected, and the maximum and minimum sub-steps were set to 5000–20. The finite element numerical solutions were compared with the Hertz solution, as listed in Table 2. The deviation between the current numerical and Hertz results was within 3%.
3. Numerical Results and Discussion
3.1. Contact Parameters
The elastic–plastic contact parameters were extracted from the FEA results and normalized. The present analysis covered the effect of the ellipticity (ke) of an ellipsoid and tangential modulus (Et) on the mean contact pressure to yield strength ratio (p/Y) dimensionless contact load (F*), dimensionless mean contact pressure (p*) and dimensionless contact area (A*) at a large interference (ω* ≤ 150). The purpose of this study was to fit the empirical relationship by analysing the relationship between different contact parameters based on the FEA results.
The relationship between F* and ω* was calculated for ke = 1/5, 1/2 and 1 at Et/E = 0, 0.025, 0.05, 0.075, 0.1 and 1 at ω* ≤ 150. Figure 4a shows the relationship between F* and ω* for the three different values of ke at Et/E = 0.025. A similar trend was observed for Et/E = 0, 0.05, 0.075, 0.1 and 1. F* increases with an increase in ω* for all values of ke. The effect of Et on the relationship between F* and ω* at ke = 1/2 is plotted in Figure 4b. A similar trend was observed at ke = 1/5 and 1. The effect of Et on F* gradually increased with an increase in ω*. A possible reason for this is that strain hardening occurs after the ellipsoid’s initial yielding, increasing the strength of the plastic zone relative to the yield strength of the original material. The greater the value of Et of the material, the greater is the increase in the strength of the plastic zone. Therefore, the larger the value of Et, the stronger is the resistance to interference. Therefore, for the same ω*, the larger is the value of Et, the larger is the value of F*. At ω* = 150, F* deviation between an Et of 0.025E and 0.1E reached 15.38%. It is clear from Figure 4a,b that the effects of ke on F* were greater than those of Et. Since the Et of most engineering materials is less than 0.1E, this paper only predicts the relationship between F* and ω* at 0 < Et/E ≤ 0.1. The relationship between F* and ω* was fitted using the FEA results as follows:
The relationship between A* and ω* was calculated for ke = 1/5, 1/2 and 1 at Et/E = 0, 0.025, 0.05, 0.075, 0.1 and 1 at ω* ≤ 150. Figure 5a shows the relationship between A* and ω* for ke = 1/5, 1/2 and 1 at Et/E = 0.025. A similar trend was observed for Et/E = 0, 0.05, 0.075, 0.1 and 1. A* increased with an increase in ω* for all values of ke. Figure 5b shows the relationship between A* and ω* for the six different values of Et at ke = 1/2. The effect of Et on A* gradually increased with an increase in ω*. As mentioned earlier, the larger the value of Et, the stronger is the resistance to interference. Therefore, for the same ω*, a larger Et corresponded to a smaller A* value. At ω* = 150, the A* deviation between Et of 0.025E and 0.1E reached 11.55%. It is clear from Figure 5a,b that the effects of ke on A* were slightly greater than those of Et. Since the Et of most engineering materials is less than 0.1E, this paper only predicts the relationship between A* and ω* at 0 < Et/E ≤ 0.1. The relationship between A* and ω* was fitted using the FEA results as follows:
The relationship between A* and F* was calculated for ke = 1/5, 1/2 and 1, at Et/E = 0, 0.025, 0.05, 0.075, 0.1 and 1 at F* ≤ 1200. Figure 6a shows the relationship between A* and F* for the three different values of ke. Here, only the results at Et/E = 0.025 for ke = 1/5, 1/2 and 1 were analysed. Similar results were observed for other Et values. A* increased with an increase in F* for all values of ke. Figure 6b shows the relationship between A* and F* for different values of Et at ke = 1/2. The effect of Et on A* increased with an increase in F*. As mentioned earlier, the larger the value of Et, the stronger is the resistance to interference. Therefore, for the same F* value, a larger Et corresponded to a smaller A* value. Since the Et of most engineering materials is less than 0.1E, this paper only predicts the relationship between A* and F* at 0 < Et/E ≤ 0.1. The relationship between A* and F* was fitted using the FEA results as follows:
The relationship between p* and ω* was calculated for ke = 1/5, 1/2 and 1 at Et/E = 0, 0.025, 0.05, 0.075, 0.1 and 1 at ω* ≤ 150. Figure 7a shows the relationship between p* and ω* for ke = 1/5, 1/2 and 1 at Et/E = 0.025. A similar trend was observed for Et/E = 0, 0.05, 0.075, 0.1 and 1; p* increased with an increase in ω* for all values of ke. To explore the influence of varying Et on the relationship between p* and ω*, only the results of ke = 1/2 for Et/E = 1, 0.1, 0.075, 0.05, 0.025 and 0 are plotted in Figure 7b; p* increased with an increase in ω*. The trend was similar for the six different Et values. However, their magnitudes were different. For the same ω*, the greater the value of Et, the greater the value of p*.
The relationship between p/Y and ω* was calculated for ke = 1/5, 1/2 and 1 at Et/E = 0, 0.025, 0.05, 0.075, 0.1 and 1 at ω* ≤ 150. To explore the influence of varying Et on the relationship between p/Y and ω*, only the results of ke = 1/2 for Et/E = 1, 0.1, 0.075, 0.05, 0.025 and 0 are plotted in Figure 8a; p/Y increased with an increase in ω*. The trend was similar for the six different Et values. However, their magnitudes were different. For the same ω*, the greater the value of Et, the greater the value of p/Y. The corresponding ω* when p/Y reaches 2.8 is shown in Figure 8b. The KE model predicts that the contact state changes from elastic–plastic to fully plastic contact when p/Y reaches 2.8. They concluded that the ω* corresponding to p/Y of 2.8 is a constant 110, independent of the shape and the material of asperity. It can be observed in Figure 8b that when p/Y reaches 2.8, the corresponding ω* is not a constant 110, but depends on the ke and Et of the ellipsoid. The current results show that the transition from elastic–plastic to fully plastic does not act at constant ω* as predicted by the KE model.
3.2. Comparison with Experimental Results
Ovcharenko et al. [24] experimentally presented the variation in the contact area of copper and stainless-steel balls pressed by a sapphire plane (hard plane) under varying loads. Chaudhri et al. [26] experimentally demonstrated the relationship between the contact area and load in the contact between a brass ball and sapphire plane. The balls used in their experiment were work-hardened to make them behave as an elastic–perfectly plastic material (Et = 0) when in contact with the hard plane. To verify the correctness of the present study, Equations (8) and (9) at ke = 1 and Et/E ≤ 0.03 were compared with the experimental results of Ovcharenko et al. [24] and Chaudhri et al. [26], as shown in Figure 9. The current results slightly underestimated the experimental prediction results with an increase in interference. This may be because the ball used in the experiment behaved as an elastic–perfectly plastic material (Et = 0) after the hardening treatment. Additionally, Equations (8) and (9) were derived from the analysis of general elastoplastic materials (Et ≠ 0). As shown in Figure 9, the prediction results of Equations (8) and (9) at low Et values were consistent with the experimental results.
Bartier et al. [25] experimentally presented the variation in the contact load of an AISI 4135 steel plane (E = 210GPa, Y = 472 MPa, ν = 0.3, ε = Y(n−1)/nσ1/n/E and n = 0.105) pressed by a carbide ball under varying interference. To verify the correctness of the current study, Equations (4) and (5) at ke = 1 and 0.07 ≤ Et/E ≤ 0.1 were compared with the experimental results of Bartier et al. [25], as shown in Figure 10. The current prediction results were consistent with the experimental results.
3.3. Comparison with Previous Numerical Models
The ellipsoid with ke = 1 corresponds to hemispheric contact. Hemispheric contact behaviour has been widely studied. The JG and KE models predicted the hemispherical contact parameters of elastic–perfectly plastic materials. The Lyashenko model predicted the hemispherical contact behaviour of plastic materials. The SM model predicted the hemispherical contact behaviour of elastic–plastic materials (considering strain hardening). The experiments verified the correctness of the model. To confirm the rationality of the current ellipsoid model, it was compared with the SM, JG, Lyashenko and KE models at ke = 1. As shown in Figure 11, the F* values predicted by the present ellipsoid model at ke = 1 were compared with the results of the previous models. As interference increased, the prediction results of the KE and JG models based on elastic–perfectly plastic materials were lower than the current prediction results (considering the strain-hardening behaviour), and the prediction results of the Hertz model based on elastic materials were higher than the current prediction results. The deviation between the present and JG models increased with an increase in ω* for ke = 1; this was larger for a larger ω*. At ω* = 150, the F* deviation between the present and JG models was 11.21% at Et = 0.025E and 27.63% at Et = 0.1E. The SM model predicted the variation in F* with ω* relatively well under different Et values. However, the effect of ke on contact behaviour was ignored in their study.
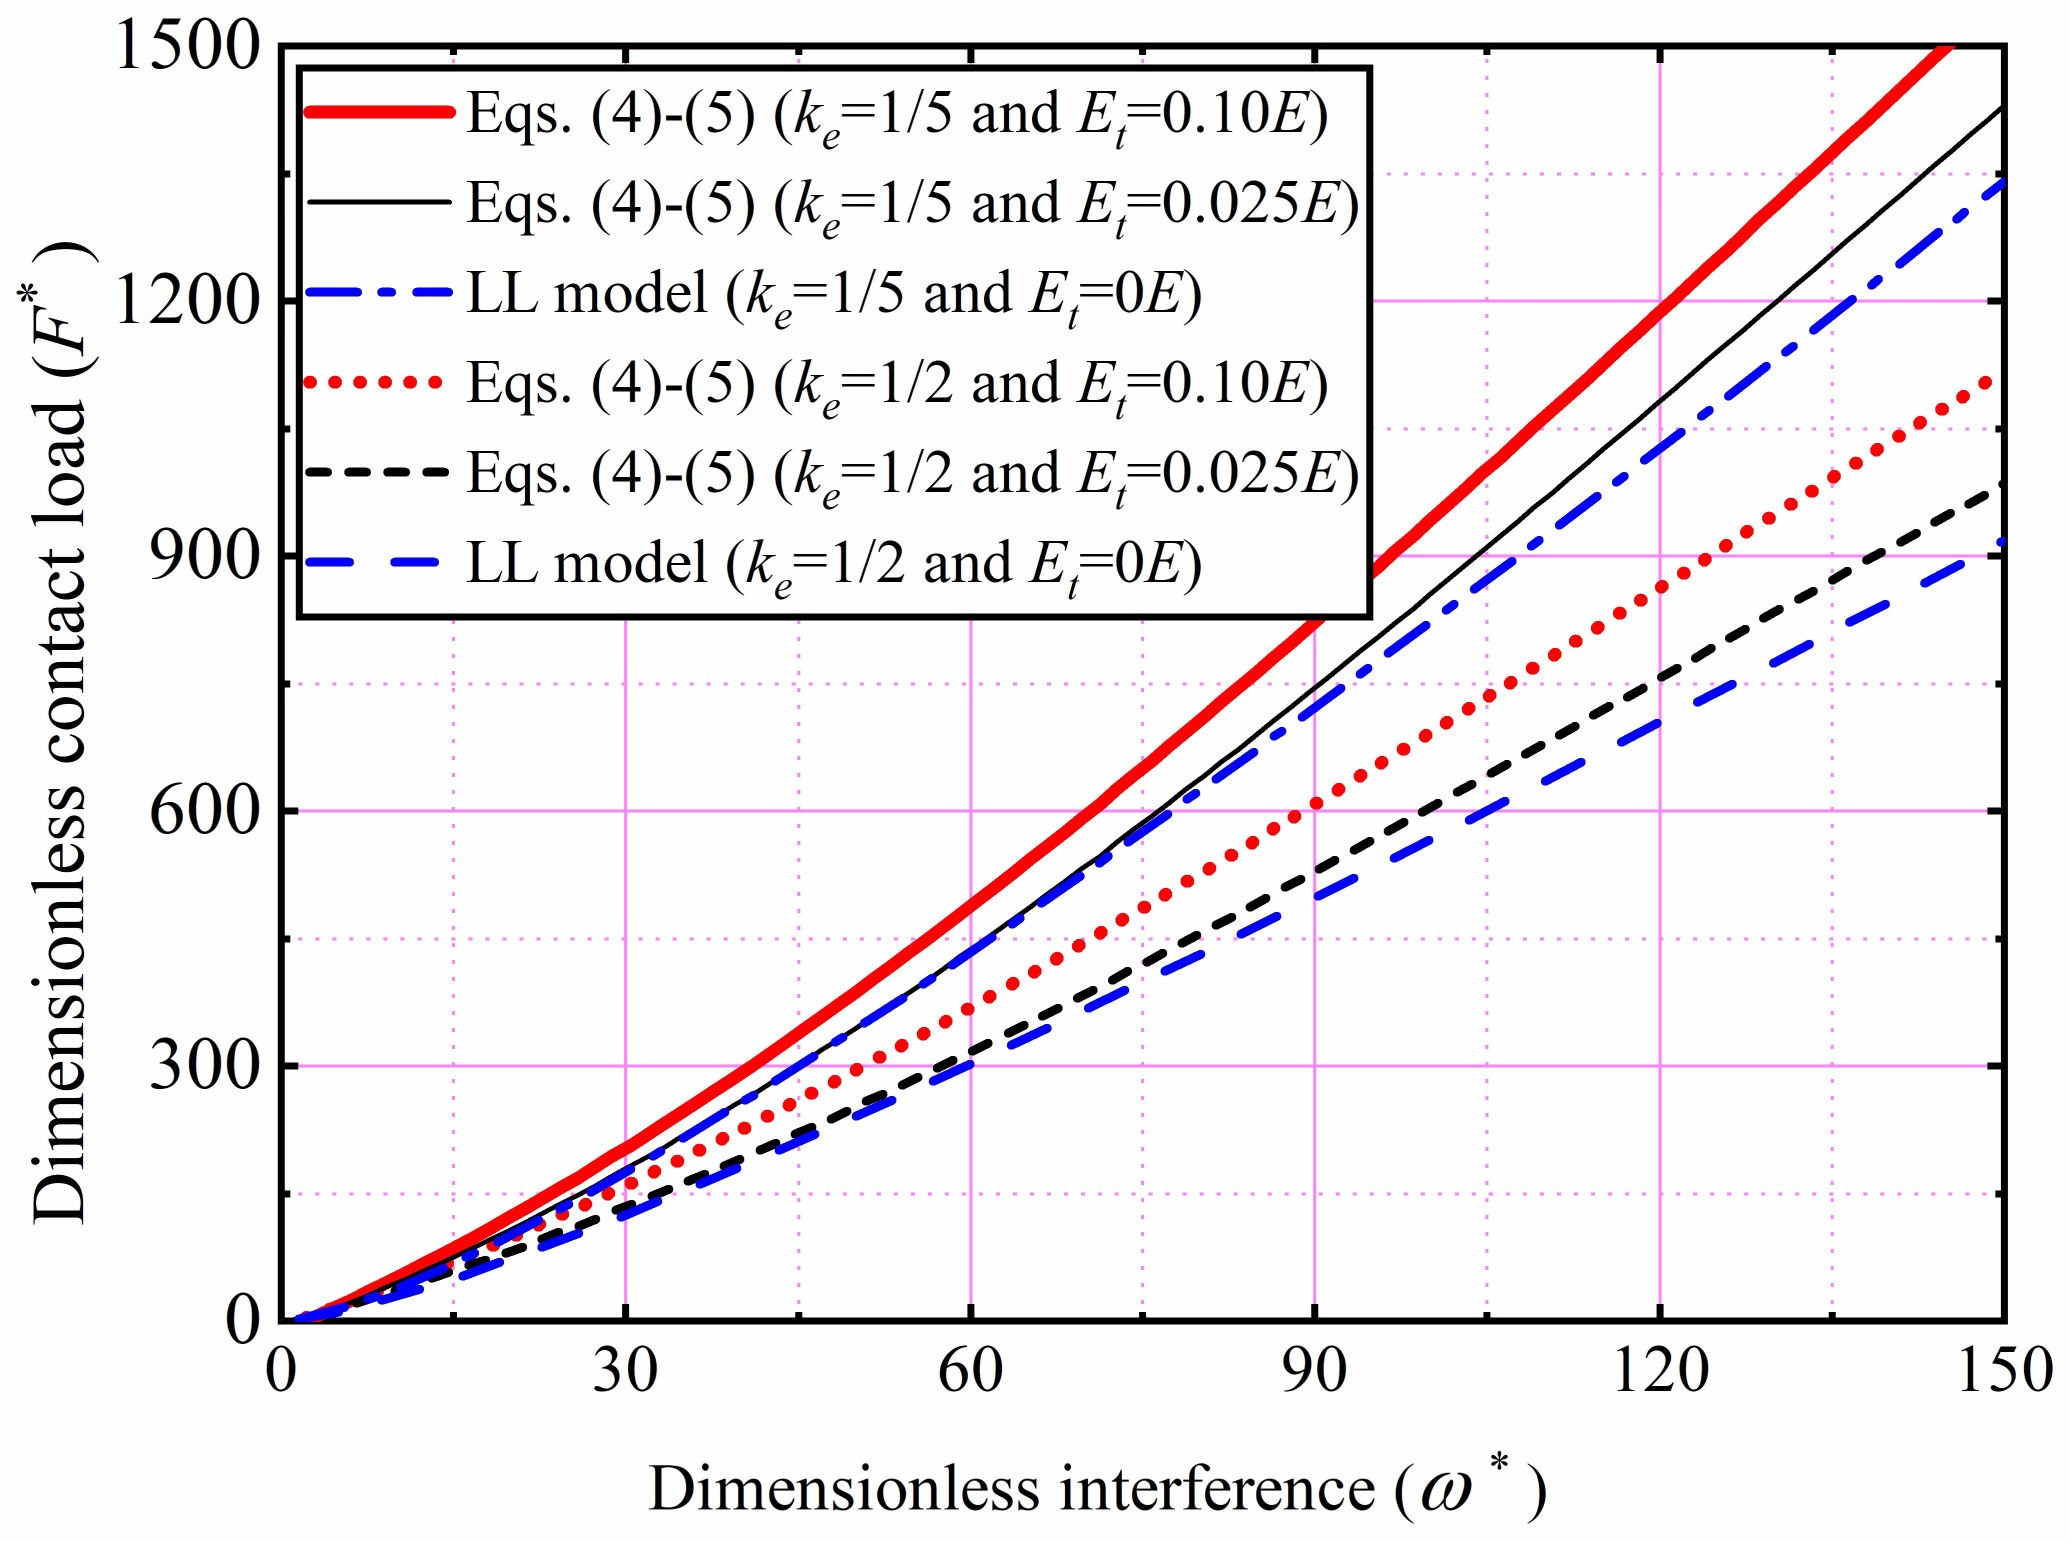
The contact parameters predicted by the present model were also compared with those predicted by the LL ellipsoid model (based on the analysis of elastic–perfectly plastic materials). For simplicity, only a comparison of F* is plotted in Figure 12. The trend obtained by the other comparison results is similar to that obtained for F* in Figure 12. The prediction results of the present model correlated well with the LL model for a low Et (Et less than 0.025E). As Et increased, the results of the LL model began to deviate; the F* for all values of ke were underestimated. At ω* = 150 and ke = 1/2, the F* deviation between the present and LL models was 10.53% at Et = 0.025E and 30.72% at Et = 0.1E.
4. Conclusions
The elastic–plastic contact parameters of ellipsoids with different ellipticities on a rigid plane were studied using an FEM. The ellipsoid was assumed to be an isotropic, strain-hardening, elastic–plastic material. The influence of the tangential modulus and ellipticity of the ellipsoid on the elastic–plastic contact parameters was presented based on this analysis.
The effect of the ellipticity of the ellipsoid on the elastic–plastic contact parameters persists throughout the contact. The effect of the tangential modulus on the contact parameters increased with an increase in interference. New dimensionless empirical formulas for determining the relationship between the contact area, interference and load under different tangential moduli and ellipticities of the ellipsoid were proposed.
The accuracy of the proposed model was confirmed by comparing the results with previous experimental results and those obtained using theoretical models. This study can be applied to the contact between two ellipsoids. In addition, the contact between the ellipsoid and the rigid plane can be equivalent to the contact between a single asperity of the joint surface. From this study, the contact behaviour of the whole joint surface can be studied based on fractal or statistical methods.
Author Contributions
Conceptualization, J.C. and L.Z.; methodology, J.C.; validation, J.C. and W.Z.; formal analysis, J.C. and W.Z.; investigation, J.C. and W.Z.; resources, J.C., W.Z. and D.L.; data curation, J.C., L.Z. and W.Z.; writing—original draft preparation, J.C. and W.Z.; writing—review and editing, L.Z.; supervision, L.Z., W.Z. and C.W.; project administration, C.W.; funding acquisition, D.L. All authors have read and agreed to the published version of the manuscript.
Funding
This research was funded by Shaanxi Provincial Education Department, grant number 20JK0643.
Institutional Review Board Statement
Not applicable.
Informed Consent Statement
Not applicable.
Data Availability Statement
Not applicable.
Acknowledgments
The authors are grateful for the comments and help of reviewers and editors.
Conflicts of Interest
The authors declare no conflict of interest.
References
- Salari, S.; Beheshti, A. Asperity-based contact and static friction with provision for creep: A review. Surf. Interfaces 2021, 24, 101144. [Google Scholar] [CrossRef]
- Flores, P. Contact mechanics for dynamical systems: A comprehensive review. Multibody Syst. Dyn. 2022, 54, 127–177. [Google Scholar] [CrossRef]
- Zhao, G.; Li, S.; Xiong, Z.; Gao, W.; Han, Q. A statistical model of elastic-plastic contact between rough surfaces. Trans. Can. Soc. Mech. Eng. 2019, 43, 38–46. [Google Scholar] [CrossRef]
- Zhang, Y.F.; Fang, B.; Kong, L.F.; Li, Y. Effect of the ring misalignment on the service characteristics of ball bearing and rotor system. Mech. Mach. Theory 2020, 151, 103889. [Google Scholar] [CrossRef]
- Li, G.; Wang, Z.H.; Zhu, W.D. Prediction of surface wear of involute gears based on a modified fractal method. J. Tribol. 2019, 141, 031603. [Google Scholar] [CrossRef]
- Yu, G.; Mao, H.; Jiang, L.; Liu, W.; Valerii, T. Fractal contact mechanics model for the rough surface of a Beveloid gear with elliptical asperities. Appl. Sci. 2022, 12, 4071. [Google Scholar] [CrossRef]
- Chung, J.C.; Lin, J.F. Fractal model developed for elliptic elastic-plastic asperity microcontacts of rough surfaces. J. Tribol. 2004, 126, 646–654. [Google Scholar] [CrossRef]
- Liu, Y.; An, Q.; Shang, D.; Bai, L.; Huang, M.; Huang, S. Research on normal contact stiffness of rough joint surfaces machined by turning and grinding. Metals 2022, 12, 669. [Google Scholar] [CrossRef]
- Zhang, Y.; Lu, H.; Zhang, X.; Ling, H.; Fan, W.; Bao, L.; Guo, Z. A normal contact stiffness model of machined joint surfaces considering elastic, elasto-plastic and plastic factors. Proc. Inst. Mech. Eng. Part J J. Eng. Tribol. 2020, 234, 1007–1016. [Google Scholar] [CrossRef]
- Ghaednia, H.; Jackson, R.L. The effect of nanoparticles on the real area of contact, friction, and wear. J. Tribol. 2013, 135, 041603. [Google Scholar] [CrossRef]
- Zhang, H.; Etsion, I. Evolution of adhesive wear and friction in elastic-plastic spherical contact. Wear 2021, 478–479, 203915. [Google Scholar] [CrossRef]
- Yuan, Y.; Cheng, Y.; Liu, K.; Gan, L. A revised Majumdar and Bushan model of elastoplastic contact between rough surfaces. Appl. Surf. Sci. 2017, 425, 1138–1157. [Google Scholar] [CrossRef]
- Hertz, H. Ueber die berührung fester elastischer körper. J. Reine Angew. Math. 1881, 92, 156–171. [Google Scholar]
- Zhao, J.; Fu, P.; Zhang, X.; Zhou, L.; Wang, P.; Kan, Q. An effective method for calculating elasto-plastic contact pressure and contact patch size under elliptical, circular and line contact conditions. Appl. Math. Model. 2021, 95, 541–574. [Google Scholar] [CrossRef]
- Ghaednia, H.; Wang, X.; Saha, S.; Xu, Y.; Sharma, A.; Jackson, R.L. A review of elastic-plastic contact mechanics. Appl. Mech. Rev. 2017, 69, 2017. [Google Scholar] [CrossRef] [Green Version]
- Li, W.; Zhang, Z.; Zhang, C.; Meng, D.; He, P. The influence of surface topography on friction squeal—A review. Proc. Inst. Mech. Eng. Part J J. Eng. Tribol. 2022, 1175653436. [Google Scholar] [CrossRef]
- Greenwood, J.A.; Williamson, J.B.P. Contact of nominally flat surfaces. Proc. R. Soc. A Math. Phys. Eng. Sci. 1966, 295, 300–319. [Google Scholar]
- Abbott, E.J.; Firestone, F.A. Specifying surface quality-a method based on accurate measurement and comparison. J. Appl. Mech. 1933, 55, 569–572. [Google Scholar]
- Chang, W.R.; Etsion, I.; Bogy, D.B. An elastic-plastic model for the contact of rough surfaces. J. Tribol. 1987, 109, 257–263. [Google Scholar] [CrossRef]
- Zhao, Y.; Maietta, D.M.; Chang, L. An asperity microcontact model incorporating the transition from elastic deformation to fully plastic flow. J. Tribol. 2000, 122, 86–93. [Google Scholar] [CrossRef]
- Wang, H.; Yin, X.; Hao, H.; Chen, W.; Yu, B. The correlation of theoretical contact models for normal elastic-plastic impacts. Int. J. Solids Struct. 2020, 182, 15–33. [Google Scholar] [CrossRef]
- Li, L.; Wang, J.; Shi, X.; Tong, M.; Li, L. A modified elastoplastic contact stiffness model considering continuous smooth contact characteristics and substrate deformation. Acta Mech. Solida Sin. 2021, 34, 754–765. [Google Scholar] [CrossRef]
- Weng, P.; Yin, X.; Hu, W.; Yuan, H.; Chen, C.; Ding, H.; Yu, B.; Xie, W.; Jiang, L.; Wang, H. Piecewise linear deformation characteristics and a contact model for elastic-plastic indentation considering indenter elasticity. Tribol. Int. 2021, 162, 107–114. [Google Scholar] [CrossRef]
- Ovcharenko, A.; Halperin, G.; Verberne, G.; Etsion, I. In situ investigation of the contact area in elastic–plastic spherical contact during loading-unloading. Tribol. Lett. 2007, 25, 153–160. [Google Scholar] [CrossRef]
- Bartier, O.; Hernot, X.; Mauvoisin, G. Theoretical and experimental analysis of contact radius for spherical indentation. Mech. Mater. 2010, 42, 640–656. [Google Scholar] [CrossRef] [Green Version]
- Chaudhri, M.M.; Hutchings, I.M.; Makin, P.L. Plastic compression of spheres. Philos. Mag. A 1984, 49, 493–503. [Google Scholar] [CrossRef]
- Popov, V.L. Analysis of impact on composite structures with the method of dimensionality reduction. Facta Univ. Ser. Mech. Eng. 2015, 13, 39–46. [Google Scholar]
- Lyashenko, I.A. Dynamic model of elastoplastic normal collision of a spherical particle with a half-space with allowance for adhesion interaction in a contact zone. Phys. Solid State 2019, 61, 163–173. [Google Scholar] [CrossRef]
- Kogut, L.; Etsion, I. Elastic-plastic contact analysis of a sphere and a rigid flat. J. Appl. Mech. 2002, 69, 657–662. [Google Scholar] [CrossRef] [Green Version]
- Jackson, R.L.; Green, I. A finite element study of elasto-plastic hemispherical contact against a rigid flat. J. Tribol. 2005, 127, 343–354. [Google Scholar] [CrossRef] [Green Version]
- Quicksall, J.J.; Jackson, R.L.; Green, I. Elasto-plastic hemispherical contact models for various mechanical properties. Proc. Inst. Mech. Eng. Part J J. Eng. Tribol. 2004, 218, 313–322. [Google Scholar] [CrossRef]
- Olemskoi, A.I.; Khomenko, A.V. Phenomenological equations of the glass transition in liquids. Tech. Phys. 2000, 45, 672–676. [Google Scholar] [CrossRef]
- Shankar, S.; Mayuram, M.M. Effect of strain hardening in elastic–plastic transition behavior in a hemisphere in contact with a rigid flat. Int. J. Solids Struct. 2008, 45, 3009–3020. [Google Scholar] [CrossRef] [Green Version]
- Shankar, S.; Mayuram, M.M. A finite element based study on the elastic-plastic transition behavior in a hemisphere in contact with a rigid flat. J. Tribol. 2008, 130, 044502. [Google Scholar] [CrossRef]
- Li, X.Y.; Liang, L.; Wu, S.J. A numerical and effective method for the contact stress calculation of elliptical partial slip. J. Mech. Sci. Technol. 2015, 29, 517–525. [Google Scholar] [CrossRef]
- Bush, A.W.; Gibson, R.D.; Keogh, G.P. Strongly anisotropic rough surfaces. J. Lubr. Technol. 1979, 101, 15–20. [Google Scholar] [CrossRef]
- Horng, J.H. An elliptic elastic-plastic asperity microcontact model for rough surfaces. J. Tribol. 1998, 120, 82–88. [Google Scholar] [CrossRef]
- Jamari, J.; Schipper, D.J. An elastic-plastic contact model of ellipsoid bodies. Tribol. Lett. 2006, 21, 262–271. [Google Scholar] [CrossRef]
- Wen, Y.; Tang, J.; Zhou, W.; Zhu, C. A new elliptical microcontact model considering elastoplastic deformation. Proc. Inst. Mech. Eng. Part J J. Eng. Tribol. 2018, 232, 1352–1364. [Google Scholar] [CrossRef]
- Wen, Y.; Tang, J.; Zhou, W.; Li, L. A reconstruction and contact analysis method of three-dimensional rough surface based on ellipsoidal asperity. J. Tribol. 2020, 142, 041502. [Google Scholar] [CrossRef]
- Jeng, Y.; Wang, P. An elliptical microcontact model considering elastic, elastoplastic, and plastic deformation. J. Tribol. 2003, 125, 232–240. [Google Scholar] [CrossRef]
- Chung, J.C. Elastic-plastic contact analysis of an ellipsoid and a rigid flat. Tribol. Int. 2010, 43, 491–502. [Google Scholar] [CrossRef]
- Li, P.; Zhou, L.; Cui, F.; Wang, Q.; Guo, M.; Zhai, Y.; Li, Y.; Hua, D. Elasto-plastic analysis of the contact region between a rigid ellipsoid and a semi-flat surface. Adv. Mech. Eng. 2018, 10, 168781401879739. [Google Scholar] [CrossRef] [Green Version]
- Jackson, R.L.; Kogut, L. A comparison of flattening and indentation approaches for contact mechanics modeling of single asperity contacts. J. Tribol. 2006, 128, 209–212. [Google Scholar] [CrossRef]
- Becker, V.; Kamlah, M. A theoretical model for the normal contact force of two elastoplastic ellipsoidal bodies. J. Appl. Mech. 2021, 88, 3. [Google Scholar] [CrossRef]
- Lin, L.P.; Lin, J.F. An elliptical elastic-plastic microcontact model developed for an ellipsoid in contact with a smooth rigid flat. J. Tribol. 2007, 129, 772–782. [Google Scholar] [CrossRef]
- Song, Z.; Komvopoulos, K. An elastic-plastic analysis of spherical indentation: Constitutive equations for single-indentation unloading and development of plasticity due to repeated indentation. Mech. Mater. 2014, 76, 93–101. [Google Scholar] [CrossRef]
- Etsion, I.; Kligerman, Y.; Kadin, Y. Unloading of an elastic-plastic loaded spherical contact. Int. J. Solids Struct. 2005, 42, 716–3729. [Google Scholar] [CrossRef]
- Sahoo, P.; Chatterjee, B. A finite element study of elastic-plastic hemispherical contact behavior against a rigid flat under varying modulus of elasticity and sphere radius. Engineering 2010, 2, 205–211. [Google Scholar] [CrossRef] [Green Version]
Figure 1.
Contact diagram of an ellipsoid with a rigid flat.

Figure 2.
Ellipsoidal finite element contact model.
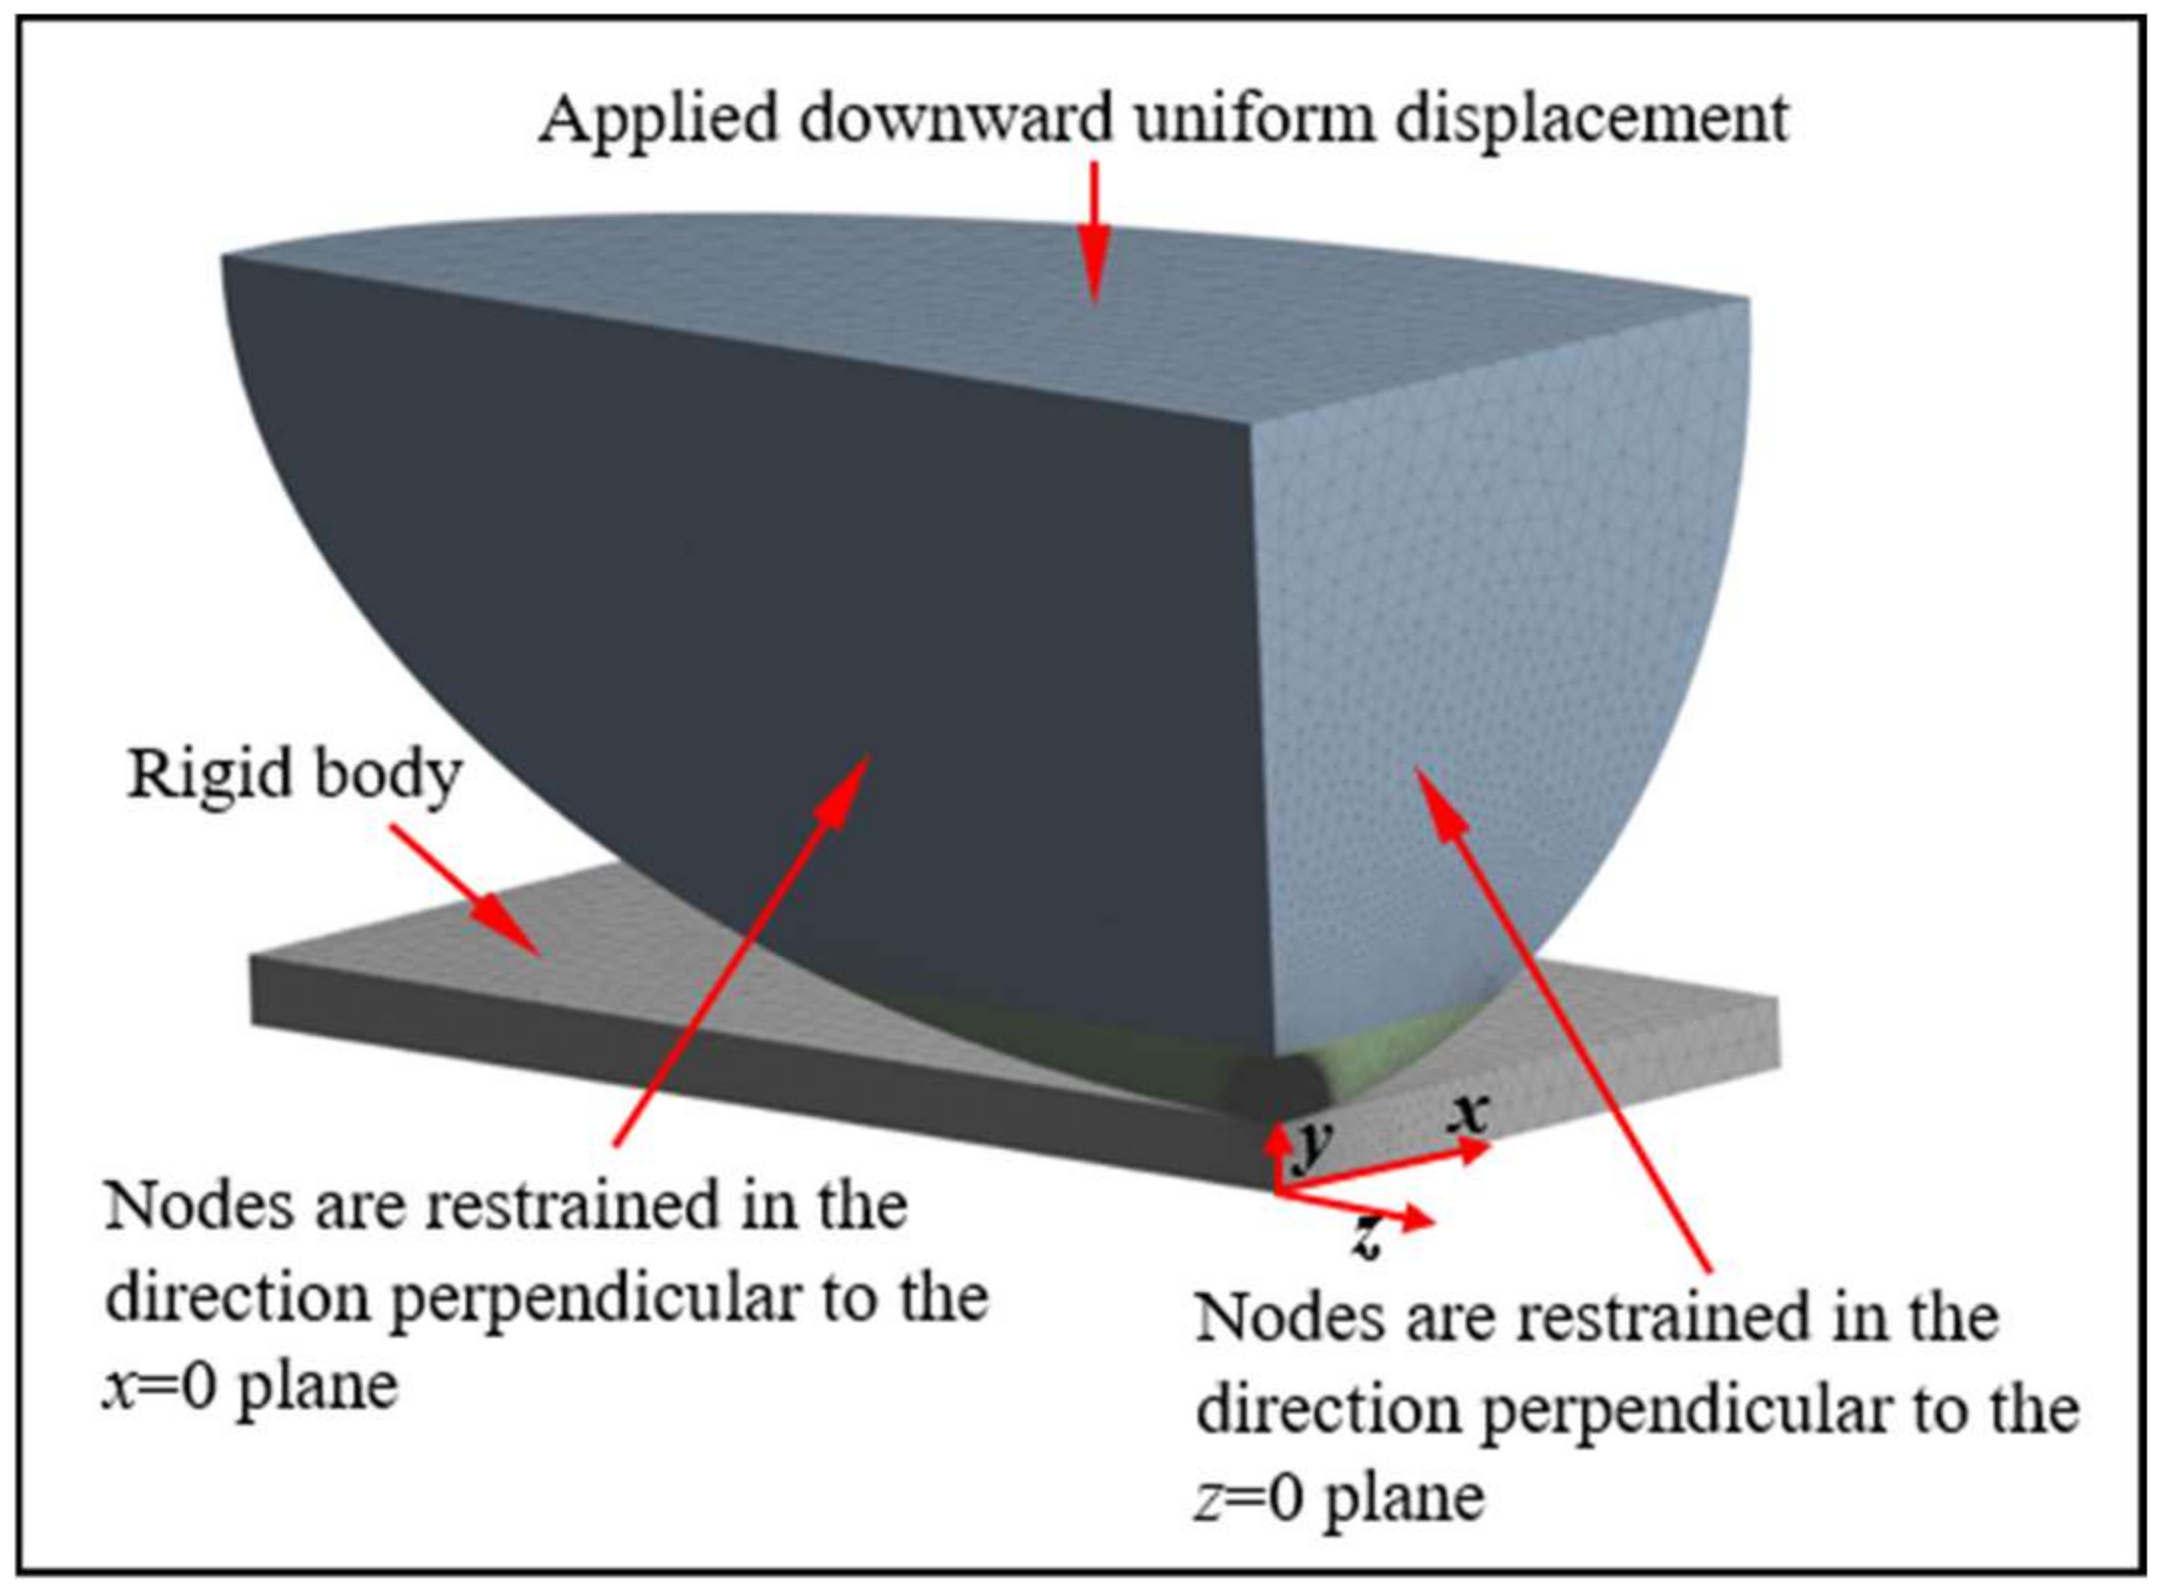
Figure 3.
Stress–strain relationship for isotropic strain hardening materials.
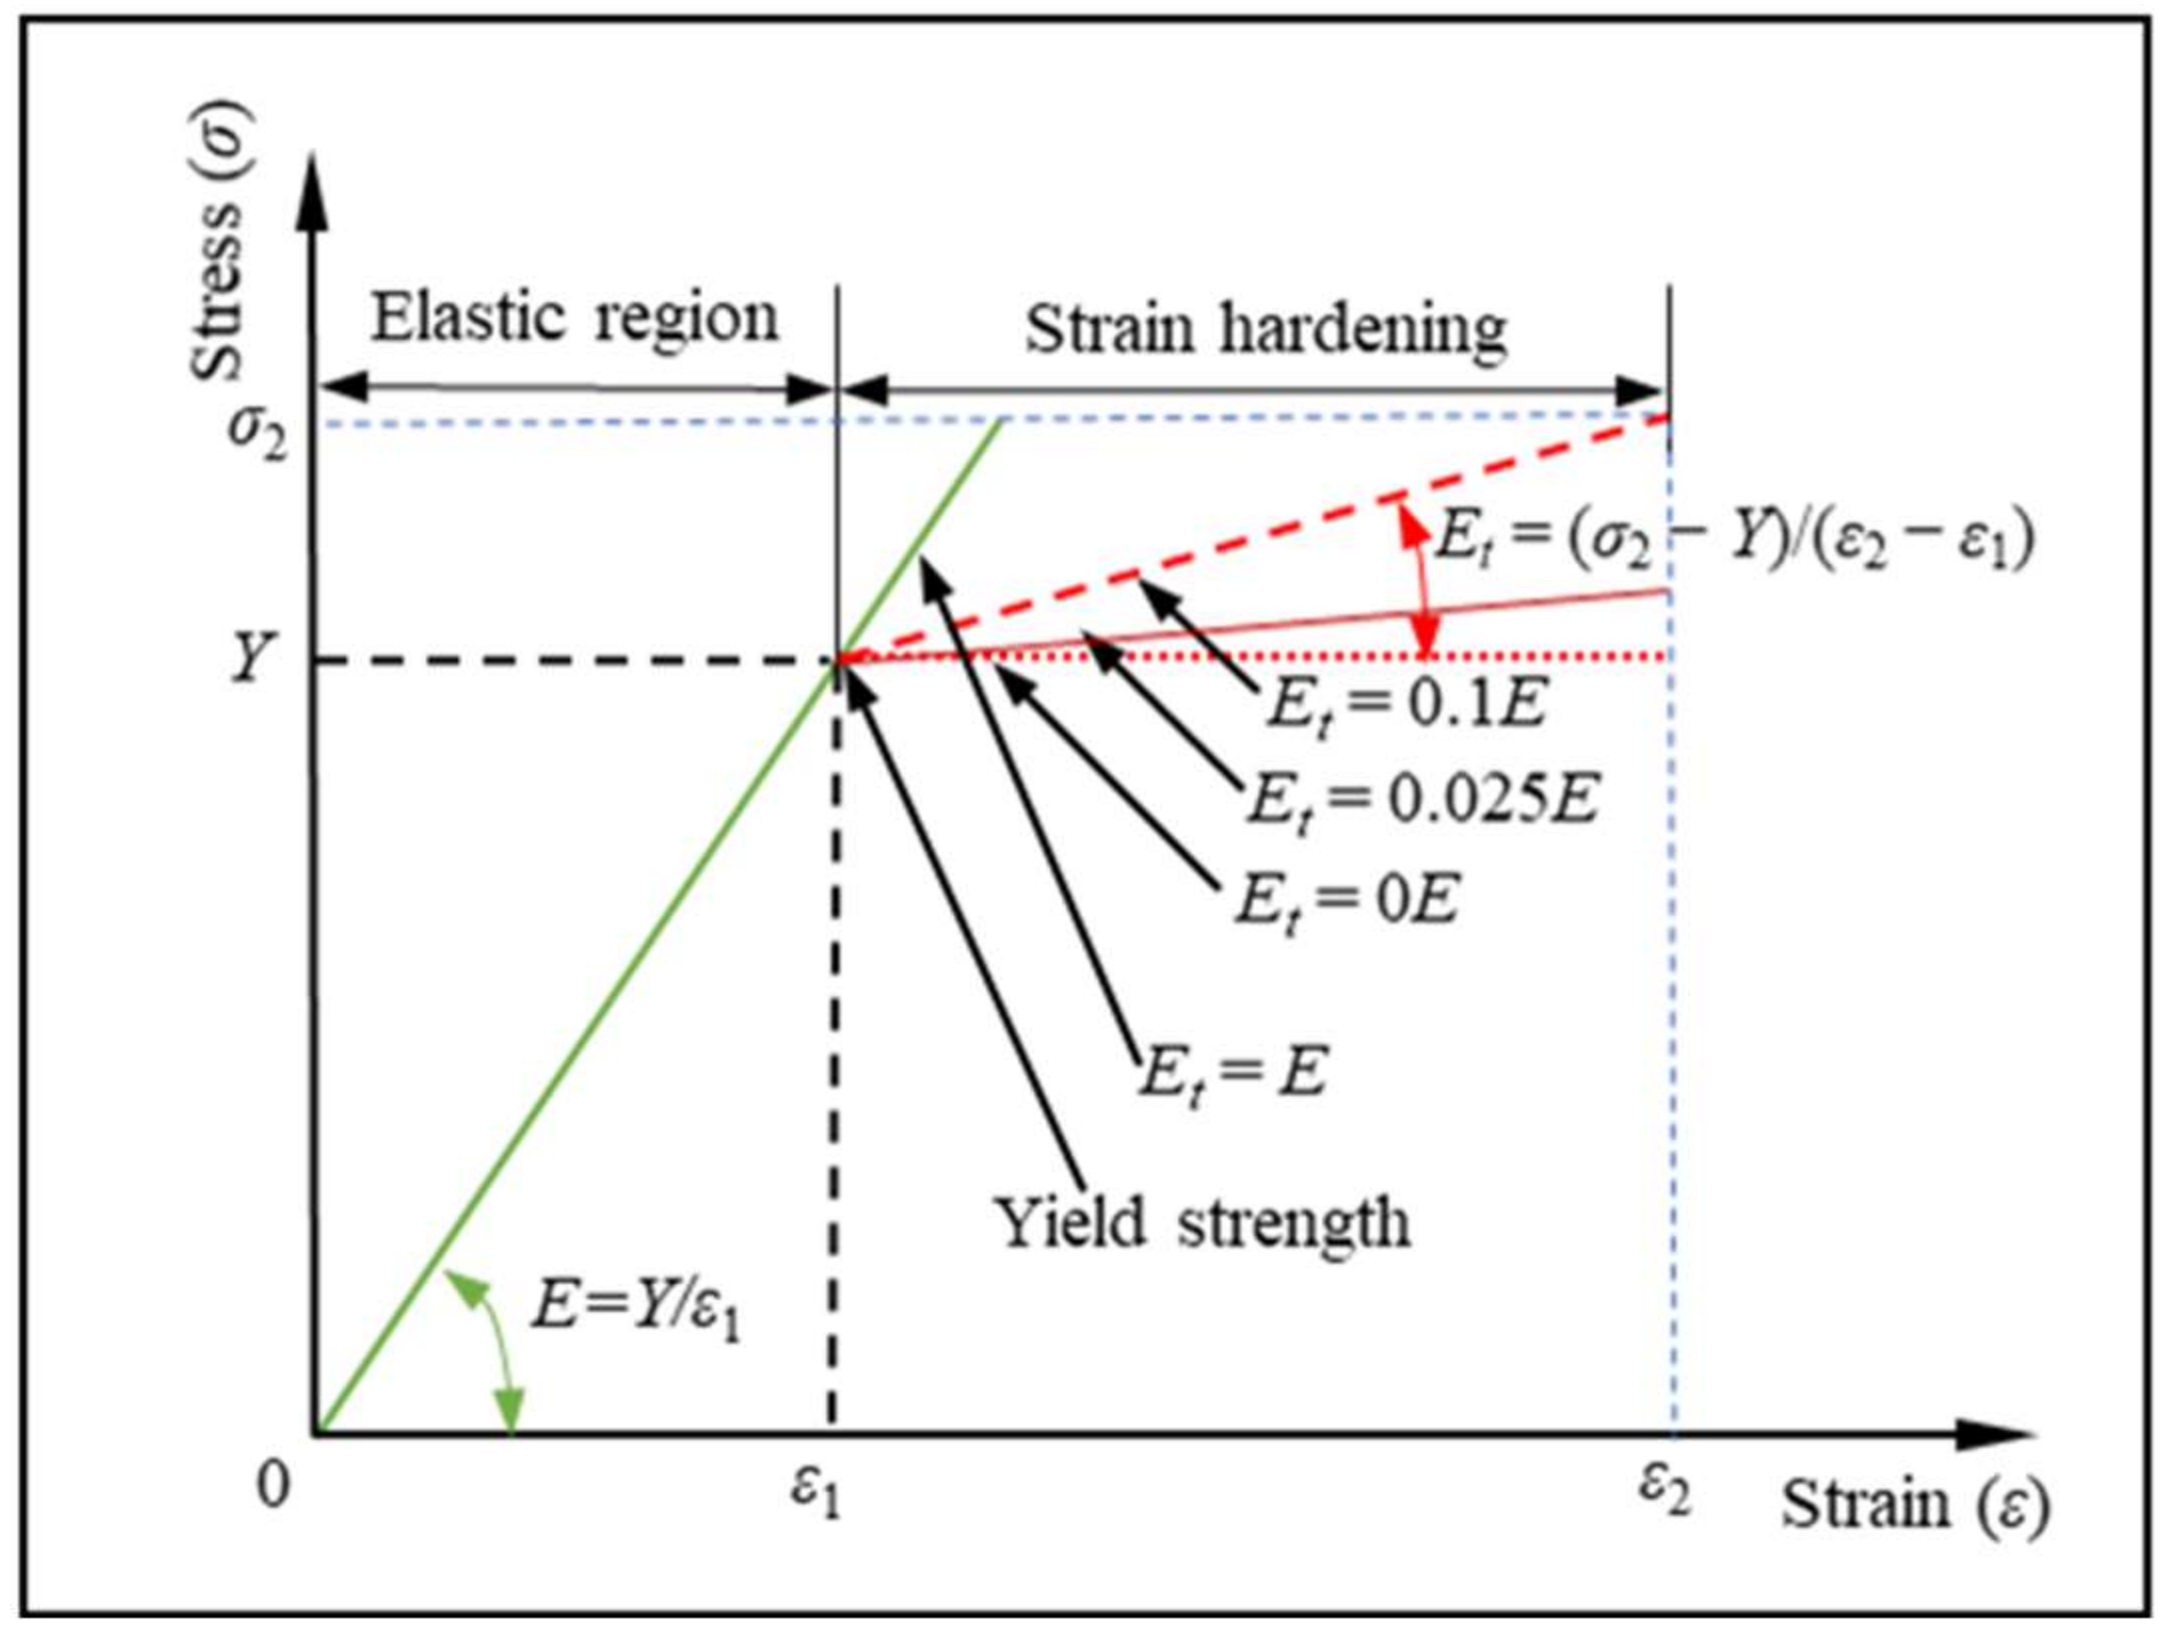
Figure 4.
Evolution of F* with increasing ω*: (a) under different values of ke; (b) under different values of Et.
Figure 4.
Evolution of F* with increasing ω*: (a) under different values of ke; (b) under different values of Et.

Figure 5.
Evolution of A* with increasing ω*: (a) under different values of ke; (b) under different Et values.
Figure 5.
Evolution of A* with increasing ω*: (a) under different values of ke; (b) under different Et values.
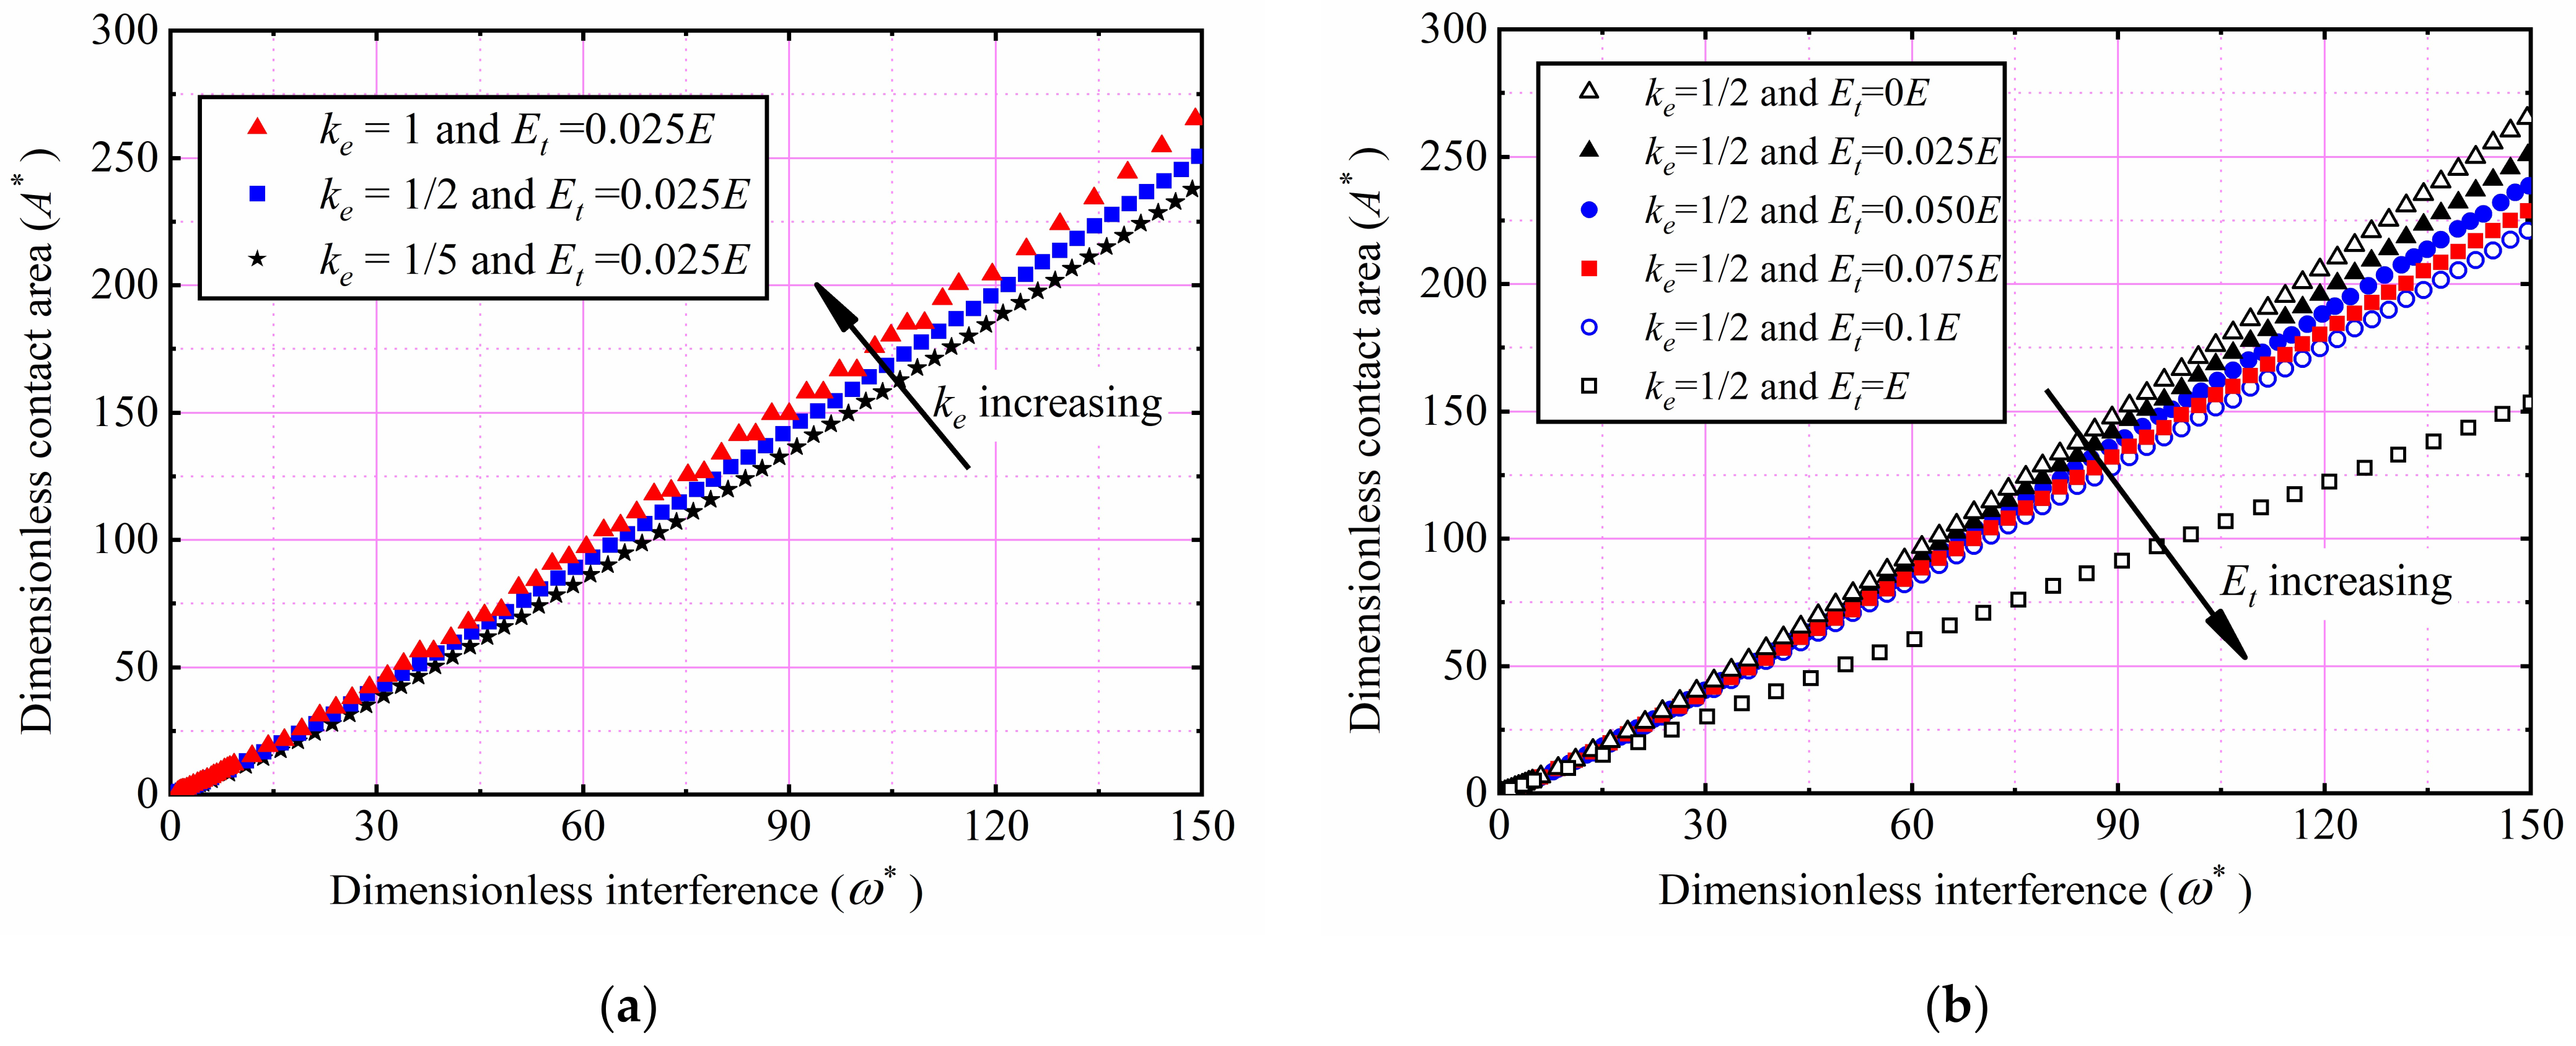
Figure 6.
Evolution of A* with increasing F*: (a) under different ke values; (b) under the different Et values.
Figure 6.
Evolution of A* with increasing F*: (a) under different ke values; (b) under the different Et values.
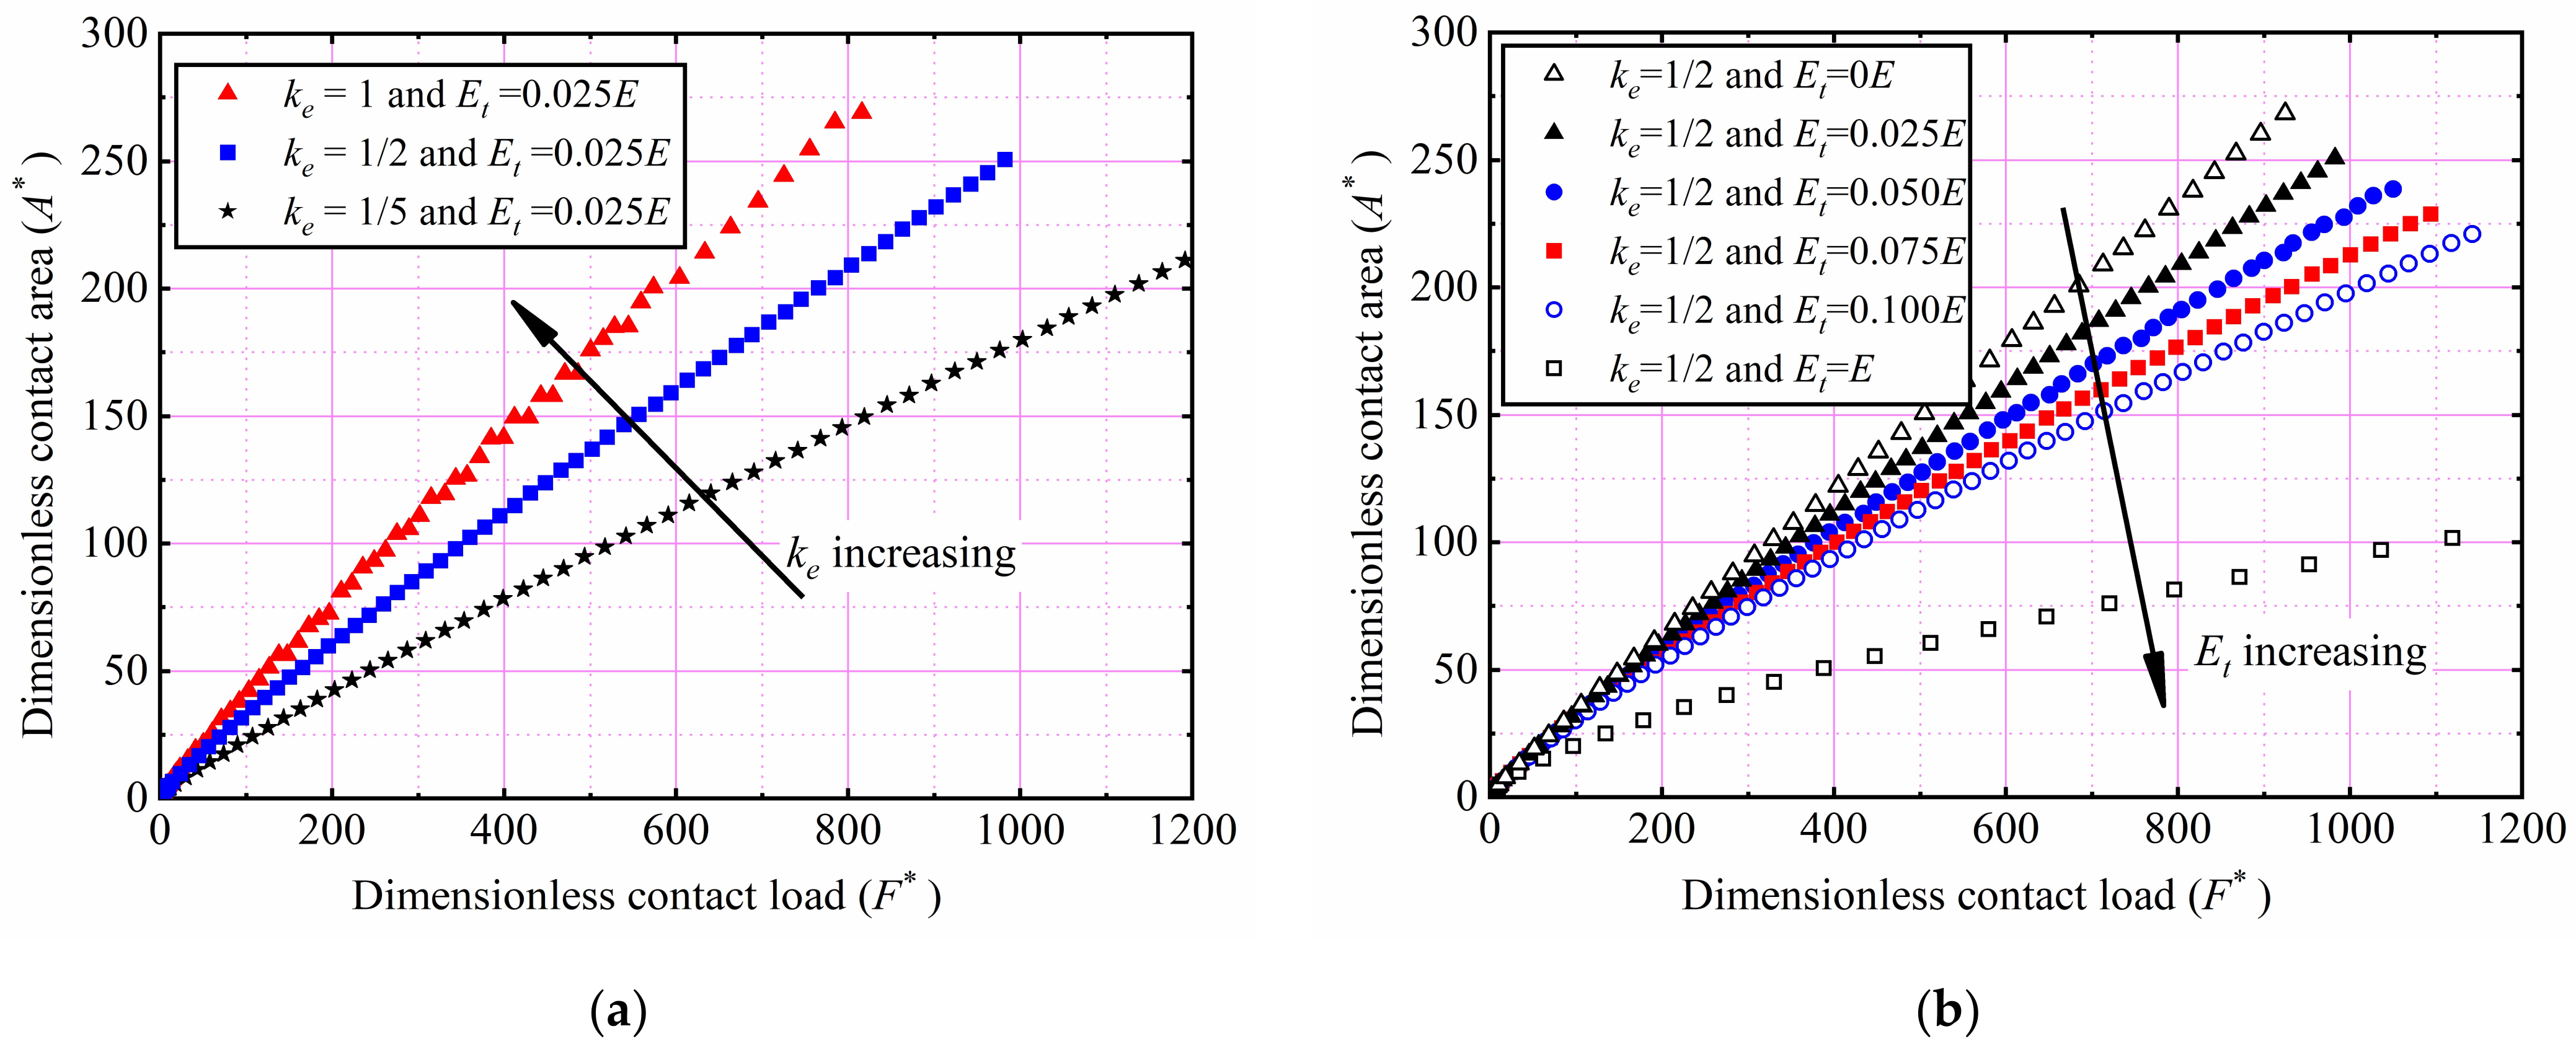
Figure 7.
Evolution of p* with increasing ω*: (a) under different ke values; (b) under different Et values.
Figure 7.
Evolution of p* with increasing ω*: (a) under different ke values; (b) under different Et values.
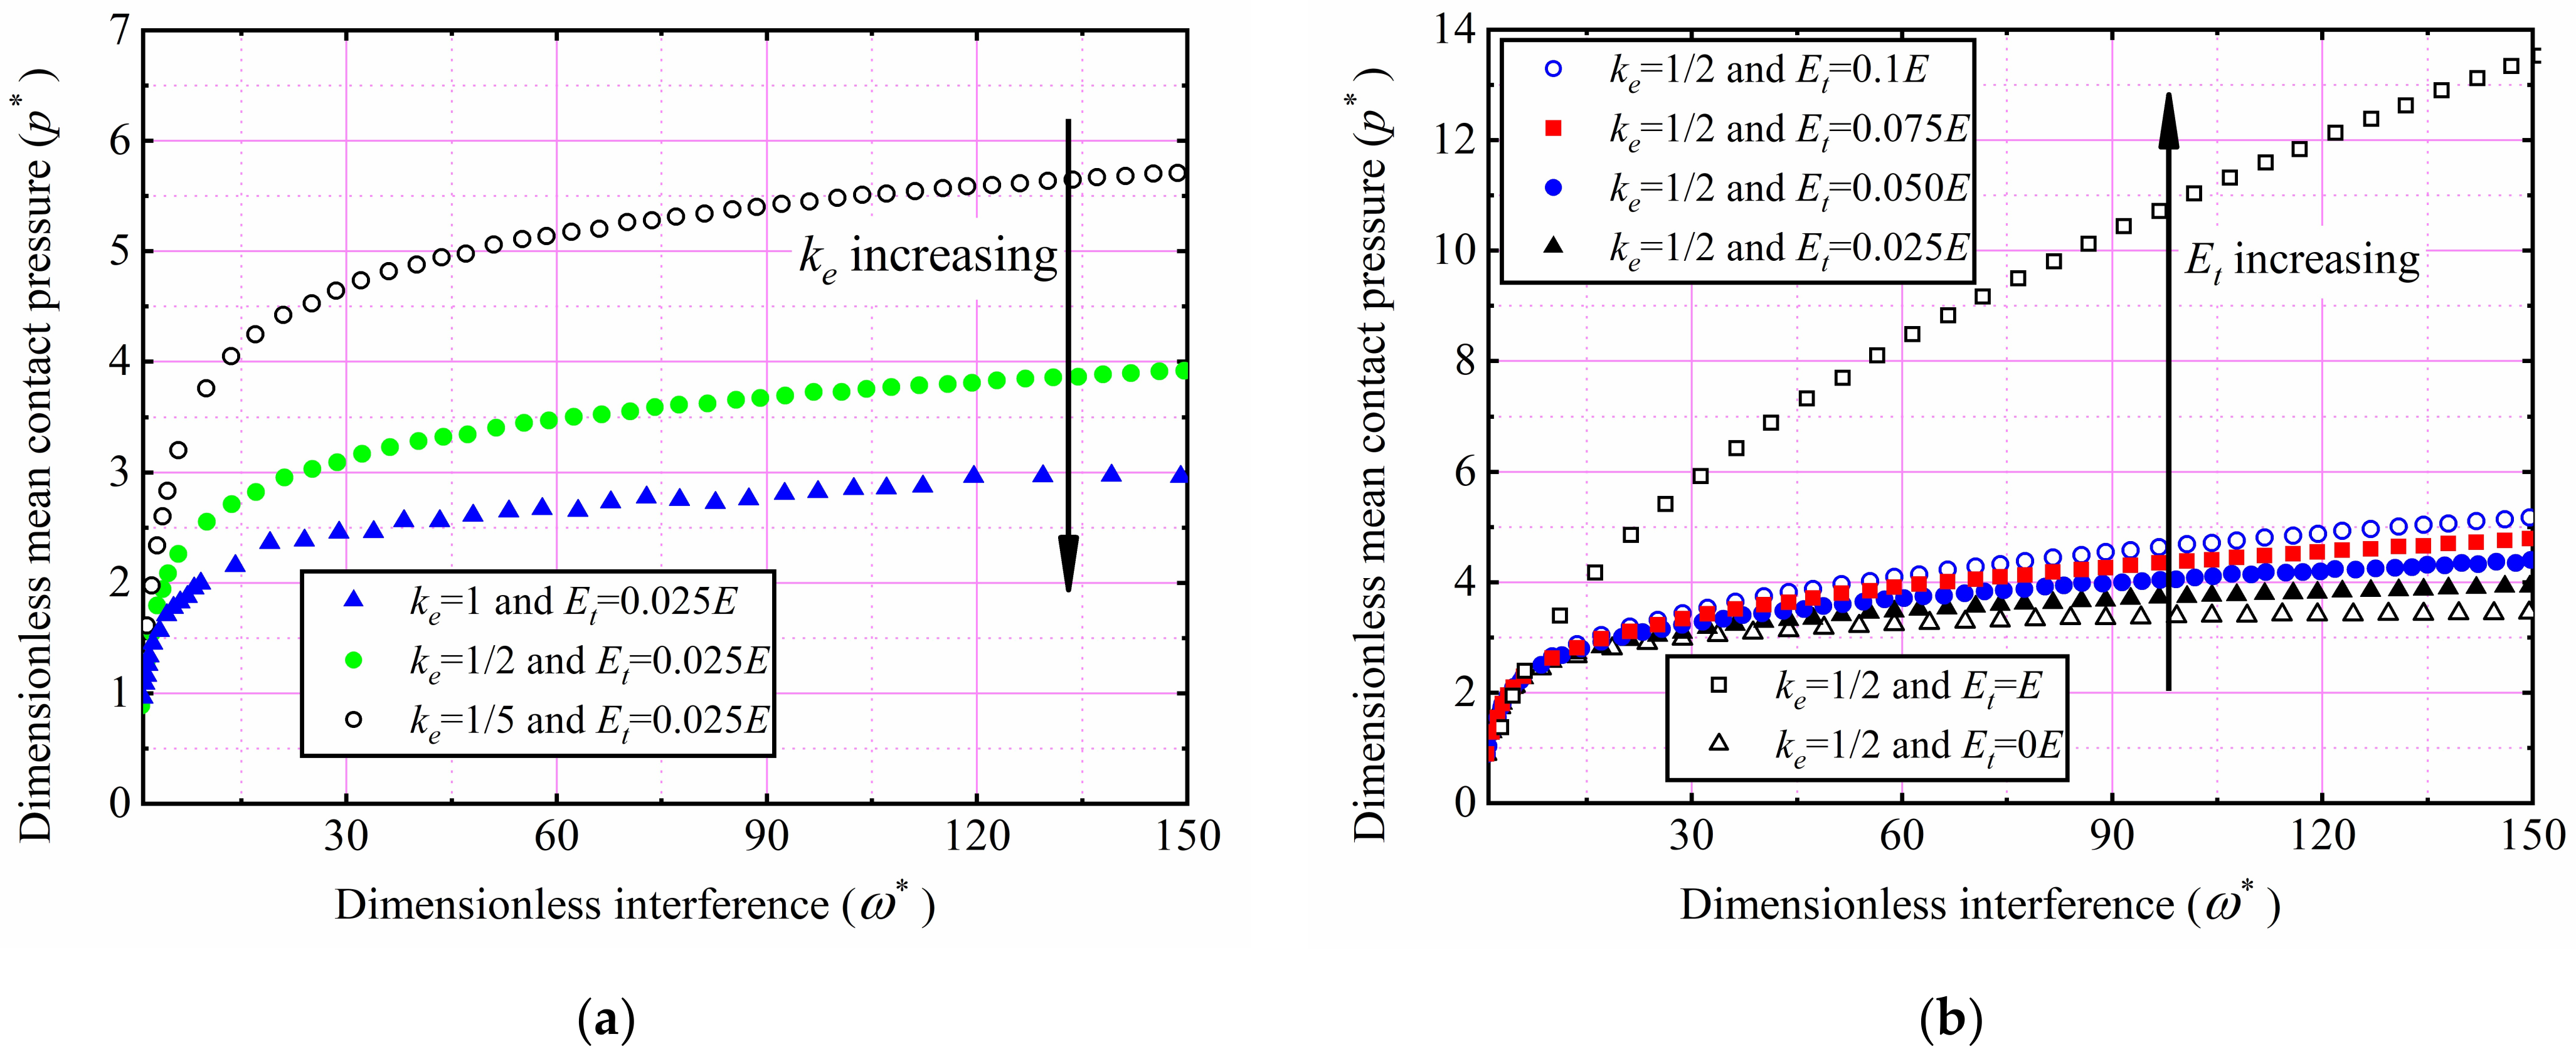
Figure 8.
(a) Evolution of p/Y with increasing ω* under different Et values at ke = 1/2. (b) Elastic–plastic to –fully plastic transition ω* variation with Et/E ratio under different ke values.
Figure 8.
(a) Evolution of p/Y with increasing ω* under different Et values at ke = 1/2. (b) Elastic–plastic to –fully plastic transition ω* variation with Et/E ratio under different ke values.
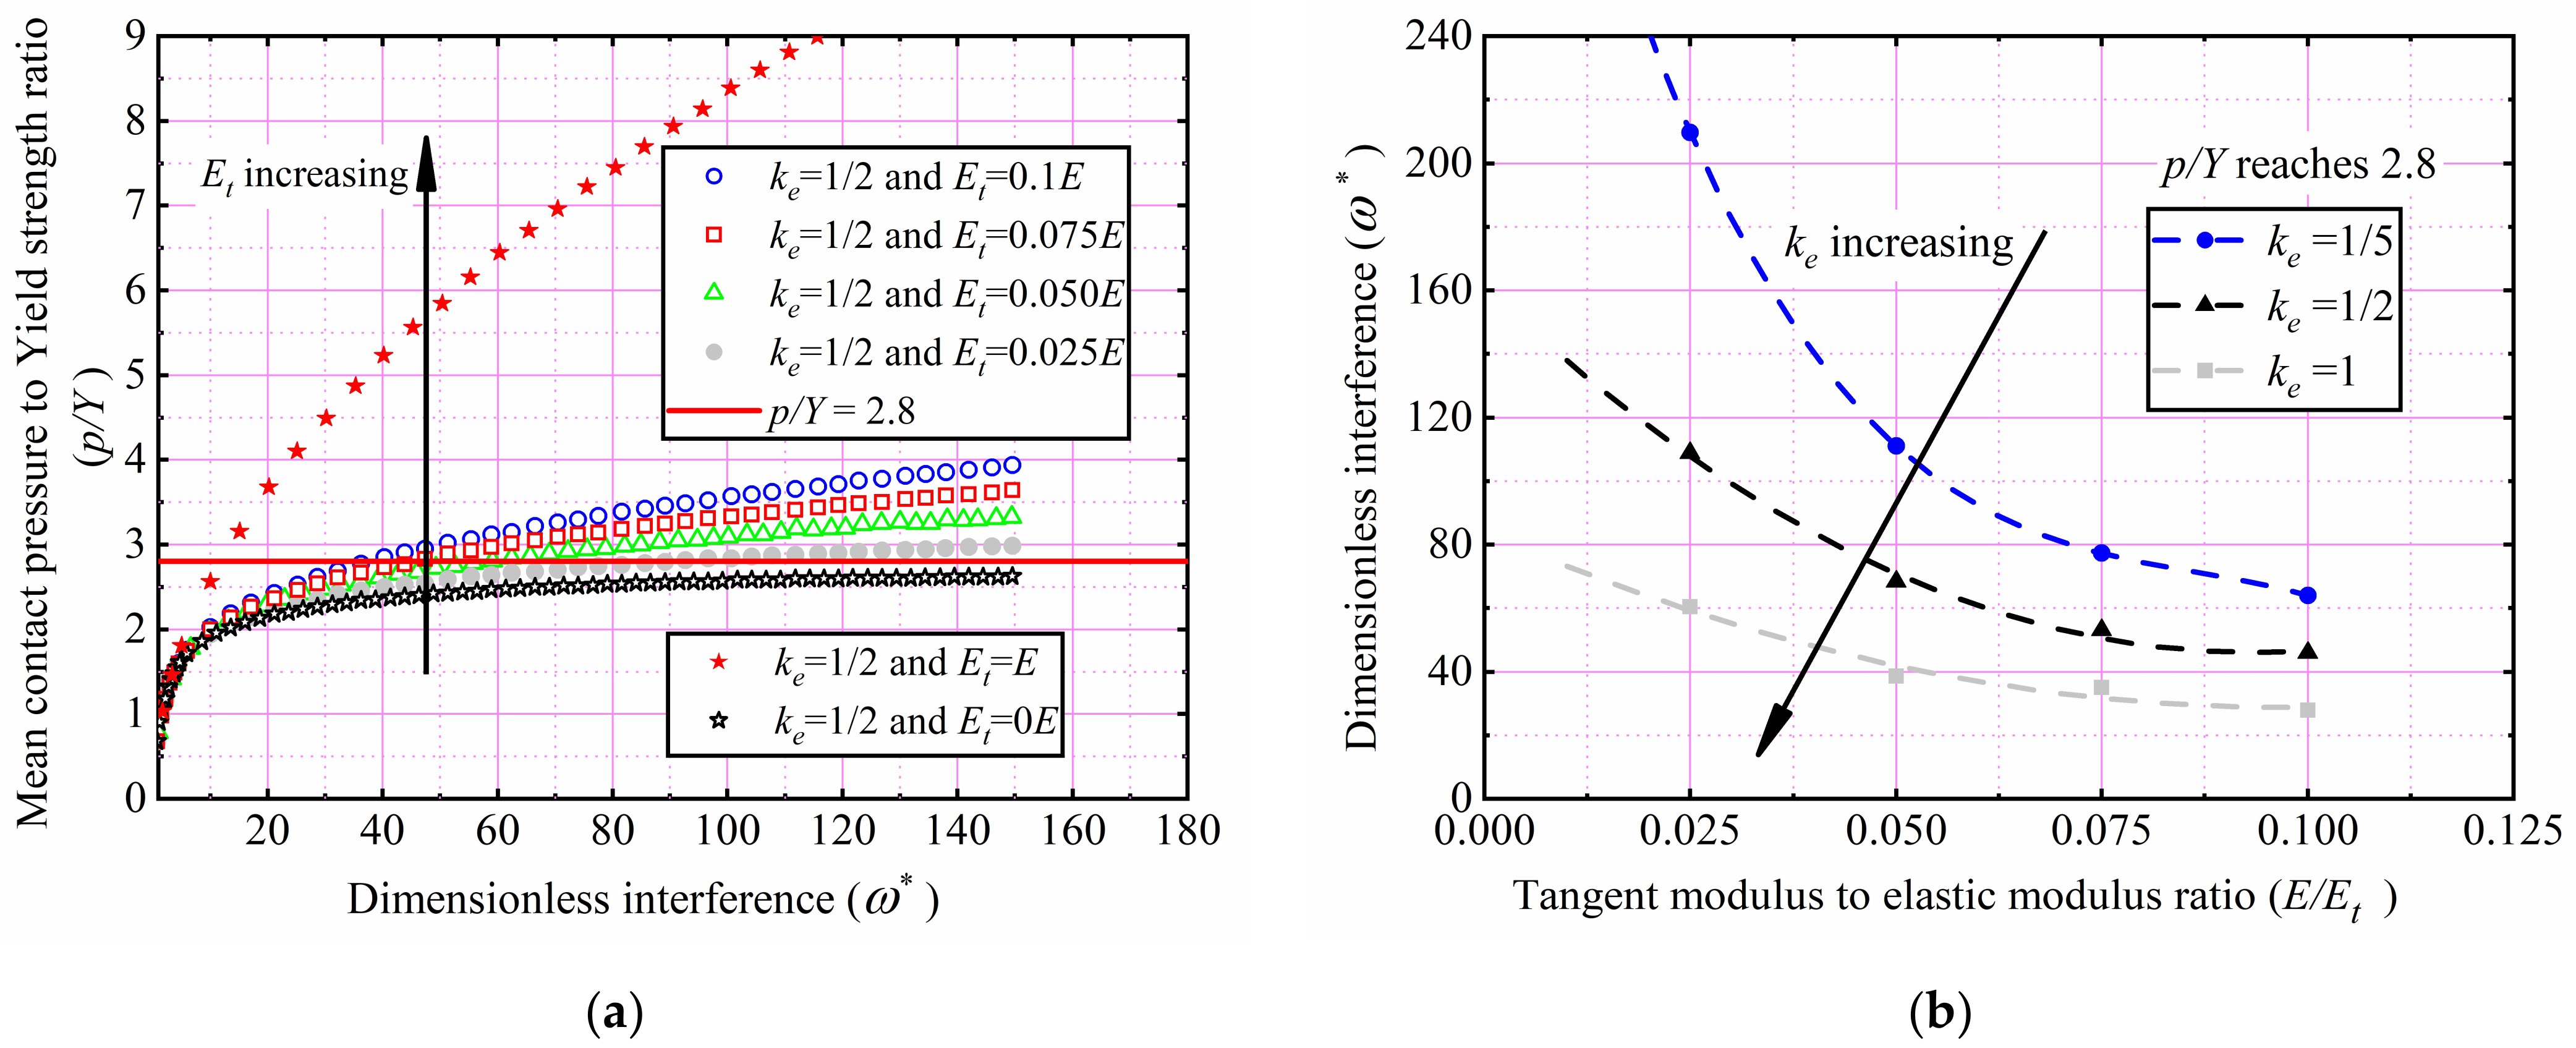
Figure 9.
Comparisons of A* as the function of F* predicted by the present model and experiment results at ke = 1 and Et/E ≤ 0.03.
Figure 9.
Comparisons of A* as the function of F* predicted by the present model and experiment results at ke = 1 and Et/E ≤ 0.03.
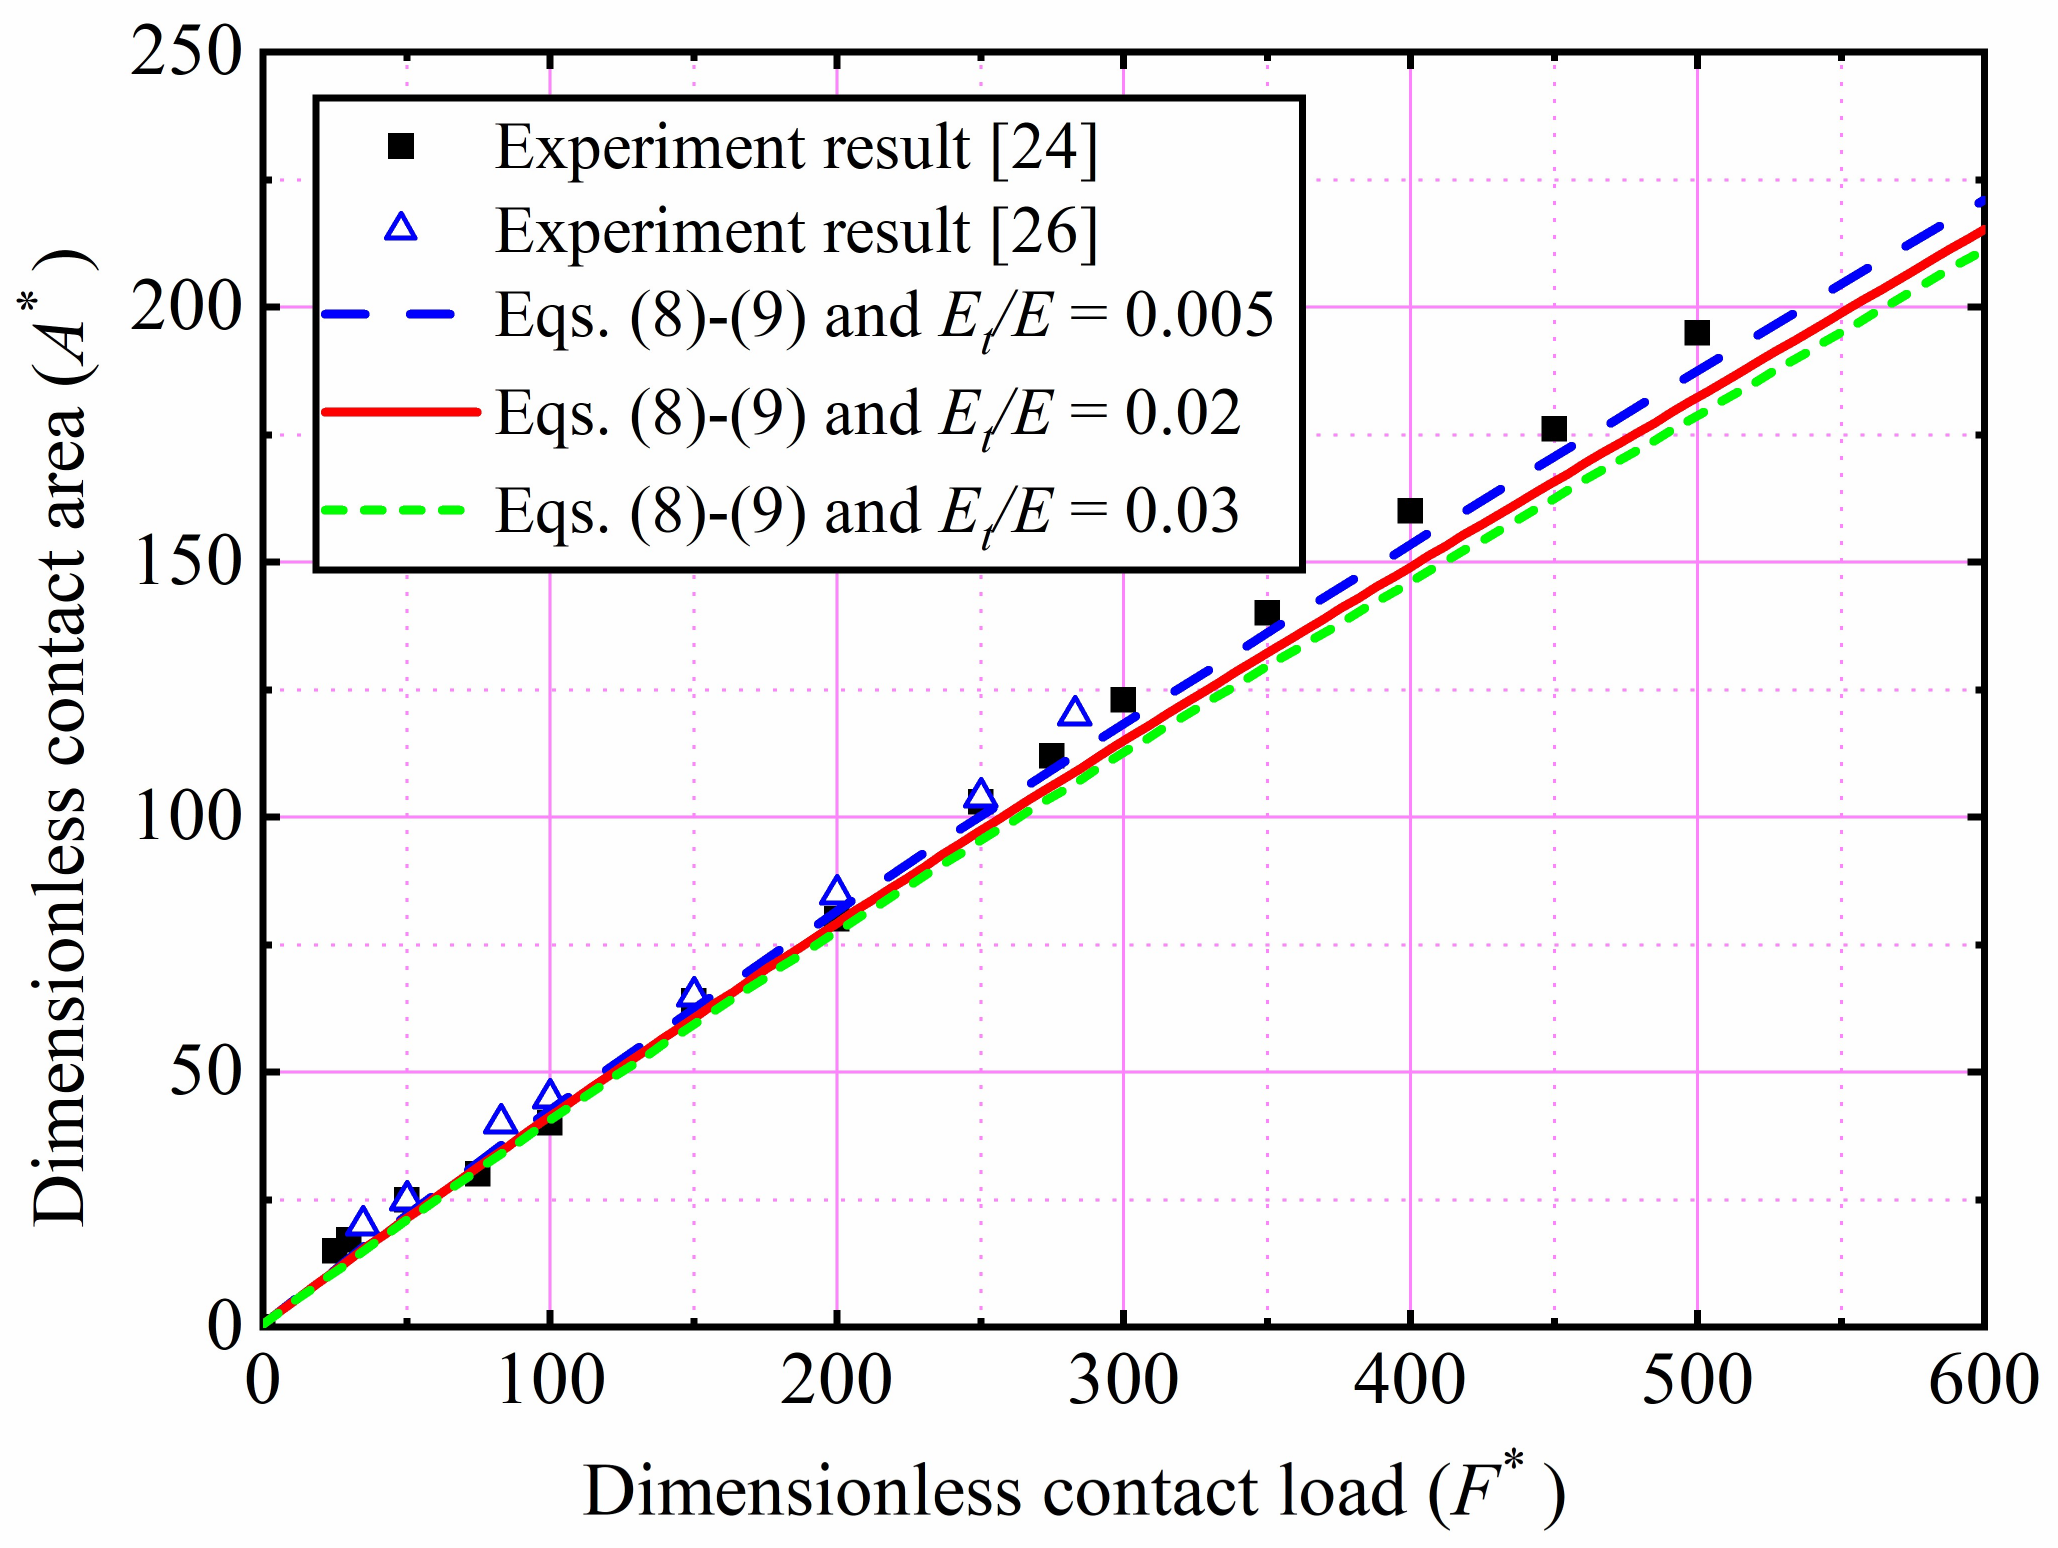
Figure 10.
Comparisons of F* as the function of ω* predicted by the present model and experiment results at ke = 1 and 0.07 ≤ Et/E ≤ 0.1.
Figure 10.
Comparisons of F* as the function of ω* predicted by the present model and experiment results at ke = 1 and 0.07 ≤ Et/E ≤ 0.1.
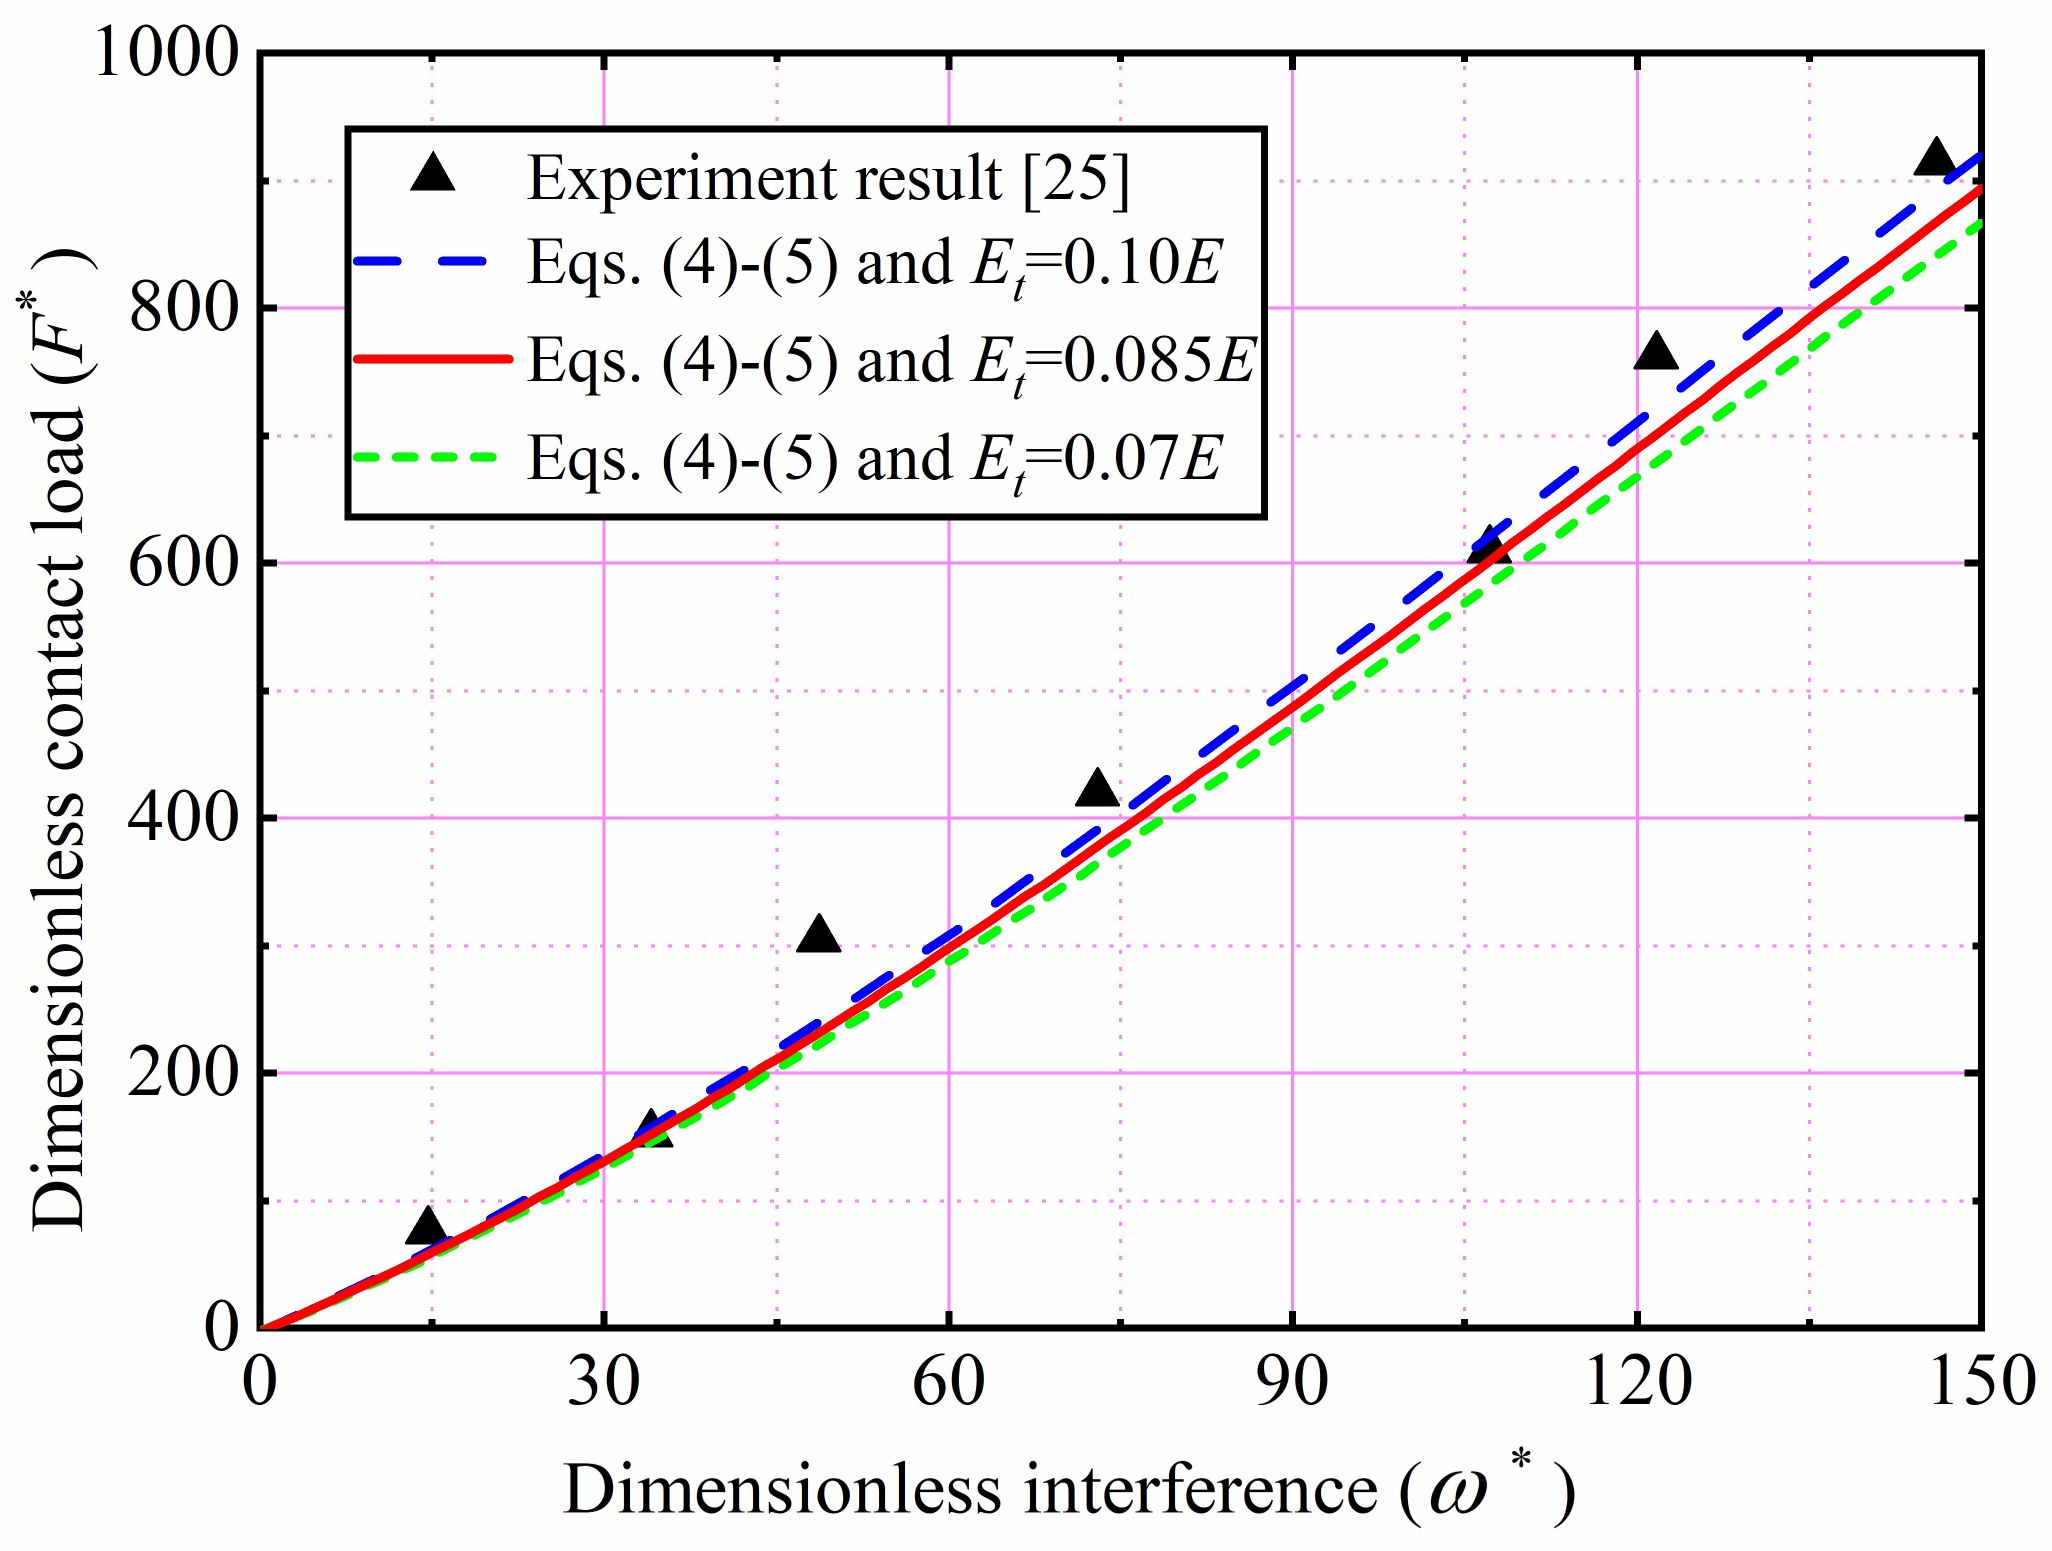
Figure 11.
Comparisons of F* predicted by the present and previous models at ke = 1.
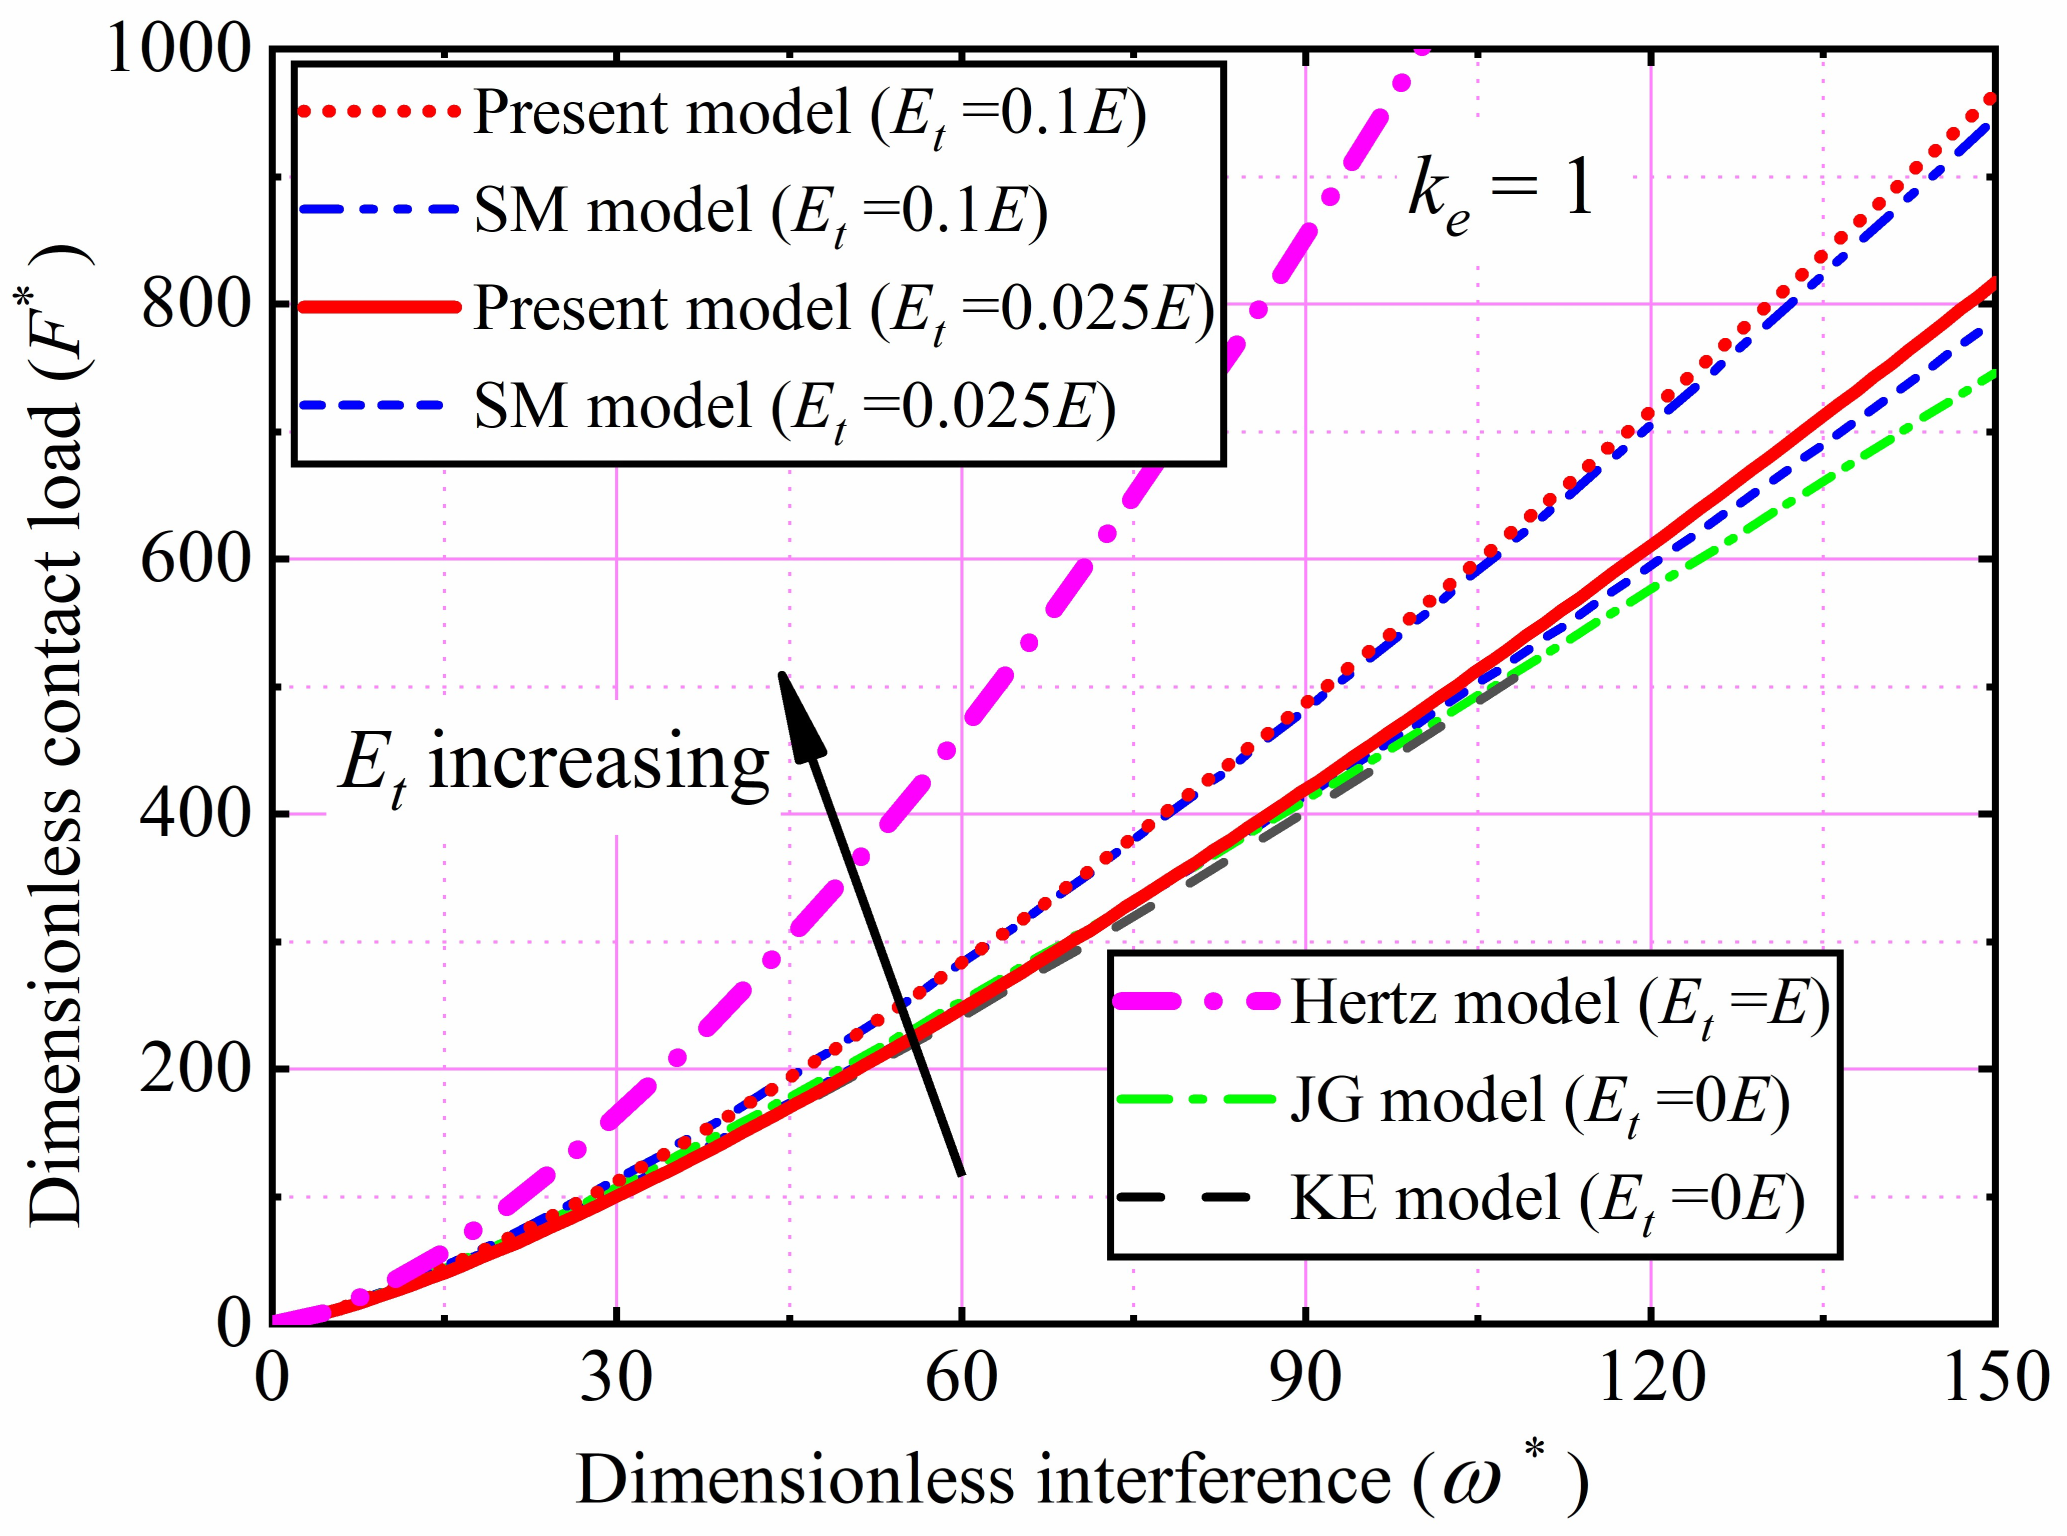
Figure 12.
Comparisons of F* predicted by the present and LL models at ke = 1/5 and 1/2.

Table 1.
Material properties.
| ke | Et | E (GPa) | Y (GPa) | R (mm) | ν | |
|---|---|---|---|---|---|---|
| 1 | 1/5 | 0; 0.025E; 0.05E; 0.075E; 0.1E | 207 | 0.7 | 1 | 0.3 |
| 2 | 1/2 | |||||
| 3 | 1 |
Table 2.
Comparison of Hertz and simulation results.
| Hertz | Simulation | Hertz | Simulation | Hertz | Simulation | |
|---|---|---|---|---|---|---|
| ke | 1/5 | 1/5 | 1/2 | 1/2 | 1 | 1 |
| F* | 6.98 | 6.95 | 2.61 | 2.63 | 1 | 0.986 |
| ω* | 3.21 | 3.19 | 1.85 | 1.83 | 1 | 0.99 |
| A* | 1.82 | 1.83 | 1.44 | 1.47 | 1 | 0.988 |
Publisher’s Note: MDPI stays neutral with regard to jurisdictional claims in published maps and institutional affiliations. |
© 2022 by the authors. Licensee MDPI, Basel, Switzerland. This article is an open access article distributed under the terms and conditions of the Creative Commons Attribution (CC BY) license (https://creativecommons.org/licenses/by/4.0/).
Share and Cite
MDPI and ACS Style
Chen, J.; Zhang, W.; Wang, C.; Liu, D.; Zhu, L. Effect of Strain Hardening and Ellipticity on Elastic–Plastic Contact Behaviour between Ellipsoids and Rigid Planes. Machines 2022, 10, 488. https://doi.org/10.3390/machines10060488
AMA Style
Chen J, Zhang W, Wang C, Liu D, Zhu L. Effect of Strain Hardening and Ellipticity on Elastic–Plastic Contact Behaviour between Ellipsoids and Rigid Planes. Machines. 2022; 10(6):488. https://doi.org/10.3390/machines10060488
Chicago/Turabian StyleChen, Jian, Wangyang Zhang, Chenglong Wang, Di Liu, and Linbo Zhu. 2022. "Effect of Strain Hardening and Ellipticity on Elastic–Plastic Contact Behaviour between Ellipsoids and Rigid Planes" Machines 10, no. 6: 488. https://doi.org/10.3390/machines10060488
Note that from the first issue of 2016, this journal uses article numbers instead of page numbers. See further details here.