
SOC Estimation Based on Hysteresis Characteristics of Lithium Iron Phosphate Battery


Abstract
:1. Introduction
2. Establishment of Battery Model Considering Hysteresis Characteristics
2.1. Analysis of Hysteresis Characteristics
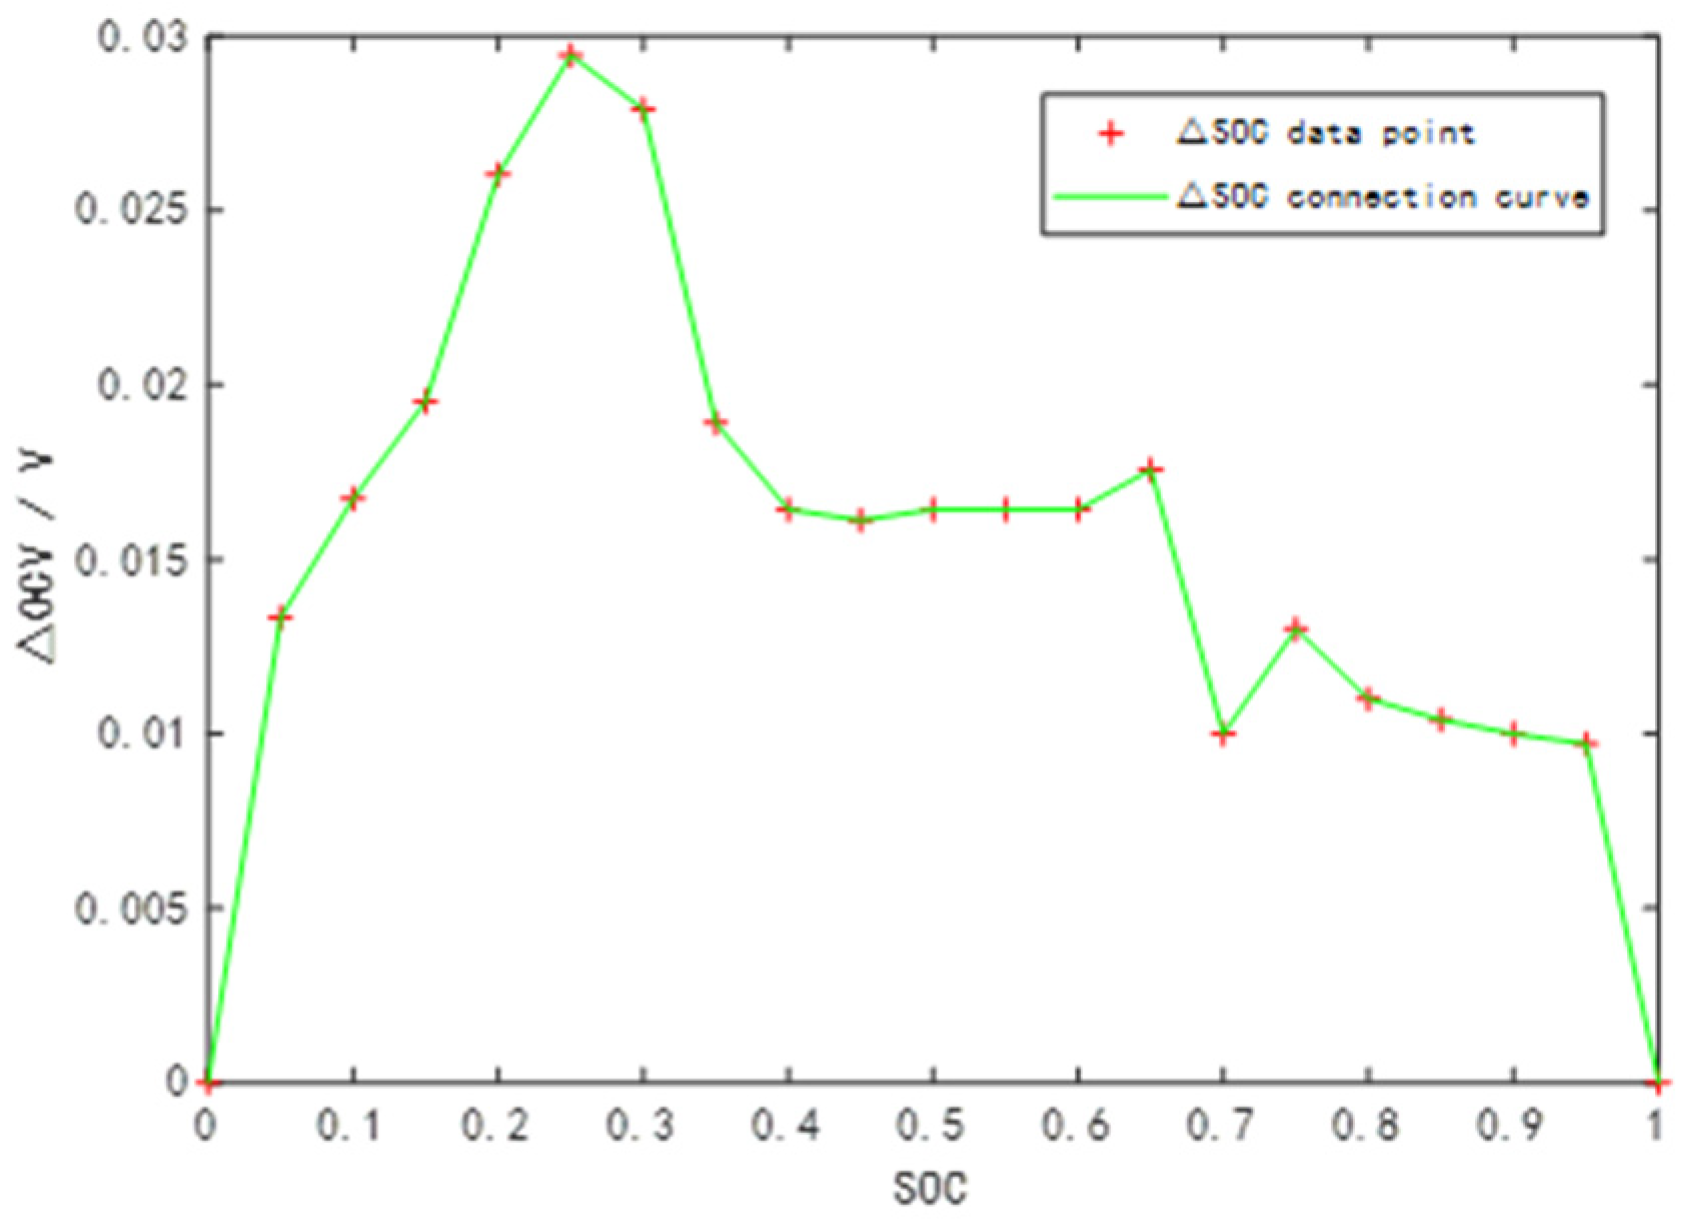
2.1.1. Analysis of Hysteresis Main Loop
- Fully charge the test battery (SOC = 100%) with the standard charging method of constant current and then constant voltage. Then let it stand for 1 h;
- Starting from the battery SOC = 100%, discharge 5% of the capacity at a 1/3 C rate. Then the terminal voltage was recorded after standing for 1 h. Repeat the test 20 times until the battery SOC = 0%;
- Starting from the battery SOC = 0%, charge the battery with 5% capacity at 1/3 C rate. Then the terminal voltage was recorded after standing for 1 h. Repeat the test 20 times until the battery SOC = 100%.
2.1.2. Hysteresis Small Loop Analysis
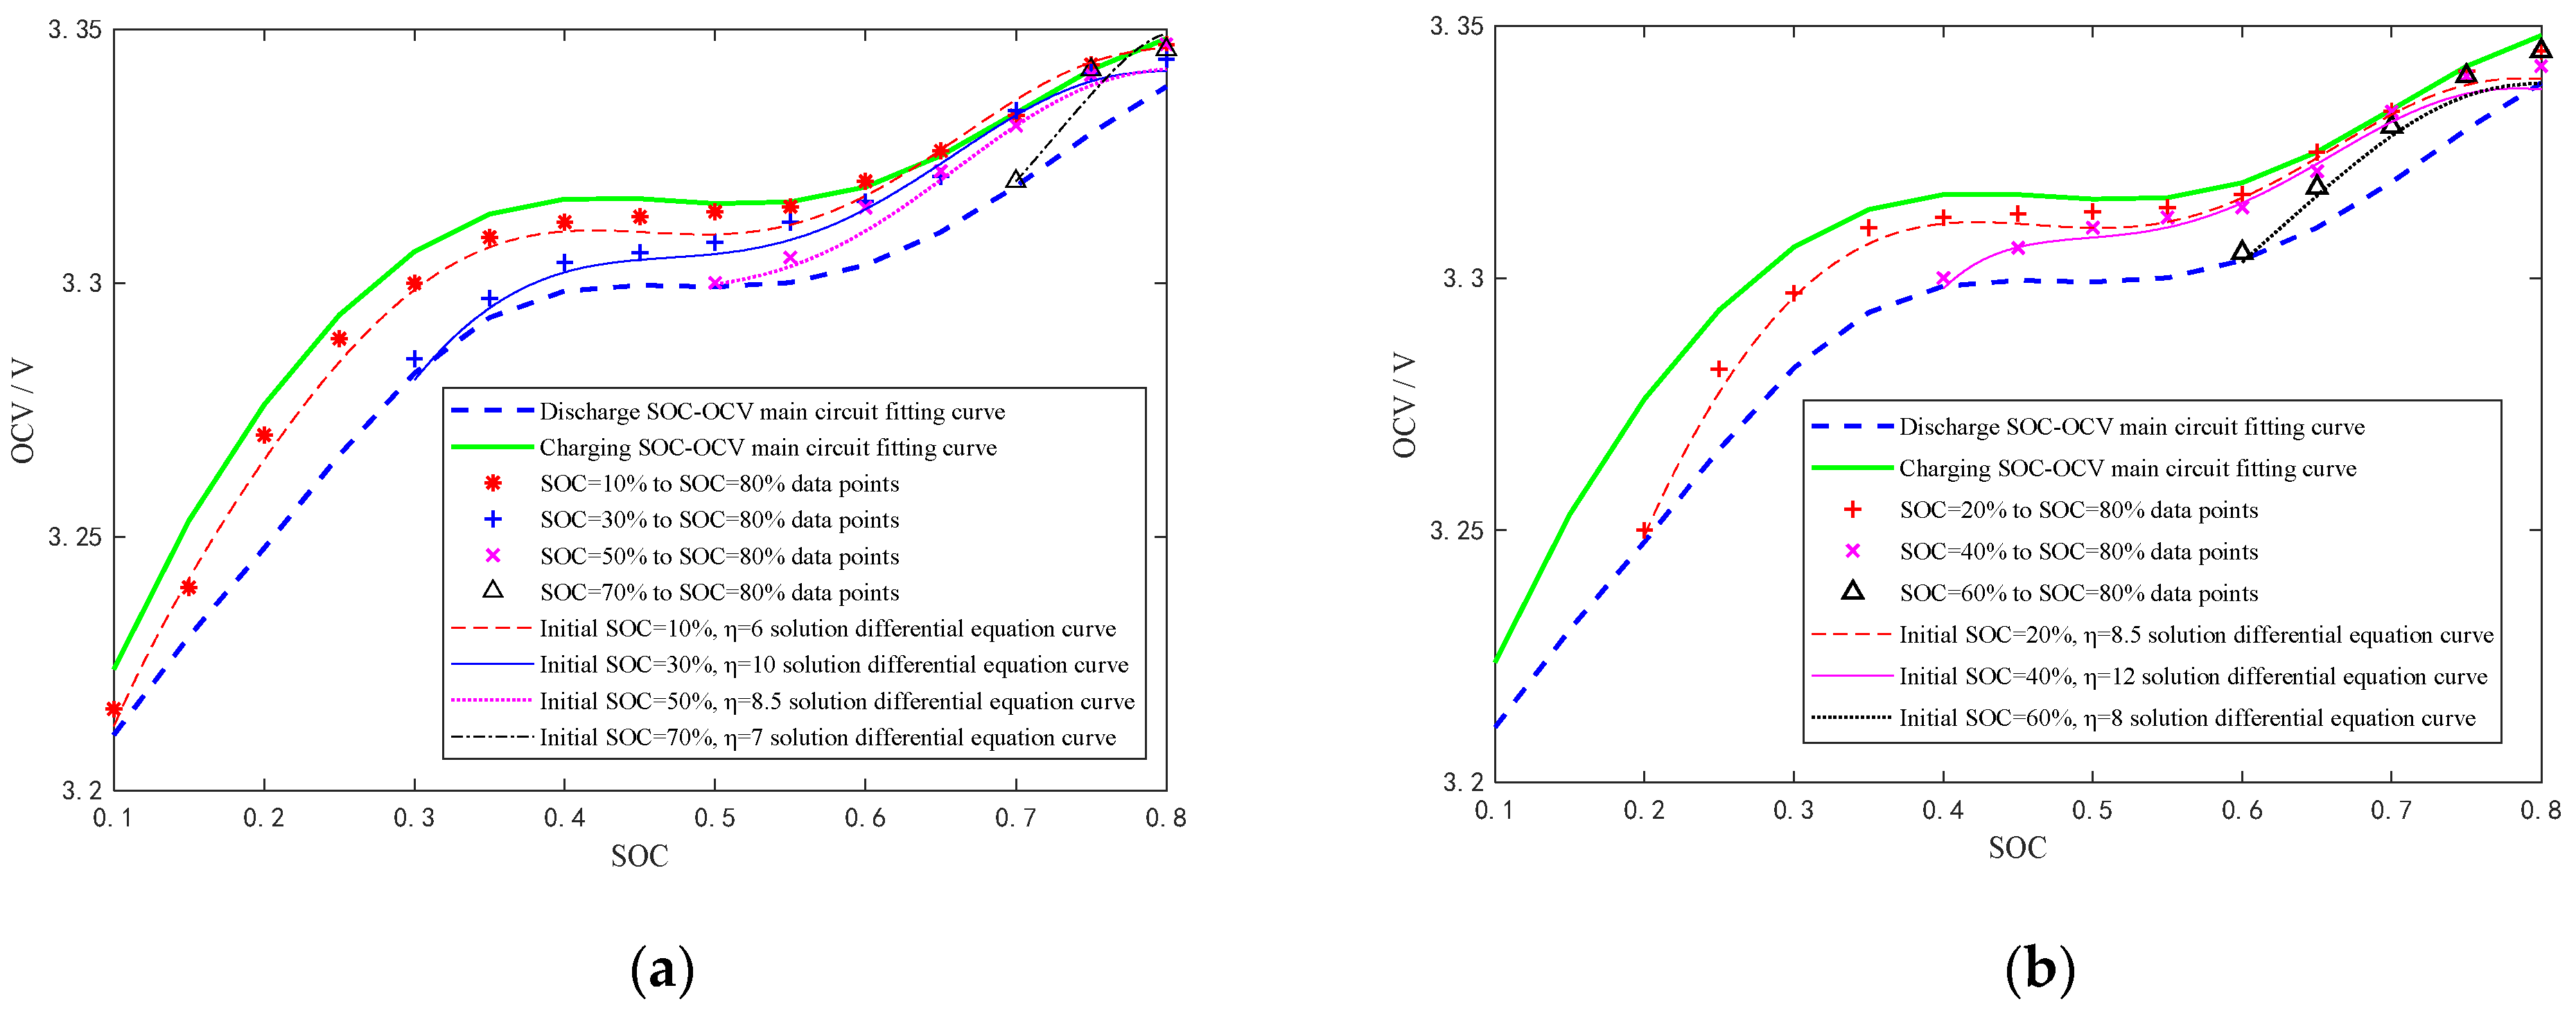
- Fully charge the test battery (SOC = 100%) with the standard charging method of constant current and then constant voltage. Then let it stand for 1 h;
- From SOC = 100%, discharge at 1/3 C rate to SOC = 10%. Record the terminal voltage after standing for 1 h;
- Charge 5% capacity at 1/3 C rate. The terminal voltage was recorded after standing for 1 h. Repeat the test several times until the SOC is 80%;
- In the same way, the charging hysteresis small loop data of different SOC starting points (SOC is 20%, 30%, 40%, 50%, 60%, 70%) and the endpoint of 80% SOC are obtained by testing in the a, b, and c methods;
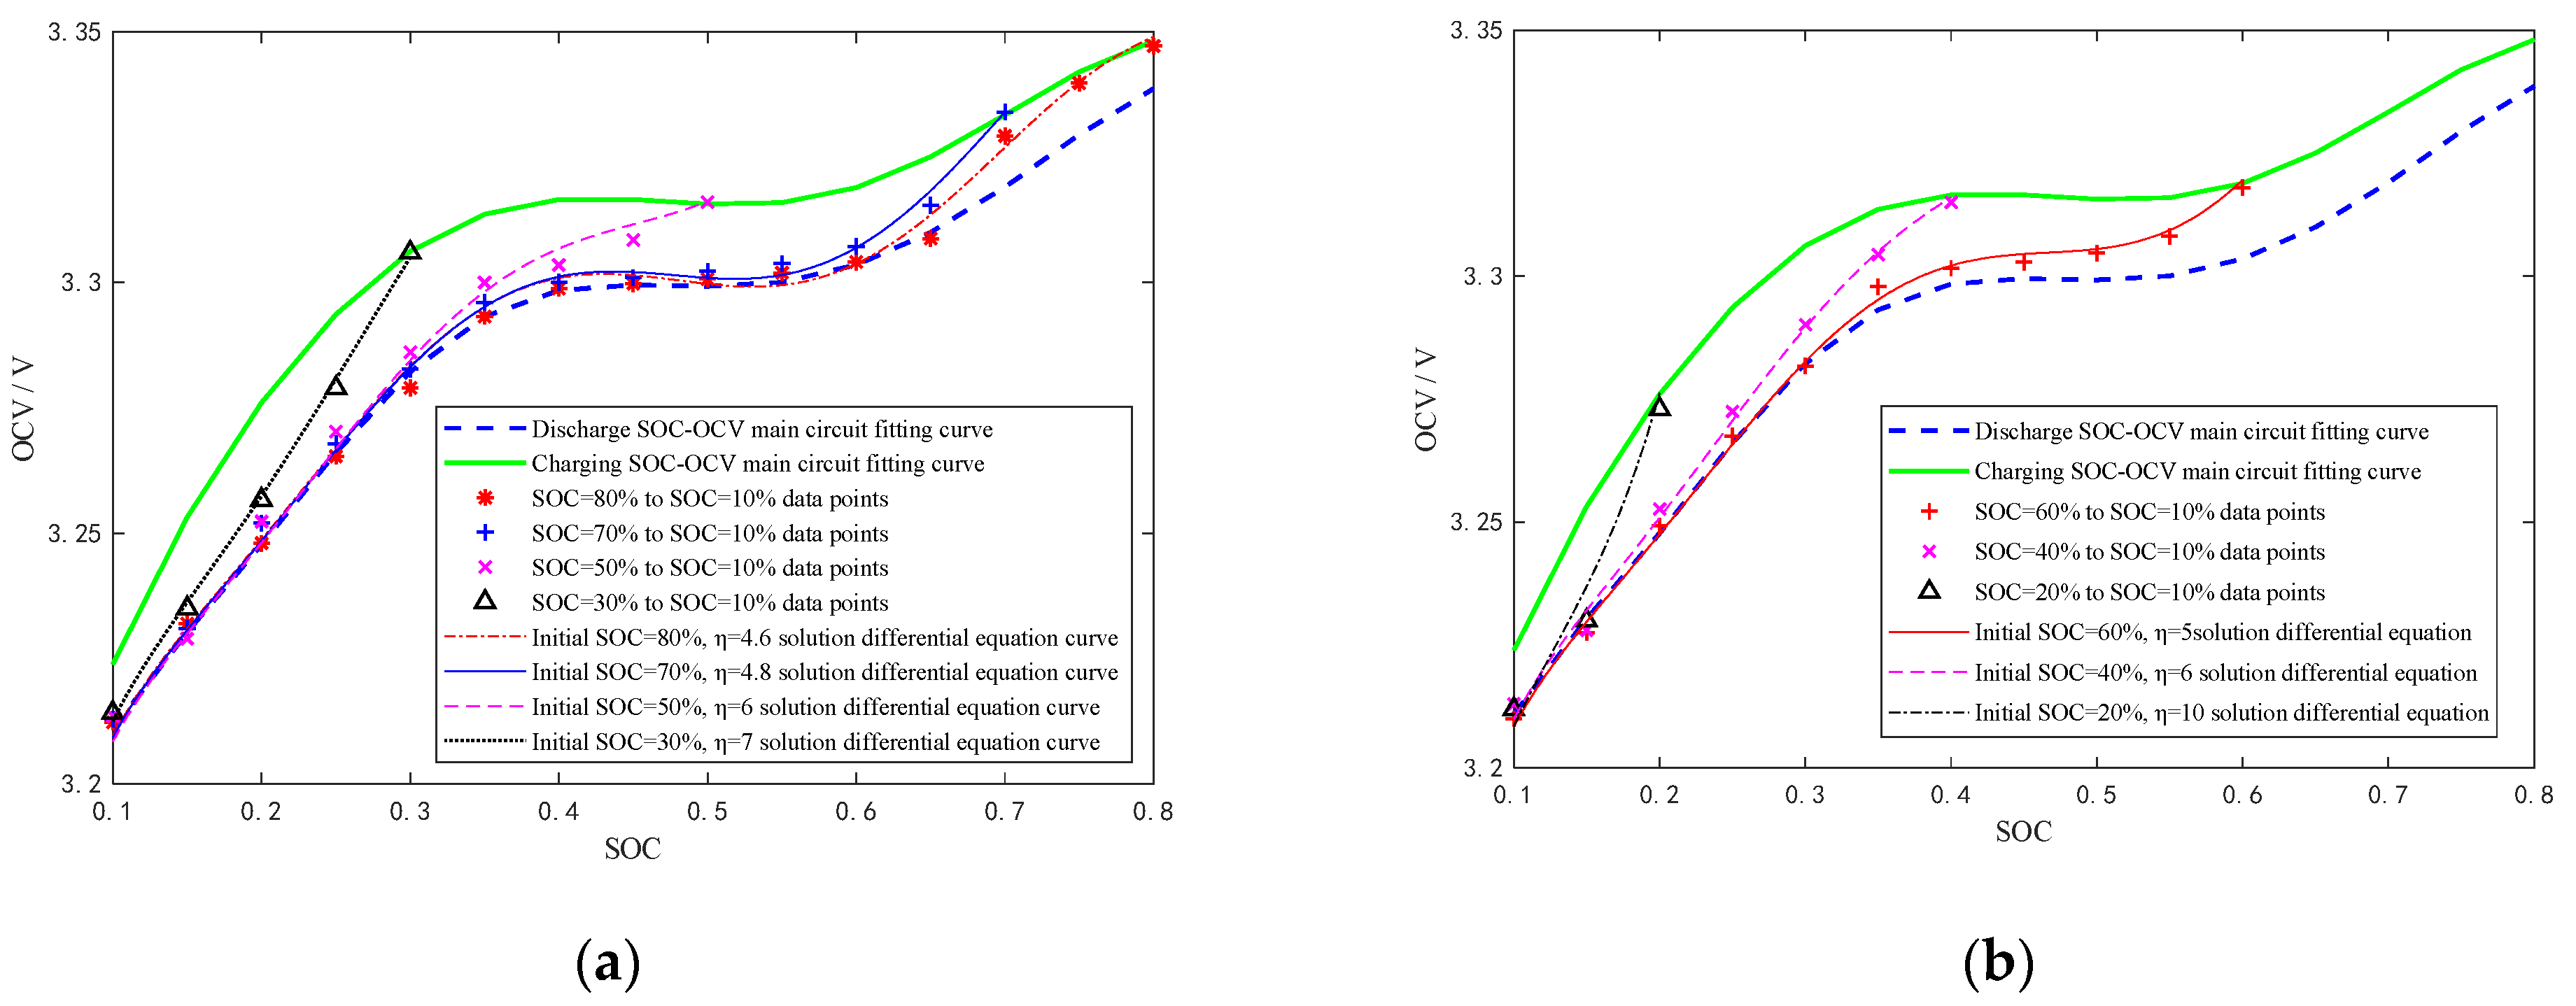
- Put the test battery to SOC = 0 by standard discharge method. Then let it stand for 1 h;
- Starting at SOC = 0%, discharge at 1/3 C rate to SOC = 80%. Then record the terminal voltage after standing for 1 h;
- Discharge 5% capacity at 1/3 C rate. Then the terminal voltage was recorded after standing for 1 h. Repeat the test several times until SOC = 10%;
- In the same way, the charging hysteresis small loop data of different SOC starting points (SOC is 70%, 60%, 50%, 40%, 30%, 20%) and the endpoint of 10% SOC are obtained by testing in the e, f and g methods.
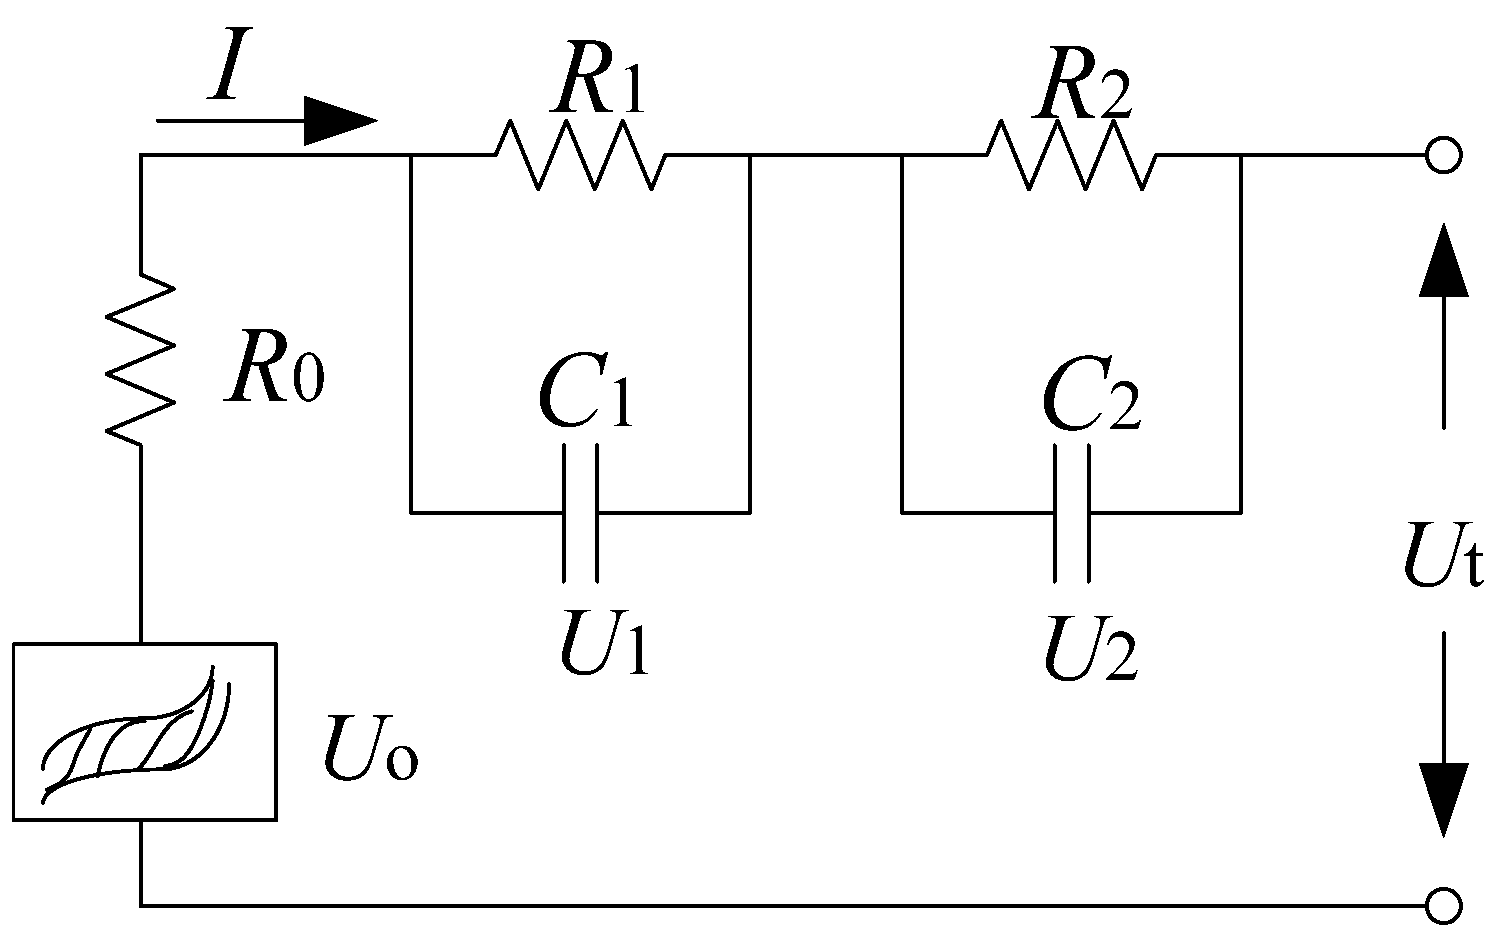
2.2. Equivalent Circuit Model Based on Hysteresis Characteristics
3. Online Identification of Model Parameters
4. Joint Estimation of Battery SOC
4.1. Battery SOC Estimation by Extended Kalman Filter
4.2. A Joint Algorithm Considering Battery Hysteresis
5. Experiment and Algorithm Verification Analysis
5.1. Experimental Procedure
5.2. Comparative Analysis of Algorithm Results
6. Conclusions
- (1)
- Aiming at the hysteresis characteristics of the open-circuit voltage of LiFePO4 battery, an equivalent circuit model considering the hysteresis characteristics of the battery is established on the basis of a large number of open-circuit voltage hysteresis small loop and hysteresis large loop tests. The model can correct the charge-discharge SOC-OCV relationship corresponding to the battery in real time according to the current SOC and charge-discharge state. Aiming at the uncertainty of variable parameters in the hysteresis characteristic model, a segmented test method is used to determine the appropriate values of model parameters in different SOC intervals, so as to achieve a more accurate correction of the battery SOC-OCV relationship and improve the battery SOC estimation accuracy.
- (2)
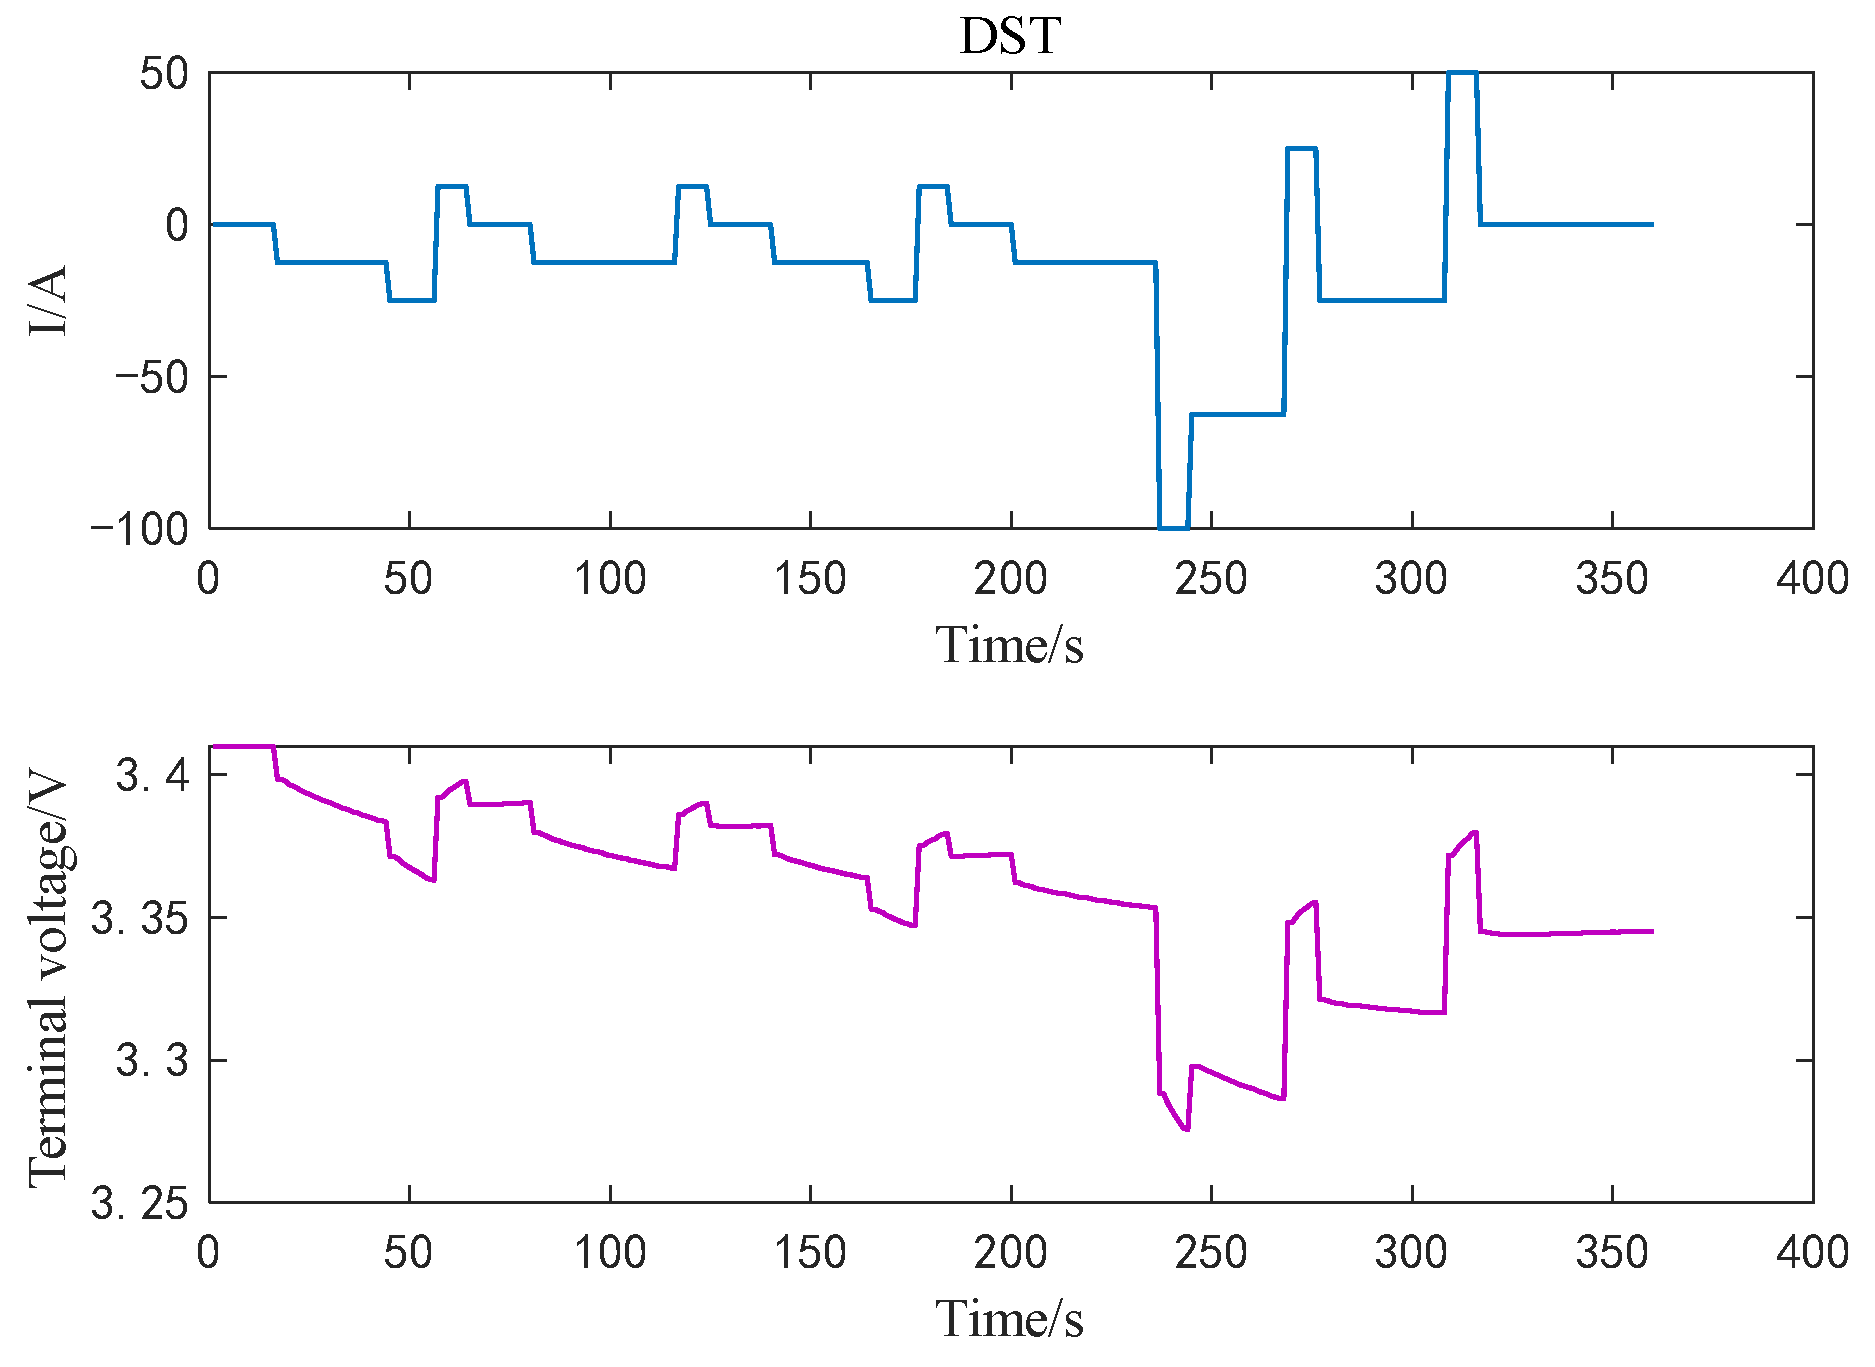
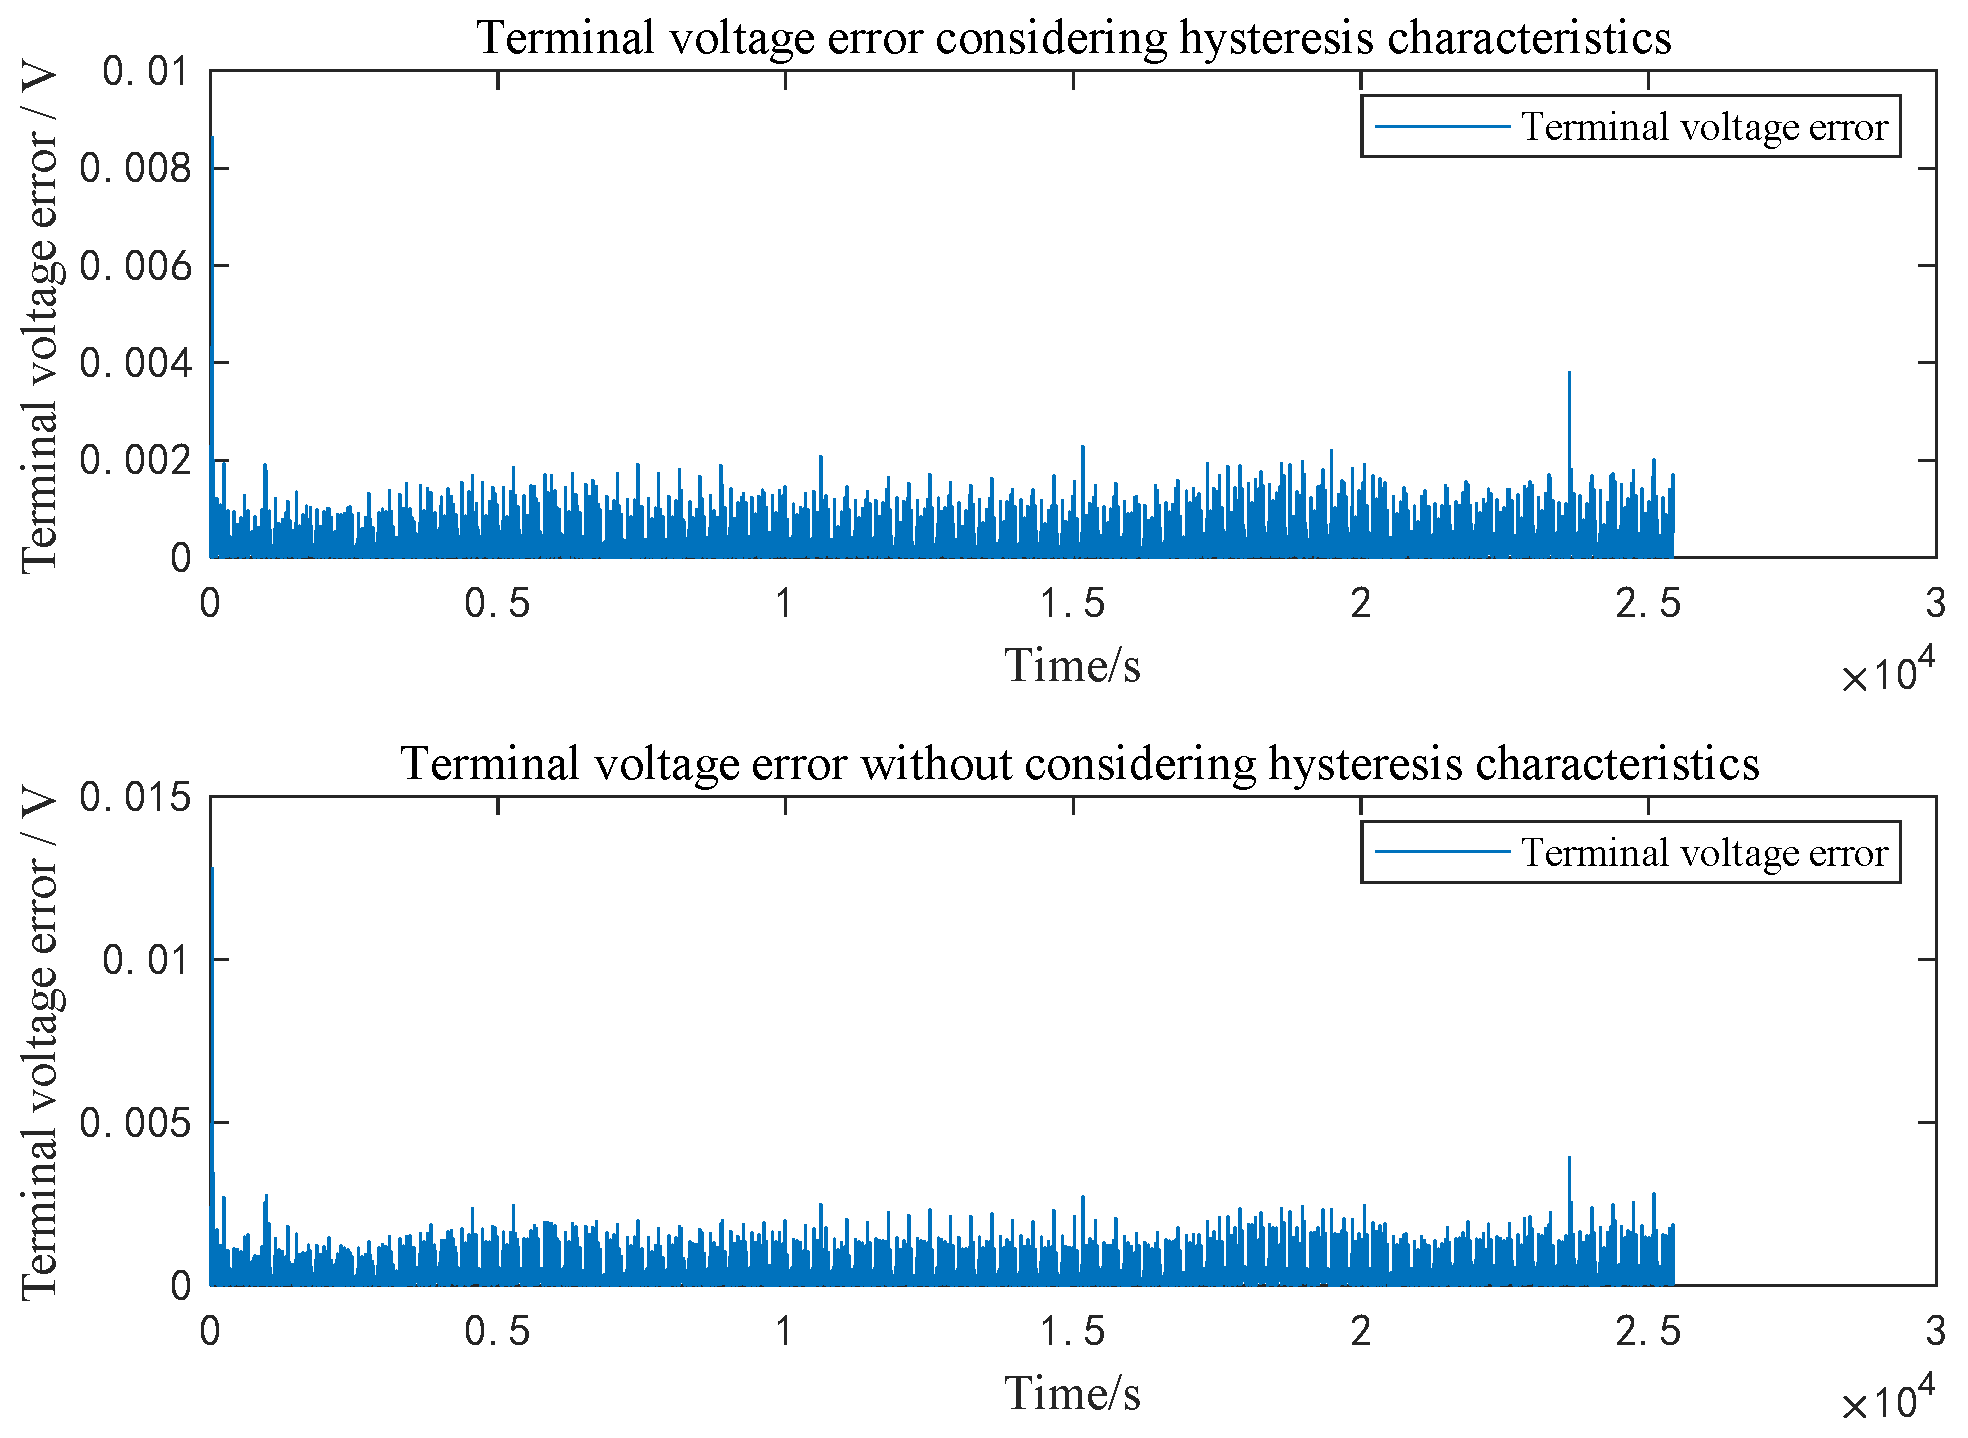
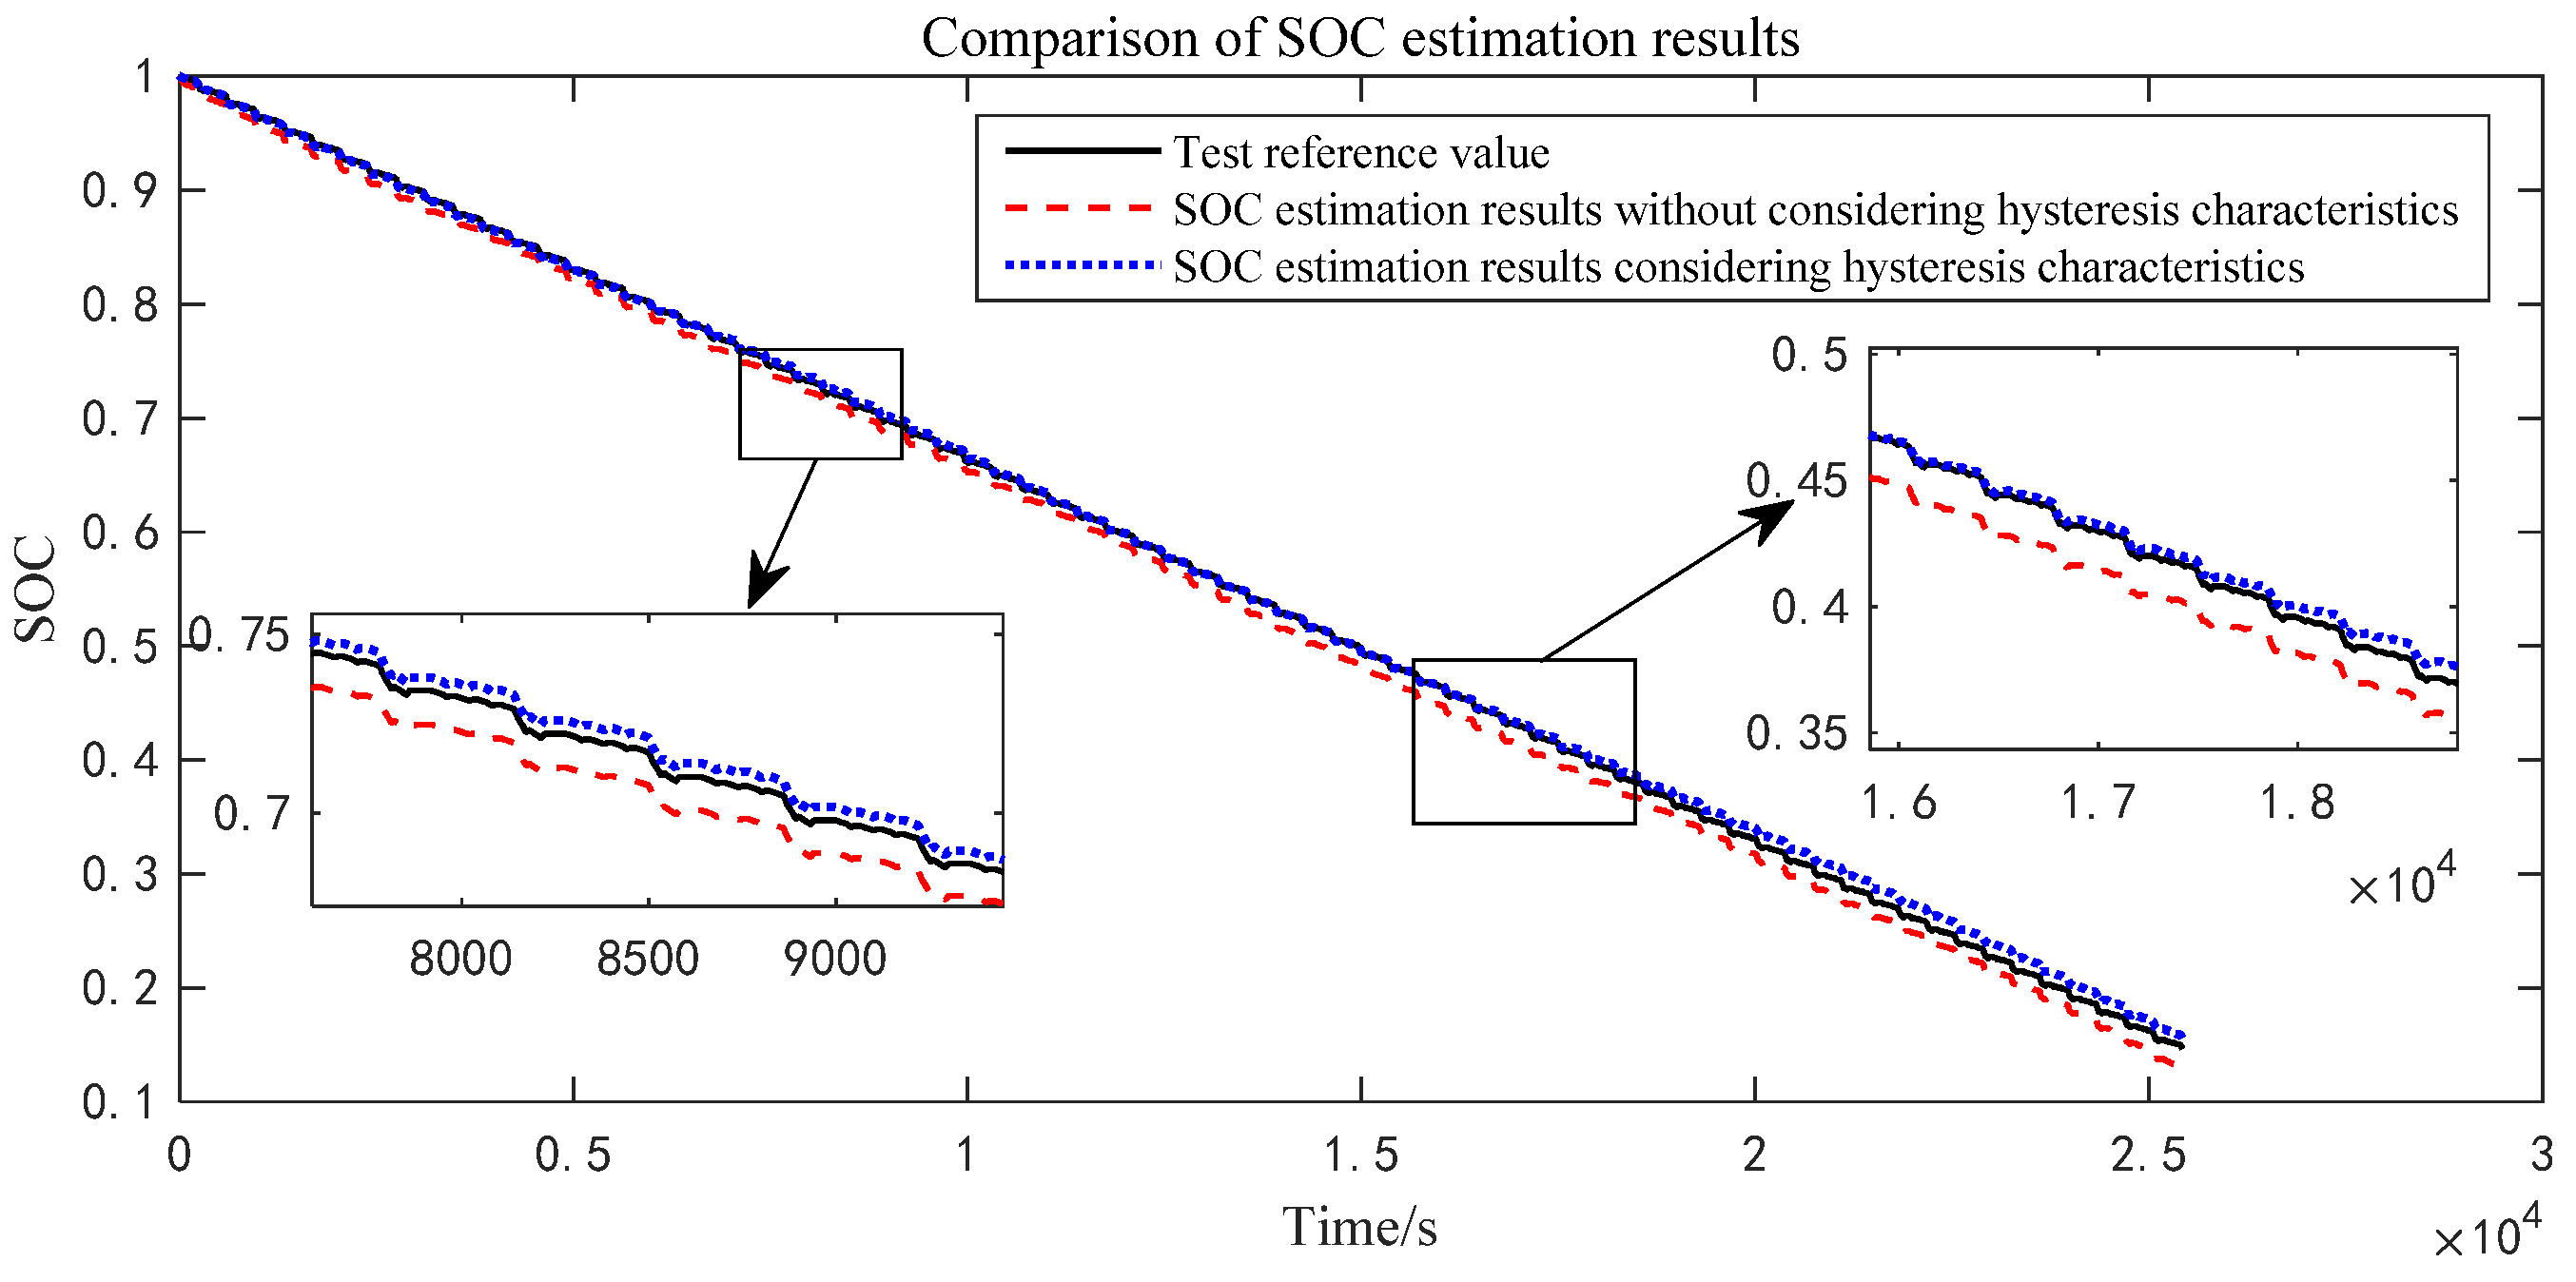
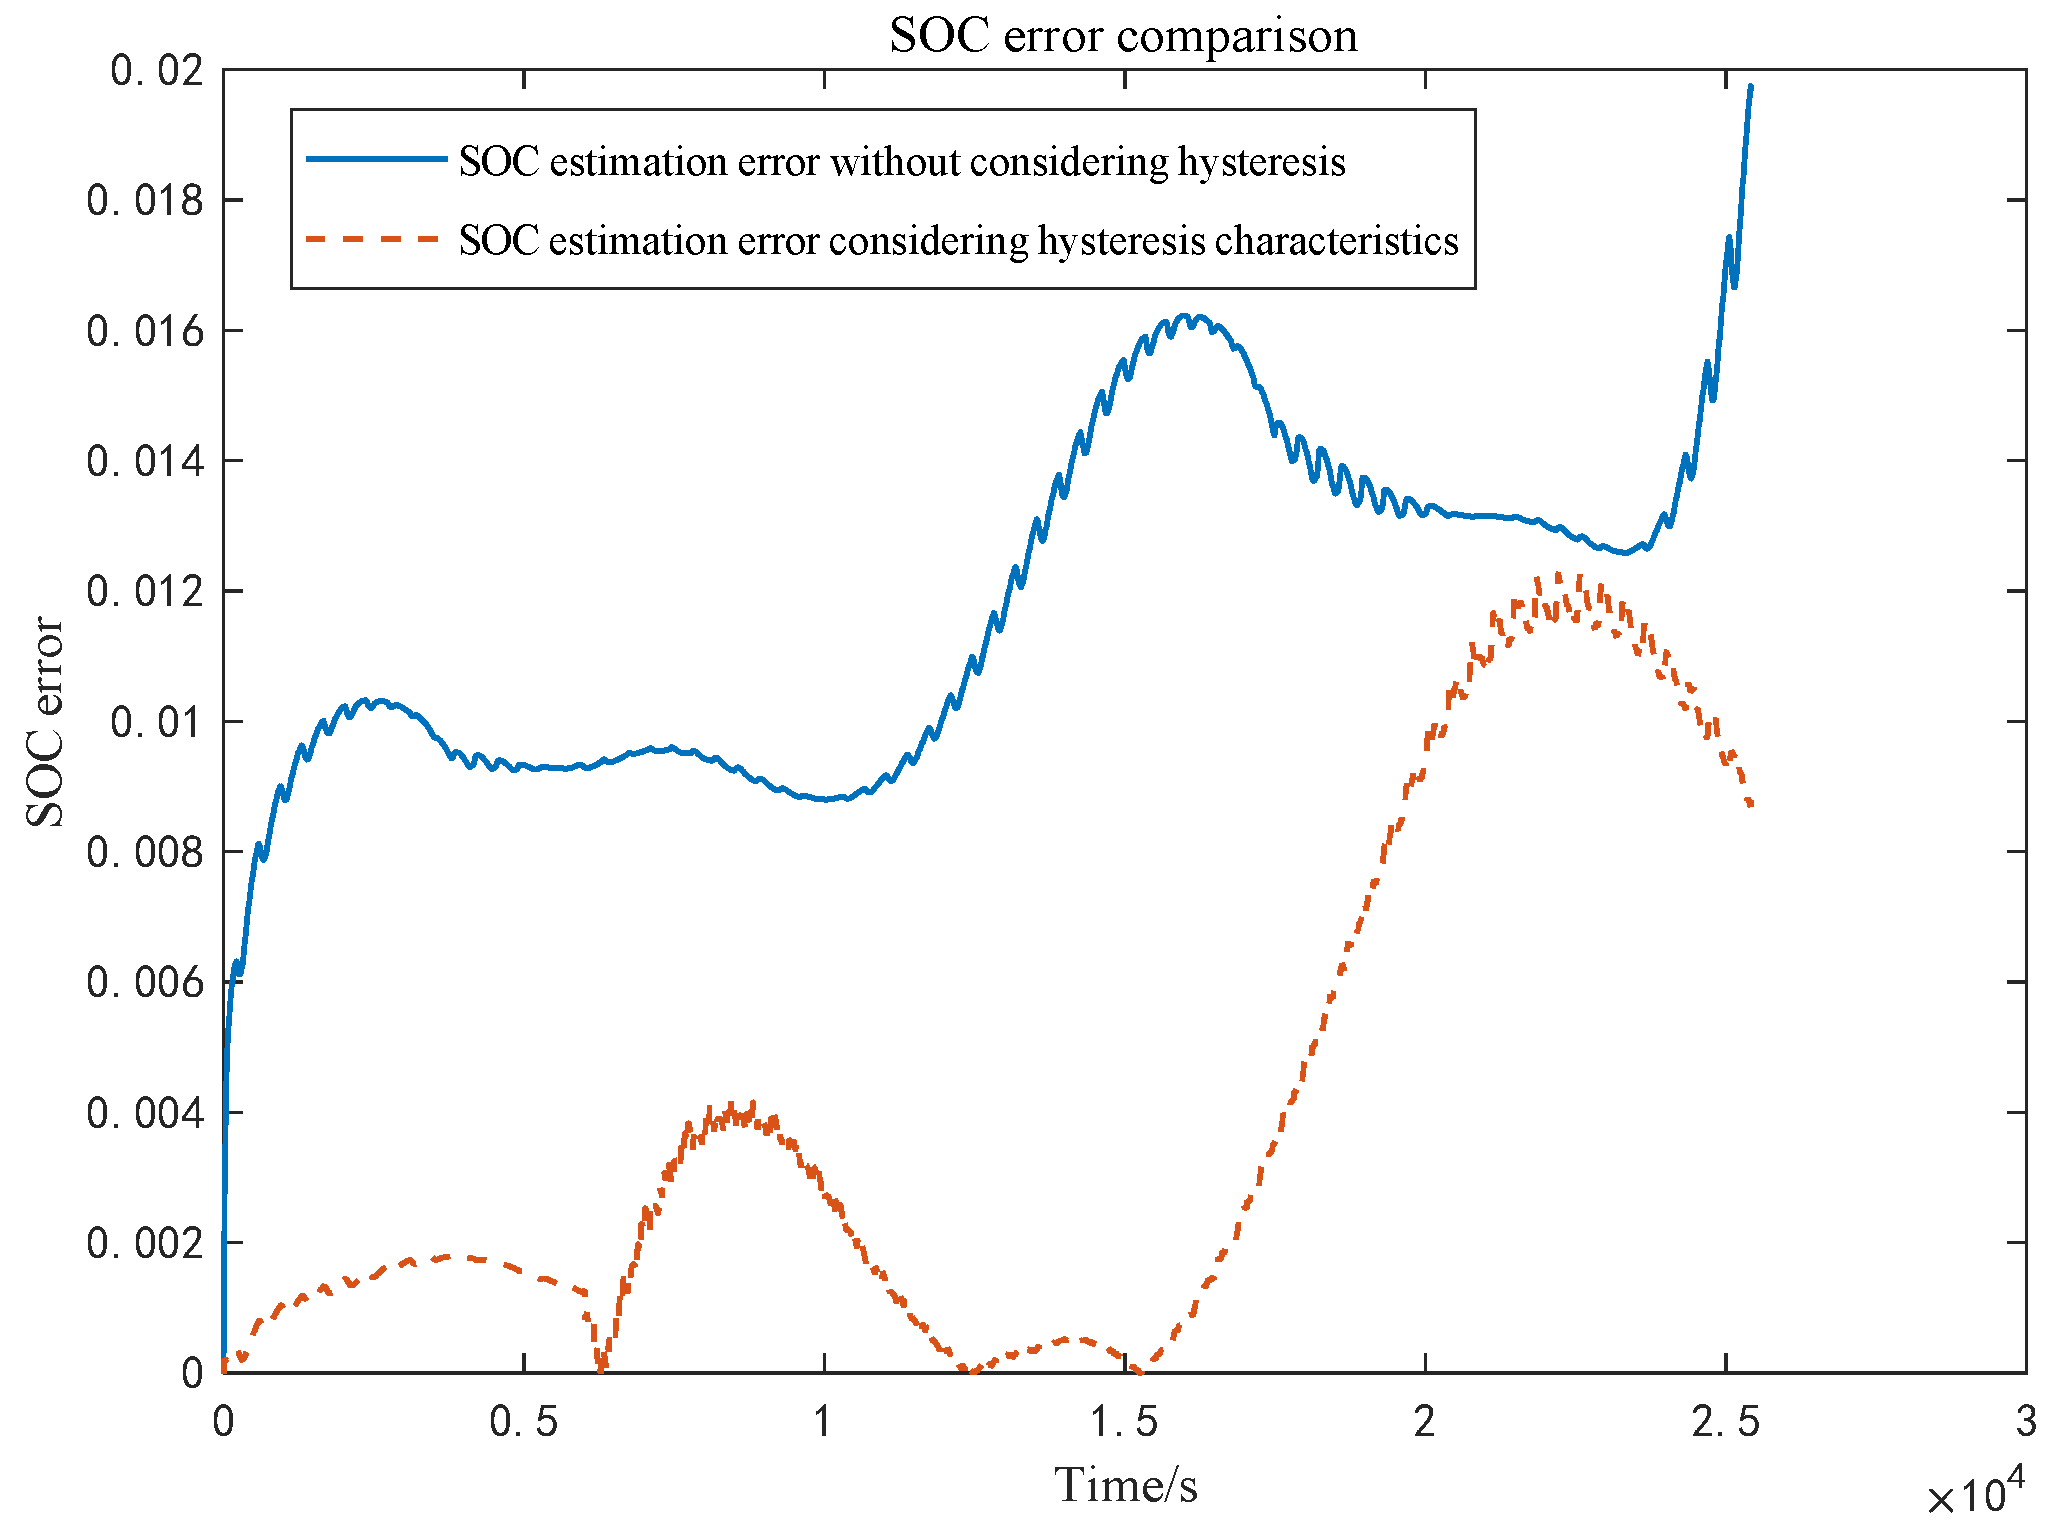
- Based on the established equivalent circuit model considering the hysteresis characteristics of lithium iron phosphate batteries, the recursive least squares method with a forgetting factor combined with the extended Kalman filter algorithm is used to realize the online identification of model parameters and the real-time online estimation of battery SOC. Finally, the estimation methods considering battery hysteresis characteristics and those without considering battery hysteresis characteristics are compared and analyzed under DST test conditions. In the estimation of the terminal voltage, the maximum terminal voltage error, average terminal voltage error, and RMSE error obtained by considering the hysteresis characteristic algorithm are 0.86%, 0.021%, and 0.042%, respectively. The maximum terminal voltage error, average terminal voltage error, and RMSE error obtained by the algorithm without considering the hysteresis characteristic are 1.279%, 0.024%, and 0.056%, respectively. In terms of the SOC estimation of the battery, the maximum error, average error, and RMSE of the SOC obtained by considering the hysteresis characteristic algorithm are 1.22%, 0.41%, and 0.57%, respectively. The maximum error, average error, and RMSE of the SOC obtained by the algorithm without considering the hysteresis characteristic are 1.97%, 1.11%, and 0.93%, respectively. The comparison results show that the forgetting factor recursive least squares method combined with the extended Kalman filter algorithm considering battery hysteresis characteristics proposed in this paper has a greater estimation accuracy for the battery SOC.
- (3)
- Although the method proposed in this paper has a high estimation accuracy for battery SOC, there are still shortcomings in the current research, mainly including that the parameters of the hysteresis differential equation are not given rigorously, and the battery hysteresis characteristics under different temperature environments and different aging states have not been studied. Therefore, in future work, the author will conduct further research on the optimization of the model parameter selection, battery hysteresis characteristics at different temperatures, and different battery aging states.
Author Contributions
Funding
Institutional Review Board Statement
Informed Consent Statement
Data Availability Statement
Conflicts of Interest
References
- Fu, S.-Y.; Lv, T.-L.; Min, F.-Q.; Luo, W.-L.; Luo, C.-D.; Wu, L.; Xie, J.Y. Overview of SOC estimation methods for lithium-ion batteries for electric vehicles. Energy Storage Sci. Technol. 2021, 10, 1127–1136. [Google Scholar] [CrossRef]
- Cheng, Z.; Chen, Y.; Li, W.; Liu, J.; Li, L.; Zhou, P.; Chang, W.; Lu, Z. Full factorial simulation test analysis and I-GA based piecewise model comparison for efficiency characteristics of hydro mechanical CVT. Machines 2022, 10, 358. [Google Scholar] [CrossRef]
- Cai, X.; Zhang, C.; Zhang, L.; Zhang, W.; Gao, L. Comparative study on peak power estimation of lithium-ion batteries based on equivalent circuit model. Chin. J. Mech. Eng. 2021, 57, 64–76. [Google Scholar] [CrossRef]
- Tan, F.-M.; Wang, Q. Power battery SOC estimation model based on improved unscented kalman filter algorithm. Automot. Technol. 2019, 3, 18–24. [Google Scholar] [CrossRef]
- Zuo, S.L.; Wang, Y.F.; Zhang, Q.H. Research progress of activated carbon as a material for electrical energy storage and energy conversion. Chin. J. For. Eng. 2018, 3, 1–11. [Google Scholar] [CrossRef]
- Xiong, R.; He, H.; Sun, F.; Liu, X.; Liu, Z. Model-based state of charge and peak power capability joint estimation of lithium-ion battery in plug-in hybrid electric vehicles. J. Power Sources 2013, 229, 159–169. [Google Scholar] [CrossRef]
- Hosen, M.S.; Kalogiannis, T.; Youssef, R.; Karimi, D.; Behi, H.; Jin, L.; Van Mierlo, J.; Berecibar, M. Twin-model framework development for a comprehensive battery lifetime prediction validated with a realistic driving profile. Energy Sci. Eng. 2021, 9, 2191–2201. [Google Scholar] [CrossRef]
- Karimi, D.; Behi, H.; Akbarzadeh, M.; Mierlo, J.V.; Berecibar, M. Holistic 1D electro-thermal model coupled to 3D thermal model for hybrid passive cooling system analysis in electric vehicle24s. Energies 2021, 14, 5924. [Google Scholar] [CrossRef]
- Partovibakhsh, M.; Liu, G. An Adaptive unscented kalman filtering approach for online estimation of model parameters and state-of-charge of lithium-ion batteries for autonomous mobile robots. IEEE Trans. Control. Syst. Technol. 2015, 23, 357–363. [Google Scholar] [CrossRef]
- Wang, L.; Hao, R.Y.; Liu, W. Multi-factor forest fire grade prediction model based on particle swarm optimization and BP neural network. Chin. J. For. Eng. 2019, 4, 137–144. [Google Scholar] [CrossRef]
- Luo, Y.; Qi, P.-W.; Kan, Y.-Z.; Li, P.-R.; Liu, L.; Cui, H.-Y. Parameter identification of lithium battery model based on simulated annealing algorithm. Automot. Eng. 2018, 40, 1418–1425. [Google Scholar] [CrossRef]
- Wang, W.-L.; He, F.; Zheng, Y.-L.; Shen, X.-Z.; Zhang, X.-Q. Estimation of lithium battery SOC based on RLS-EKF joint algorithm. Power Technol. 2020, 44, 1502–1505. [Google Scholar] [CrossRef]
- Zheng, L.-D.; Dong, J.-Y.; Ma, Q. SOC estimation of lithium battery based on parameter identification and AEKF. Power Technol. 2020, 44, 1502–1505. [Google Scholar] [CrossRef]
- Pang, Z.; Cui, H. System Identification and Adaptive Control MATLAB Simulation, 3rd ed.; Beijing University of Aeronautics and Astronautics Press: Beijing, China, 2017; p. 295. [Google Scholar]
- Ma, J.; Zhang, D.-Y.; Zhao, X.; Zhang, K. Battery SOC estimation based on random weighted adaptive volume kalman. China J. Highw. Transp. 2019, 32, 234–244. [Google Scholar] [CrossRef]
- Sun, S. A new stress field intensity model and its application in component high cycle fatigue research. PLoS ONE 2020, 15, e0235323. [Google Scholar] [CrossRef]
- Chang, C.-C. Research on SOC Estimation Method of Fractional-Order Power Battery. Master’s Thesis, Nanjing Forestry University, Nanjing, China, 2020. [Google Scholar] [CrossRef]
- Zhang, Y.-H.; Li, X.; Zuo, H.-M. Research on correction algorithm of hysteresis characteristics of LiFePO4 battery. J. Guangxi Univ. Sci. Technol. 2018, 29, 31–36. [Google Scholar] [CrossRef]
- Chen, S.; Kang, X.; Zhu, Z.-X.; Zhang, Y.-J.; Han, X. Correction method of battery polarization voltage error considering hysteresis effect. Power Syst. Technol. 2020, 44, 316–322. [Google Scholar] [CrossRef]
- Cheng, Z.; Lv, J.-K.; Liu, J.-G.; Liu, J.-G.; Wang, L. Application of equivalent hysteresis model in SOC estimation of Li-ion battery. J. Hunan Univ. Nat. Sci. Ed. 2015, 42, 63–67. [Google Scholar] [CrossRef]
- Ban, D.-F.; Zheng, Y.-P.; Chang, C.-C.; Sun, W.-M. Research on hysteresis characteristics of LiFePO4 batteries. Power Technol. 2019, 43, 1121–1124. [Google Scholar] [CrossRef]
- Xu, X.; Chen, D.; Zhang, L.; Chen, N. Hopf bifurcation characteristics of the vehicle with rear Axle compliance steering. Shock. Vib. 2019, 2019, 1–12. [Google Scholar] [CrossRef] [Green Version]
- Guo, B.-F.; Zhang, P.; Wang, W.-X.; Wang, F.-N. Research on SOC estimation of lithium iron phosphate battery based on OCV-SOC curve cluster. Power Technol. 2019, 43, 1125–1128. [Google Scholar] [CrossRef]
- Wu, C.L.; Hu, W.B.; Meng, J.H.; Liu, Z.X.; Cheng, Y.Q. Estimation of lithium-ion battery state of charge based on maximum correlation entropy extended kalman filtering algorithm. J. Electrotech. Technol. 2021, 36, 5165–5175. [Google Scholar] [CrossRef]
- Sun, S.; Zhang, X.; Wan, M.; Gong, X.; Xu, X. Study of quenched crankshaft high-cycle bending fatigue based on a local sub model and the theory of multi-axial fatigue. Metals 2022, 12, 913. [Google Scholar] [CrossRef]
- Lu, J.-K. Research on SOC Estimation Method of Lithium Iron Phosphate Battery. Master’s Thesis, Tianjin University, Tianjin, China, 2014. [Google Scholar] [CrossRef]
- Cheng, Z.; Zhou, H.; Lu, Z. A novel 10-parameter motor efficiency model based on I-SA and its comparative application of energy utilization efficiency in different driving modes for electric tractor. Agriculture 2022, 12, 362. [Google Scholar] [CrossRef]
- Tai, Y.; Li, P.; Zheng, Y.; Tian, J. Entropy generation and thermoelastic damping in the in-plane vibration of microring resonators. Entropy 2019, 21, 631. [Google Scholar] [CrossRef] [Green Version]
- Han, Y.-Y. Estimation of State of Charge of Lithium Battery Based on Improved Kalman Filter Algorithm. Master’s Thesis, Nanjing University of Posts and Telecommunications, Nanjing, China, 2020. [Google Scholar] [CrossRef]
- Zou, Y.; Hu, X.; Ma, H.; Li, S.E. Combined State of charge and state of health estimation over lithium-ion battery cell cycle lifespan for electric vehicles. J. Power Sources 2015, 273, 793–803. [Google Scholar] [CrossRef]
- Liu, Y.L.; Dai, Y.L.; Chen, Z. Lithium-ion Battery SOC Estimation Based on Finite Difference Extended Kalman Filter. J. Electrotech. Technol. 2014, 29, 221–228. [Google Scholar] [CrossRef]
- Tian, J.; Wang, Q.; Ding, J.; Wang, Y.; Ma, Z. Integrated control with DYC and DSS for 4WID electric vehicles. IEEE Access 2019, 7, 124077–124086. [Google Scholar] [CrossRef]
- Duan, J.; Wang, P.; Ma, W.; Qiu, X.; Tian, X.; Fang, S. State of charge estimation of lithium battery based on improved correntropy extended kalman filter. Energies 2020, 13, 4197. [Google Scholar] [CrossRef]
- Yao, J.; Wang, M.; Bai, Y. Automobile active tilt based on active suspension with H-infinity robust control. Proceedings of the Institution of Mechanical Engineers. Part D J. Automob. Eng. 2021, 235, 1320–1329. [Google Scholar] [CrossRef]
- Li, H.; Wang, L.B.; Wang, F.Q.; Li, Z.Z. Research on multi-objective optimization of high-speed rail tunnel support parameters. Chin. J. For. Eng. 2021, 6, 169–175. [Google Scholar] [CrossRef]
- Sun, J.L.; Zhou, X.; Gu, H.T. State-of-charge estimation method of lithium-ion battery based on FFRLS-EKF joint algorithm. Automot. Eng. 2022, 44, 505–513. [Google Scholar] [CrossRef]


| coefficient | a1 | a2 | a3 | a4 | a5 | a6 | a7 | a8 | a9 |
| value | −293.2 | 1340.9 | −2521.6 | 2519.4 | −1442.7 | 477.5 | −88.3 | 8.6 | 2.9 |
| coefficient | b1 | b2 | b3 | b4 | b5 | b6 | b7 | b8 | b9 |
| value | −245.3 | 1163.1 | −2258.2 | 2321.5 | −1363.3 | 460.4 | −86.1 | 8.3 | 2.9 |
| Charging Process | |||||||
| SOC (k − 1) | [75%, 80%) | [65%, 75%) | [55%, 65%) | [45%, 55%) | [35%, 45%) | [25%, 35%) | [10%, 25%) |
| value of η | 4.6 | 4.8 | 5 | 6 | 6 | 7 | 10 |
| Discharge process | |||||||
| SOC (k − 1) | [10%, 15%) | [15%, 25%) | [25%, 35%) | [35%, 45%) | [45%, 55%) | [55%, 65%) | [60%, 80) |
| value of η | 6 | 8.5 | 10 | 12 | 8.5 | 8 | 7 |
Publisher’s Note: MDPI stays neutral with regard to jurisdictional claims in published maps and institutional affiliations. |
© 2022 by the authors. Licensee MDPI, Basel, Switzerland. This article is an open access article distributed under the terms and conditions of the Creative Commons Attribution (CC BY) license (https://creativecommons.org/licenses/by/4.0/).
Share and Cite
Zhou, W.; Ma, X.; Wang, H.; Zheng, Y. SOC Estimation Based on Hysteresis Characteristics of Lithium Iron Phosphate Battery. Machines 2022, 10, 658. https://doi.org/10.3390/machines10080658
Zhou W, Ma X, Wang H, Zheng Y. SOC Estimation Based on Hysteresis Characteristics of Lithium Iron Phosphate Battery. Machines. 2022; 10(8):658. https://doi.org/10.3390/machines10080658
Chicago/Turabian StyleZhou, Wenlu, Xinyu Ma, Hao Wang, and Yanping Zheng. 2022. "SOC Estimation Based on Hysteresis Characteristics of Lithium Iron Phosphate Battery" Machines 10, no. 8: 658. https://doi.org/10.3390/machines10080658
APA StyleZhou, W., Ma, X., Wang, H., & Zheng, Y. (2022). SOC Estimation Based on Hysteresis Characteristics of Lithium Iron Phosphate Battery. Machines, 10(8), 658. https://doi.org/10.3390/machines10080658