Article

Study on the Electrochemical Deburring for the External Surface of the Microhole Caused by Mechanical Drilling Process

1
Anhui Key Laboratory of Mine Intelligent Equipment and Technology, Anhui University of Science and Technology, Huainan 232001, China
2
School of Mechanical Engineering, Anhui University of Science and Technology, Huainan 232001, China
*
Authors to whom correspondence should be addressed.
Machines 2022, 10(9), 726; https://doi.org/10.3390/machines10090726
Submission received: 27 July 2022 / Revised: 19 August 2022 / Accepted: 22 August 2022 / Published: 25 August 2022
(This article belongs to the Section Material Processing Technology)

Abstract

:
To improve the performance of electrochemical deburring for microhole drilling (MD-ECD), the distribution and dynamic change of the current density in the machining area during the electrolysis process were analyzed, and the synchronous change relationship between the current density and the burr profile was studied. The effects of process parameters, such as machining voltage U, initial machining gap d, electrolyte concentration C, and electrode radius r1 on the deburring process, were studied. The results show that the magnitude of the current density value in the burr area reflects the MD-ECD’s deburring performance. The current density near the burr tip is high, and the material is preferentially removed. The non-processed area has a low current density and slow material removal. As the machining progresses, the burr tip becomes blunt and the current in the burr area gradually transfers to the non-machining area, resulting in the transfer of the material removal area from the burr area to the adjacent non-machining area. Then, a chamfer is formed at the orifice; the chamfer width is larger than the chamfer height. When U = 4 V, d = 0.35 mm, C = 12%, and r1 = 0.4 mm, the burr removal efficiency and accuracy can be guaranteed. The chamfer width and chamfer height obtained from the test are 29 μm and 17 μm, and the burr removal effect is good.

1. Introduction

With the development of non-traditional machining technology, microholes have been widely used in aero-engine turbine blades [1,2], fuel nozzles [3], medical equipment [4], micro-electromechanical systems [5], and other devices. At present, microholes are typically created using non-traditional machining methods, such as micro drilling [6], electric discharge [7], electrochemistry [8], and laser beam [9] methods. Among them, micro drilling has a long history. It has the advantages of high single-hole processing efficiency, large depth-to-diameter ratio, good cylindricity, low machining cost, and other advantages, so it is widely used. However, the microholes produced by micro drilling contain micro burrs, which can greatly impact the performance of the parts, and in some medical fields will endanger patients. Thus, the burrs must be removed.
Common deburring methods include the abrasive jet method [10,11], magnetic abrasive machining [12,13], electron beam irradiation [14], micro electrical discharge deburring [15], and electrochemical deburring (ECD) [16,17]. The abrasive jet method and magnetic abrasive machining are suitable for deburring inside a channel and surface finishing [18], but they are not suitable for deburring workpieces with complex shapes. Electron beam irradiation and electric spark technology both use thermal energy to remove burrs. These methods are suitable for deburring any part of a workpiece [19], but because the heat release effect is difficult to control, it is easy to burn the surface of the workpiece and cause secondary damage. ECD is a non-contact machining method with minor electrode loss, no requirement for material hardness, and no recast layer or microcracks [20], and it is capable of machining brittle and complex workpieces. Bin et al. [21] studied the electrochemical removal of cross-hole burrs with gel electrolytes. In their experiment, 10% sodium nitrate gel and 30 V voltage were used for deburring, which effectively controlled the stray corrosion of the orifice and improved the machining accuracy and surface quality of the workpiece. Zheng [22] used the electrochemical method to remove burrs in a hard-to-reach area where microholes drilled in a 304 stainless steel tube wall intersected with the inner wall of the stainless steel tube, and explored the effects of electrolyte composition, electrolyte concentration, machining time, and other parameters on the deburring effect. The results showed that the electrolyte NaCl has high activity, which leads to serious stray corrosion on the surface of the workpiece during deburring. The optimal concentration of the electrolyte NaNO3 is 15–20%. A too-low concentration will reduce the machining efficiency and increase the heat loss between electrodes. A too-high concentration will blacken the edges of the tiny holes. Jian et al. [23] used simulation and experimental methods to analyze the current change of the fixed cathode electrolysis to remove the burr of the intersecting line of the internal cross hole. They determined the influence of the machining voltage, machining gap, and the number of machining holes on the deburring time and, based on the current the detection control method, realized precise control of the deburring process. Prabhu et al. [24] took advantage of the high electrical conductivity and heat dissipation of copper, used copper electrodes to deburr cross holes, and evaluated the effect of ECD by changing the processing parameters. The results showed that the heat, bubbles, and impurity products generated by the machining had a great influence on the current density. Yingjie et al. [25] simulated and analyzed the influence of electrode shape, processing voltage, and insulating layer position on the current density distribution and, based on the flow field simulation results, selected the chamfered electrode as the cathode tool for the ECD test. 304 stainless steel has good corrosion resistance, heat resistance, low temperature strength, and mechanical characteristics. It is widely used in aerospace, nuclear power and marine engineering [26]. However, due to its large hardness, it is difficult to process deep holes on it [27]. From the statistics data in the literature [28], it can also be seen that most electrochemical researchers have carried out deep holes machining research on 304 stainless steels.
Owing to the small diameter of microholes, accurate deburring is difficult, and it is easy to produce stray corrosion and hole expansion. At present, electrochemical microhole deburring technology is not mature, and the related studies have mainly conducted confirmatory experiments. Regarding the dynamic analysis of the deburring process, existing studies have also failed to conduct in-depth theoretical and experimental research on the correlation between the burr profile reduction and the current density change. To this end, the ECD for microhole drilling (MD-ECD) simulation model was established in this study, the distribution and change of the current density in the machining area during the electrolysis process were analyzed, the corresponding relationship between the current density and the material removal rate was studied, and the interaction law between the change of burr profile and current density distribution was obtained. On this basis, the effects of process parameters, such as machining voltage, initial machining gap, electrolyte concentration, and electrode radius on the deburring process, were analyzed, and a better combination of process parameters was obtained.

2. Principle and Simulation Model of Deburring

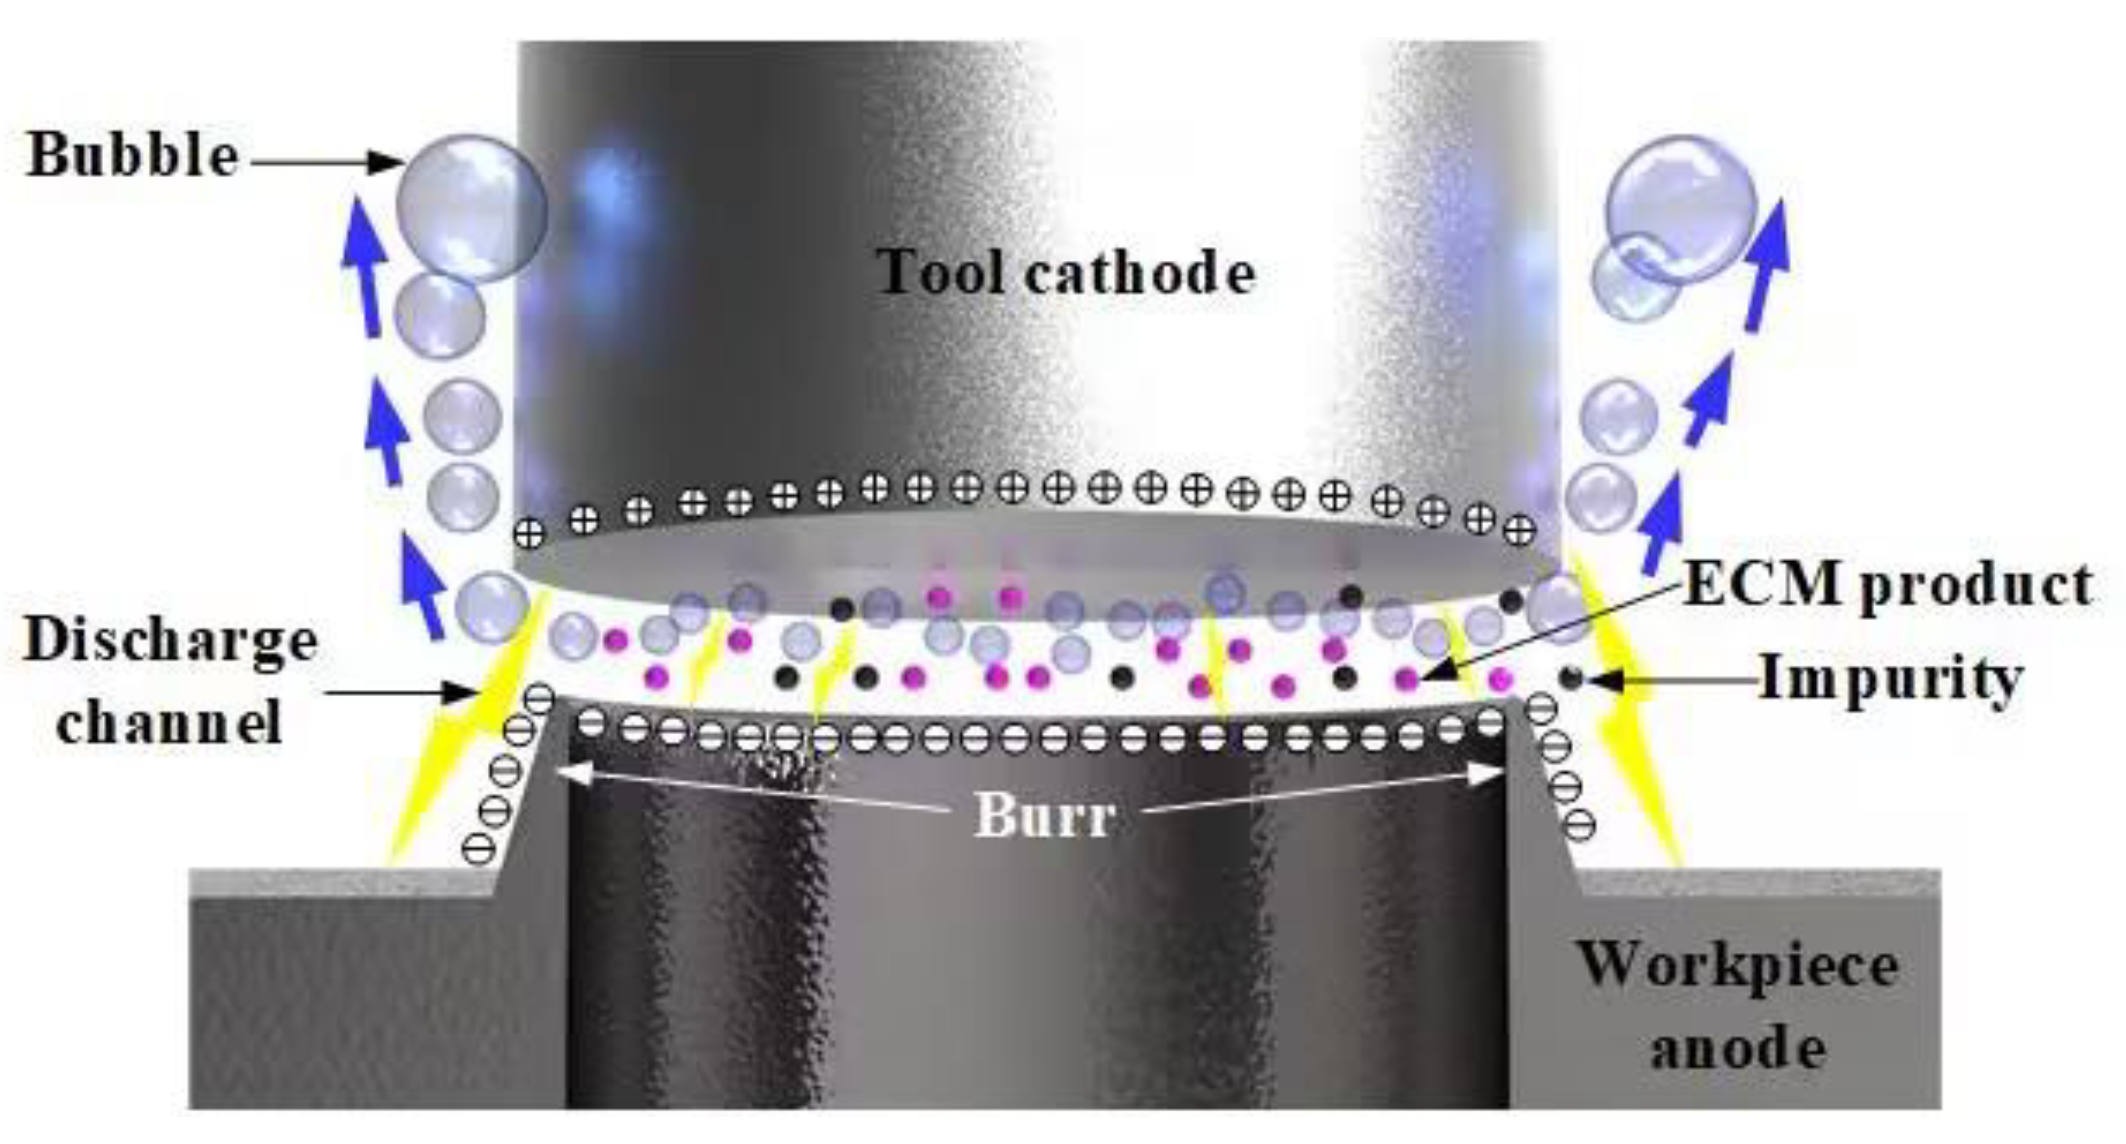
2.1. MD-ECD Machining Principle

As shown in Figure 1, MD-ECD uses electrical energy and chemical energy to perform local anode dissolution to achieve deburring. The workpiece is connected to the positive pole of the power supply, the tool electrode is connected to the negative pole of the power supply, and a machining gap is maintained between the electrode and the burr so that the electrolyte can completely cover the machined area.
During machining, under the action of the external electric field, the anions in the electrolyte move to the workpiece anode and the cations move to the tool cathode, forming a forward current from the workpiece anode to the tool cathode. After the conductive loop is formed, the anode metal material in the area to be processed is dissolved in the form of “ions”, the cathode material is basically unchanged, and bubbles are generated on the surface of the tool cathode. Bubbles enter the electrolyte and form a three-phase flow of gas, liquid, and solid, with ECM products in the machining gap. The bubble layer has an insulating effect, which helps to reduce the hole expansion rate.

2.2. Theoretical Model

As shown in Figure 2, to analyze the current distribution among the workpiece anode, tool cathode, and electrolyte during the deburring process, a two-dimensional theoretical model with the axis of the microhole as the symmetry axis was established. In the figure, the dark gray area is the tool cathode, the light gray area is the workpiece anode, and the blue area is the electrolyte; r1 and r2 are the tool cathode radius and microhole radius, respectively; d is initial machining gap; Г1, Г2, and Г3, are the cathode surface boundaries in contact with the electrolyte; Г4, Г5, Г6, Г7, and Г8, are the anode surface boundaries in contact with the electrolyte; and Г9, Г10, and Г11, are the electrolyte boundaries.
When drilling microholes, the formation of burrs is mainly caused by the plastic deformation of the metal material during the cutting process. If the plastic deformation zone is greater than the thickness of the cutting layer, when the machined surface is subjected to the cutting force, the material is deformed by extrusion and then torn, which produces burrs. In order to obtain the actual burr morphology size, micro-drills with a diameter of 0.8 mm were used to make microholes on 304 stainless steel sheets. The drill speed was 6000 r/min and the feed speed was 10 μm/s. Then, the height and thickness of the microhole orifice burr were measured by a PS50 topography instrument, as shown in Figure 3. The final measured burr height is h = 150 µm and the burr thickness is l = 20 µm.
According to the constant electric field theory, the potential distribution in the machining gap during ECD satisfies the Laplace equation:
2 ϕ = 0
To solve the Laplace equation, it is necessary to define an electric potential boundary. The first type of boundary condition is the given electric potential value at the boundary of the calculation, and the second type of boundary condition is the normal derivative of the given electric potential function on the boundary of the calculation domain. Since both the tool cathode and the workpiece anode are metal conductors, the first type of boundary condition is selected to describe the electric potential distribution as follows:
ϕ | Γ 1 , 2 , 3 = 0
ϕ | Γ 4 , 5 , 6 , 7 , 8 = Φ
Other boundaries in the model are considered closed, and the second type of boundary is selected to describe as follows:
ϕ n | Γ 9 , 10 , 11 = 0
By combining Equations (1)–(4), the electric field distribution model in the machining gap can be obtained:
2 ϕ = 0 ϕ | Γ 1 , 2 , 3 = 0 ϕ | Γ 4 , 5 , 6 , 7 , 8 = U ϕ n | Γ 9 , 10 , 11 = 0
In the equation, the electric potential of the tool cathode is 0 V, and the electric potential of the workpiece anode is U. The other free boundaries are the insulation or perpendicularity to the z-axis or r-axis, so the partial derivatives of these boundaries are equal to zero.
According to Faraday’s first law,
M = K Q = K I t
where M is the removal quality of the anode material, Q is the total charge passing through the two-phase interface, K is the electrochemical equivalent proportionality constant, I is the current intensity, and t is the machining time.
According to Faraday’s second law, the amount of electricity required to dissolve or precipitate 1 g of equivalent substance on the electrode is the same, so
K = A N F
where A is the molar mass, N is the number of electrons participating in the reaction, and F is the Faraday constant. The equation for calculating the volumetric electrochemical equivalent of the substance is as follows:
ω = A N F ρ
where ω is the volume electrochemical equivalent of the substance, and ρ is the material density of the workpiece.
ρ = M V
where V is the erosion volume of the workpiece surface. Combining Equations (6)–(9), the equation for V can be obtained as follows:
V = ω I t
The electric field in the machining gap is the main factor affecting the forming of the workpiece. Assuming that the machined area is S, the erosion rate of the workpiece surface in the direction perpendicular to the machining plane can be expressed as
v = V S t
where v is the erosion rate of the workpiece surface. Then, the equation for calculating the current density is obtained:
i = σ Φ 0 Δ = σ U Δ
where i is the current density, σ is the electrical conductivity, Δ is the machining gap, and U is the machining voltage. Considering the current efficiency η, combining Equations (10)–(12), the calculation equation of the material erosion rate on the workpiece surface can be obtained as follows:
v = ω σ U Δ η = ω i η

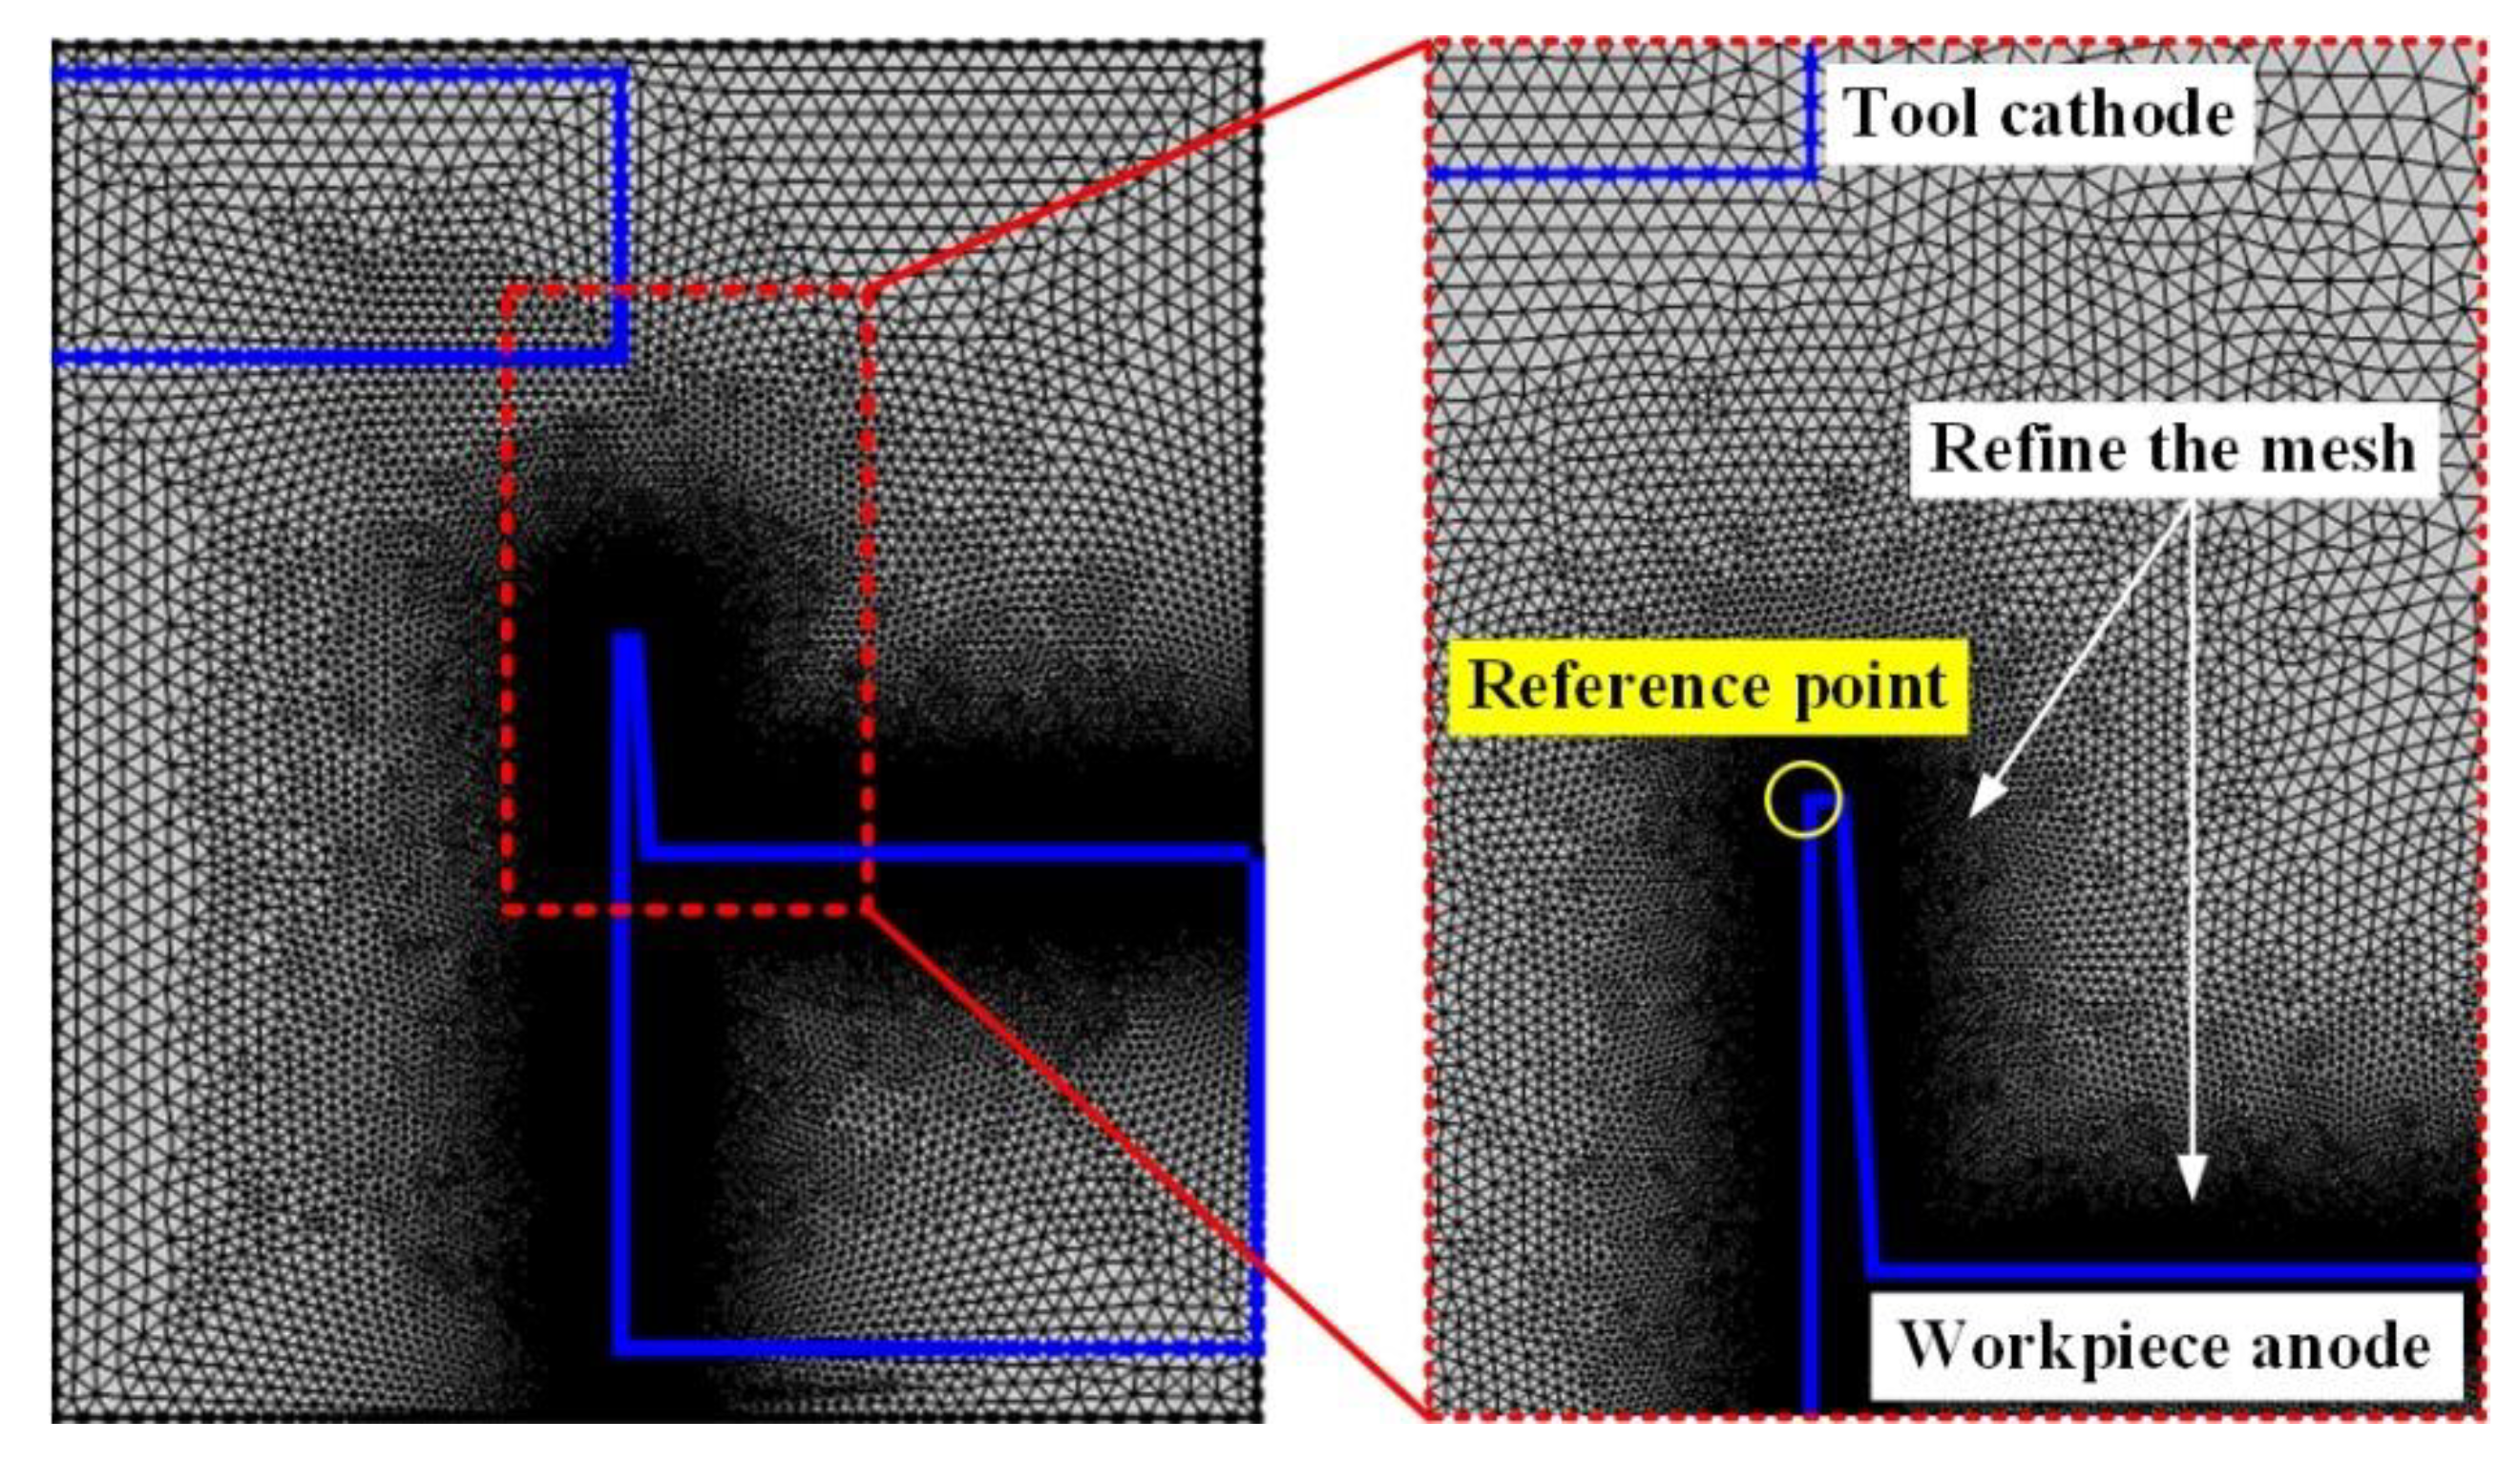
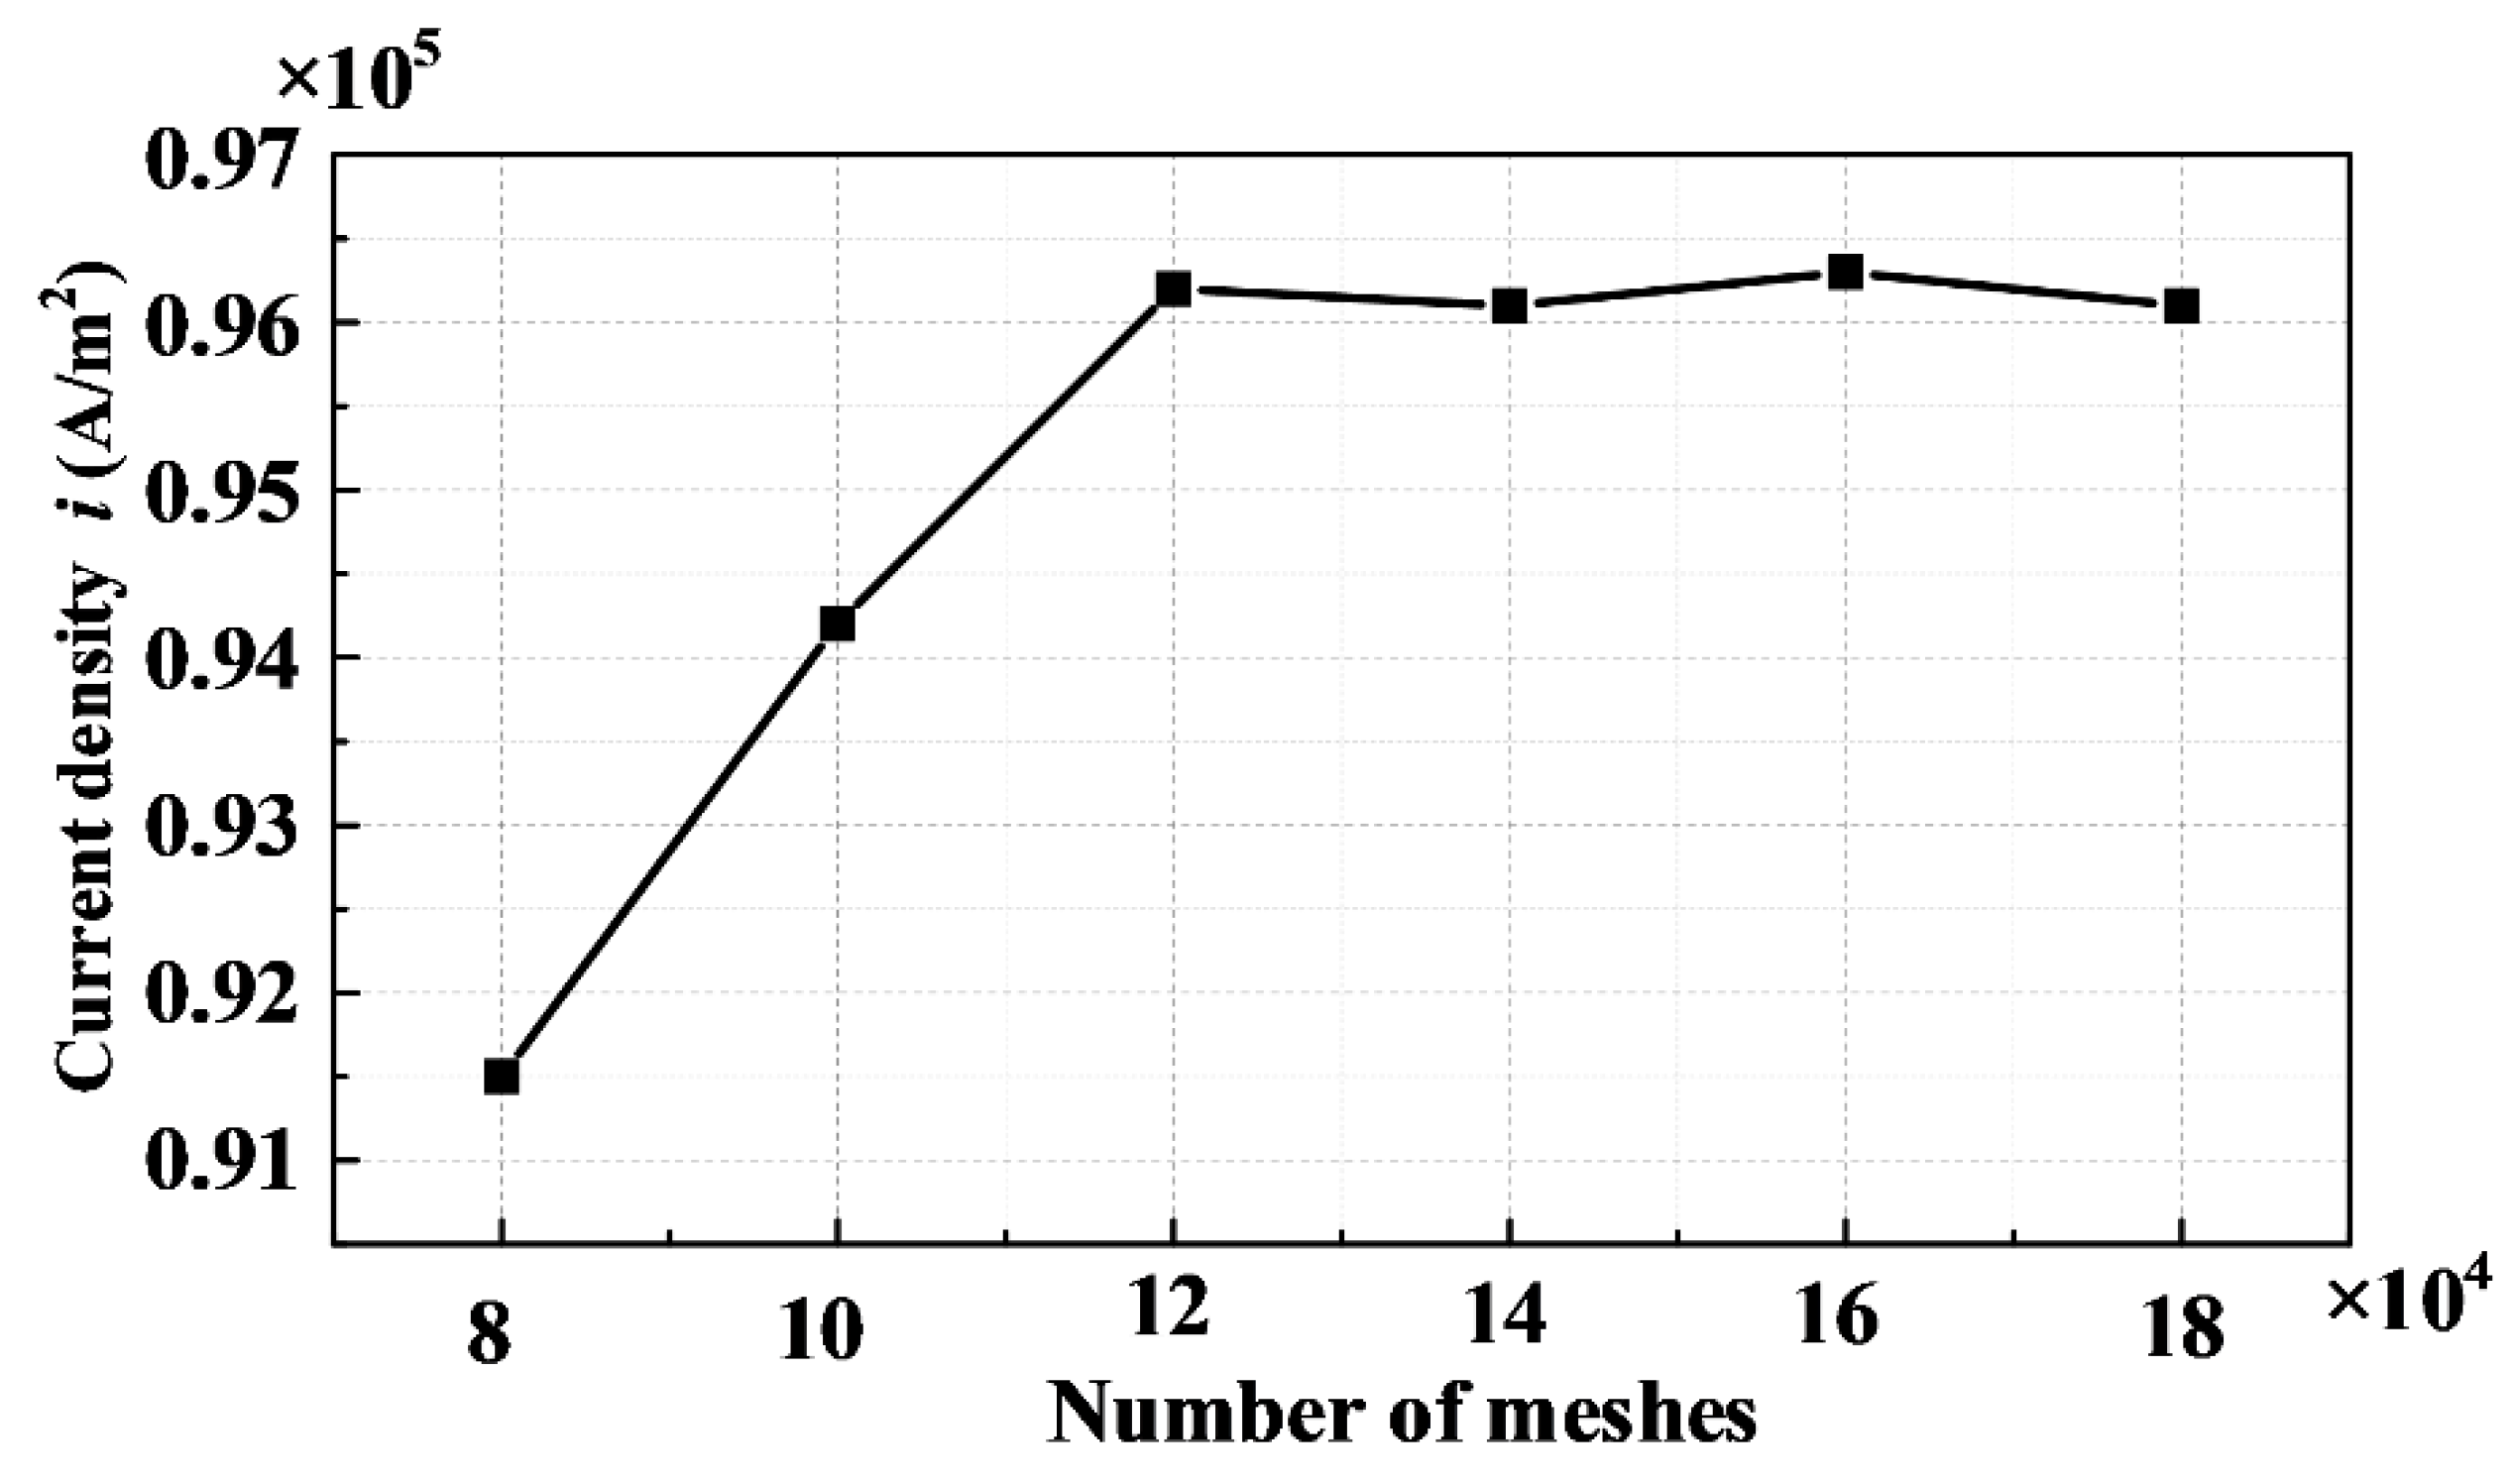
2.3. Model Parameters and Settings

A simulation model was established in COMSOL Multiphysics to simulate the process of ECD. Based on the study of references [29,30], the main parameters of the simulation model are shown in Table 1. In order to improve the calculation accuracy, high-resolution meshes were used at the tip of the model and in narrow places to reduce the discretization error. The current density of the electrolyte at the tip of the burr in the circle in Figure 4 was used as the evaluation index, and mesh independence verification was carried out. The results are shown in Figure 5. Once the number of mesh nodes exceeded 120,000, the current density value of the burr tip became fairly stable, so a mesh number of 120,000 was selected for follow-up research.

3. Simulation Results

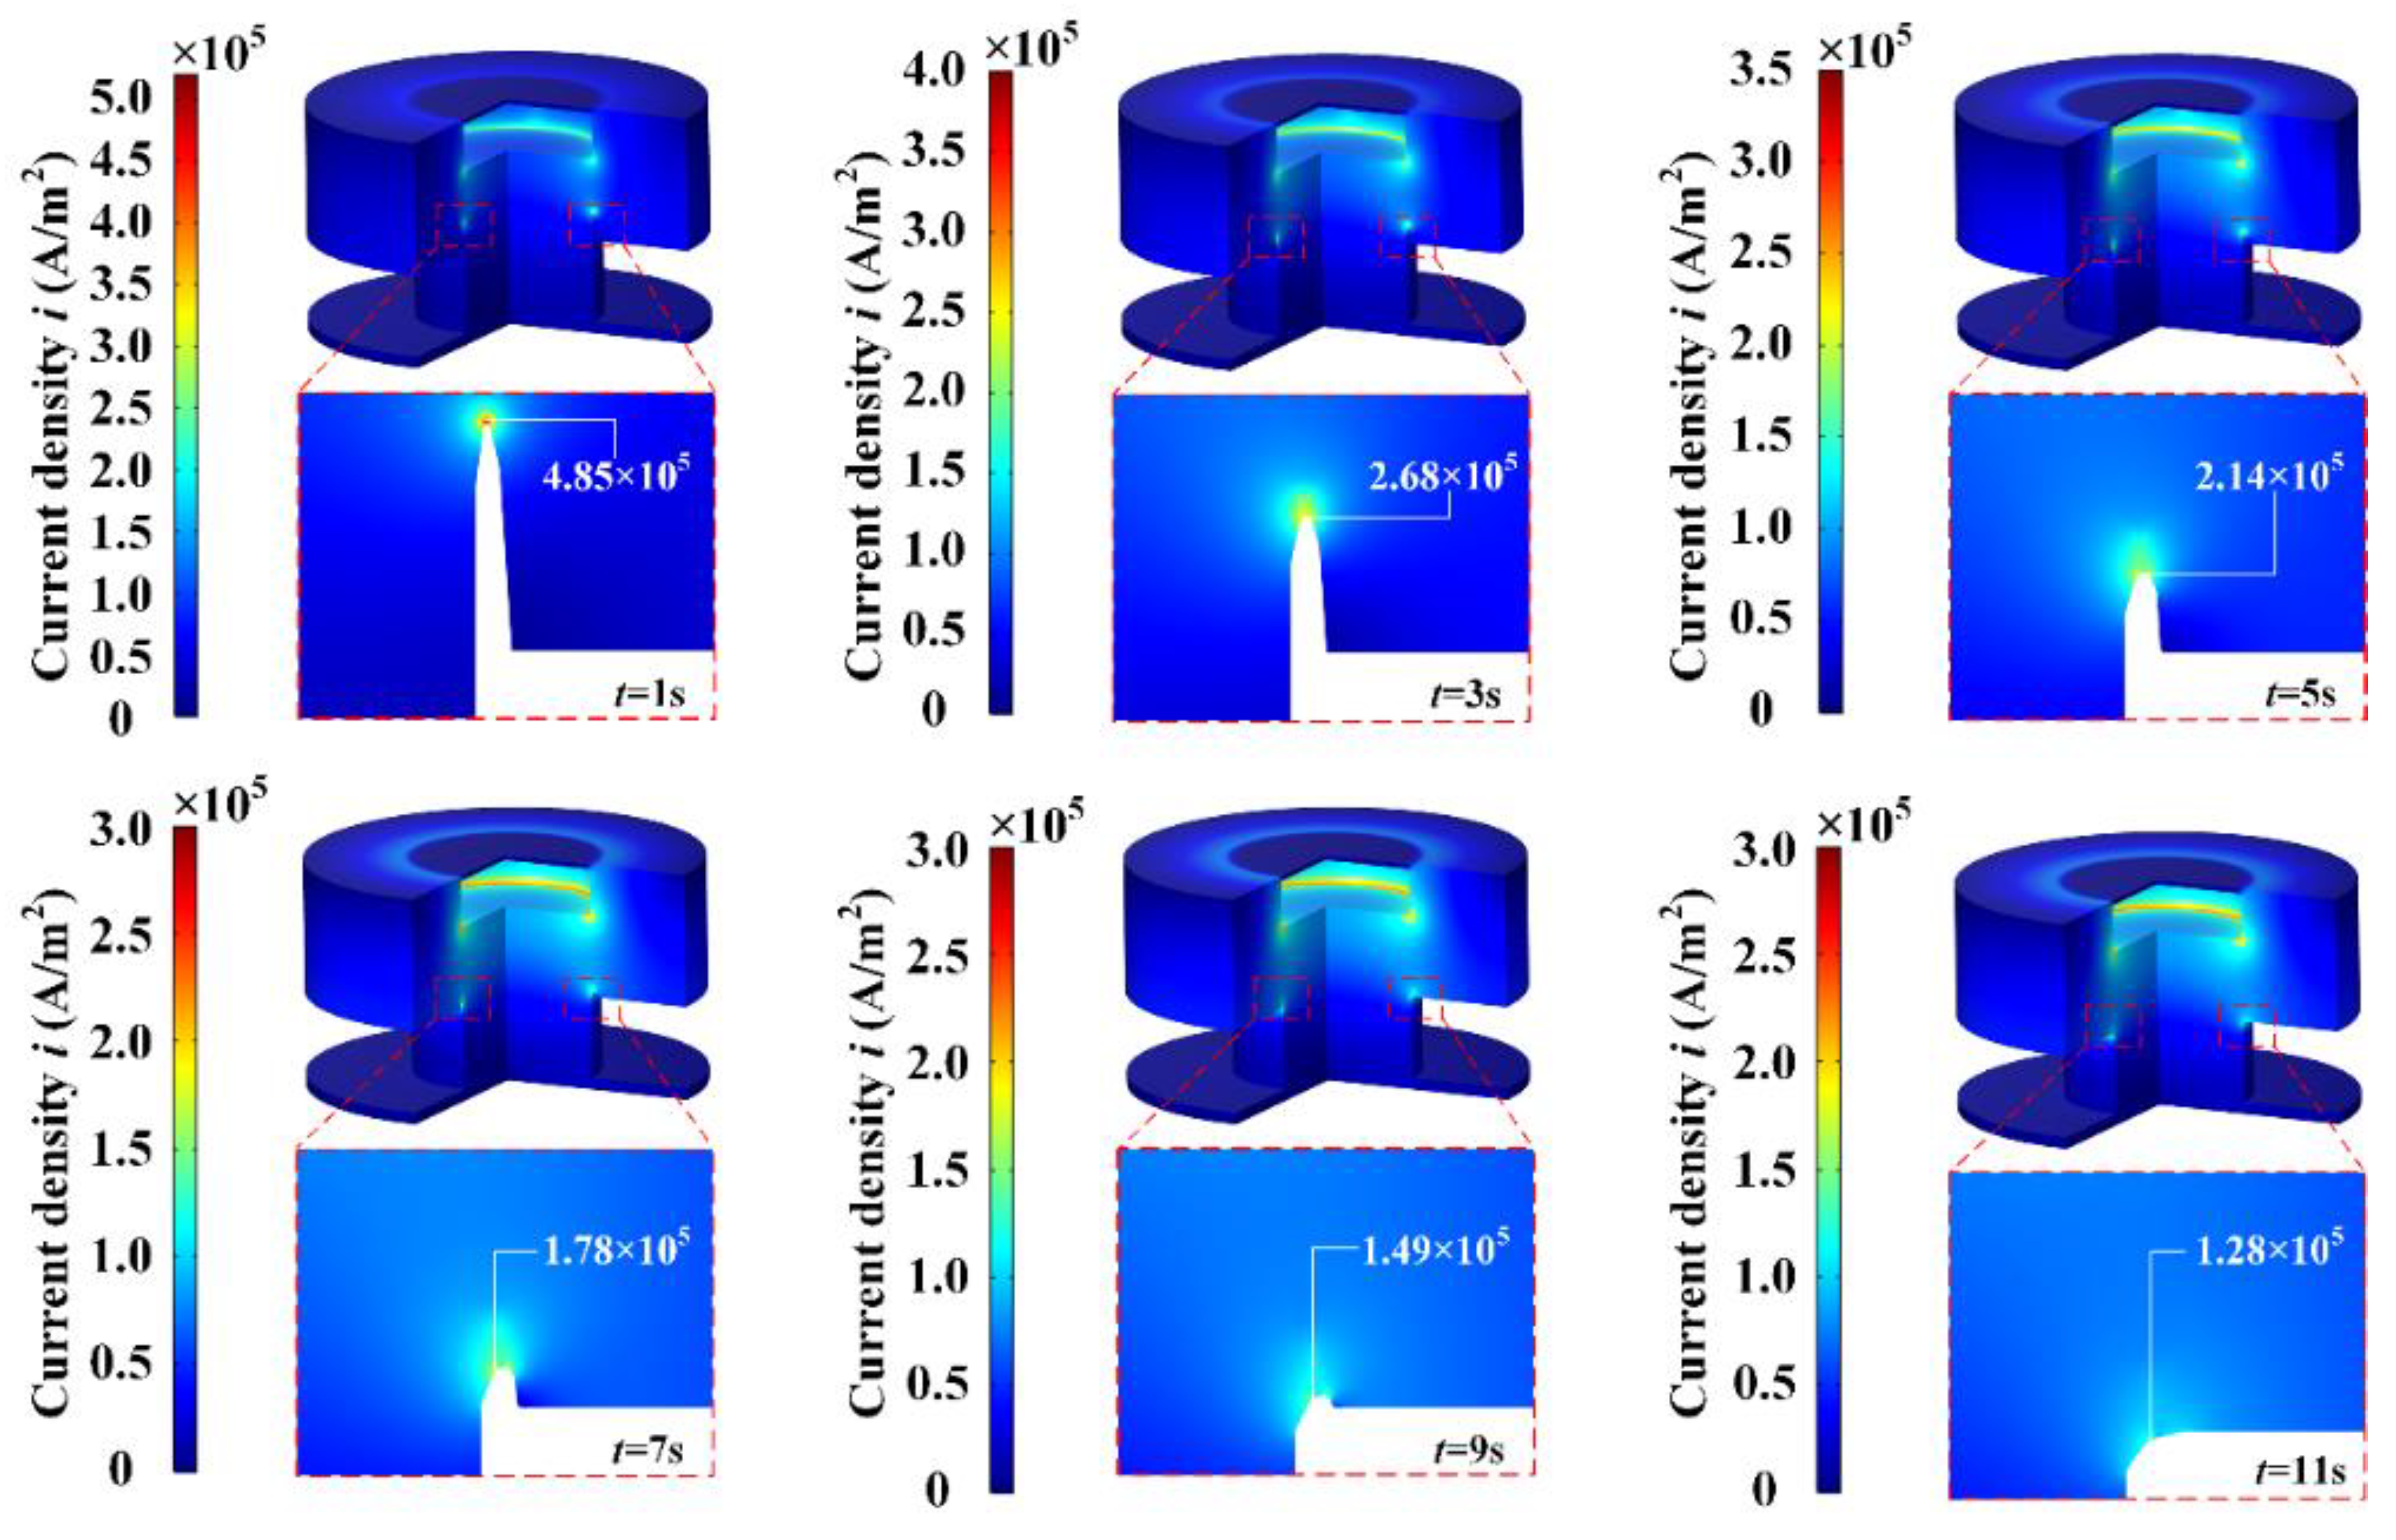
3.1. Analysis of Deburring Process

Taking U = 4 V, C = 12%, r1 = 0.4 mm, and d = 0.35 mm, the electrolyte current density distribution was calculated at different times, and the results are presented in Figure 6. It can be seen from the figure that the magnitude of the current density value in the burr region reflects the strength of the deburring ability, which is consistent with the result of Equation (13). The area with high electrolyte current density is mainly distributed in the tip of the burr and the corner area of the tool cathode end, so the burr material is preferentially etched there. The rest of the workpiece surface has low electrolyte current density, so the material in these places is removed extremely slowly. The current density distribution is helpful for improving the targeting of MD-ECD machining.
As the machining progresses, the burr tip gradually becomes blunt and the current density gradually decreases. In the initial machining stage from 1 s to 3 s, the current density is high, the burr material is removed quickly, and the current density at the burr tip decreases quickly; in the final machining stage from 9 s to 11 s, the current density is low, the burr material is removed slowly, and the current density at the burr tip decreases slowly.
As shown in Figure 7, five monitoring points, A, B, C, D, and E, were selected on the anode surface of the workpiece to study the current density distribution on the lAB and lAD segments. It can be seen from the figure that there are two peaks of current density on the surface of the burr, and the peaks are located in the adjacent areas on both sides of the top of the burr at the same time, which causes the material near the two points A and E at the top of the burr to be preferentially removed, forming a burr spike. As the machining progresses, the sharp angle at the top of the burr gradually becomes blunt, and the peak current density gradually decreases with the decrease of the burr height. As can be seen from Figure 7b, as the height of the burr decreases, the current density in the burr area decreases, the current density in the non-burr area increases, and the current originally concentrated near the burr is gradually transferred to the non-processed area, resulting in the transfer of the material removal area from the burr surface to the adjacent non-processed area. In addition, during the processing from 1 s to 9 s, the burr is not completely removed, the current density valley is located near point C, and the material at the root of the burr is hardly eroded; when t = 11 s, the burr has been completely removed, the current density at the root of the original burr increases, the surface of the workpiece at point C and its vicinity loses the “protection” of the burr, the material is eroded, and a chamfer is formed at the orifice.

3.2. Influence of Processing Parameters on Deburring

As shown in Figure 8, the contour formed after MD-ECD processing is a non-round chamfer, and the chamfer directly affects the surface quality of the microhole. Therefore, three variables—chamfer width LCW, chamfer height LCH, and deburring time te—are proposed to characterize the final machining effect of MD-ECD. By changing one parameter at a time during simulation, the effects of different machining voltages U, initial machining gaps d, electrolyte concentrations C, and electrode radii r1 on the deburring effect, are obtained.

3.2.1. Effect of Machining Voltage

As shown in Figure 9, when U = 3 V, the current density on the lAB segment and the lAD segment is too small, and deburring is very slow, so burrs are still not completely removed at t = 35 s. As the voltage increases, te decreases continuously, and the range of LCH and LCW continues to expand, but a too-low or too-high voltage is not conducive to MD-ECD machining. If the voltage is too low, the machining efficiency will be affected. If the voltage is too high, the deburring efficiency will increase, but the current density in the non-target machining area will also increase, which will increase the material removal amount in the non-machining area, causing the chamfer to become too large and seriously reducing the orifice accuracy. Considering the efficiency and the size of the chamfer, the machining voltage of 4 V is most suitable.

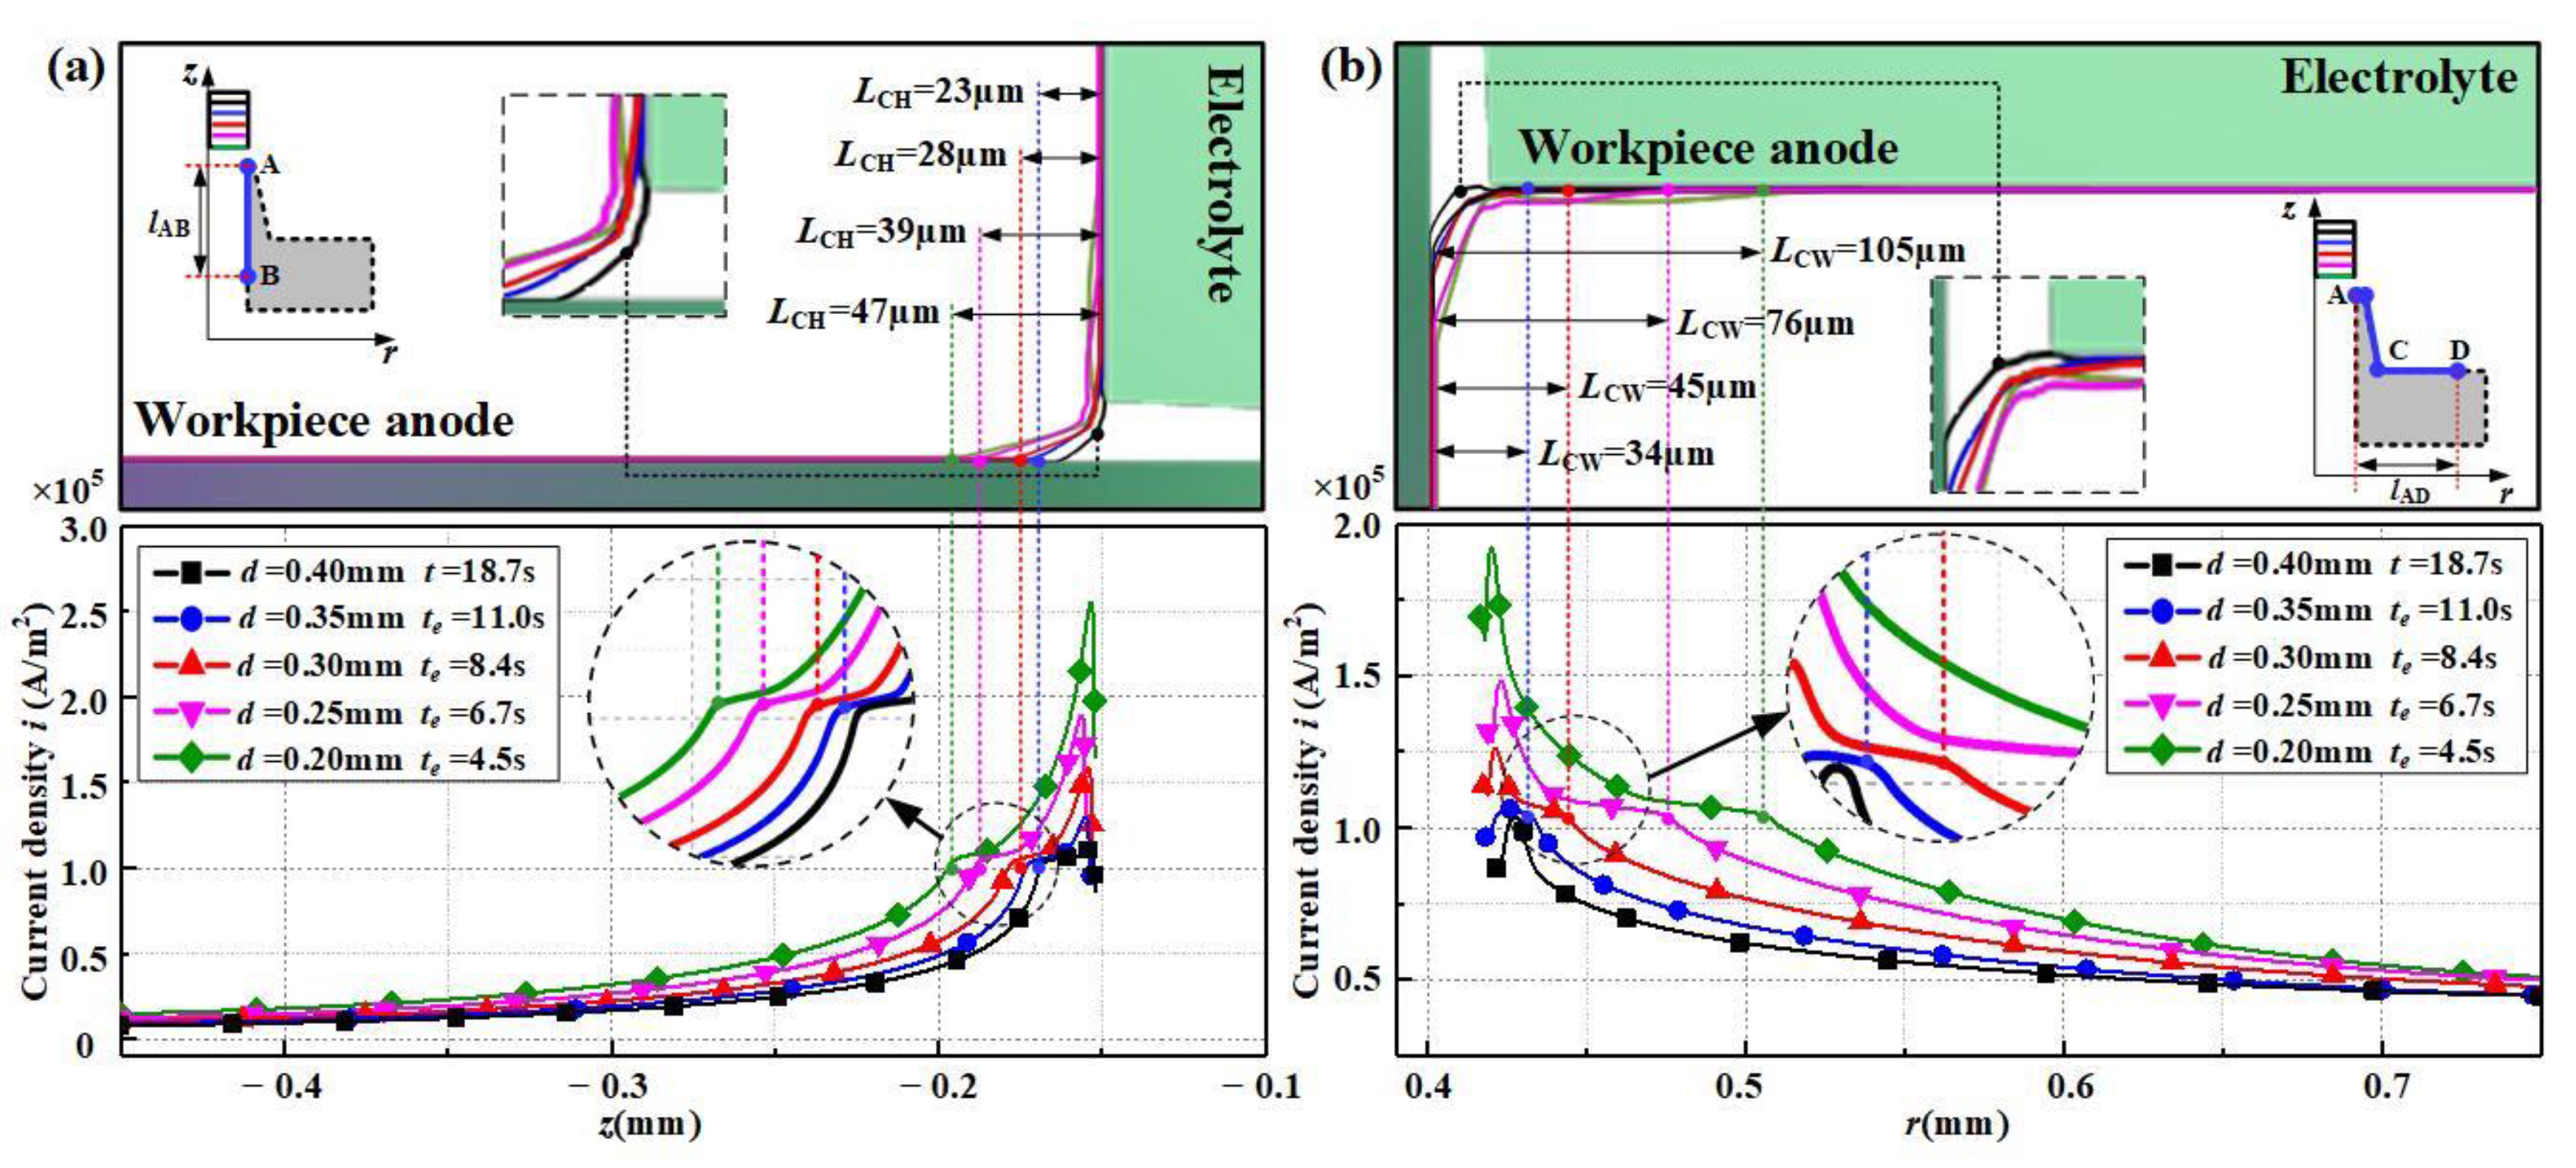
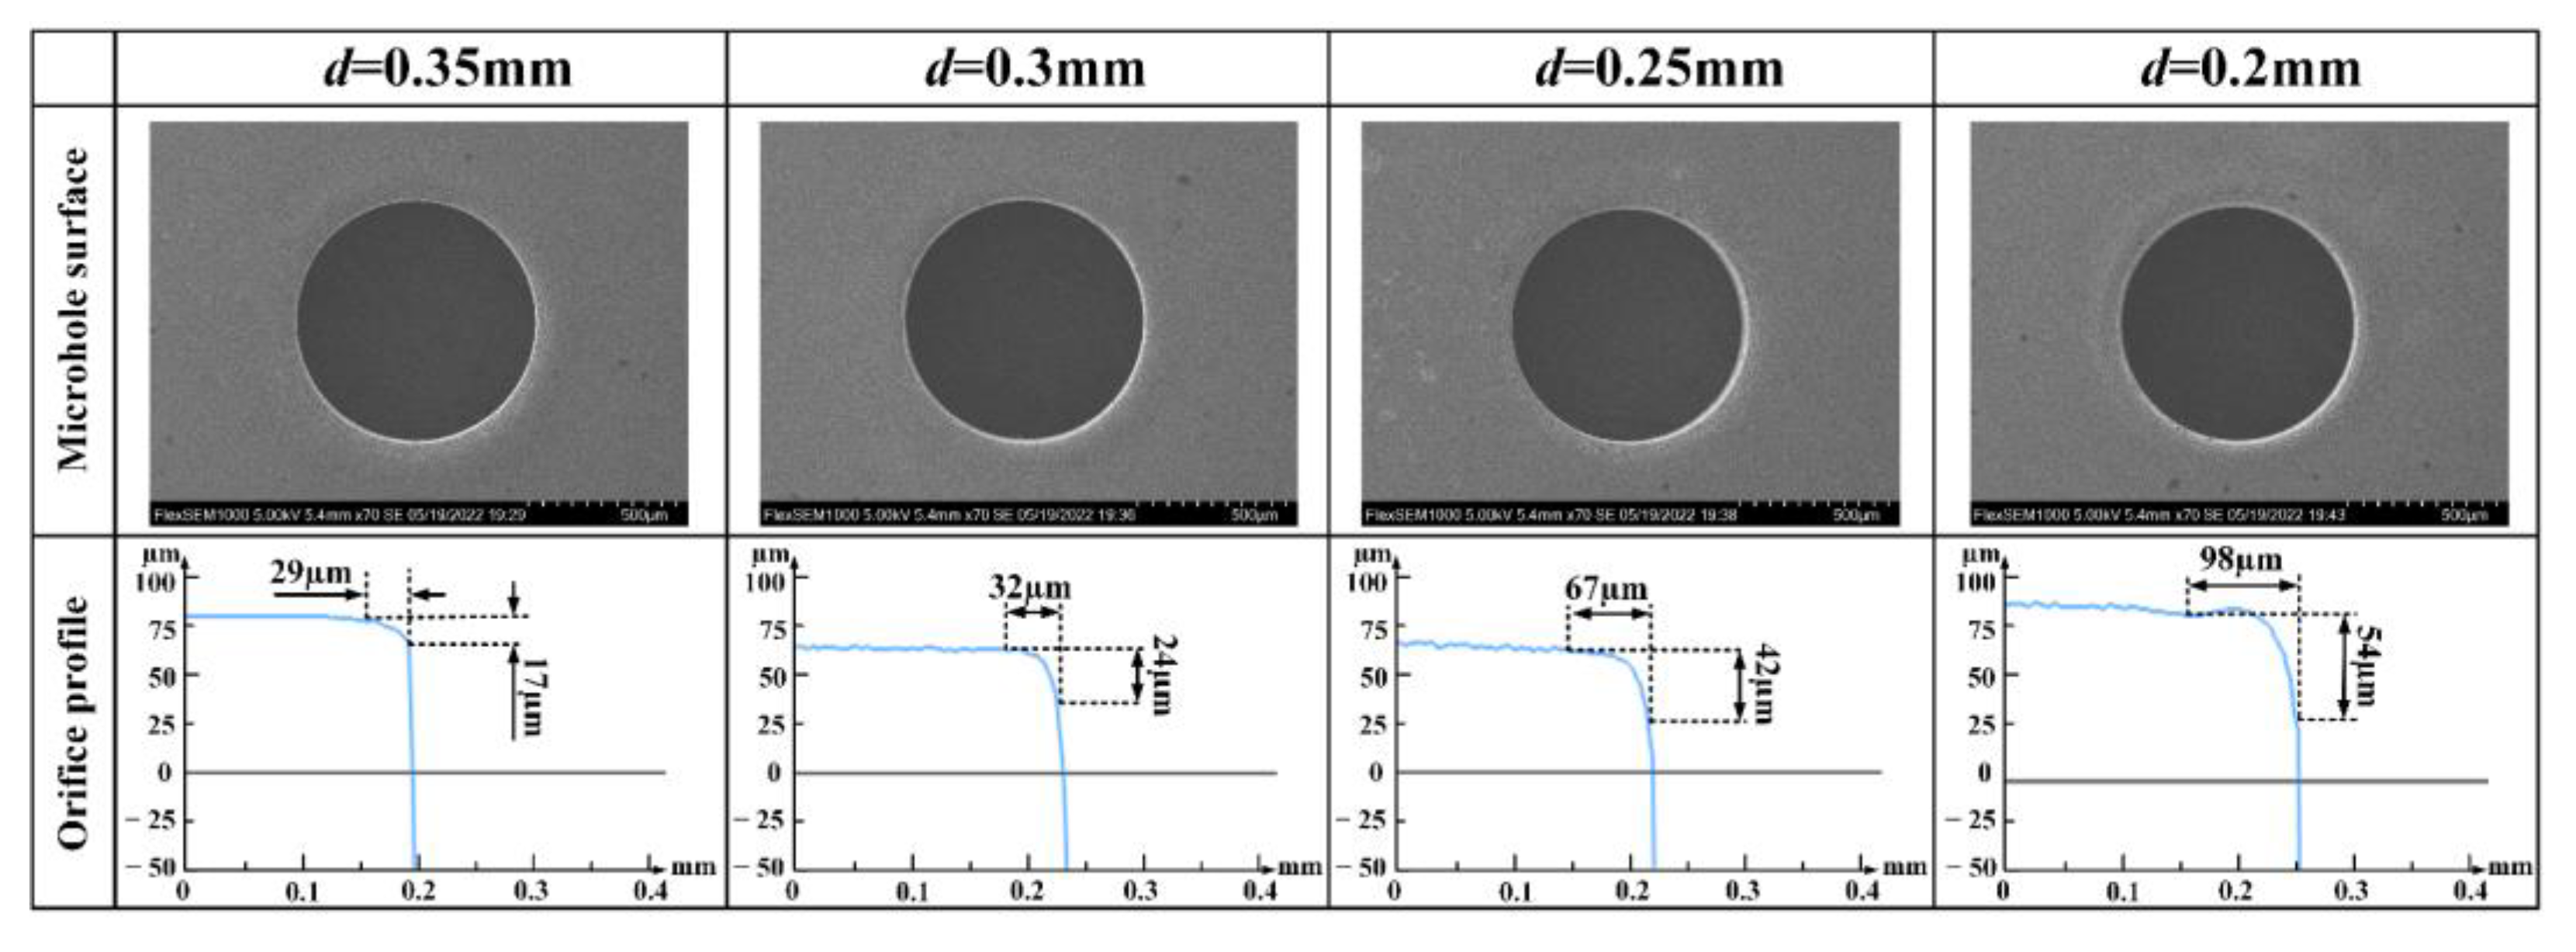
3.2.2. Effect of Initial Machining Gap

The effect of the initial machining gap is shown in Figure 10. It can be seen from the figure that when other machining parameters remain unchanged, the current density value distributed on the lAB segment and the lAD segment is inversely proportional to the initial machining gap, which is consistent with the result of Equation (12). As the machining gap d decreases, the deburring efficiency increases, but the values of LCH and LCW increase due to the increase of the current density, which affects the machining accuracy and quality. When d exceeds 0.35 mm, the electrolytic removal time increases sharply. In the actual MD-ECD machining process, a too small machining gap will make it difficult to remove the electrochemical products from the workpiece anode and the tool cathode before the anode and cathode come into contact, which will result in sparks and short circuits. In addition, since the removal of burr material is a dynamic process, the reduction of the burr height leads to the continuous increase of the machining gap. In the initial machining stage, the machining gap is small and the machining speed is fast. When the burr is nearly completely removed, the machining gap is large and the machining speed is reduced, which helps to improve the machining quality. Therefore, the initial machining gap cannot be too large or too small. An initial machining gap of 0.35 mm provides the best trade-off between efficiency and quality.

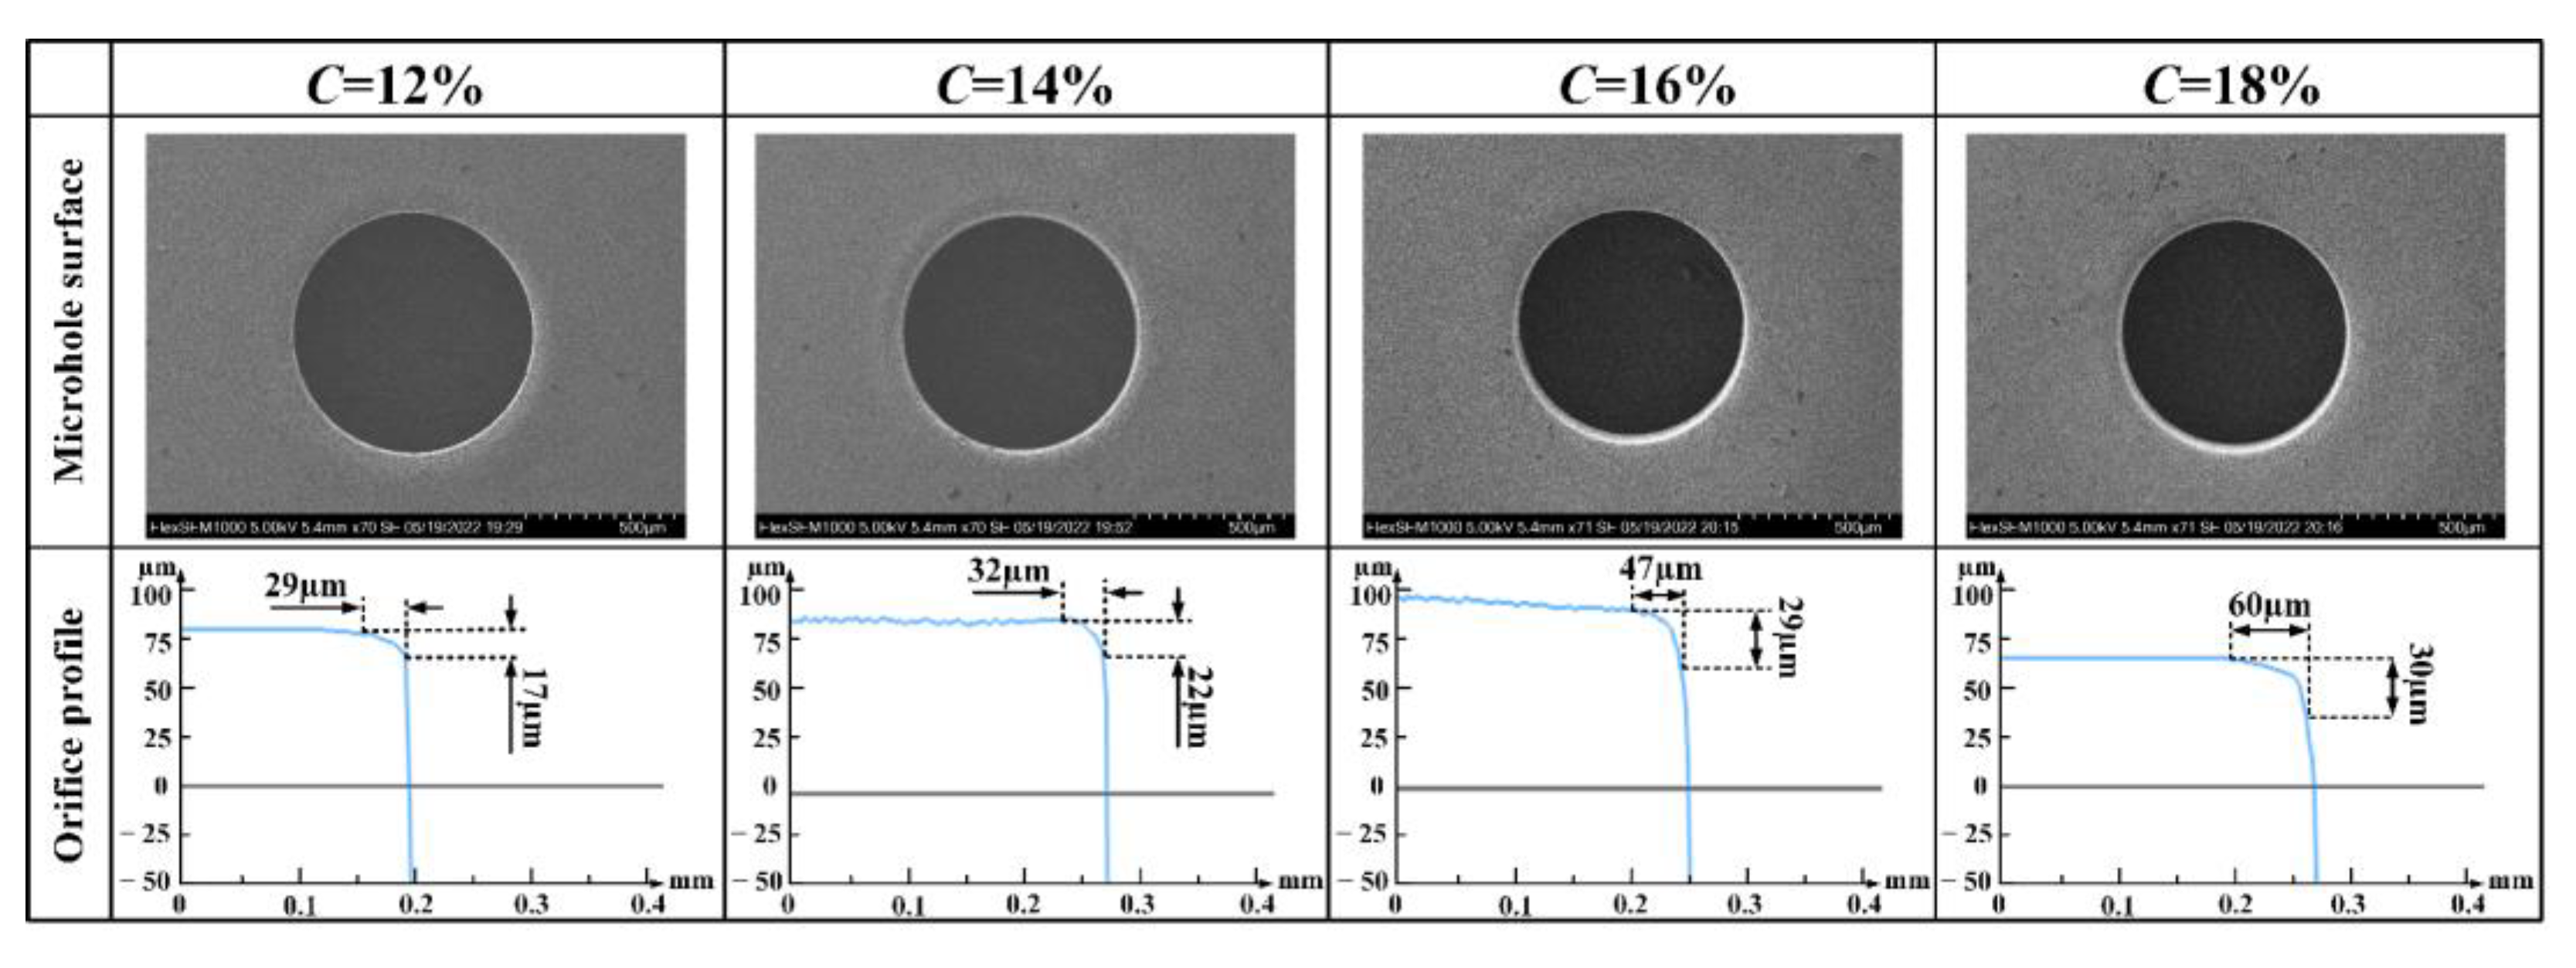
3.2.3. Effect of Electrolyte Concentration

The effect of electrolyte concentration is shown in Figure 11. The main function of the electrolyte is to transmit current as a conductive medium, and under the influence of the electric field, a chemical reaction occurs with the surface of the anode of the workpiece. This reaction causes the anode material to be dissolved smoothly and the electrochemical products to be discharged in time, which plays a role of renewal and cooling. It can be seen from the figure that when C = 10%, the processing efficiency is too low, and the burr is still not completely removed at t = 18.7 s. According to Equation (12), increasing the electrolyte concentration can increase the conductivity of the electrolyte, thereby increasing the current density and shortening the machining time, but the size of the orifice chamfer will also increase. Also, with the increase of electrolyte concentration, the increase range of orifice chamfer size (LCH and LCW) tends to increase, while the increase range of machining efficiency tends to decrease. An electrolyte concentration of 12% or 14% provides the best trade-off between efficiency and quality.

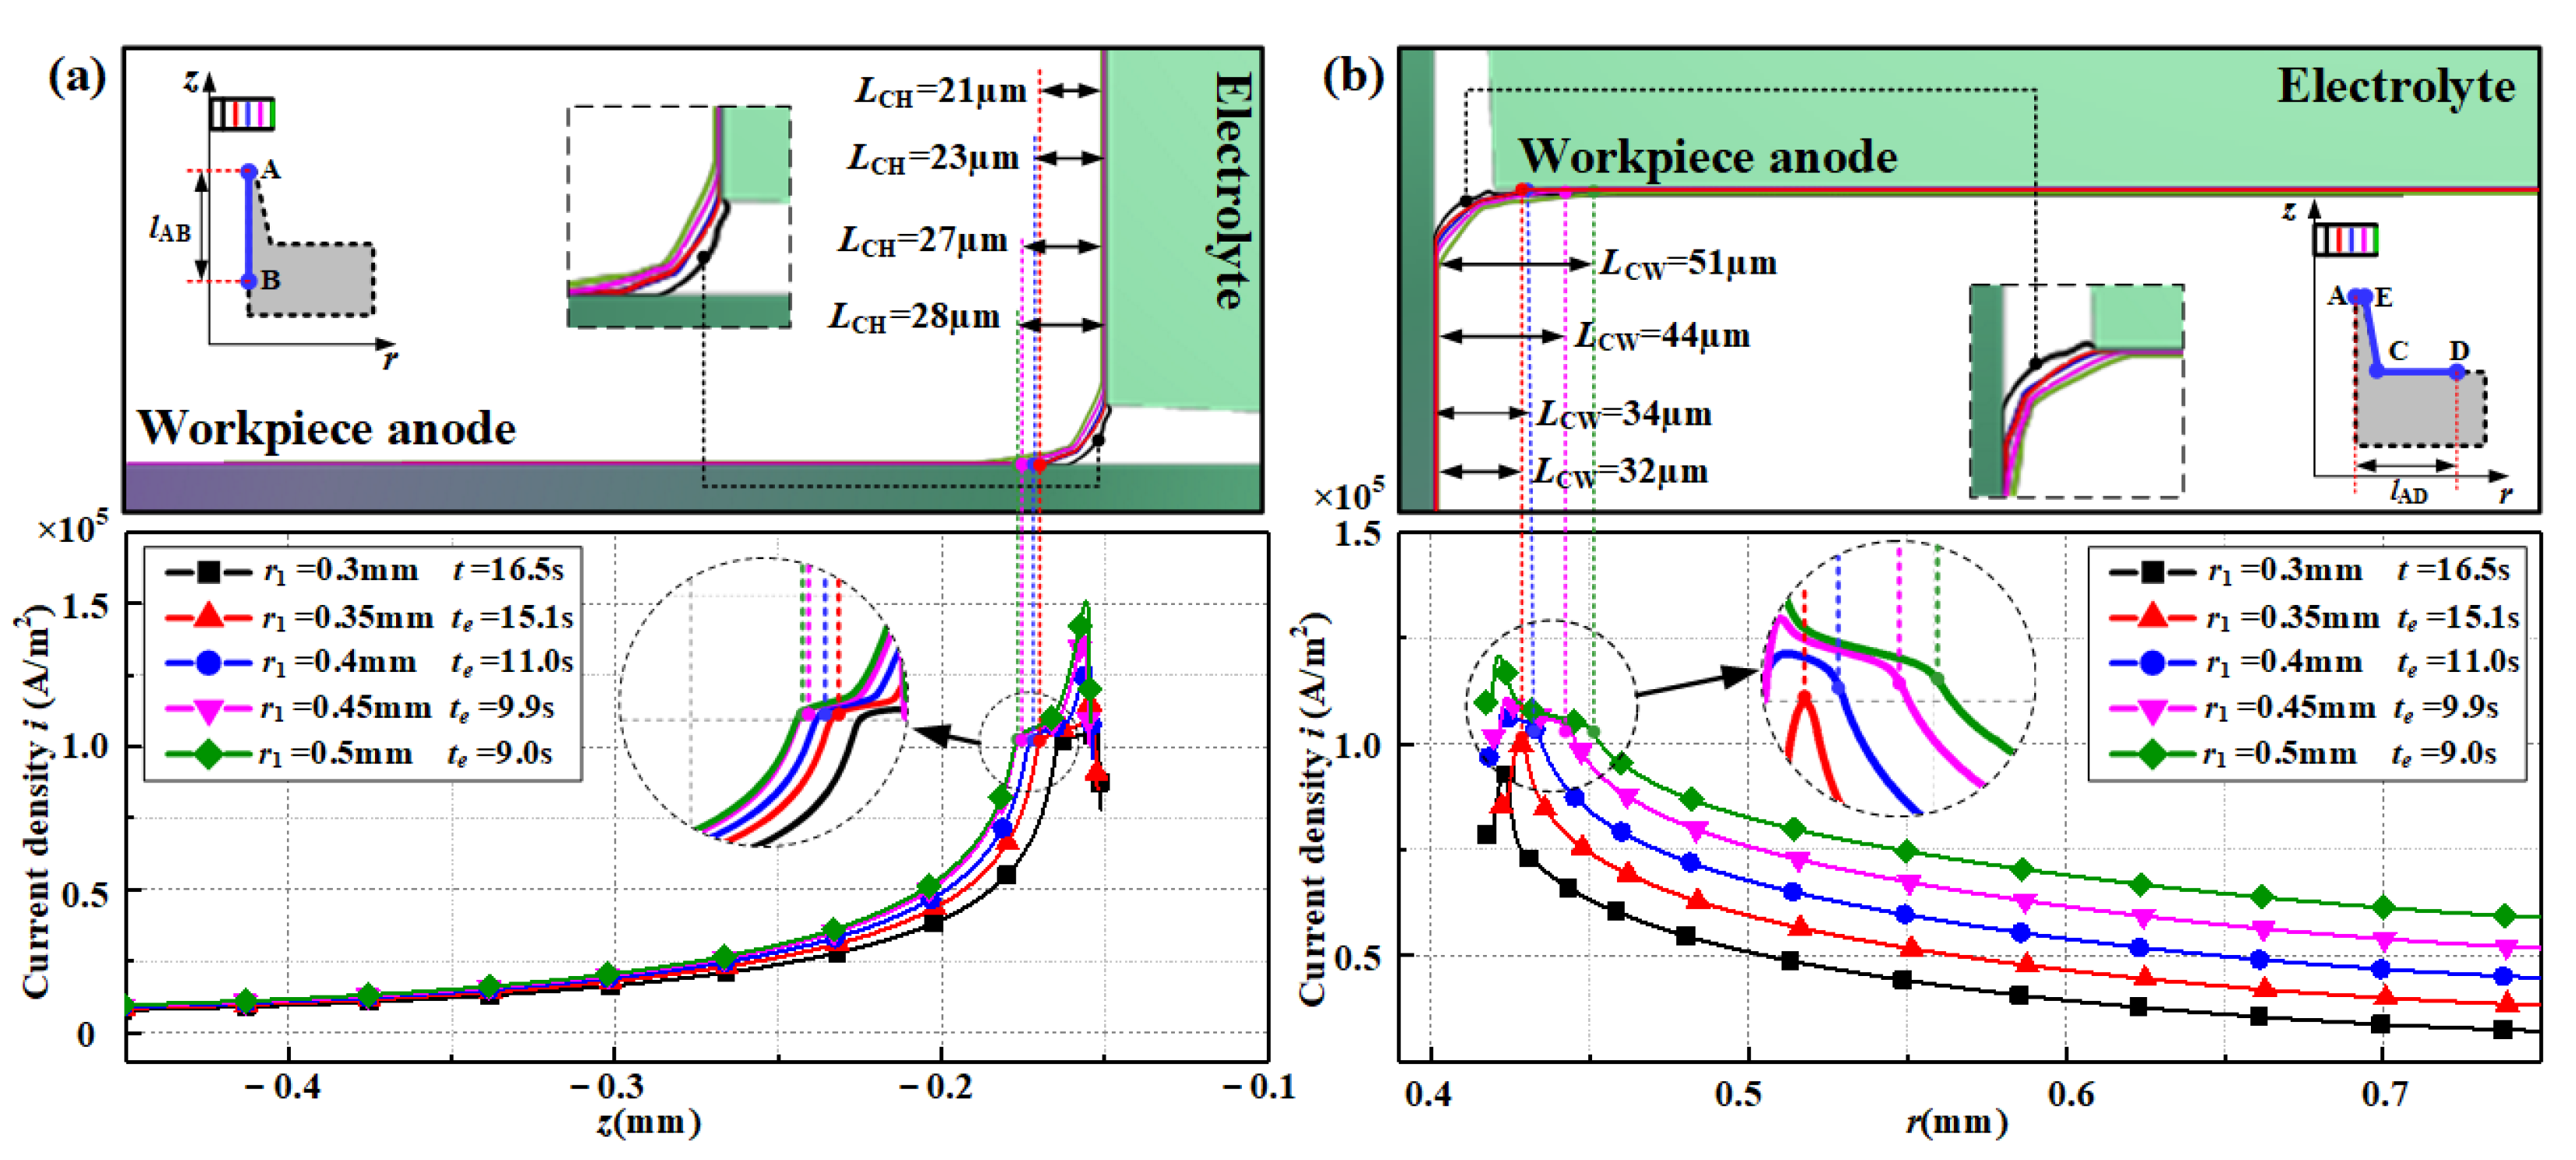
3.2.4. Effect of Electrode Radius

Taking C = 12%, the effect of electrode radius is obtained, and the results are shown in Figure 12. The electrolyte current density distribution is affected by the relative position of the workpiece anode and the tool cathode. In addition to the initial machining gap, the electrode radius r1 also affects the relative positional relationship between the anode and cathode. As the radius of the tool cathode increases, the contact area between the tool cathode and the electrolyte, and the relative area between the tool cathode and the workpiece anode, both increase, so the resistance during MD-ECD decreases and the current in the loop increases. Hence, the current density increases on both the lAB segment and the lAD segment. It can be seen from the figure that when r1 = 0.3 mm, deburring is slow; when r1 increases from 0.35 mm to 0.4 mm, the contour of the workpiece after deburring is close, but the machining rate is obviously improved; as r1 continues to increase, the deburring rate increases slowly, but the LCH and LCW values continue to increase, and the surface quality of the orifice decreases. The best electrode radius r1 is 0.4 mm or 0.35 mm.

3.3. Comprehensive Comparison of Machining Effects

The comprehensive comparison of machining effects under different parameters is shown in Figure 13. It can be seen from the figure that the machining voltage has the greatest influence on the chamfer width LCW and the chamfer height LCH under the simulation conditions, followed by the initial machining gap, electrolyte concentration, and electrode radius. Overall, the simulation effect is best and the LCW and LCH values are small when U = 4 V, d = 0.35 mm, C = 10%, and r1 = 0.4 mm.
It can be seen from the comparison that the LCH value is always larger than the LCW value under different machining parameters. The main reason is that the projection area of the electrode end face along the burr height direction is biased toward the electrode centerline, and the total amount of material to be removed in the lAB segment (vertical segment) is less than that in the lEC segment (inclined segment). In addition, a comprehensive comparison of Figure 9, Figure 10, Figure 11, Figure 12 and Figure 13 shows that the electrode radius has a relatively large influence on LCW and a relatively small influence on LCH. The reason is that the increasing direction of r1 is consistent with the direction of LCW size. With the increase of r1, the relative area between the tool cathode and the workpiece anode increases, which helps to increase the current density of the LAD segment.

4. Experimental Studies
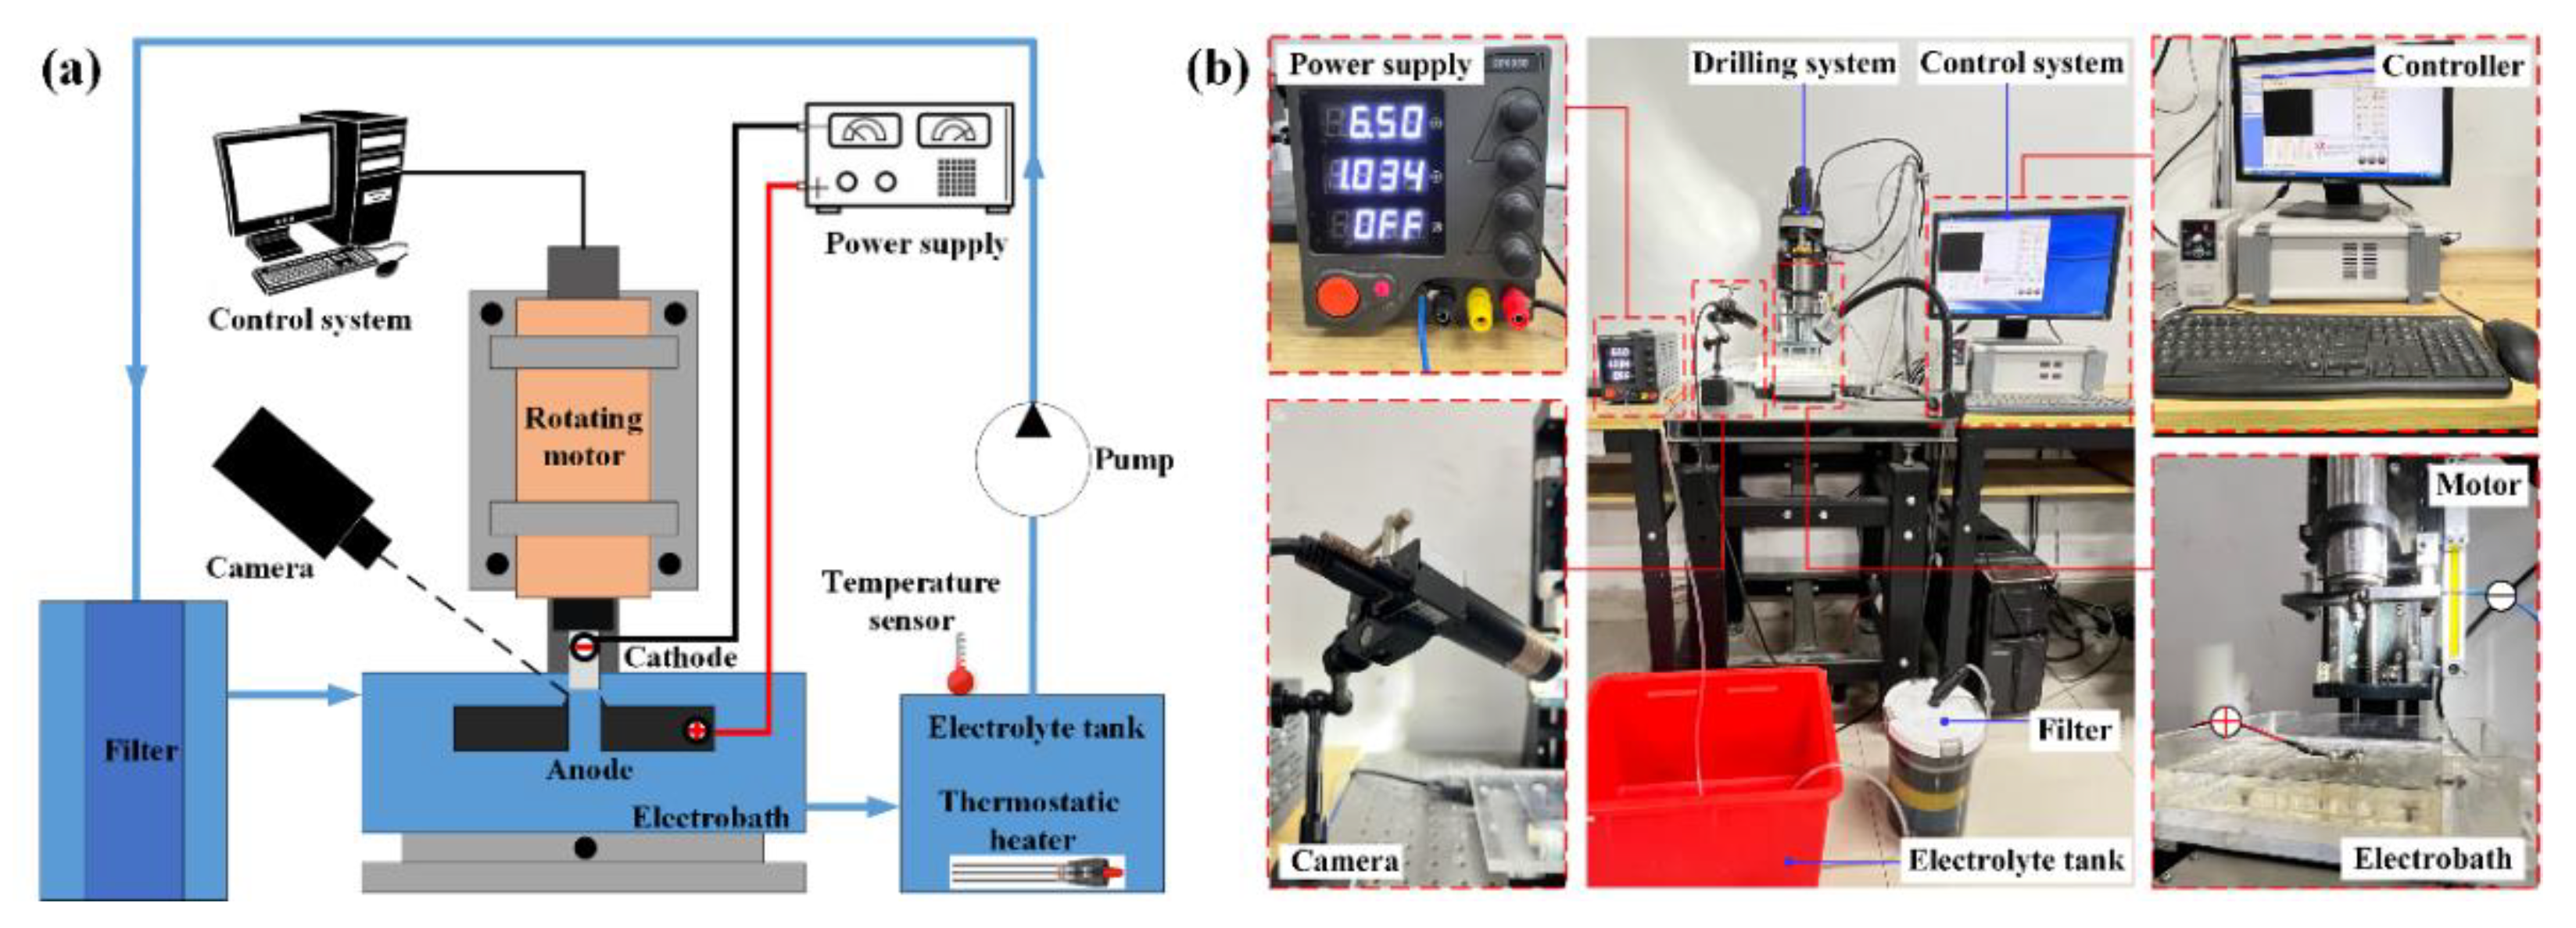
4.1. Test Device

Figure 14 presents a schematic diagram and a physical diagram of the experimental machining platform. The motion control system is mainly used to control the movement and position of electrodes and workpieces; the electrolyte circulation system is mainly used to control electrolyte renewal and circulation, as well as the filtration of electrolysis products and debris; and the real-time monitoring system is mainly used to monitor parameters such as electrolytic machining process and electrolytic current.

4.2. Test Process

The test parameters were set according to Table 1 and Table 2, microholes were machined on a 304 stainless steel plate with the help of a drilling tool, and then ECD was conducted. The deburring process is shown in Figure 15. During the machining, the surface of the electrode continuously produces bubbles. Owing to the small density of the bubbles, under the action of buoyancy, the bubbles will move upward along the cathode axis, finally forming a stable columnar bubble layer on the surface of the electrode. The bubble layer has an insulating effect and helps improve the localization of machining. SEM images of the orifice before and after deburring are shown in Figure 16. It can be seen from the figure that the burr is removed and the surface quality of the orifice is improved by MD-ECD. Compared with the electrochemical discharge drilling (ECDD) and micro-electrical discharge drilling (micro-EDD) processes in the literature [31,32], the orifice quality after MD-ECD treatment has been significantly improved. Compared with the deburring of the electrochemical deburring (ECD) process in the literature [22], the orifice burrs obtained in this test have less stray corrosion and the quality is better.
In addition, the removal of burr material from the orifice by electrochemical machining will affect the micro-hardness near the outer surface of the orifice. The micro-hardness measured at different locations from the edge of the orifice with the help of the HV-1000 micro-hardness tester is shown in Figure 17. It can be seen from the figure that in the area around the orifice, the farther away from the edge of the orifice, the lower the micro-hardness value. The micro-hardness around the orifice increases when mechanically drilling the microhole. But the MD-ECD makes the microhardness of the area around the micropore decrease. The reason for the above phenomenon is that the plastic deformation of the drill extrusion material during mechanical drilling leads to an increase in the microhardness around the orifice and the micro-hardness decreases due to the removal of the surface part of the material after electrochemical corrosion. But its micro-hardness is still higher than of the matrix material.

4.3. Test Results

4.3.1. Influence of Machining Voltage

With initial machining gap d = 0.35 mm, electrolyte concentration C = 12%, and electrode radius r1 = 0.4 mm, the MD-ECD machining effect was explored under different voltages, as shown in Figure 18. The average values of LCW and LCH of the orifice are measured many times by the PS50 3D profiler.
It can be seen from the figure that the values of the chamfer width LCW and chamfer height LCH increase with the increase of the machining voltage. When U = 4 V, LCW = 29 µm, LCH = 17 µm, and the experimental effect is the best; when U = 7 V, the material in the non-target area is excessively removed. The experimental results are consistent with the simulation results.

4.3.2. Influence of Initial Machining Gap

Taking U = 4 V, C = 12%, and r1 = 0.4 mm, the MD-ECD machining effect under different initial machining gaps is shown in Figure 19. It can be seen from the figure that the values of LCW and LCH increase with the decrease of the initial machining gap, and the test results are largely consistent with the simulation results. When d = 0.35 mm, the test effect is the best. When d = 0.2 mm, LCW = 98 µm, and LCH = 54 µm are obtained. The chamfer phenomenon is obvious, and the machining gap is too small, which is not conducive to the renewal of electrolyte and the discharge of electrolytic products, thereby reducing the stability of the machining process.

4.3.3. Influence of Electrolyte Concentration

Taking U = 4 V, d = 0.35 mm, and r1 = 0.4 mm, the MD-ECD machining effects under different electrolyte concentrations are obtained as shown in Figure 20. It can be seen from the figure that the values of LCW and LCH increase with the increase of electrolyte concentration. Under the test conditions, relative to the voltage and the initial machining gap, the effect of the electrolyte concentration is weak. When C = 18%, LCW = 60 µm, and LCH = 54 µm are obtained, and the chamfer is small. The test results are consistent with the simulation results.

4.3.4. Influence of Electrode Radius

Taking U = 4 V, d = 0.35 mm, and C = 12%, the MD-ECD machining effect under different electrode radii is obtained as shown in Figure 21. It can be seen from the figure that the values of LCW and LCH increase with the increase of electrode radius. Under the test conditions, the influence of electrode radius is smaller than that of voltage and initial machining gap. When r1 = 0.35 mm, LCW = 60 µm, and LCH = 54 µm are obtained, and the chamfer size is the smallest. When r1 = 0.4 mm, the chamfer size is close to that of r1 = 0.35 mm, but the machining time is shorter, which is basically consistent with the simulation results. It can be seen that when the electrode radius is equal to the diameter of the microhole, the best trade-off between machining quality and removal efficiency is achieved.

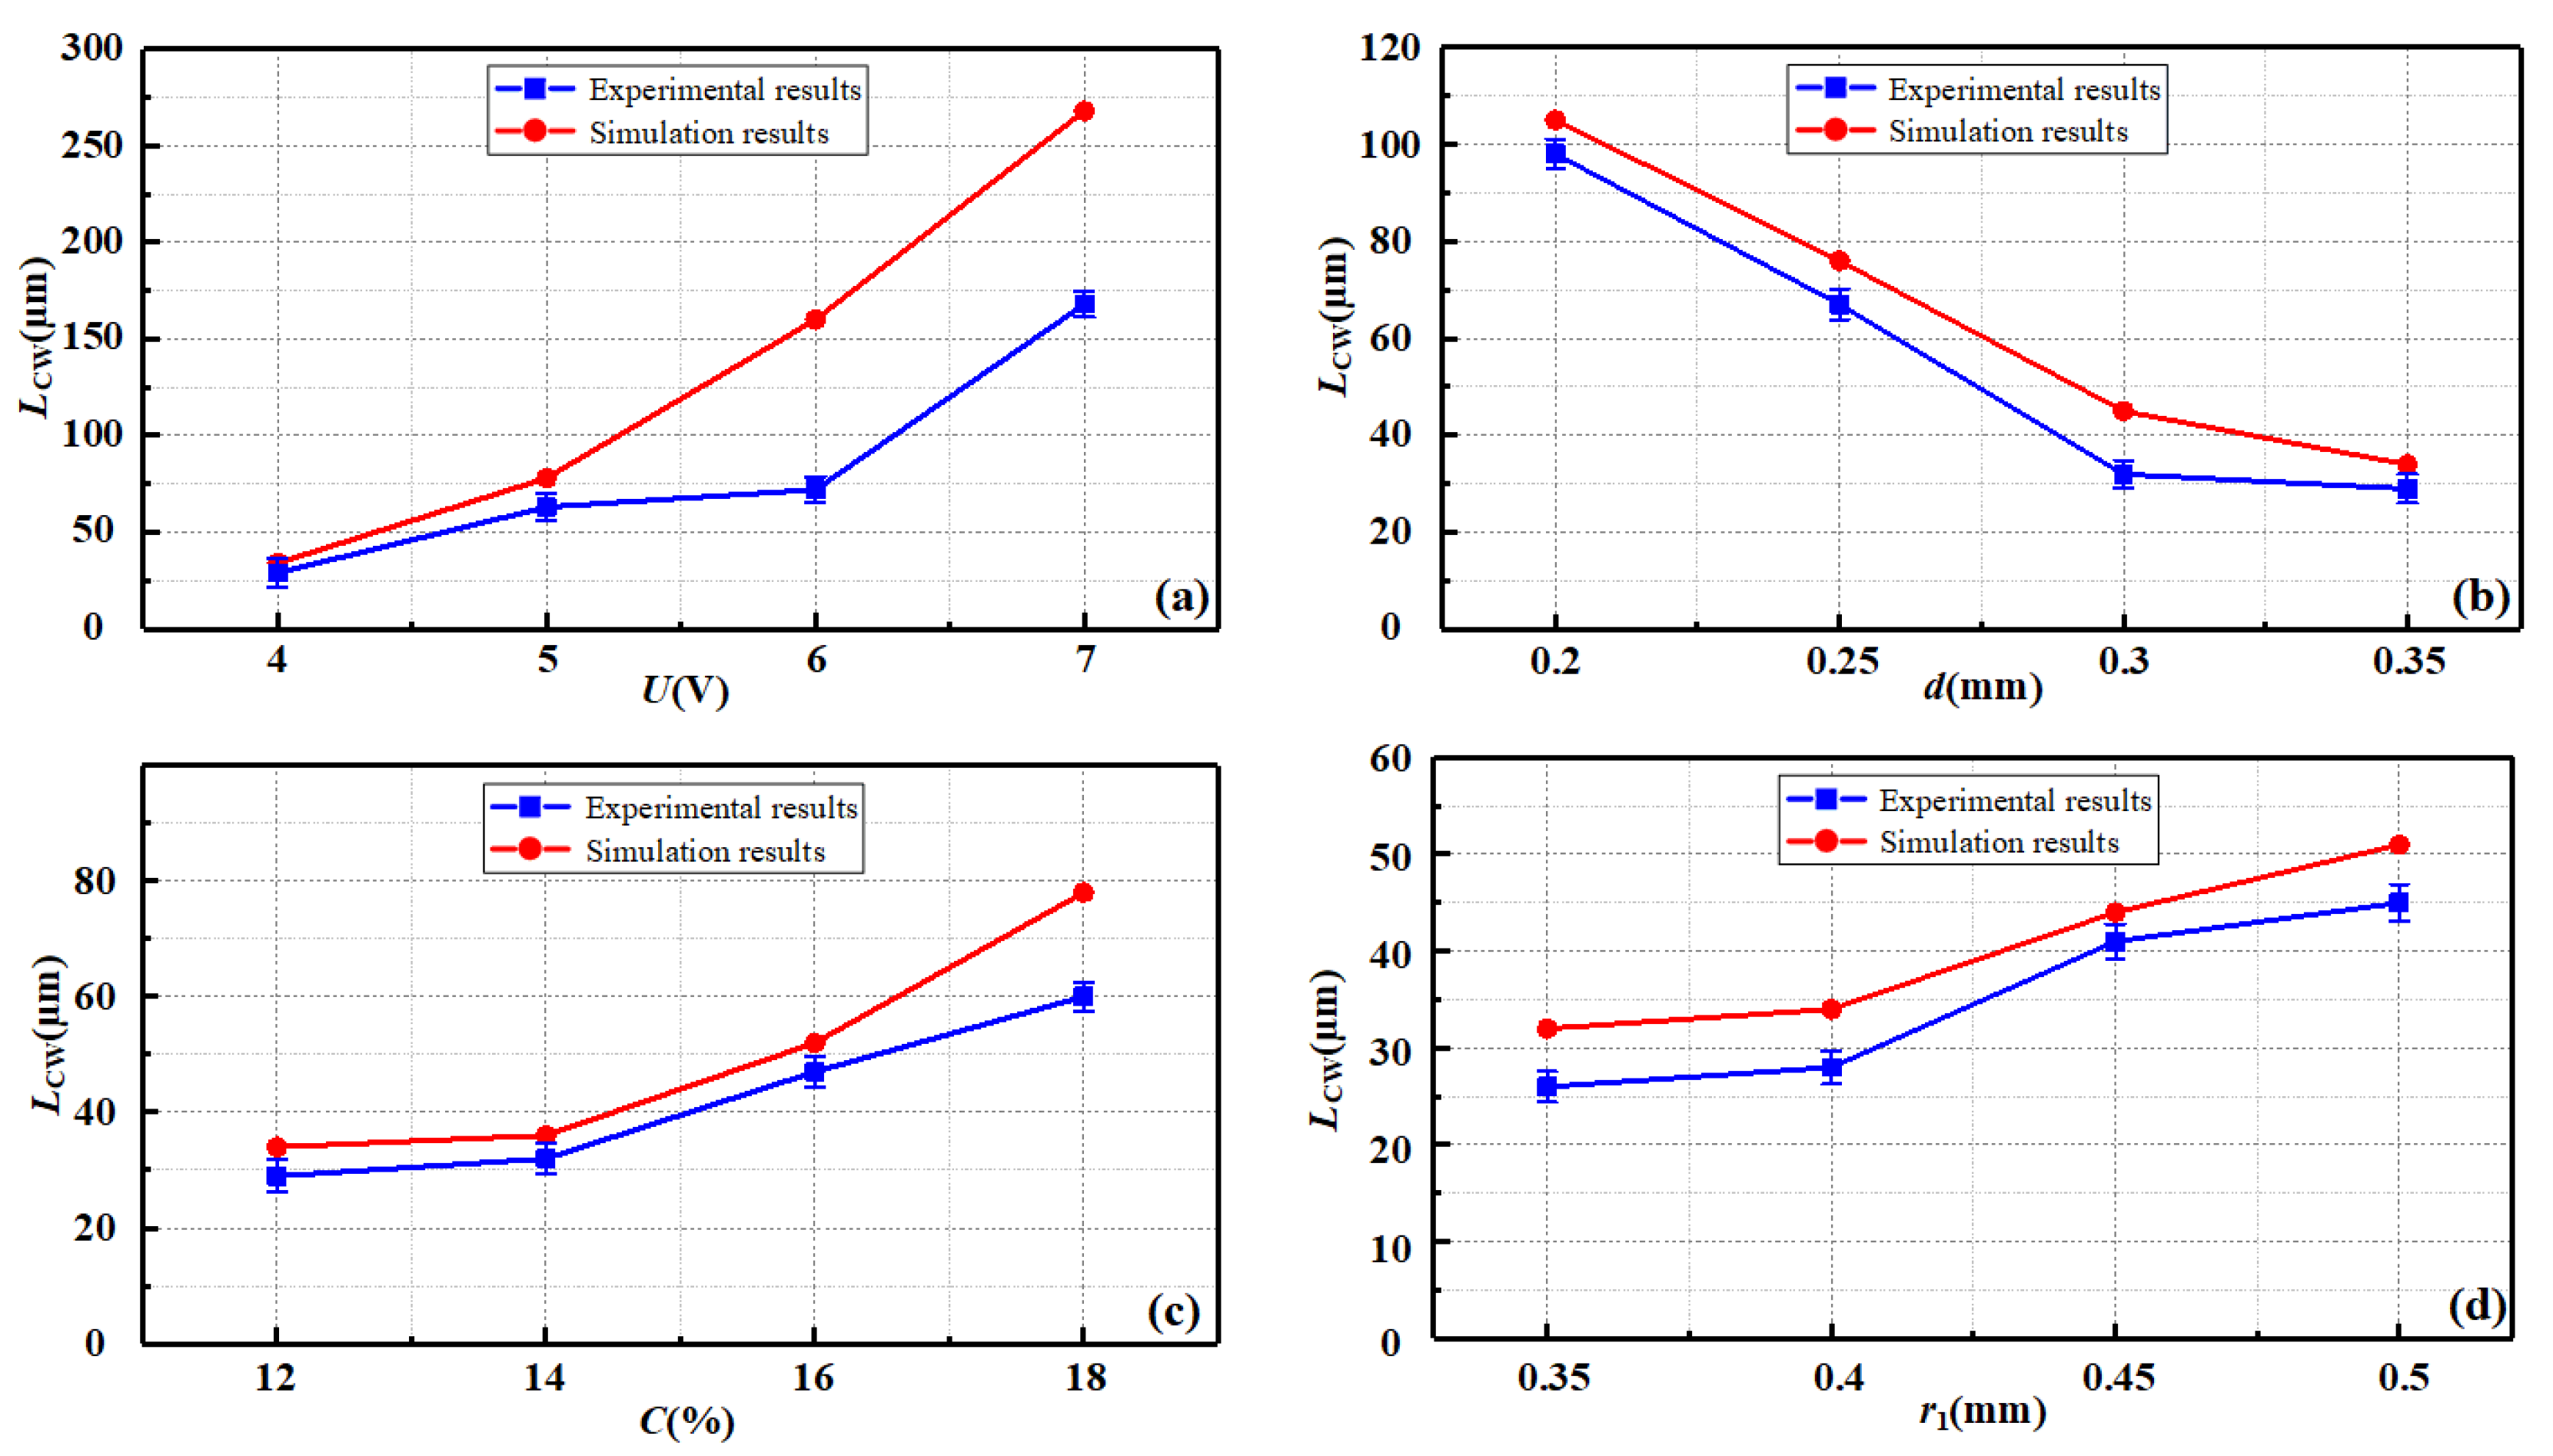
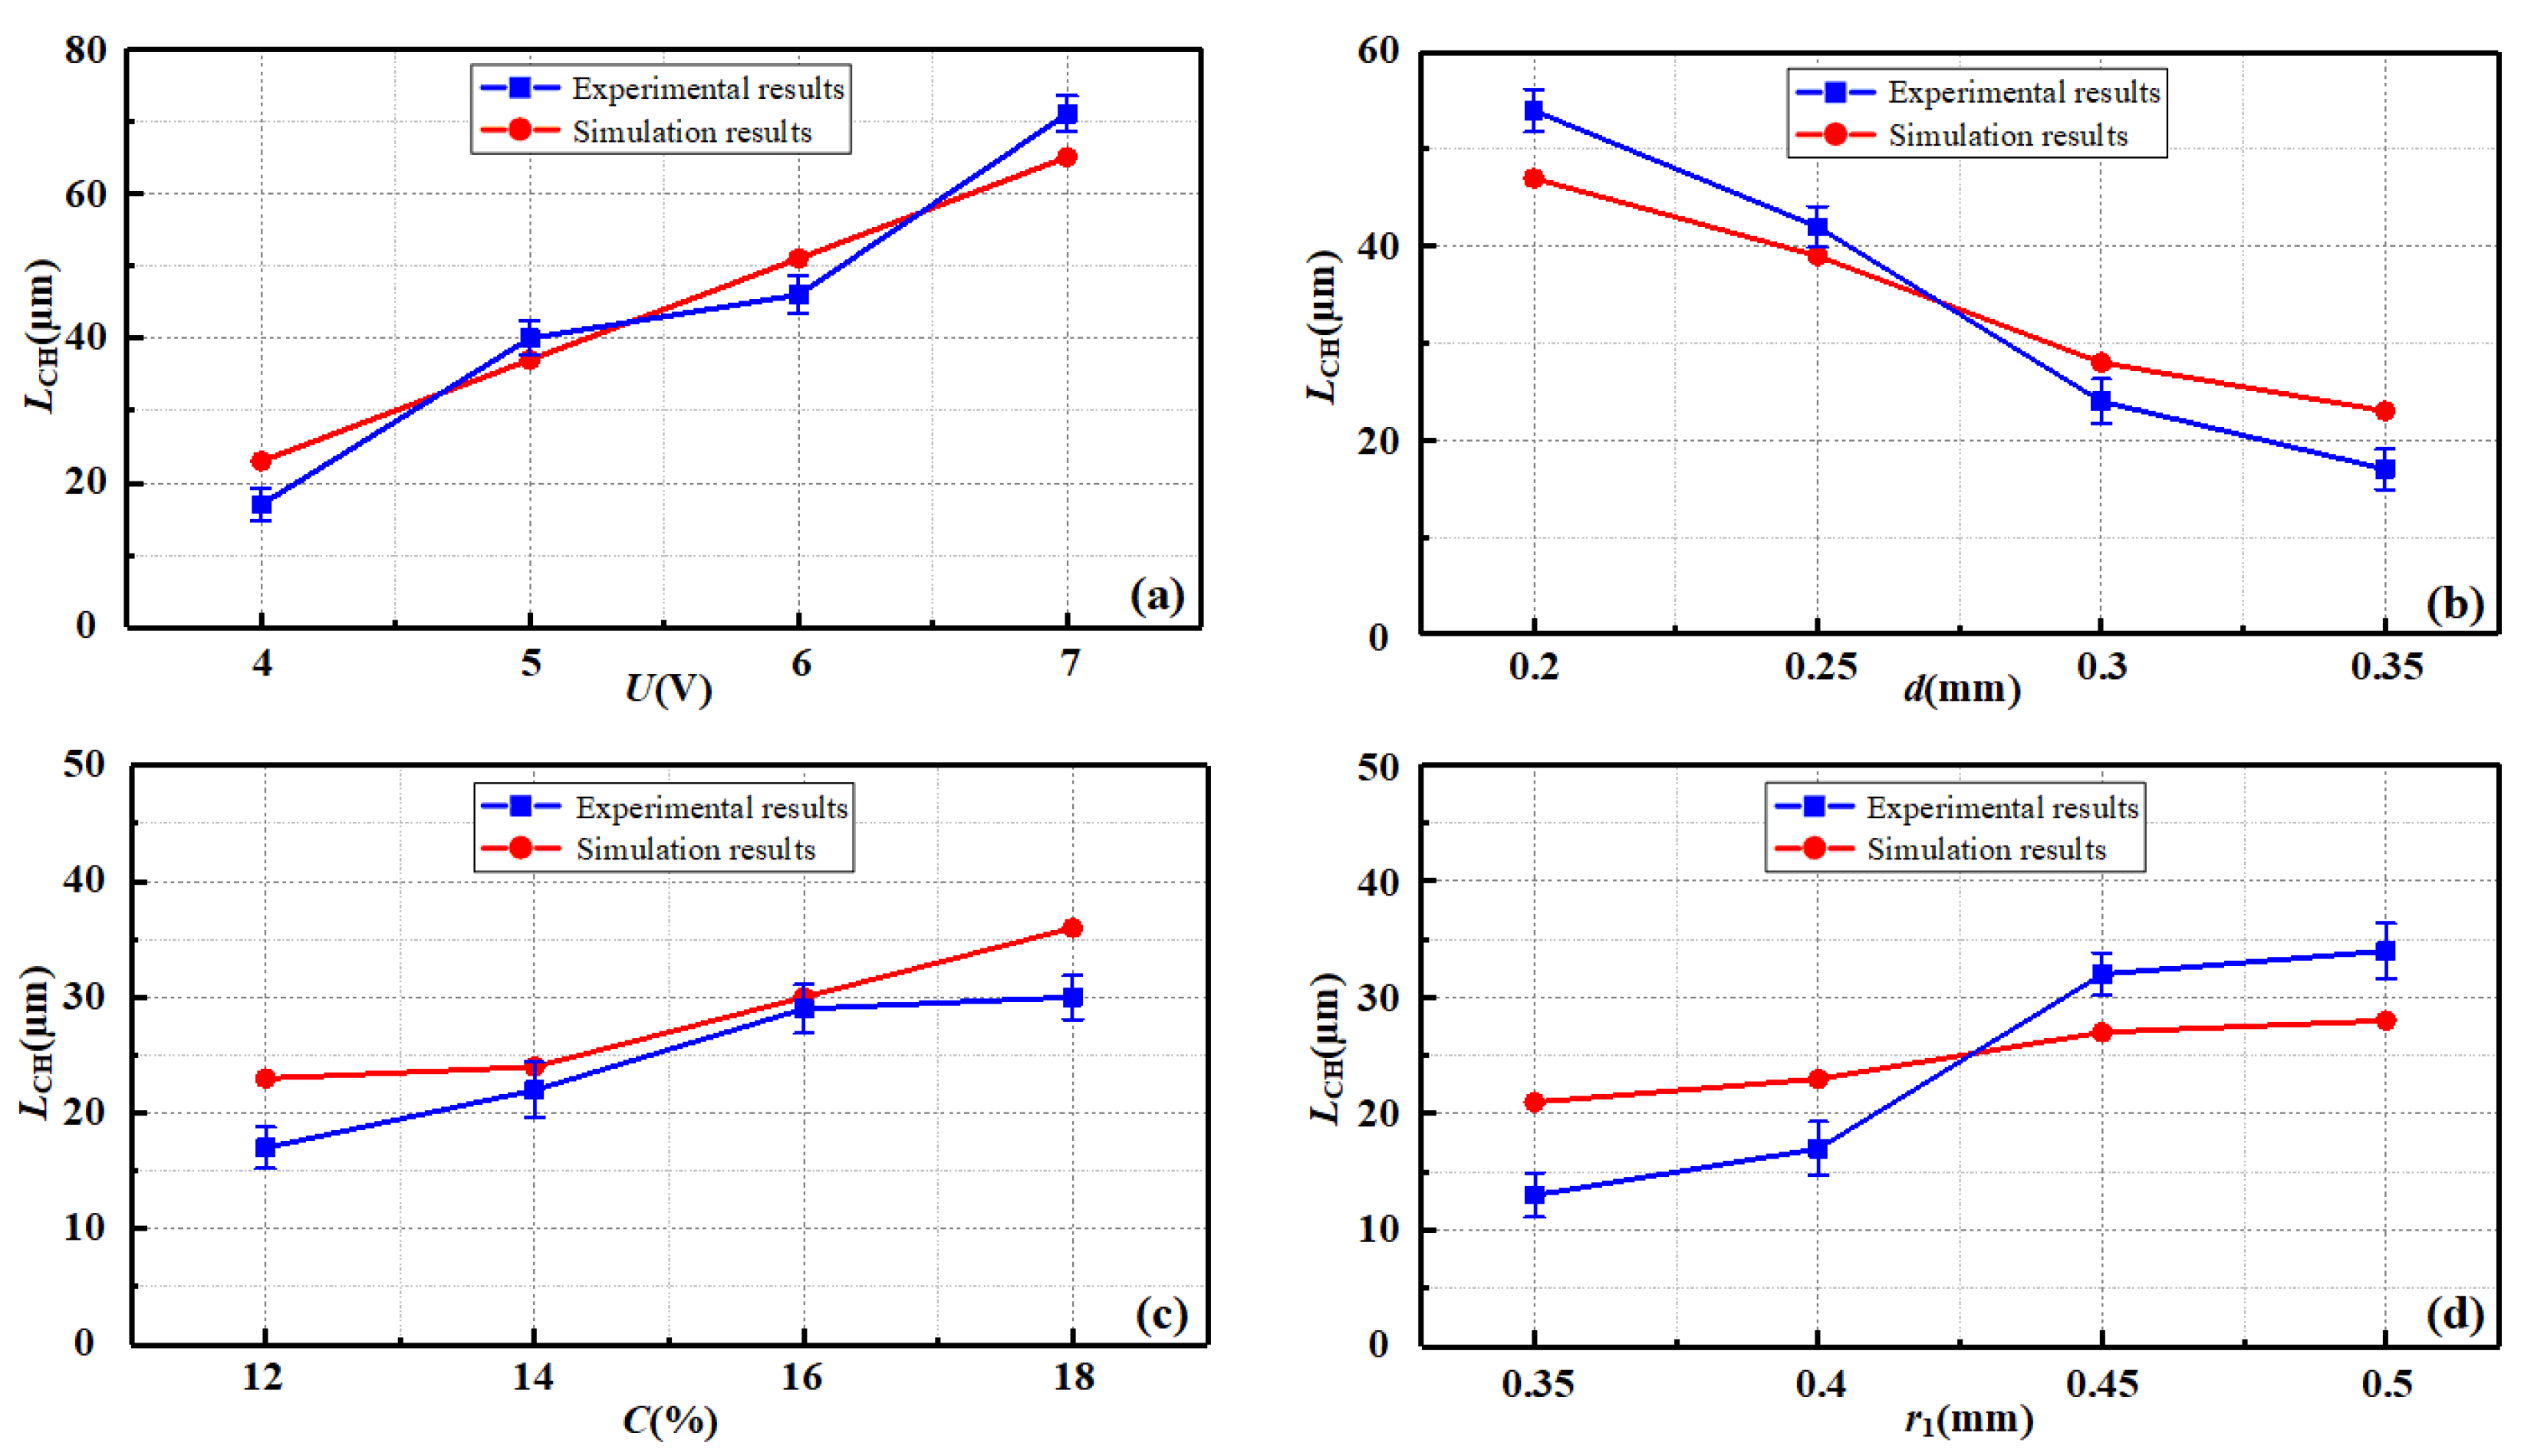
4.3.5. Comparison of Experiment and Simulation Results

The comparison curves of the chamfer width and chamfer height obtained from simulations and experiments are shown in Figure 22 and Figure 23. It can be seen from the figure that the experimental results are basically consistent with the simulation results. When U = 4 V, d = 0.35 mm, C = 12%, and r1 = 0.4 mm, the LCW and LCH values are small, and the deburring effect is best. However, there is some error between the experiment results and the simulation results. The main reason for this is that the conductivity is constant during the simulation process, but in the actual machining process, the machining gap is small, and the electrolyte in the gap may not be updated in time, which leads to conductivity changes that affect the test results.
In general, the chamfer size obtained in the experiment is slightly smaller than the simulation size, mainly because the simulation fails to consider the influence of electrolytic bubbles. The bubble layer formed by the accumulation of bubbles (as shown in Figure 15) has an insulating effect and weakens the electrolysis effect. In addition, when U = 7 V, the chamfer size error is larger, which is mainly because when the voltage increases, the number of bubbles generated by electrolysis increases, and the influence of the bubble layer is more obvious, so when U = 7 V, the chamfer width and chamfer height obtained from the test deviate greatly from the simulation value.

5. Conclusions

To improve electrochemical deburring of microholes, MD-ECD simulation and experimental research were conducted. The distribution and dynamic changes of the current density in the machining area during the electrochemical machining process were analyzed, and the synchronous change relationship between the current density and the burr profile was studied. Additionally, taking the chamfer width LCW and the chamfer height LCH after machining as evaluation indicators, the influences of process parameters on the machining effect of MD-ECD were analyzed. The following conclusions can be drawn from this study:
(1) The magnitude of the current density value in the burr region reflects the strength of MD-ECD’s deburring ability. The current density near the burr tip is high, so material is preferentially removed from this area; the current density in the non-processed area is low, so material is removed slowly from this area. Before the burr is removed, there are two current density peaks on the surface, which are located in the adjacent areas on both sides of the top of the burr, which causes the material on both sides of the top of the burr to be removed quickly, making the top of the burr form spikes; in contrast, there is a current density valley at the root of the burr, resulting in slow removal of material at the root of the burr.
(2) As the machining progresses, the burr tip becomes blunt, the current in the burr area gradually transfers to the non-machining area, the current density in the burr area decreases, and the current density in the non-burr area increases, resulting in the transfer of the material removal area from the burr area to the adjacent non-machining area. Hence, the material at the root of the burr and its adjacent area is quickly removed, and a chamfer is formed at the orifice.
(3) Under the simulation and experiment conditions, the effects of factors such as machining voltage, machining gap, electrolyte concentration, and electrode radius on the chamfer size are gradually weakened. Decreasing the machining voltage, electrolyte concentration, and electrode radius, or increasing the initial machining gap can help reduce orifice chamfering and improve the deburring effect, but it will also reduce the deburring efficiency.
(4) Because the projection of the electrode end face along the burr height direction is biased toward the electrode centerline, and the burr shape is asymmetrical, the LCW value is always greater than the LCH value in the machining process. Because the electrode radius direction is consistent with the LCW size direction, the electrode radius has a great impact on LCW and a relatively small impact on LCH. When U = 4 V, d = 0.35 mm, C = 12%, and r1 = 0.4 mm, LCW and LCH are 29 μm and 17 μm, respectively. Then the best trade-off between removal efficiency and accuracy is attained for the deburring process.

Author Contributions

Supervision, T.H. and H.D.; methodology, T.H.; validation, S.H.; software, S.H.; investigation S.F.; writing—original draft preparation, Q.D. and S.F.; writing—review and editing, T.H. and M.Z. All authors have read and agreed to the published version of the manuscript.

Funding

This study was financially supported by the National Natural Science Foundation of China (Grant No. 51675003), the Natural Science Foundation of Anhui Province (Grant No. 2008085QE216), the Open Foundation of the Anhui Key Laboratory of Mine Intelligent Equipment and Technology (Grant No. ZKSYS202101), and the University Synergy Innovation Program of Anhui Province (Grant No. GXXT-2020-062).

Data Availability Statement

The data used to support the findings of this study are included in the article.

Conflicts of Interest

The authors declare no conflict of interest.

References

  1. Zhang, C.; Xu, Z.; Lu, J.; Geng, T. An electrochemical discharge drilling method utilising a compound flow field of different fluids. J. Mater. Process. Technol. 2021, 298, 117306. [Google Scholar] [CrossRef]
  2. Zou, H.; Yue, X.; Luo, H.; Liu, B.; Zhang, S. Electrochemical micromachining of micro hole using micro drill with non-conductive mask on the machined surface. J. Manuf. Process. 2020, 59, 366–377. [Google Scholar] [CrossRef]
  3. Rahman, M.Z.; Das, A.K.; Chattopadhyaya, S. Effects of balance electrode in deep micro-holes drilling in “nickel plate” through μECM process using H2SO4 electrolyte. Mater. Today Proc. 2021, 43, 1431–1436. [Google Scholar] [CrossRef]
  4. Kumar, R.; Kumar, A.; Singh, I. Electric discharge drilling of micro holes in CFRP laminates. J. Mater. Process. Technol. 2018, 259, 150–158. [Google Scholar] [CrossRef]
  5. Zhao, T.; Yan, Y.; He, Z.; Gao, W.; Yang, Z. Influence of hole size and number on pressure drop and energy output of the micro-cylindrical combustor inserting with an internal spiral fin with holes. Int. J. Hydrogen Energy 2021, 46, 26594–26606. [Google Scholar] [CrossRef]
  6. Basso, I.; Batista, M.F.; Jasinevicius, R.G.; Rubio, J.C.C.; Rodrigues, A.R. Micro drilling of carbon fiber reinforced polymer. Compos. Struct. 2019, 228, 111312. [Google Scholar] [CrossRef]
  7. Huang, T.-W.; Sheu, D.-Y. High aspect ratio of micro hole drilling by Micro-EDM with different cross-section shape micro tools for flushing process. Procedia CIRP 2020, 95, 550–553. [Google Scholar] [CrossRef]
  8. Zhu, D.; Zeng, Y.B.; Xu, Z.Y.; Zhang, X.Y. Precision machining of small holes by the hybrid process of electrochemical removal and grinding. CIRP Ann.-Manuf. Technol. 2011, 60, 247–250. [Google Scholar] [CrossRef]
  9. Guatam, G.D.; Pandey, A.K. Pulsed Nd: YAG laser beam drilling: A review. Opt. Laser Technol. 2018, 100, 183–215. [Google Scholar] [CrossRef]
  10. Balasubramaniam, R.; Krishnan, J.; Ramakrishnan, N. Empirical study on the generation of an edge radius in abrasive jet external deburring (AJED). J. Mater. Process. Technol. 2000, 99, 49–53. [Google Scholar] [CrossRef]
  11. Kwon, B.C.; Kim, K.H.; Ko, S.L. New abrasive deburring method using suction for micro burrs at intersecting holes. CIRP Ann. 2016, 65, 145–148. [Google Scholar] [CrossRef]
  12. Ko, S.L.; Yu, M.B.; Park, J.I. Micro deburring for precision parts using magnetic abrasive finishing method. J. Mater. Process. Technol. 2007, 187, 19–25. [Google Scholar] [CrossRef]
  13. Jiao, A.Y.; Zhang, L.L.; Chen, Y.; Liu, X.L. Mechanism and Experimental Study of TC4 Hole Burr by Magnetic Particle Grinding. Surf. Technol. 2019, 48, 283–290. [Google Scholar]
  14. Okada, A.; Yonehara, H.; Okamoto, Y. Fundamental Study on Micro-deburring by Large-area EB Irradiation. Procedia CIRP 2013, 5, 19–24. [Google Scholar] [CrossRef]
  15. Islam, M.M.; Li, C.P.; Won, S.J.; Ko, T.J. A deburring strategy in drilled hole of CFRP composites using EDM process. J. Alloy. Compd. 2017, 703, 477–485. [Google Scholar] [CrossRef]
  16. Choi, I.H.; Kim, J.D. A study of the characteristics of the electrochemical deburring of a governor-shaft cross hole. J. Mater. Process. Technol. 1998, 75, 198–203. [Google Scholar] [CrossRef]
  17. Lee, S.J.; Liu, C.P.; Fan, T.J.; Chen, Y.H. Deburring Miniature Components by Electrochemical Method. Int. J. Electrochem. Sci. 2013, 8, 1713–1721. [Google Scholar]
  18. Yang, S.Q.; Li, W.H.; Yang, S.C. Research on Hole Surface Finishing Technology. Modul. Mach. Tool Autom. Manuf. Tech. 2010, 1, 56–60. [Google Scholar]
  19. Liu, X.; Li, L.T.; Zhao, G.Z.; Tao, S.; Chen, W.B. Non-traditional Machining Deburring of Valve Crosshole in Launch Vehicles. Electromach. Mould 2018, 6, 58–61. [Google Scholar]
  20. Wang, Y.; Yang, F.; Zhang, G.; Zhang, W. Fabrication of deep and small holes by synchronized laser and shaped tube electrochemical machining (Laser-STEM) hybrid process. Int. J. Adv. Manuf. Technol. 2019, 105, 2721–2731. [Google Scholar] [CrossRef]
  21. Wang, K.; Shen, Q.; He, B. Localized Electrochemical Deburring of Cross Hole Using Gelatinous Electrolyte. Mater. Manuf. Process. 2016, 31, 1749–1754. [Google Scholar] [CrossRef]
  22. Zheng, X.H.; Wei, Z.F.; Yu, Z.Y. Electrochemical Deburring of Miniature Holes. Adv. Mater. Res. 2013, 690–693, 3226–3230. [Google Scholar]
  23. Li, J.; Wang, Z.L.; Guo, Y.L. Simulation and experiment of automatic electrolytic deburring on inner intersecting holes based on electric current detection. J. Harbin Inst. Technol. 2016, 48, 152–158. [Google Scholar]
  24. Prabhu, S.; Kumar, A. Investigation of Nickel Coated Tool for Electrochemical Deburring of Al6082. Int. J. Surf. Eng. Interdiscip. Mater. Sci. 2018, 6, 17–31. [Google Scholar] [CrossRef]
  25. Guo, Y.J.; Liu, J.H.; Li, J.; Wang, L.; Dong, H.; Grid, S. Electric Field Simulation of Electrochemical Deburring Machining for Internal Cross Hole. J. Dalian Jiaotong Univ. 2018, 39, 110–114. [Google Scholar]
  26. Zhang, R.J.; Zhang, Z.Y.; Li, Y.B.; Xu, G.H.; Cui, X.X.; Liu, J. Green Chemical Mechanical Polishing of 304 Stainless Steel. Surf. Technol. 2022, 51, 325–335. [Google Scholar]
  27. Liang, Z.Q.; Ma, Y.; Chen, J.J.; Li, Y.; Ma, D.; Cao, Y.X.; Cai, R.B.; Guo, H.X.; Wang, X.B. Research on Drilling Performance of High-aspect-ratio Micro-drill with Thinned Chisel Edge. J. Mech. Eng. 2021, 57, 244–252. [Google Scholar]
  28. Rahman, Z.; Das, A.K.; Chattopadhyaya, S. Microhole drilling through electrochemical processes: A review. Mater. Manuf. Process. 2017, 33, 1379–1405. [Google Scholar] [CrossRef]
  29. Saxena, K.K.; Qian, J.; Reynaerts, D. A review on process capabilities of electrochemical micromachining and its hybrid variants. Int. J. Mach. Tools Manuf. 2018, 127, 28–56. [Google Scholar] [CrossRef]
  30. Wang, D.; Zhu, Z.; Wang, N.; Zhu, D.; Wang, H. Investigation of the electrochemical dissolution behavior of Inconel 718 and 304 stainless steel at low current density in NaNO3 solution. Electrochim. Acta 2015, 156, 301–307. [Google Scholar] [CrossRef]
  31. Hazra, S.; Mohanty, S.; Kumar, S.; Basak, R.; Das, A.K. Experimental investigation of powder mixed micro-electrical discharge drilling on SS304 substrate. Mater. Today Proc. 2022, 62, 270–275. [Google Scholar] [CrossRef]
  32. Shi, X.C.; Huang, S.F.; Wang, L. Investigation of the Material Removal Mechanism in Electrochemical Discharge Drilling Using a High-Speed Rotating Helical Tool-Electrode. Int. J. Electrochem. Sci. 2019, 14, 9239–9254. [Google Scholar] [CrossRef]
Figure 1. Principle of electrochemical deburring.
Machines 10 00726 g001
Figure 2. Simulation model.
Machines 10 00726 g002
Figure 3. Burr morphology measurement.
Machines 10 00726 g003
Figure 4. Mesh division.
Machines 10 00726 g004
Figure 5. Mesh independence verification.
Machines 10 00726 g005
Figure 6. Electrolyte current density distribution.
Machines 10 00726 g006
Figure 7. Current density distribution on the surface of the burr: (a) Current density distribution of lAB; (b) Current density distribution of lAD.
Machines 10 00726 g007
Figure 8. Schematic diagram of burr profile change.
Machines 10 00726 g008
Figure 9. Effect of machining voltage: (a) Current density distribution of lAB; (b) Current density distribution of lAD.
Machines 10 00726 g009
Figure 10. Influence of initial machining gap: (a) Current density distribution of lAB; (b) Current density distribution of lAD.
Machines 10 00726 g010
Figure 11. Effect of electrolyte concentration: (a) Current density distribution of lAB; (b) Current density distribution of lAD.
Machines 10 00726 g011
Figure 12. Influence of electrode radius: (a) Current density distribution of lAB; (b) Current density distribution of lAD.
Machines 10 00726 g012
Figure 13. Comparison of MD-ECD machining effects: (a) Effect of machining voltage; (b) Effect of initial machining gap; (c) Effect of electrolyte concentration; (d) Effect of electrode radius.
Machines 10 00726 g013
Figure 14. Test platform: (a) Schematic diagram; (b) Physical photos.
Machines 10 00726 g014
Figure 15. Machining process.
Machines 10 00726 g015
Figure 16. Orifice morphology before and after deburring.
Machines 10 00726 g016
Figure 17. Micro-hardness of the microhole.
Machines 10 00726 g017
Figure 18. Influence of machining voltage on orifice chamfer.
Machines 10 00726 g018
Figure 19. Influence of initial machining gap on orifice chamfer.
Machines 10 00726 g019
Figure 20. Effect of electrolyte concentration on orifice chamfer.
Machines 10 00726 g020
Figure 21. Influence of electrode radius on orifice chamfer.
Machines 10 00726 g021
Figure 22. LCW comparison curve: (a) Effect of machining voltage; (b) Effect of initial machining gap; (c) Effect of electrolyte concentration; (d) Effect of electrode radius.
Machines 10 00726 g022
Figure 23. LCH comparison curve: (a) Effect of machining voltage; (b) Effect of initial machining gap; (c) Effect of electrolyte concentration; (d) Effect of electrode radius.
Machines 10 00726 g023
Table 1. Simulation parameters.
ParameterNumerical Value
Voltage value U (V)3, 4, 5, 6, 7
Electrolyte concentration C (%)10, 12, 14, 16, 18
Tool electrode radius r1 (mm)0.3, 0.35, 0.4, 0.45, 0.5
Machining gap d (mm)0.2, 0.25, 0.3, 0.35, 0.4
Micro hole radius r2 (mm)0.4
Machining temperature T (K)293.14
Table 2. Test parameters.
ParameterValue
Electrode materialTungsten steel
Workpiece thickness (mm)0.35
Workpiece material304 stainless steel
Drilling tool diameter (mm)0.8
Feed rate (mm/s)0.01
Drilling speed (r/min)6000
Electrolyte cycle speed reading (L/min)1
Publisher’s Note: MDPI stays neutral with regard to jurisdictional claims in published maps and institutional affiliations.

