Article

Feature-Based Bearing Fault Classification Using Taylor–Fourier Transform

by
Gerardo Avalos-Almazan
1,
Sarahi Aguayo-Tapia
1,
Jose de Jesus Rangel-Magdaleno
1,* and
Mario R. Arrieta-Paternina
2
1
Digital Systems Group, National Institute for Astrophysics, Optics and Electronics, Puebla 72840, Mexico
2
Department of Electrical Engineering, National Autonomous University of Mexico, Mexico City 04510, Mexico
*
Author to whom correspondence should be addressed.
Machines 2023, 11(11), 999; https://doi.org/10.3390/machines11110999
Submission received: 22 August 2023 / Revised: 25 October 2023 / Accepted: 25 October 2023 / Published: 29 October 2023
(This article belongs to the Special Issue Condition-Based Monitoring of Electrical Machines)

Abstract

:
This paper proposes a feature-based methodology for early bearing fault detection and classification in induction motors through current signals using the digital Taylor–Fourier transform (DTFT) and statistical methods. The DTFT allows the application of narrow bandwidth digital filters located in the spurious current signal components, wherewith it is possible to gain information to detect bearing issues and classify them using statistical methods. The methodology was implemented in MATLAB using the digital Taylor–Fourier transform for three fault types (bearing ball damage, outer-race damage, and corrosion damage) at different powering conditions: power grid source at 60 Hz and adjustable speed drive applied (60 Hz, 50 Hz, 40 Hz, 30 Hz, 20 Hz, and 10 Hz) in loading and unloading conditions. Results demonstrate a classification accuracy between 93–99% for bearing ball damage, 91–99% for outer-race damage, and 94–99% for corrosion damage.

1. Introduction

The most commonly used electric machines are induction motors (IM) due to their sturdiness, low cost, and simple installation and maintenance [1,2,3]. IMs are used in several industrial applications such as electric transport, elevators, air compressors, water treatment, wind turbines, distribution, pumps, and fans, among others [4]. Bearing damage is the most common fault in IMs because these are under a large amount of mechanical and electric stress. This kind of damage is inevitable and represents a severe problem for the motor’s condition and the electric systems where it is located. Bearing damage may cause progressive deterioration in the hole system, energetic losses, vibrations, overheating, etc. To prevent catastrophic injury, a lot of measurement devices can be installed in the industry to detect abnormal conditions in electric systems, like phasor measurement units or power quality analyzers, to name a few; specifically for bearing damage, elements like vibrometers, thermographic cameras, microphones, and electric current flow detectors are commonly used to detect and classify abnormal conditions. The effectiveness of the electric measurement devices for fault detection also depends on the algorithm used to process the signal. The works in [5,6] mention that 41% of the IM critical damage is caused by the lack of proper detection of the bearing fault. In this context, bearing fault detection and classification are indispensable.
Several methods have been explored for fault detection based on vibration signals [7,8,9], stray flux signals [10,11,12], and current signals [13,14]. The last one stands out, considering that it is a type of signal that contains information useful for several applications. Thus, it is frequently monitored, so no additional sensor would be required. Techniques based on motor current signal analysis (MCSA) have been proposed to detect and classify bearing damage. Some of them are presented in this section to identify the proposed methodology’s advantages.
One of the most used electrical signal processing techniques is the discrete Fourier transform (DFT), which provides accurate results for steady-state signals [15]. The problem is that the DFT needs to provide acceptable results under transient-state, i.e., when signal amplitude and/or phase are time-varying, which is not a real representation of an electrical system.
In addition to the study of signal processing techniques, detection and classification algorithms based on artificial intelligence or machine learning are popular nowadays [16,17]. Methods like support vector machines, complex decision trees, convolutional neural networks, and deep learning, as presented in [18,19,20,21,22], are widely studied and report results with up to 100% of accuracy. The problem with these methods is that they represent high computational resource consumption and previous training processes. Generally, they depend on databases or dictionaries to detect and classify bearing faults. In most cases, robust equipment is required to process the big data quantities.
For instance, in [18], a technique based on infrared thermography and machine learning is proposed in which the achieved accuracy in most cases is near 100%. In that methodology, the authors ensure that this technique prevents noise-related issues and provides excellent performance for bearing fault diagnosis. Still, detecting faults with noise introduced by an adjustable speed driver needs to be explored. Moreover, it uses methods like training, image processing, complex decision trees, and support vector machines, which are computationally demanding.
In [23], a model-based analysis and quantification of bearing faults in IM is presented based on integrating electrical and mechanical models. In that work, it is possible to detect bearing faults and their severity by estimating the air gap length variation. Furthermore, the authors mention that this methodology can classify and assess the bearing fault severity under any power rate, speed, and load conditions. Still, its real-time implementation represents a technical challenge based on the long processing time.
Recently, a combination of different techniques have been used in order to analyze vibration or current signals from electric machines, which is relevant for researchers because multi-modal analysis could obtain reliable information about the state of the electromechanical system and its dynamics. For instance, in [24], authors analyze the vibration response of the spindle-bearing-housing-belt system with rubbing by the analysis of a theoretical model and finite element method. They analyze the geometry and material parameters in the vibration response, and they also use the Lankarani–Nikravesh contact model to analyze the interaction between the shaft rotor and the front cover stator. Finally, the authors discuss the electromechanical effects of vibrations and the interaction between the elements on the electric machines.
Then, it is noticeable that a great amount of work has been proposed for fault detection relying on computationally complex signal processing algorithms or artificial intelligence-based classifiers. In addition, methods that are based on a classical Fourier-transform approach are constrained to the steady state analysis or require the preprocessing of the signal.
In this regard, this paper proposes an algorithmic implementation of the digital Taylor–Fourier transform (DTFT) for a signal-based methodology to detect and classify bearing faults, with the objective to provide a different alternative for bearing fault detection by using the filtering properties of the DTFT. One of the main advantages of this method is that the filter process only depends on a matrix product that was previously prepared offline, allowing it to be implemented in a real-time system for detection and classification. Other important attributes include its filtering properties, smooth estimates, harmonic rejection capabilities, and an implementation based on the dynamic phasor concept that allows for improved signal approximations from real electric systems. In addition, this methodology could represent a good option considering that, usually, artificial intelligence-based classifiers are more challenging to implement than statistical indicators, such as the ones selected in this work.

2. Fundamentals

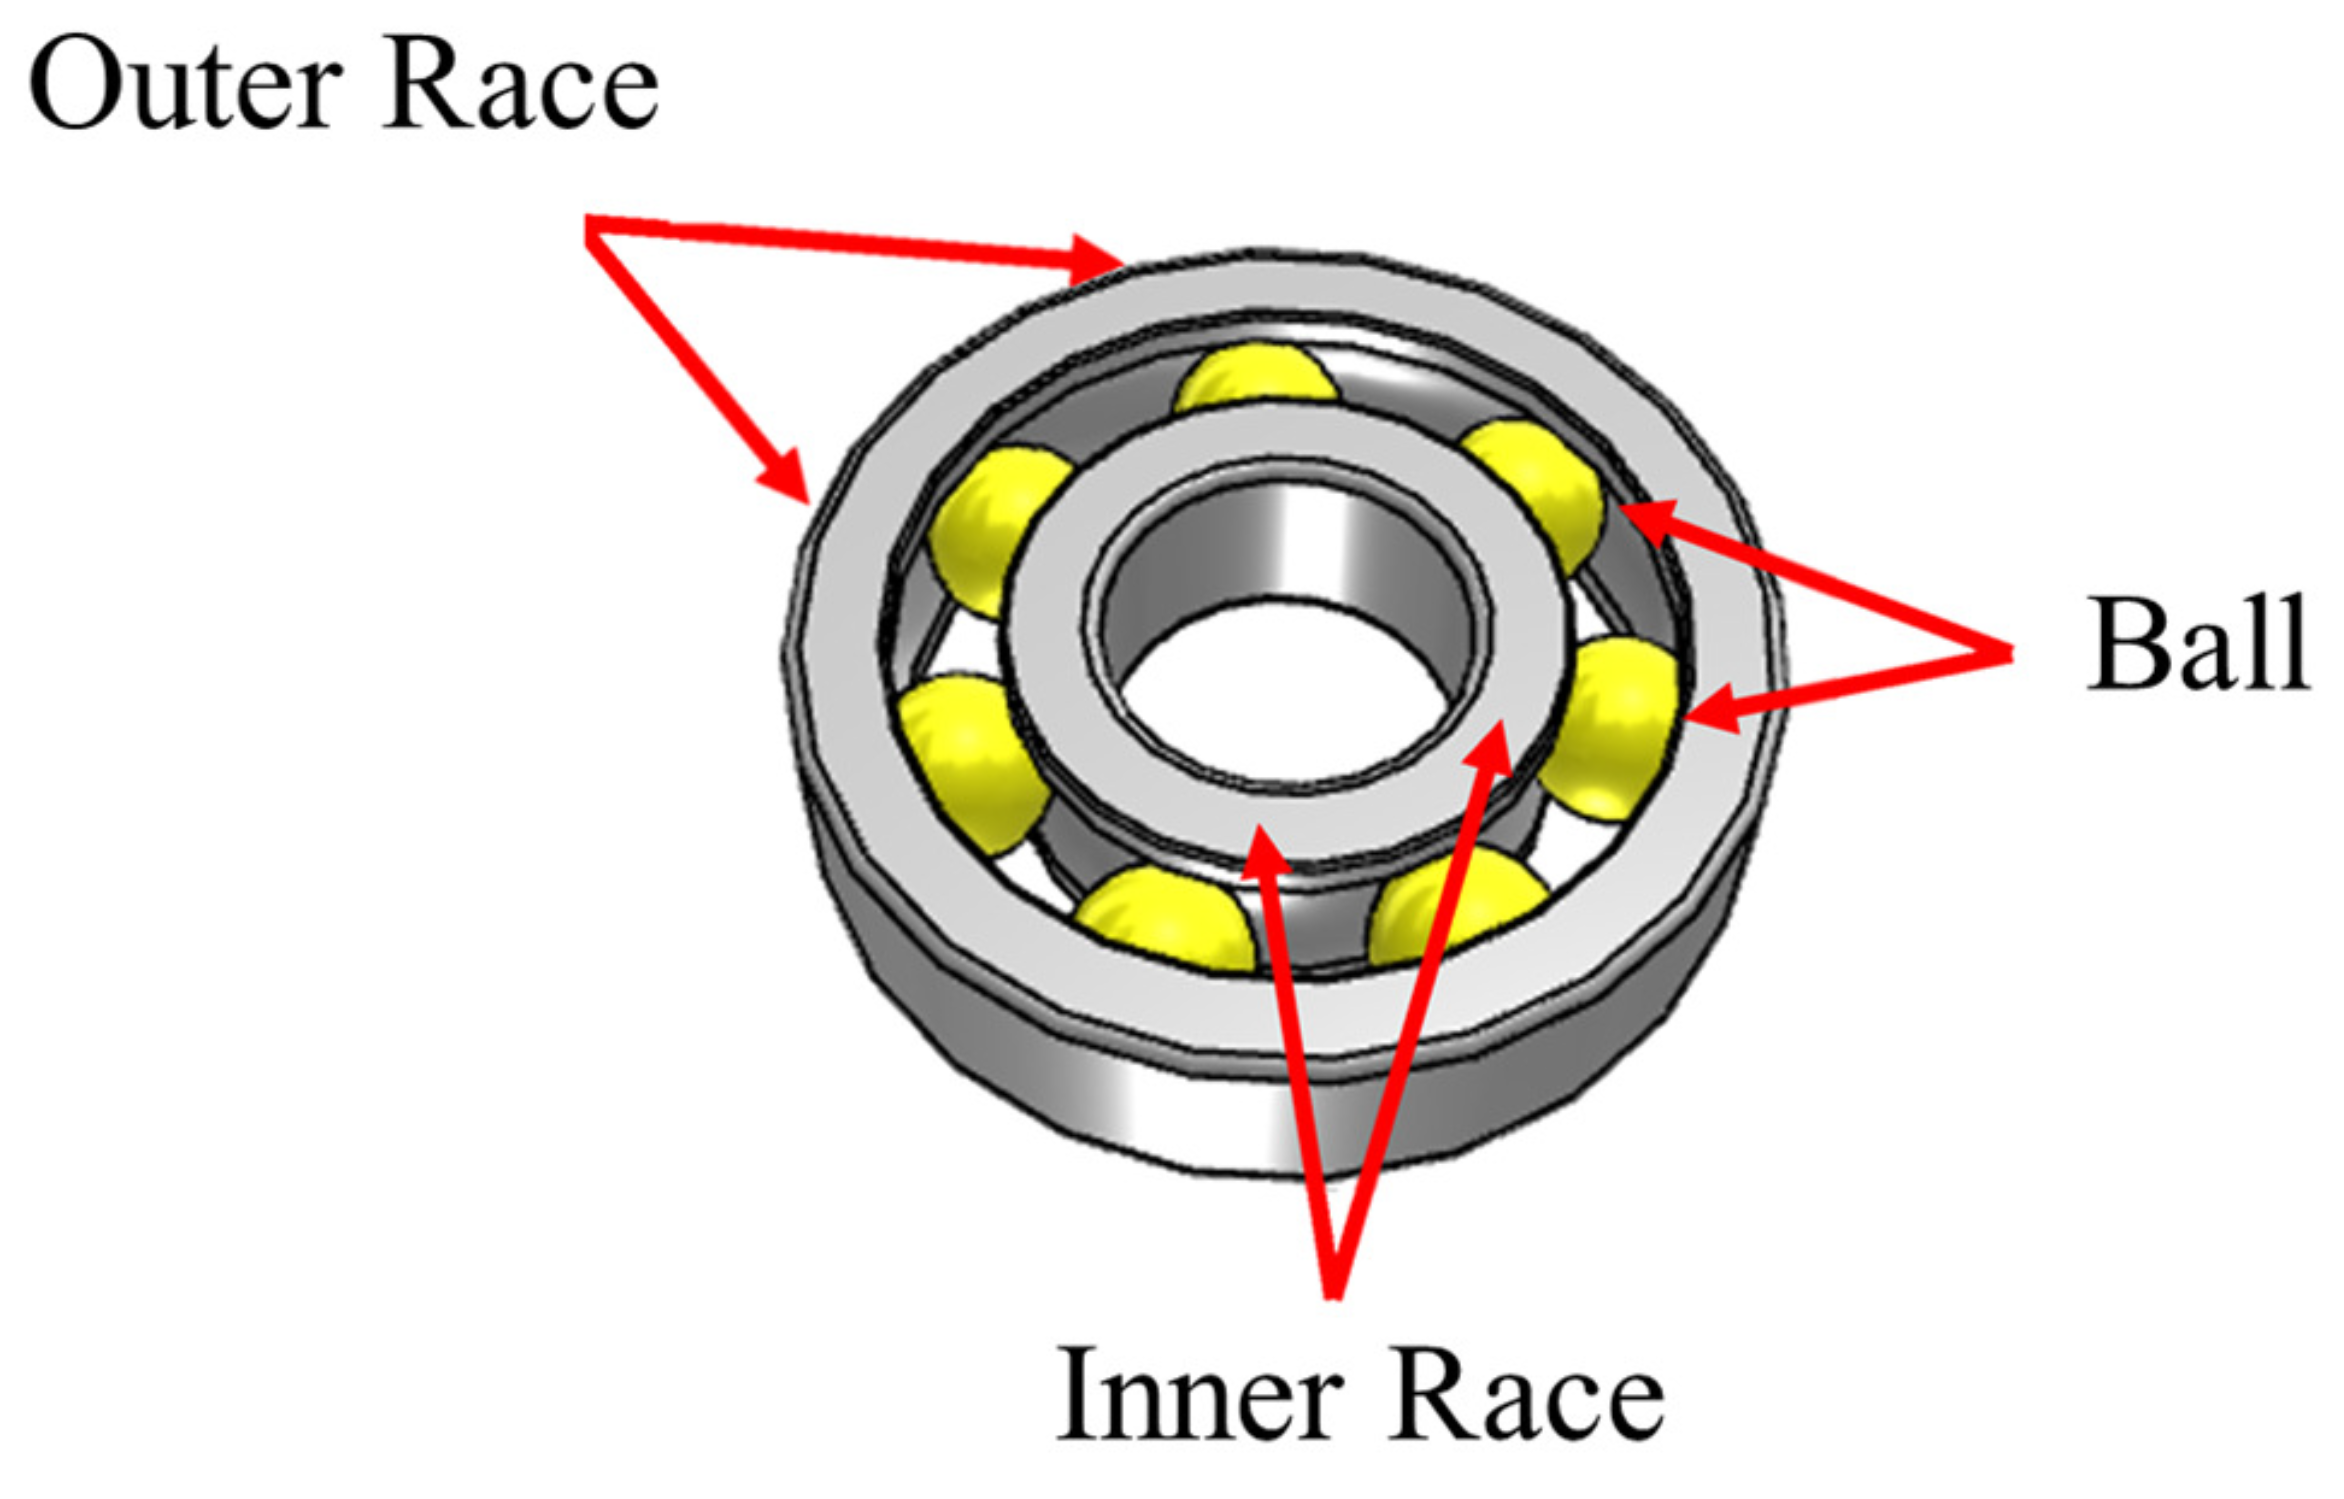
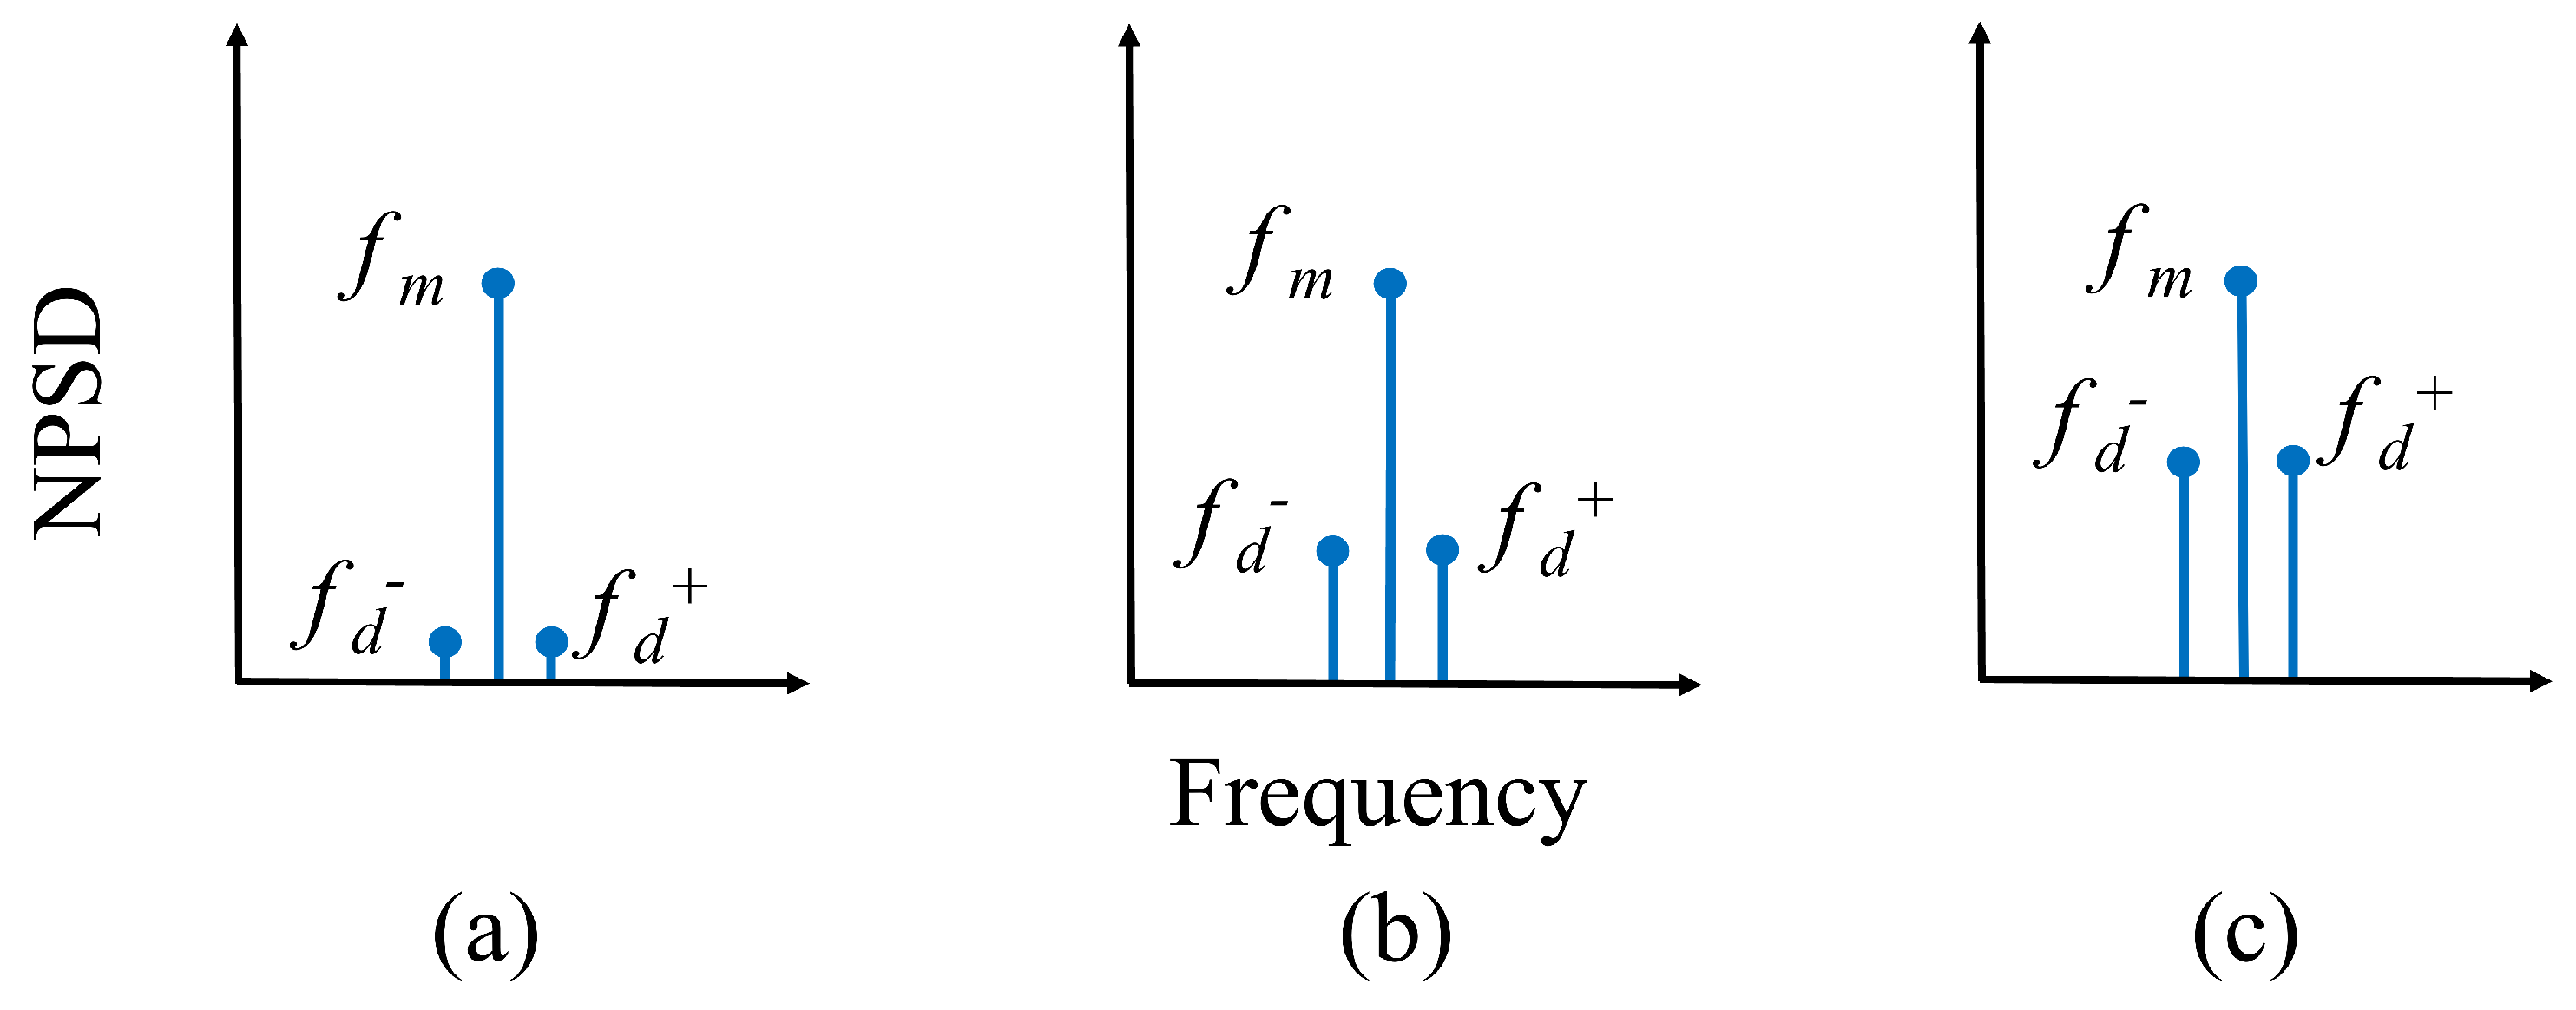
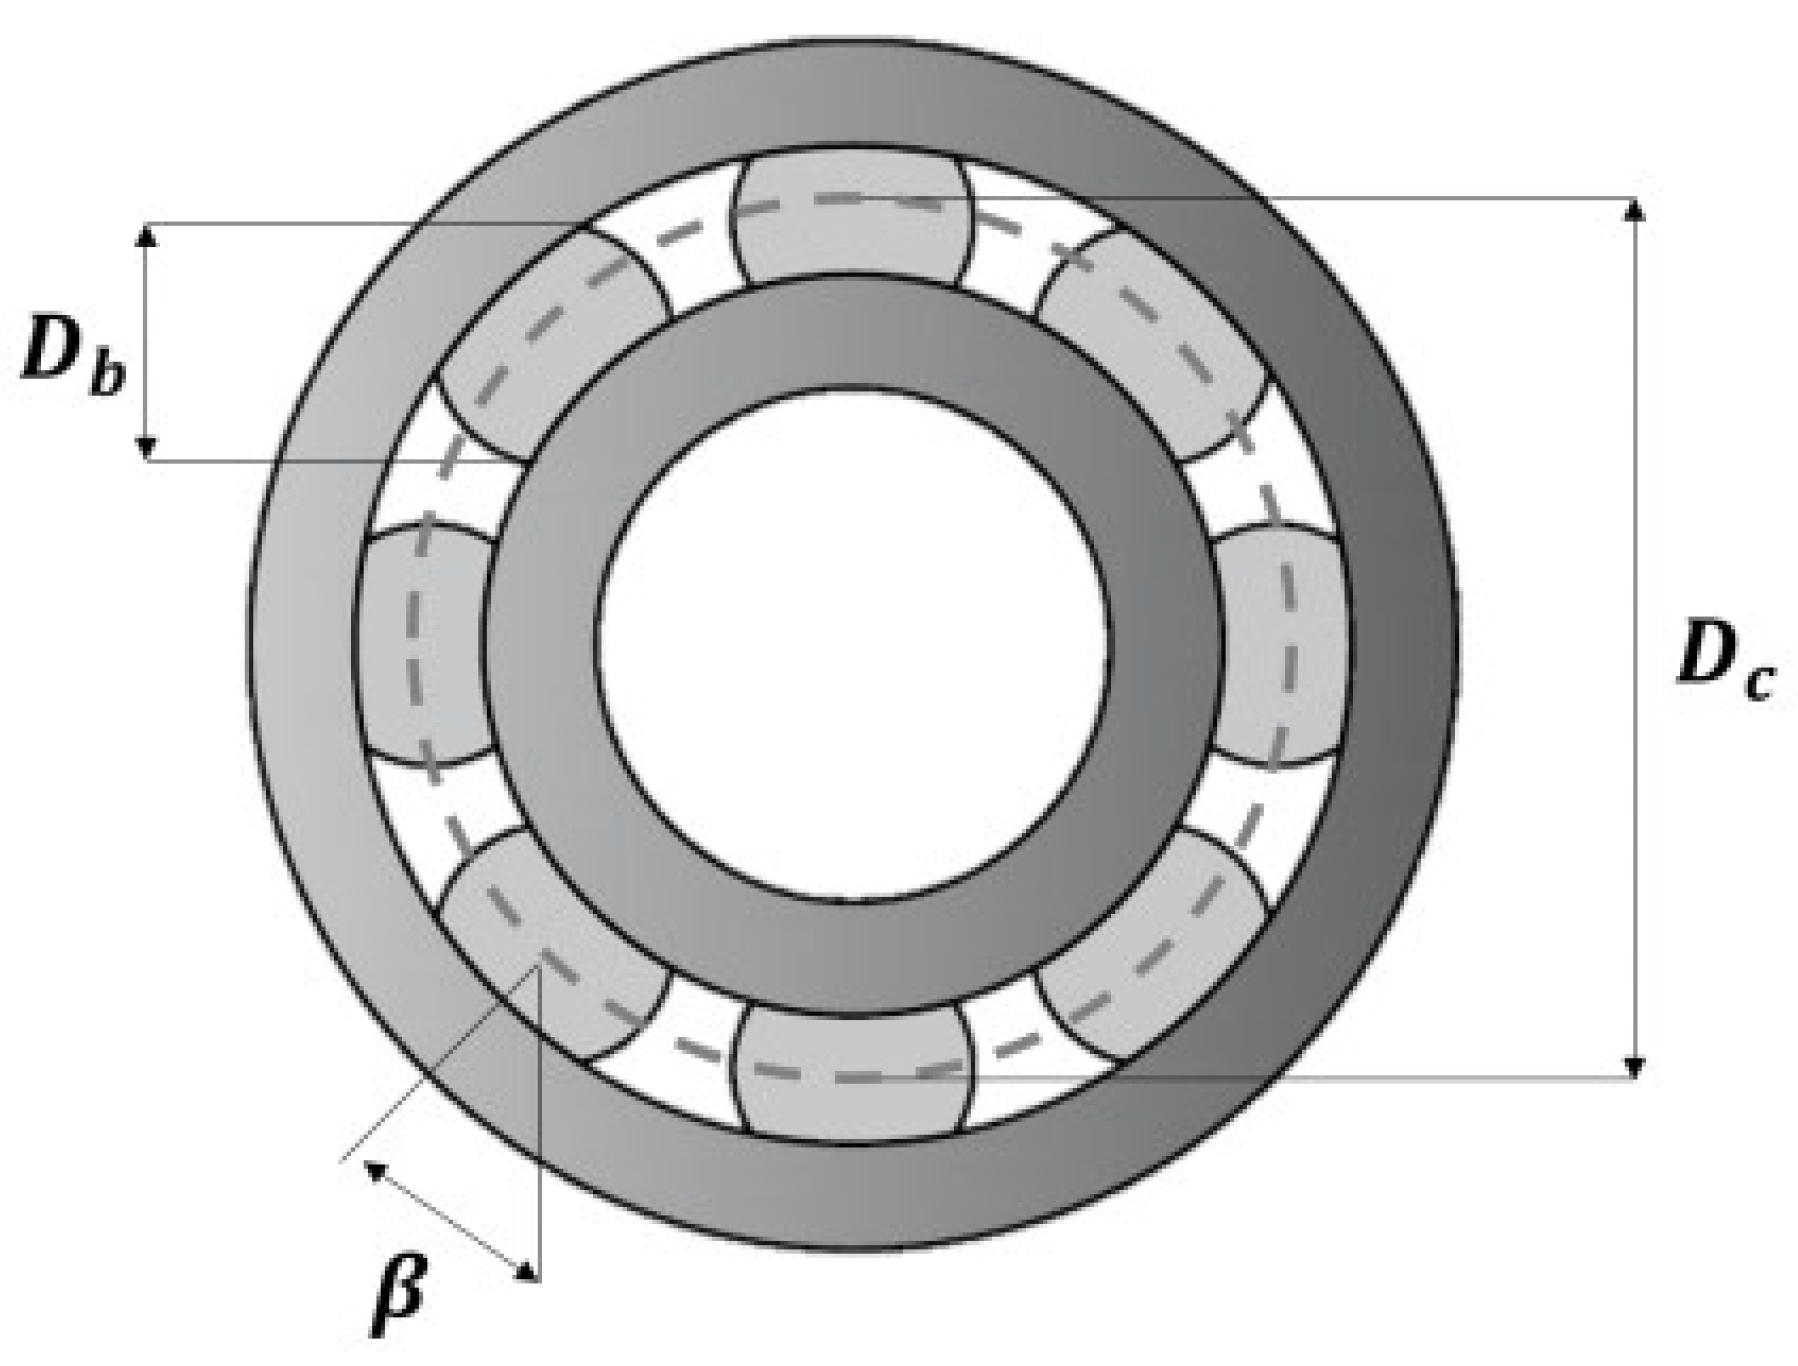
2.1. Bearing Damage Signature

Bearing damage may appear in any element that makes up the bearing, either its fixed or mobile parts. The aspects under study in this paper are shown in Figure 1, where rolling elements are highlighted in red, and the guide rings are respectively named as outer race and inner race.
Depending on the damage type, defects cause the appearance of characteristic pulses on the frequency spectrum. These spurious frequencies are located at the sidebands of the primary frequency. Their location depends on the applied load, nature and geometry of the bearing, while its amplitude depends on the severity of the damage [6,25,26]. Figure 2 shows the change of the spurious frequencies regarding the severity of the damage, where f m is the fundamental system frequency, and f d and f d + are the characteristic spurious frequencies. Figure 2a displays a motor damage behavior in the initial stages, Figure 2b exhibits a motor damage behavior in the intermediate stages, and Figure 2c presents a motor damage behavior of a severe failure. As can be observed, the severity of the damage provokes an increase in the spurious components. Likewise, a high mechanical load can provoke the displacing of the spurious components moving away from the fundamental component.

2.1.1. Localized Defects

A localized defect is a punctual imperfection in a specific part of the bearing. This kind of defect commonly causes characteristic vibrations on the IM, depending on the bearing type. The spurious frequencies in the vibration spectrum for inner race damage, outer race damage, and bearing ball damage can be identified respectively by the Equations (1)–(3) [27].
f o = N b 2 f r [ 1 D b D c c o s ( β ) ]
f i = N b 2 f r [ 1 + D b D c c o s ( β ) ]
f b = D b D c f r [ 1 D b 2 D c 2 c o s ( β ) 2 ]
where f o symbolizes the spurious frequency of the outer race damage, f i stands for the inner race’s damage frequency, f b represents the bearing ball damage frequency, f r defines the mechanical rotor frequency, N b is the number of the balls, β is the angle between the ball and the defect, D b is the diameter of the ball and D c is the pass diameter. Some of these geometric parameters ( β , D b and D c ) are illustrated in Figure 3. As a consequence of these vibrations, air gap variations are induced, causing variations in the stator current. Then, spurious components in the current spectrum are given by
f o I = f s ± k f v
where f o I represents the characteristic frequency in the current spectrum, f s stands for the source frequency, k symbolizes the harmonic, and f v is the vibration characteristic frequency.

2.1.2. Nonlocalized Defects

The nonlocalized defects are scattered in the bearing, meaning that the abnormal conditions are in many places and cannot be considered punctual. Thus, there are no feature vibrations, and there are no punctual spurious frequencies. An example is oxide damage, a condition under study in this paper. To analyze the current signals of the bearing under these defects, the DTFT is employed; its theoretical background is given next.

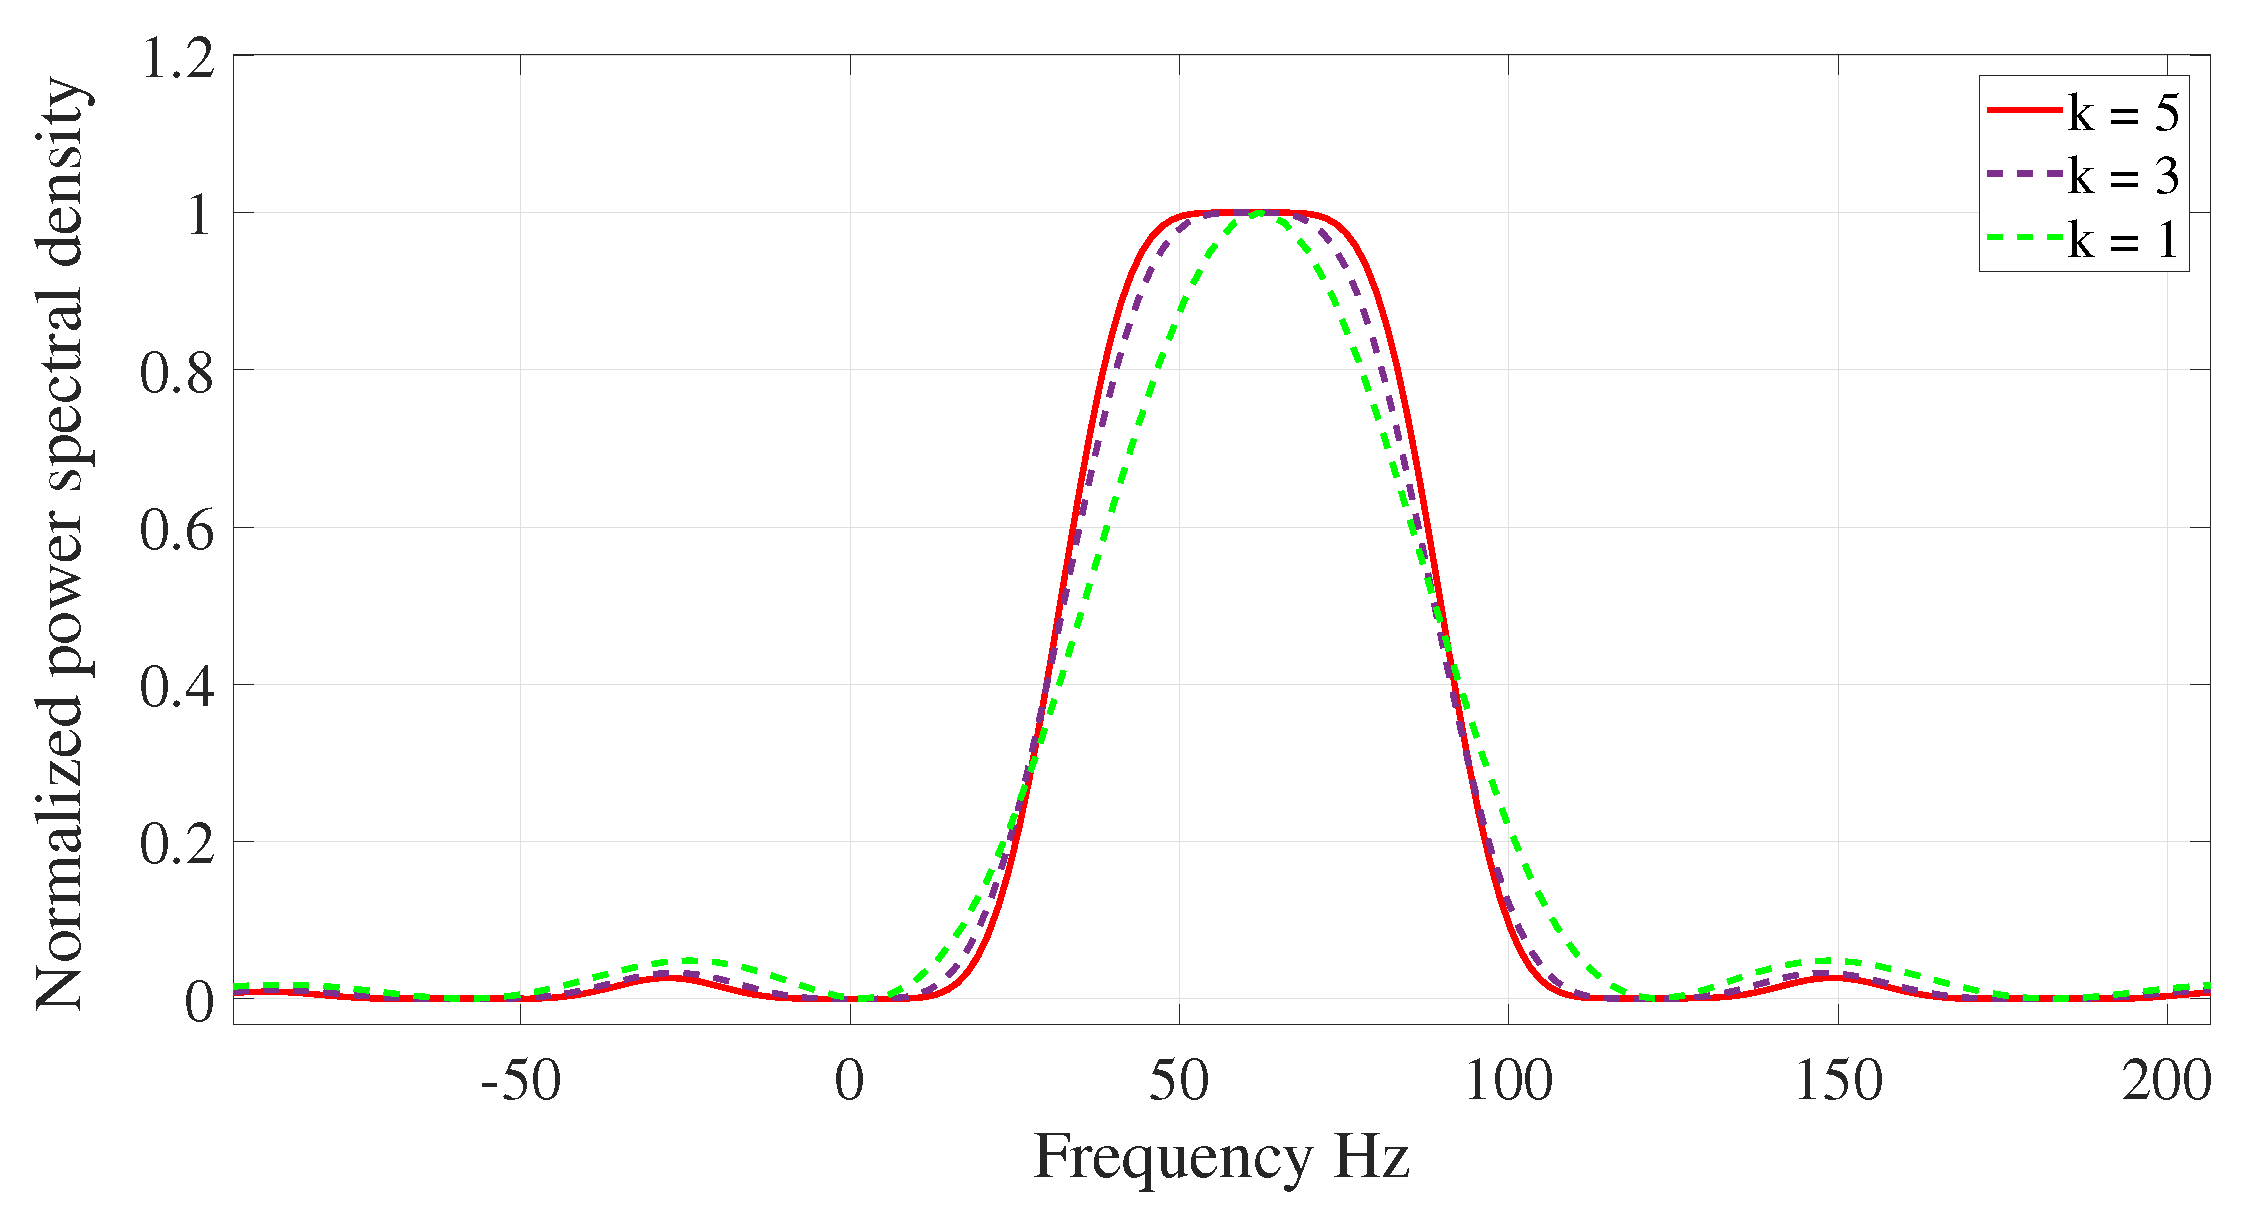
2.2. Digital Taylor–Fourier Transform
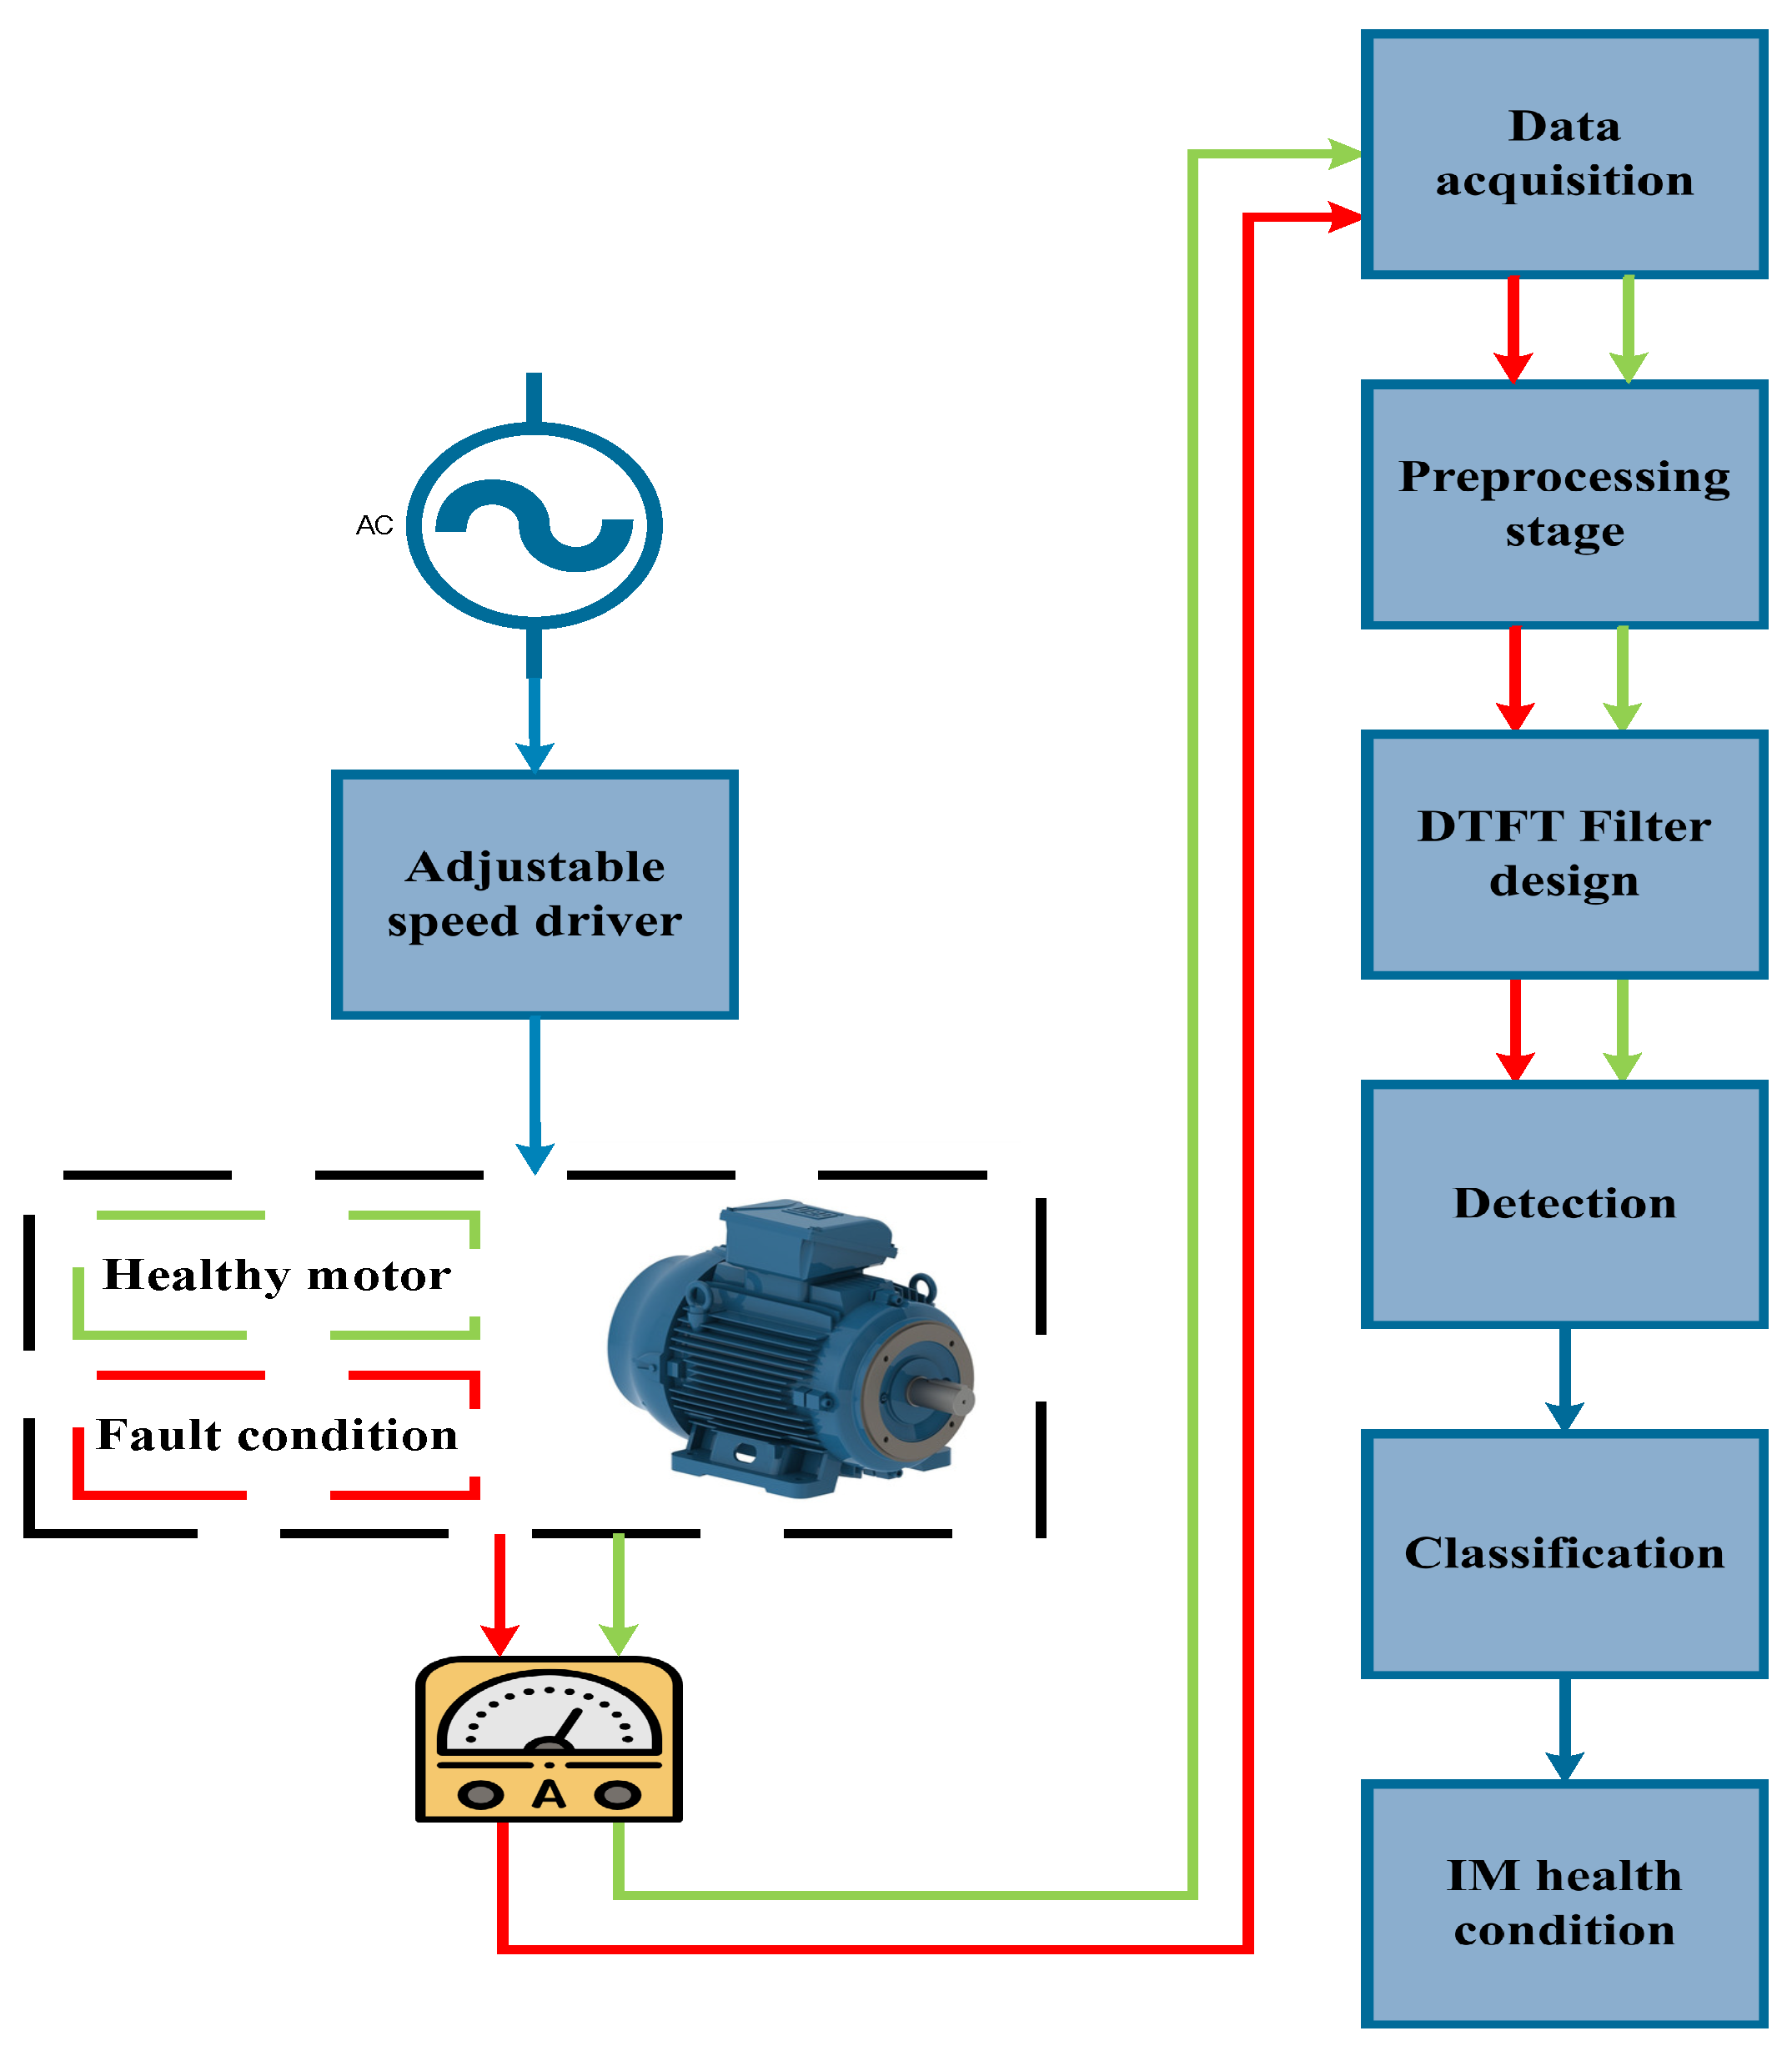
To estimate the amplitude of fault components of an induction motor, current signals are filtered using the digital Taylor–Fourier transform. The DTFT is defined as an expansion of the traditional Fourier model through the Taylor polynomial based on the dynamic phasor concept. Starting on the classical continuous-time signal model expressed as
s ( t ) = R e { a ( t ) e φ ( t ) e j 2 π f 1 t }
where p ( t ) = a ( t ) e φ ( t ) represents the dynamic phasor, a ( t ) is the amplitude and φ ( t ) is the phase, both are time varying, and f 1 represents the primary signal frequency [28].
The dynamic phasor p ( t ) can be better approximated by a closed Taylor polynomial centered at t 0 and truncated at K, which is represented as
p K ( t ) = p ( t 0 ) + p ˙ ( t 0 ) ( t t 0 ) + + p K ( t 0 ) ( t t 0 ) K K !
where t 0 = T 2 t t 0 + T 2 and T is the signal period.
Then, the traditional Fourier model in dynamic phasor terms can be written as follows,
X [ k ] = n = 0 N 1 p ( t ) e j 2 π f 1 t e j 2 π N k n
where N is the number of samples, n is the sample number and k = 0 , 1 , , N 1 is the harmonic order.
Finally, the Taylor–Fourier subspace is a linear combination represented by
s ^ C N = B CN ξ ^ C N
where the Taylor–Fourier matrix B CN comprises the results of modulating the Taylor terms in (6) by the Fourier coefficients in (7), s ^ C N is the estimated signal and ξ ^ C N represents the estimated Taylor–Fourier coefficients.
B CN = 1 N I T 1 T 1 K I T 2 T 2 K I T C T C K W N 0 0 0 W N 0 0 0 W N
where T i K is composed of N × N diagonal submatrices conformed by the time sequence t n = ( K + 1 ) T s ( n s / 2 ) to ( K + 1 ) T s ( n s / 2 ) with n s , being each sample of Taylor’s interpolating polynomial at each sampling frequency F s , N is the number of samples per cycle, W N represents the Fourier matrix formed by harmonic phase factors ω N h = e j 2 π h / N at each vector h = 0 , , N 1 , and I is the identity matrix.
Once the Taylor–Fourier subspace is established, the filter algorithm is obtained through the least square solution [29], resulting in the analysis equation as follows,
ξ ^ = B s ,
where ξ ^ represents the estimated Taylor–Fourier coefficients for each multiple of the base frequency f 1 , that is, the harmonic frequencies. B is the pseudoinverse of B and s stands for the measured signal.
Considering that the Taylor–Fourier coefficients converge like a sinc function, their spectra will converge like an ideal filter. Their algorithmic implementation lets users easily center and modulate the filter’s bandwidth, which is especially useful for analyzing spurious frequencies introduced by a damaged bearing.
Figure 4 shows the filter response for different numbers of Taylor polynomials, i.e., K values. As this parameter increases, a flatter response at the central frequency is given, as well as a better harmonic rejection in the sidebands of the filter.
This investigation uses the fifth-order bandpass filter associated with the frequency response of the estimated Taylor–Fourier filters ξ ^ to extract the amplitude per phase of current signals for each damage condition. Notice that the flatter response of the filters allows capturing the energy of spurious components in a better way. This is due to its similarity to an ideal filter, by rejecting the other spectral components and reducing the sideband lobes.
Figure 5 shows both the Taylor–Fourier of third order and Fourier filters behavior. In comparison with the Fourier filter, the Taylor–Fourier filter shows some advantages, like a flatter response of the filter and the sideband lobes reduction that provokes better harmonic rejection properties [30].
Finally, the amplitude a ^ of the signal can be estimated with the following expression:
a ^ ( t 0 ) = 2 | ξ ^ |
It is also worth noticing that in other works where the Taylor–Fourier theory is applied, such as the one presented in [31], the computational complexity for the DTFT is declared as ( C N ) 2 products, whereas an empirical mode decomposition algorithm requires 41 S N l o g 2 ( N ) , where S is the number of sifting operations and N is the length of the signal. For a wavelet packet decomposition approach, the computational complexity is 2 ( L + 1 ) N l o g 2 ( N ) . Therefore, the DTFT is less complex, especially for implementation purposes.

3. Methodology

The proposed methodology is presented in Figure 6, and it is entirely implemented in Matlab 2018b, Mathworks, Natick, MA, USA. This allows for the analysis of signals to detect and classify faults associated with three types of damage. Signal acquisition was performed with one damaged bearing at a time.
In the data acquisition block, the stator current measurements, for four IM tests are prepared for processing: synthetic bearing damage (bearing ball, outer race, and corrosion), and healthy motor conditions. Notice that the length of the acquired signal depends on the size of the bandwidth of the filter and the size of the sliding window. The minimum number of samples for estimating a valid result is given by the number of samples for the sliding window: at the same time, the size of the sliding window L is determined by the number of signal cycles C required to perform the analysis; therefore, L = C N where C = K + 1 and N is the number of samples per cycle of the signal. In this regard, the system requires at least L samples of the signal to have valid results for amplitude estimates. A segment of the signals under study is shown in Figure 7. Notice that the identification of a fault by means of a visual inspection is quite difficult. That is the reason why further signal processing is required in order to detect a fault in current signals. Its analysis is only carried out in one phase per test at a time since the bearing faults affect the three phases in the same proportion [32].
In the preprocessing stage, a frequency analysis of the current measurements in Figure 7 is conveyed at one phase of the induction machine. DTFT is very suitable for oscillatory signals in a transient state, and given that in this work, the analysis is performed based on real signals, it is expected that the signals have certain amplitude variations. The amplitude estimation would have less error than when using only the Fourier transform, for example. In addition, in this particular case, the fault introduces components of low amplitude in the current signal; therefore, the DTFT allows the amplitude estimation with an excellent resolution thanks to its filtering characteristics.
This analysis is performed for each fault and the healthy condition in order to identify the spurious components, design the filter bandwidth, and locate its position. The bearing damage signature can be identified relying on Equations (1)–(3) together with a visual inspection of the spectrum.
Since the filter is designed considering the bandwidth and the location of the spurious components, the following parameters are established according to the fundamentals in Section 2.2. The central frequency f 1 is selected in the DTFT filter design block, and the bandwidth is modulated by using the number of samples per cycle N defined by F s and the value of K.
The K value is selected based on the precision-computational cost ratio and considering the filter response around the spurious frequency. The selection of K is completely based on the signal characteristics and the type of implementation where it is required. The theory states that the estimates have less and less error as K increases; however, the selection cannot be arbitrary as K is considered when constructing the sliding window, and at the same time, the size of the window L should not surpass the length of the signal [33]. In addition, as K increases, more coefficients are calculated, restricting also the memory that can be stored when working in the implementation of the system. Hence, based on the waveforms under study, the selected value for this work is K = 5 .
Then, once the number of Taylor polynomials is defined, the Taylor–Fourier coefficients can be calculated. Current signals are individually filtered by applying a windowing process, where each window comprises K + 1 cycles, i.e., six cycles for the signals used in this work. The amplitude estimation for each filtered signal is computed as stated in (11), for detection and classification purposes. At this point, the feature extraction is accomplished by the current signals filtering; theoretically, amplitudes of filtered signals should be different for each motor condition (healthy and faulted).
In the detection block, a vector of estimated amplitudes is created, containing the maximum amplitudes of the filtered signals for each test of each condition. In this case, 100 tests for each fault condition are processed, and then 100 maximum amplitude values are stored in each fault vector. Based on this information, a statistical analysis is performed, where the median and standard deviation are calculated to obtain a boxplot. The median is used as the main discriminant factor in the performance of the selection process. It is considered a good detection if the healthy condition, in the upper adjacent, and the fault condition, in the lower adjacent, are not overlapped, and the distance between them is at least three standard deviations according to the Chebyshev inequality, as shown in Figure 8 [34].
Once the detection is achieved for all the frequencies at the different fault conditions (bearing ball damage, outer-race damage, and corrosion damage) for loaded and unloaded motors, in the classification block, the amplitudes are compared to select the type of fault.
A threshold value is selected from the boxplot graphs based on the median value of the healthy distribution plus three standard deviations more. A different threshold is selected for each type of fault. Then, each signal of the data set is processed, and the amplitude is estimated and compared by means of an i f e l s e sentence. If the amplitude lies within certain threshold values, the signal corresponds to a certain type of fault or to a healthy motor, as is shown in Figure 9. Given that the data set is labeled during the characterization process, i.e., the health of the motor is previously known, the classification percentages are assessed based on the ratio between the number of signals classified in a certain class versus the actual class to which the signal belongs.
Finally, in the last block, the classification information is processed to obtain an accuracy percentage to quantify the proposed method’s accuracy. In the next section, experimental results are presented.

4. Results

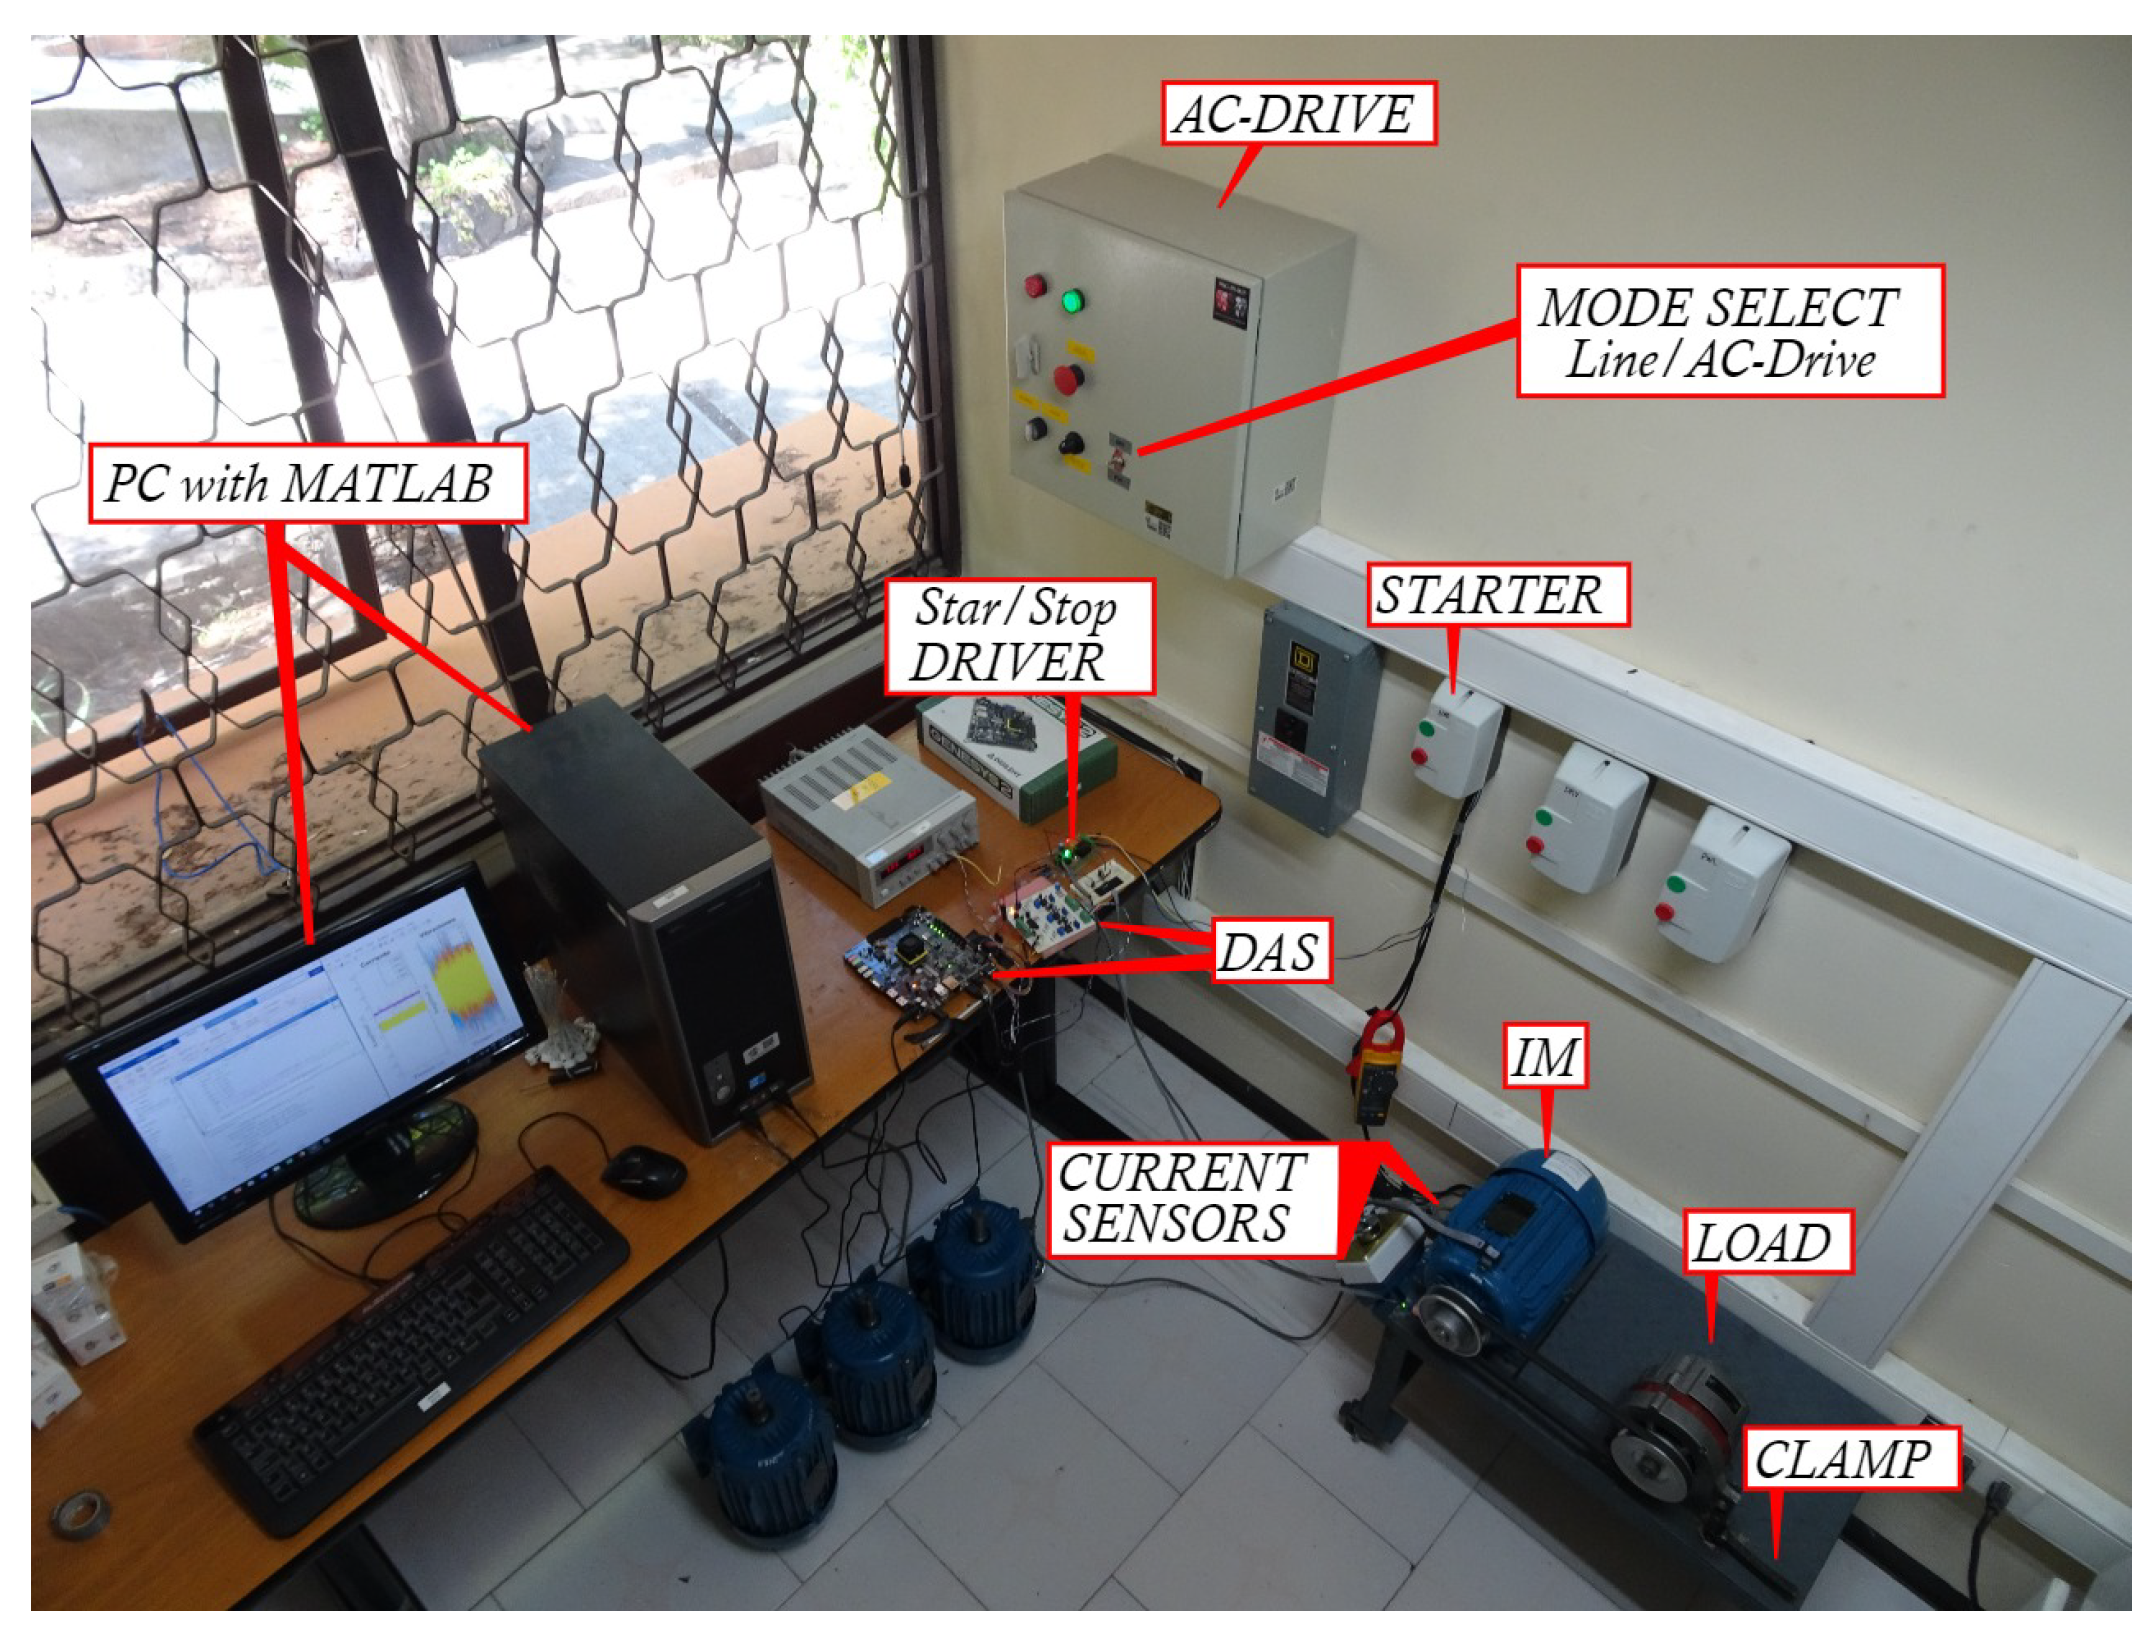
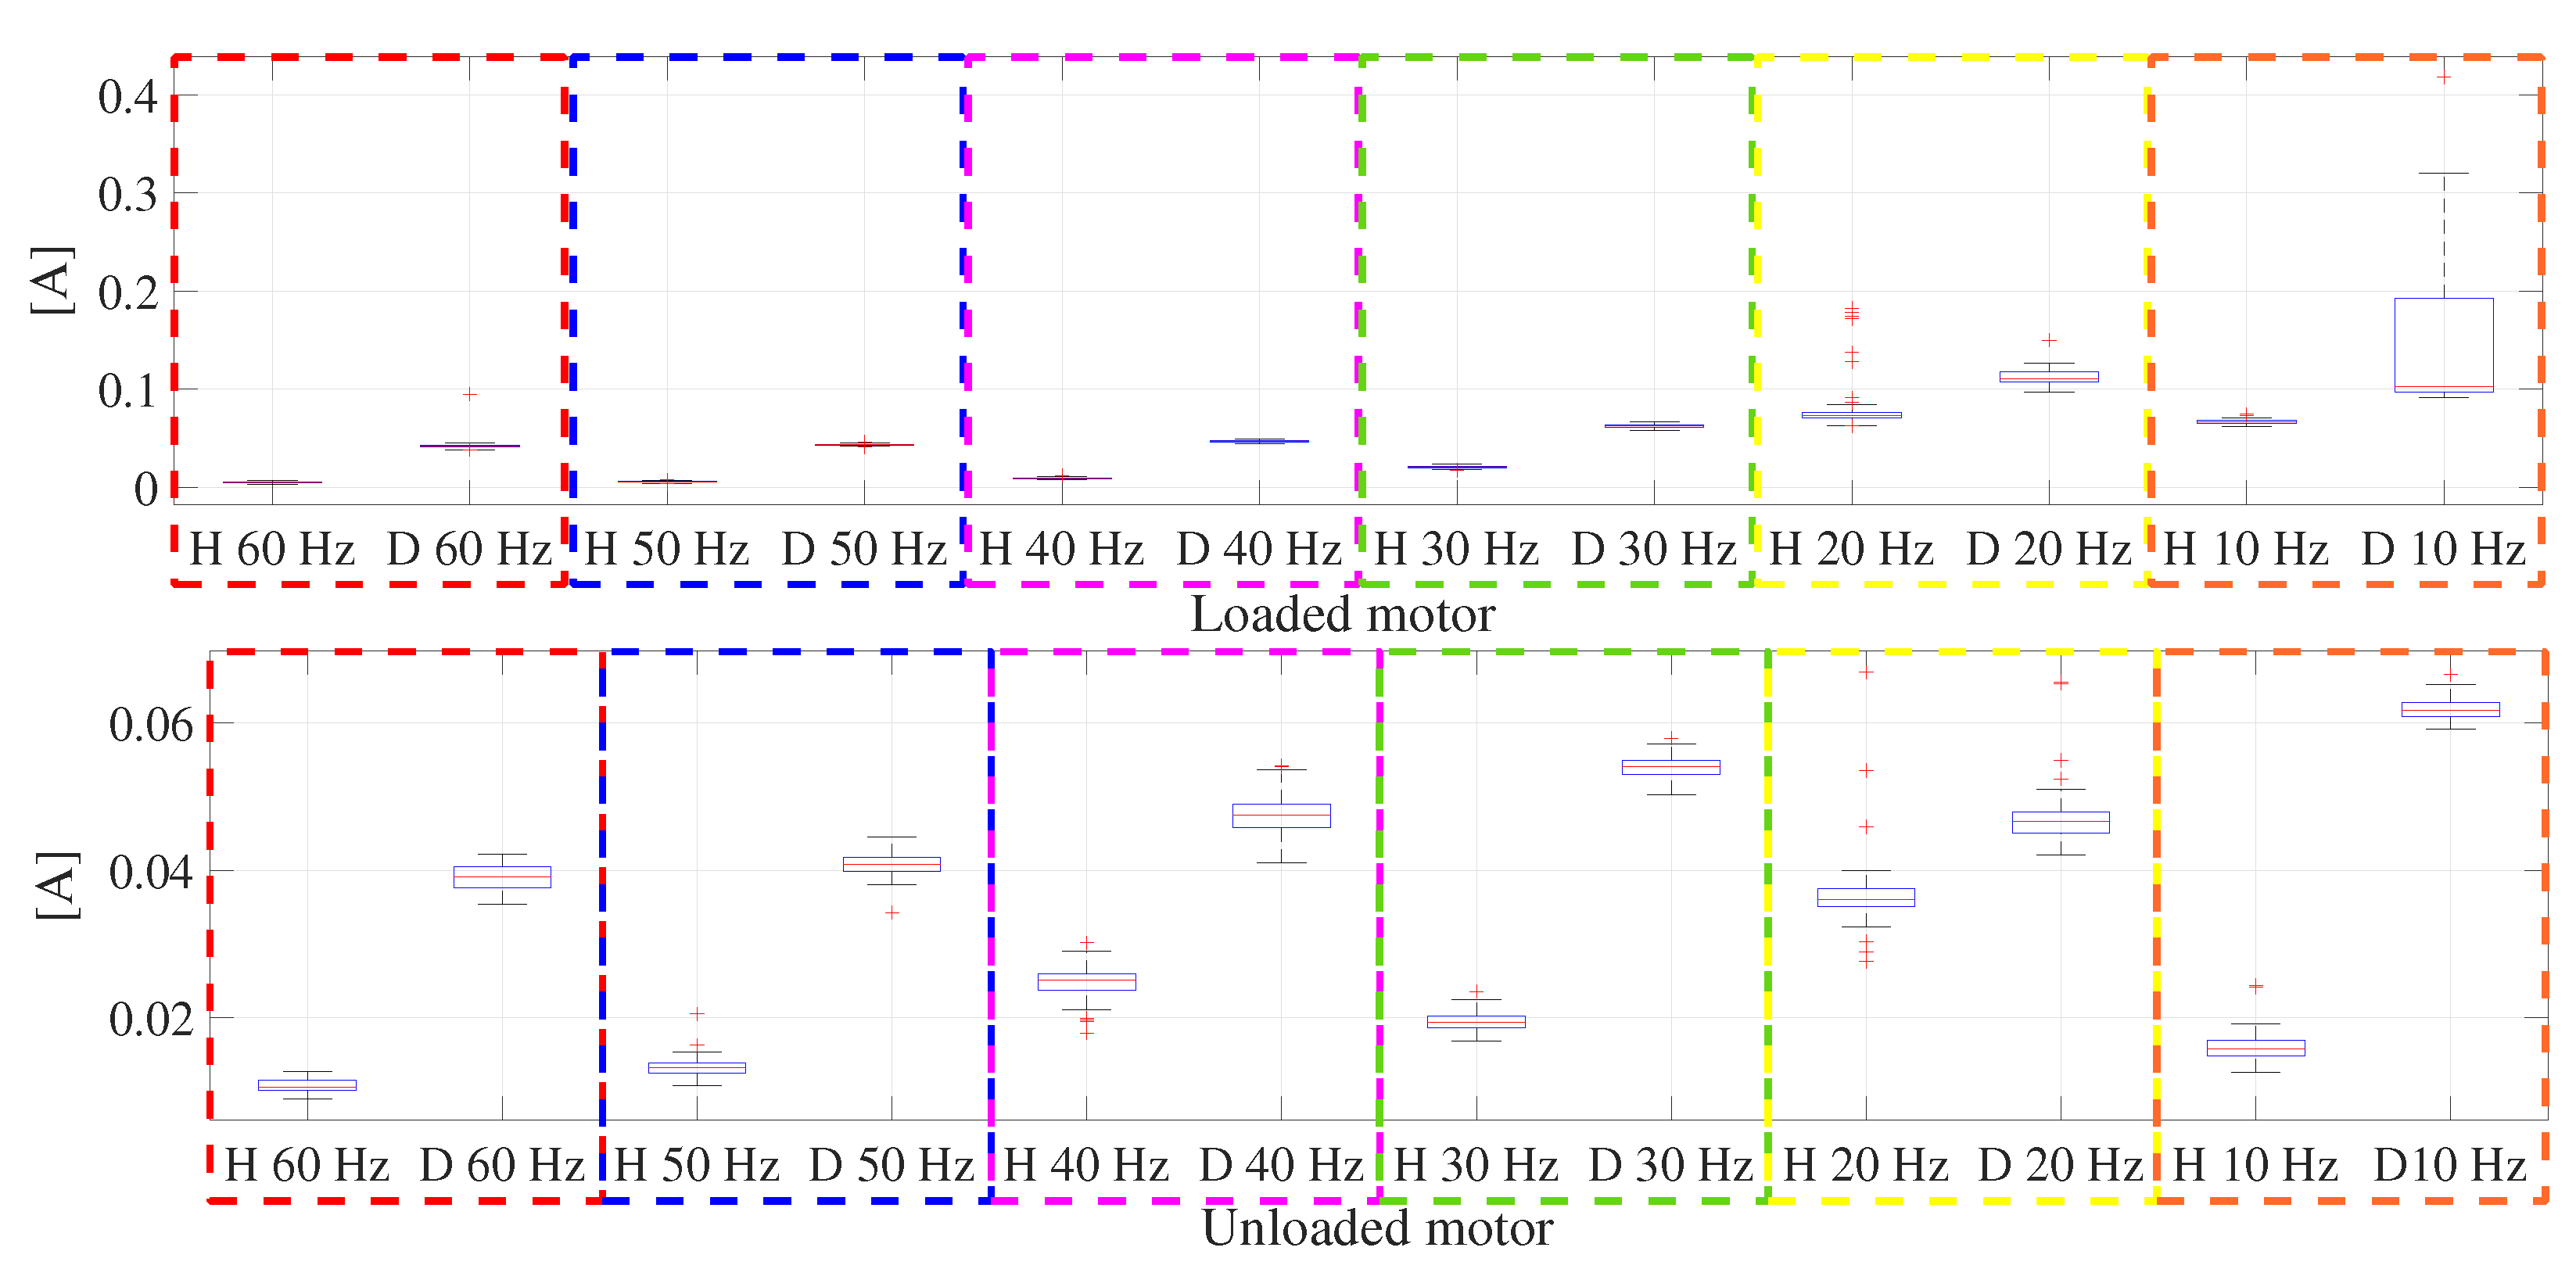
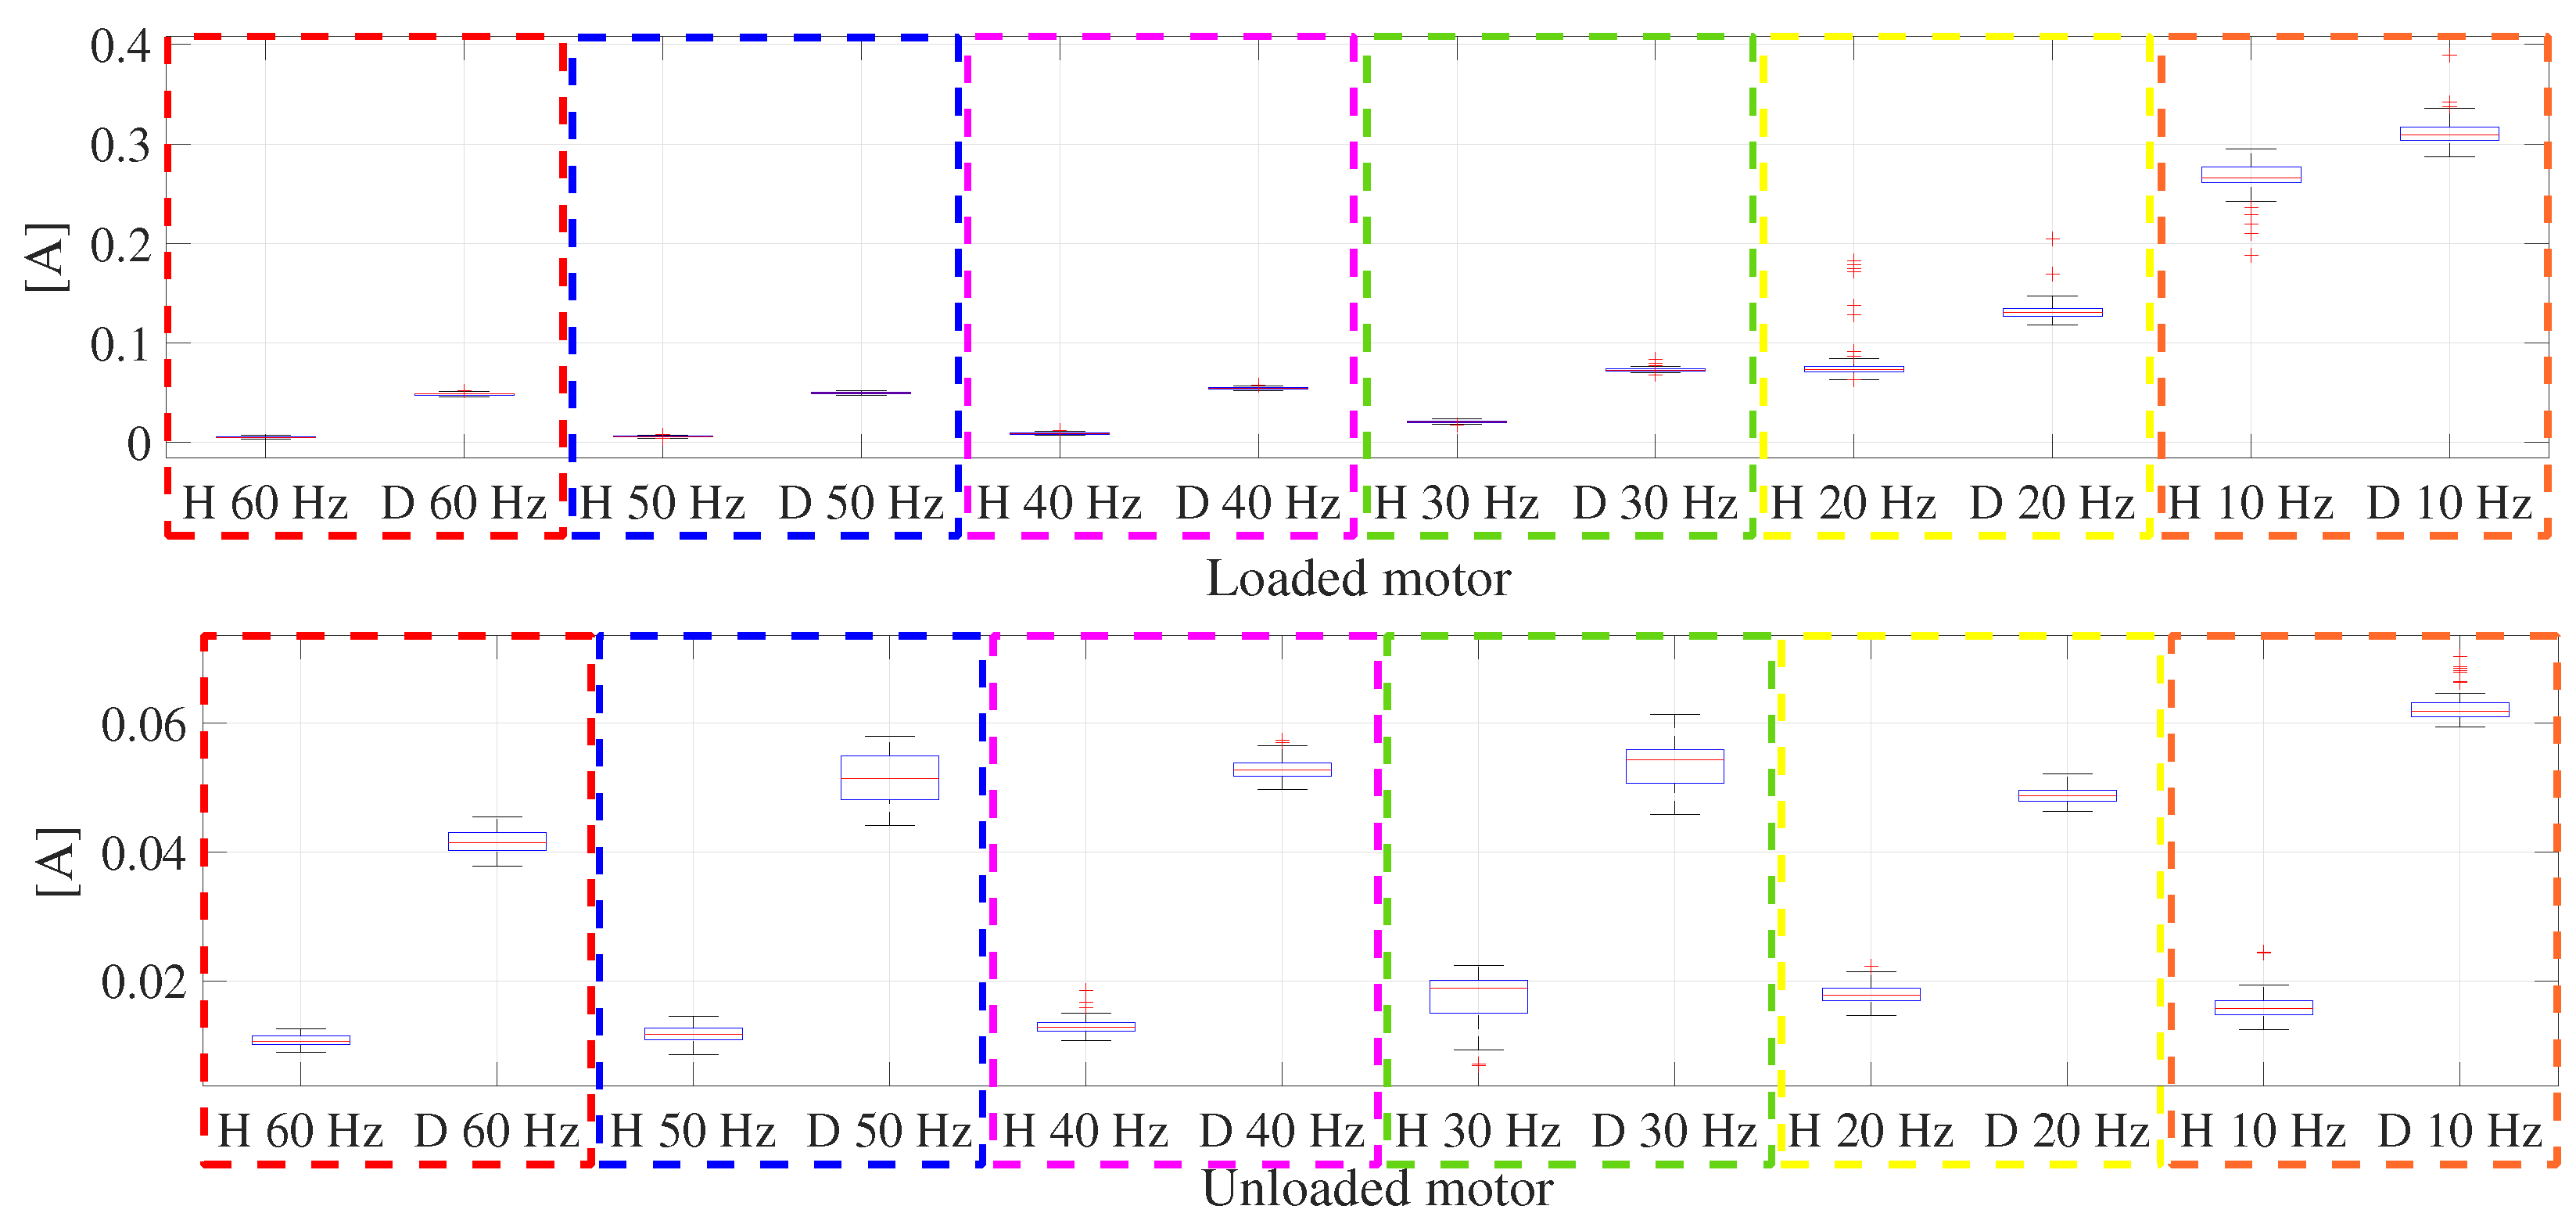
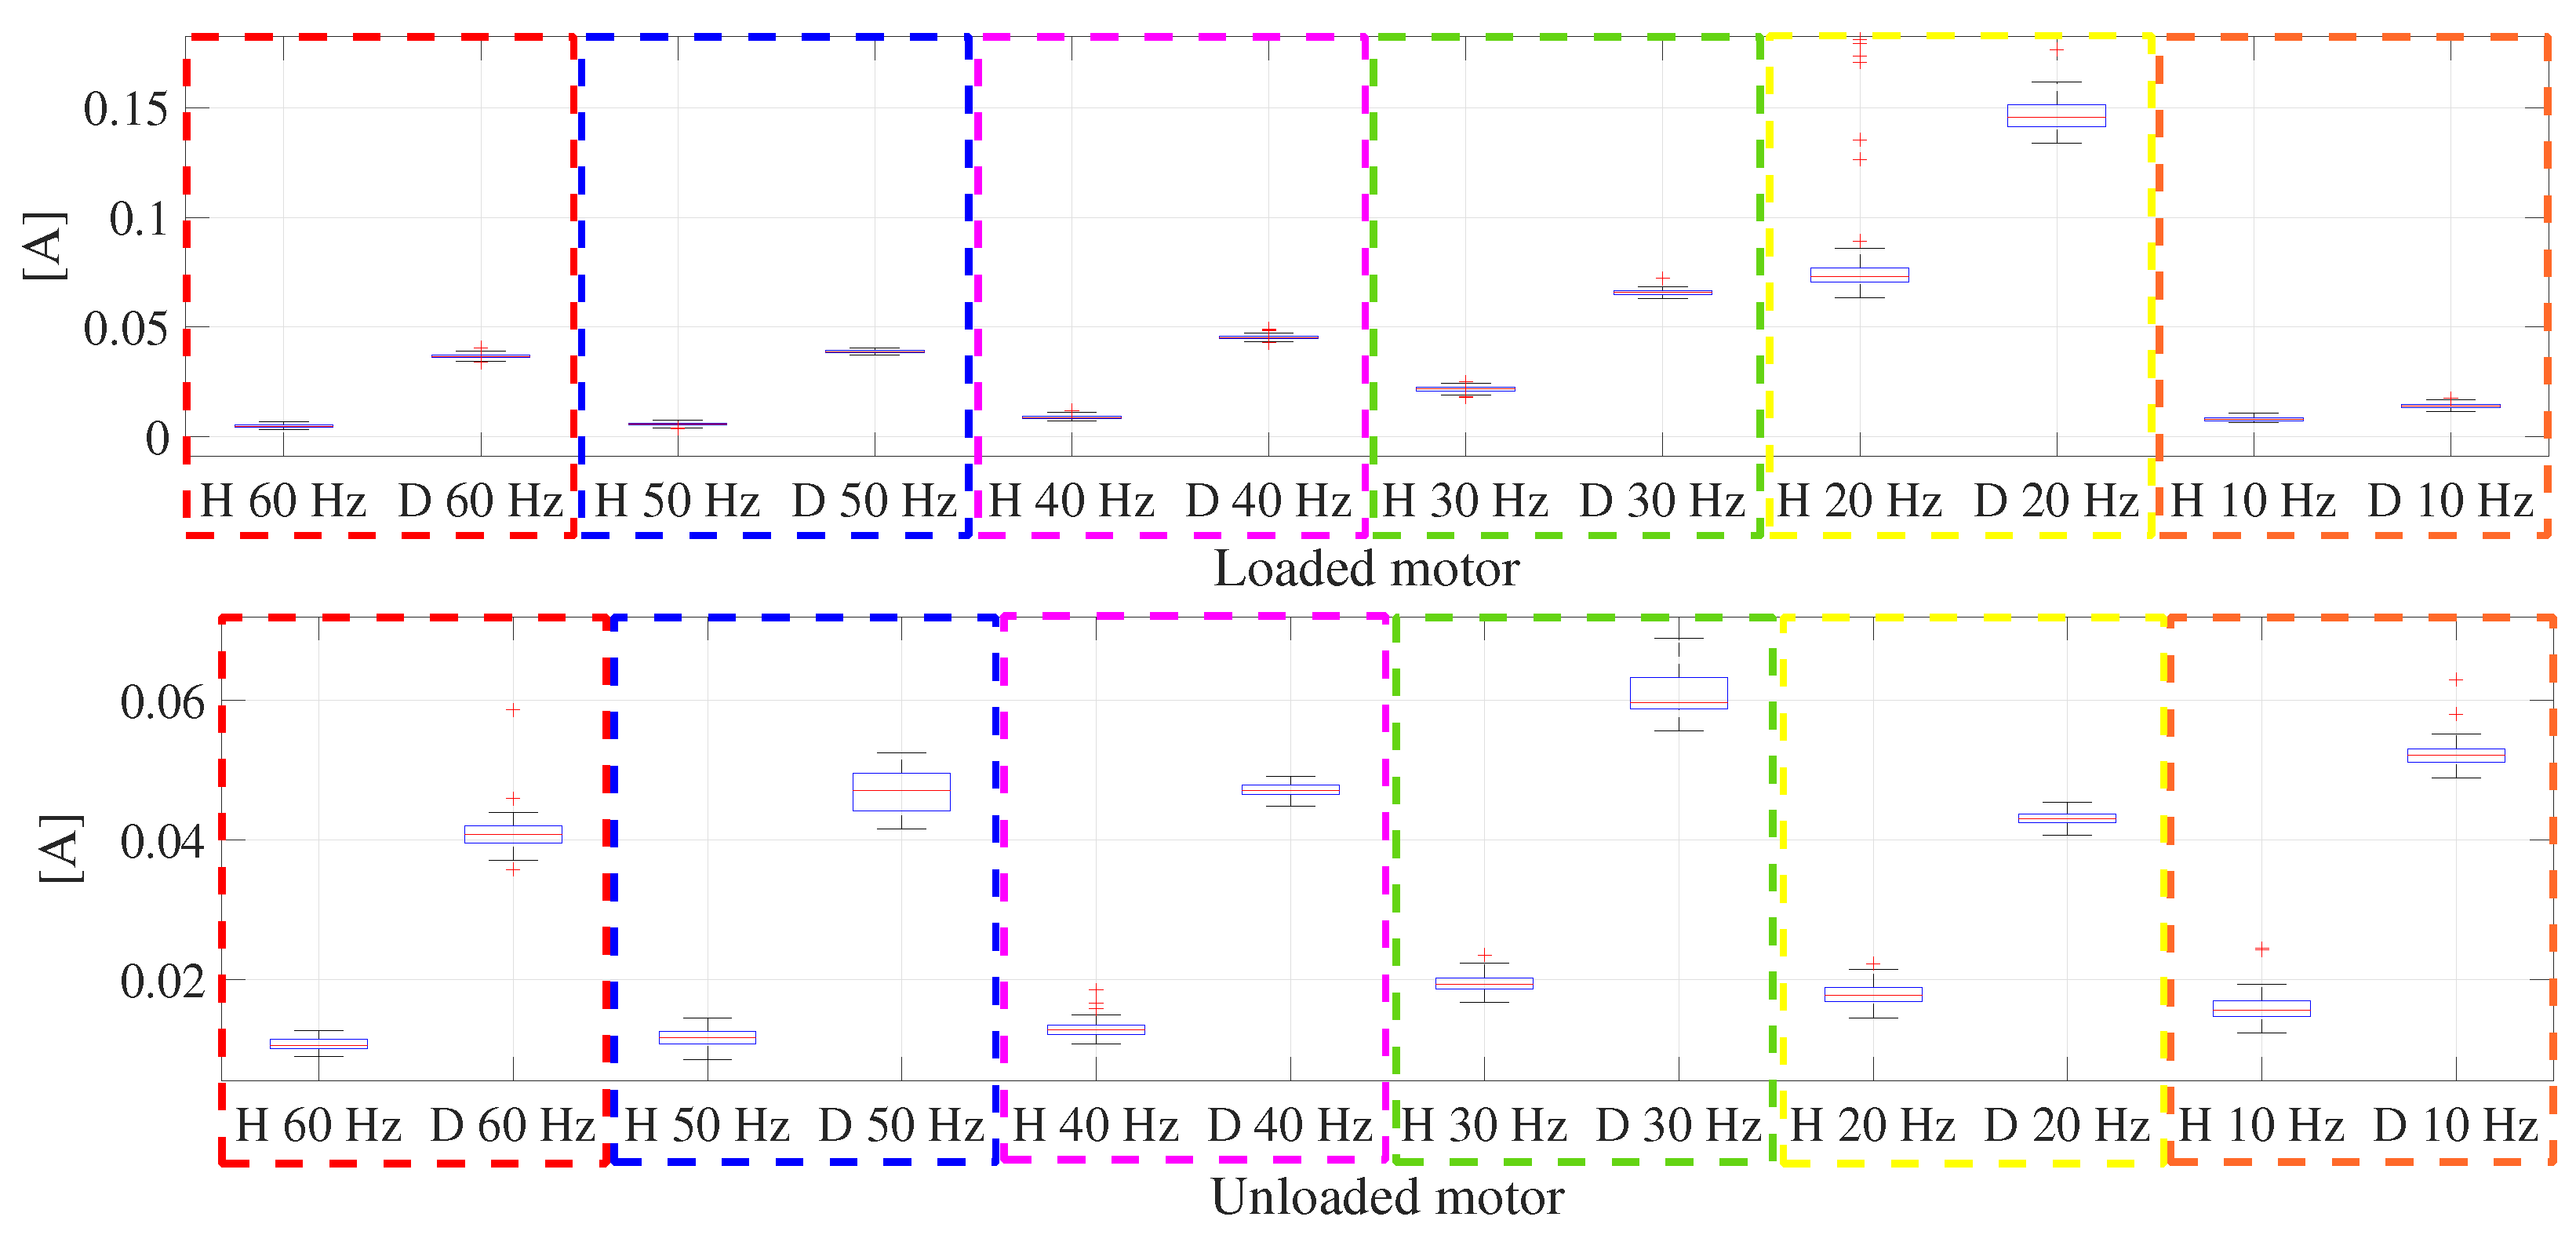
4.1. Experimental Setup

The experimental setup for current signal analysis (showed in Figure 10) is based on a three-phase IM WEG 00118ET3EM143TW, 1HP, 1800RPM, 220VAC, and 2.98A. The load of the IM is mechanically generated, where the IM nominal current is used as the maximum value of the applied load, and then the loaded condition used in this paper is assumed when the IM is consuming 60% of the nominal current.
The model of the bearings used in this work was 6204 with the following specifications: N b = 9 , R b = 4 mm, R c = 19.5 mm. The studied damages were artificially created with a roller tool of 1.58 mm ≈ 1.6 mm diameter, the perforated elements were one ball and the outer-race of each bearing, corresponding to bearing ball damage and outer-race damage, respectively. Finally, the nonlocalized defect condition was emulated with a corroded bearing.
The tests were performed under different bearing damage conditions: bearing ball damage, outer-race damage, and generalized damage for oxide. The damage cases were artificially created aiming to characterize the fault and compare their information with a healthy bearing in order to apply Equations (1)–(3) and visual inspection to identify the fault signature of each case. Faulted bearings are presented in Figure 11. In this work, only drive end bearings were considered.

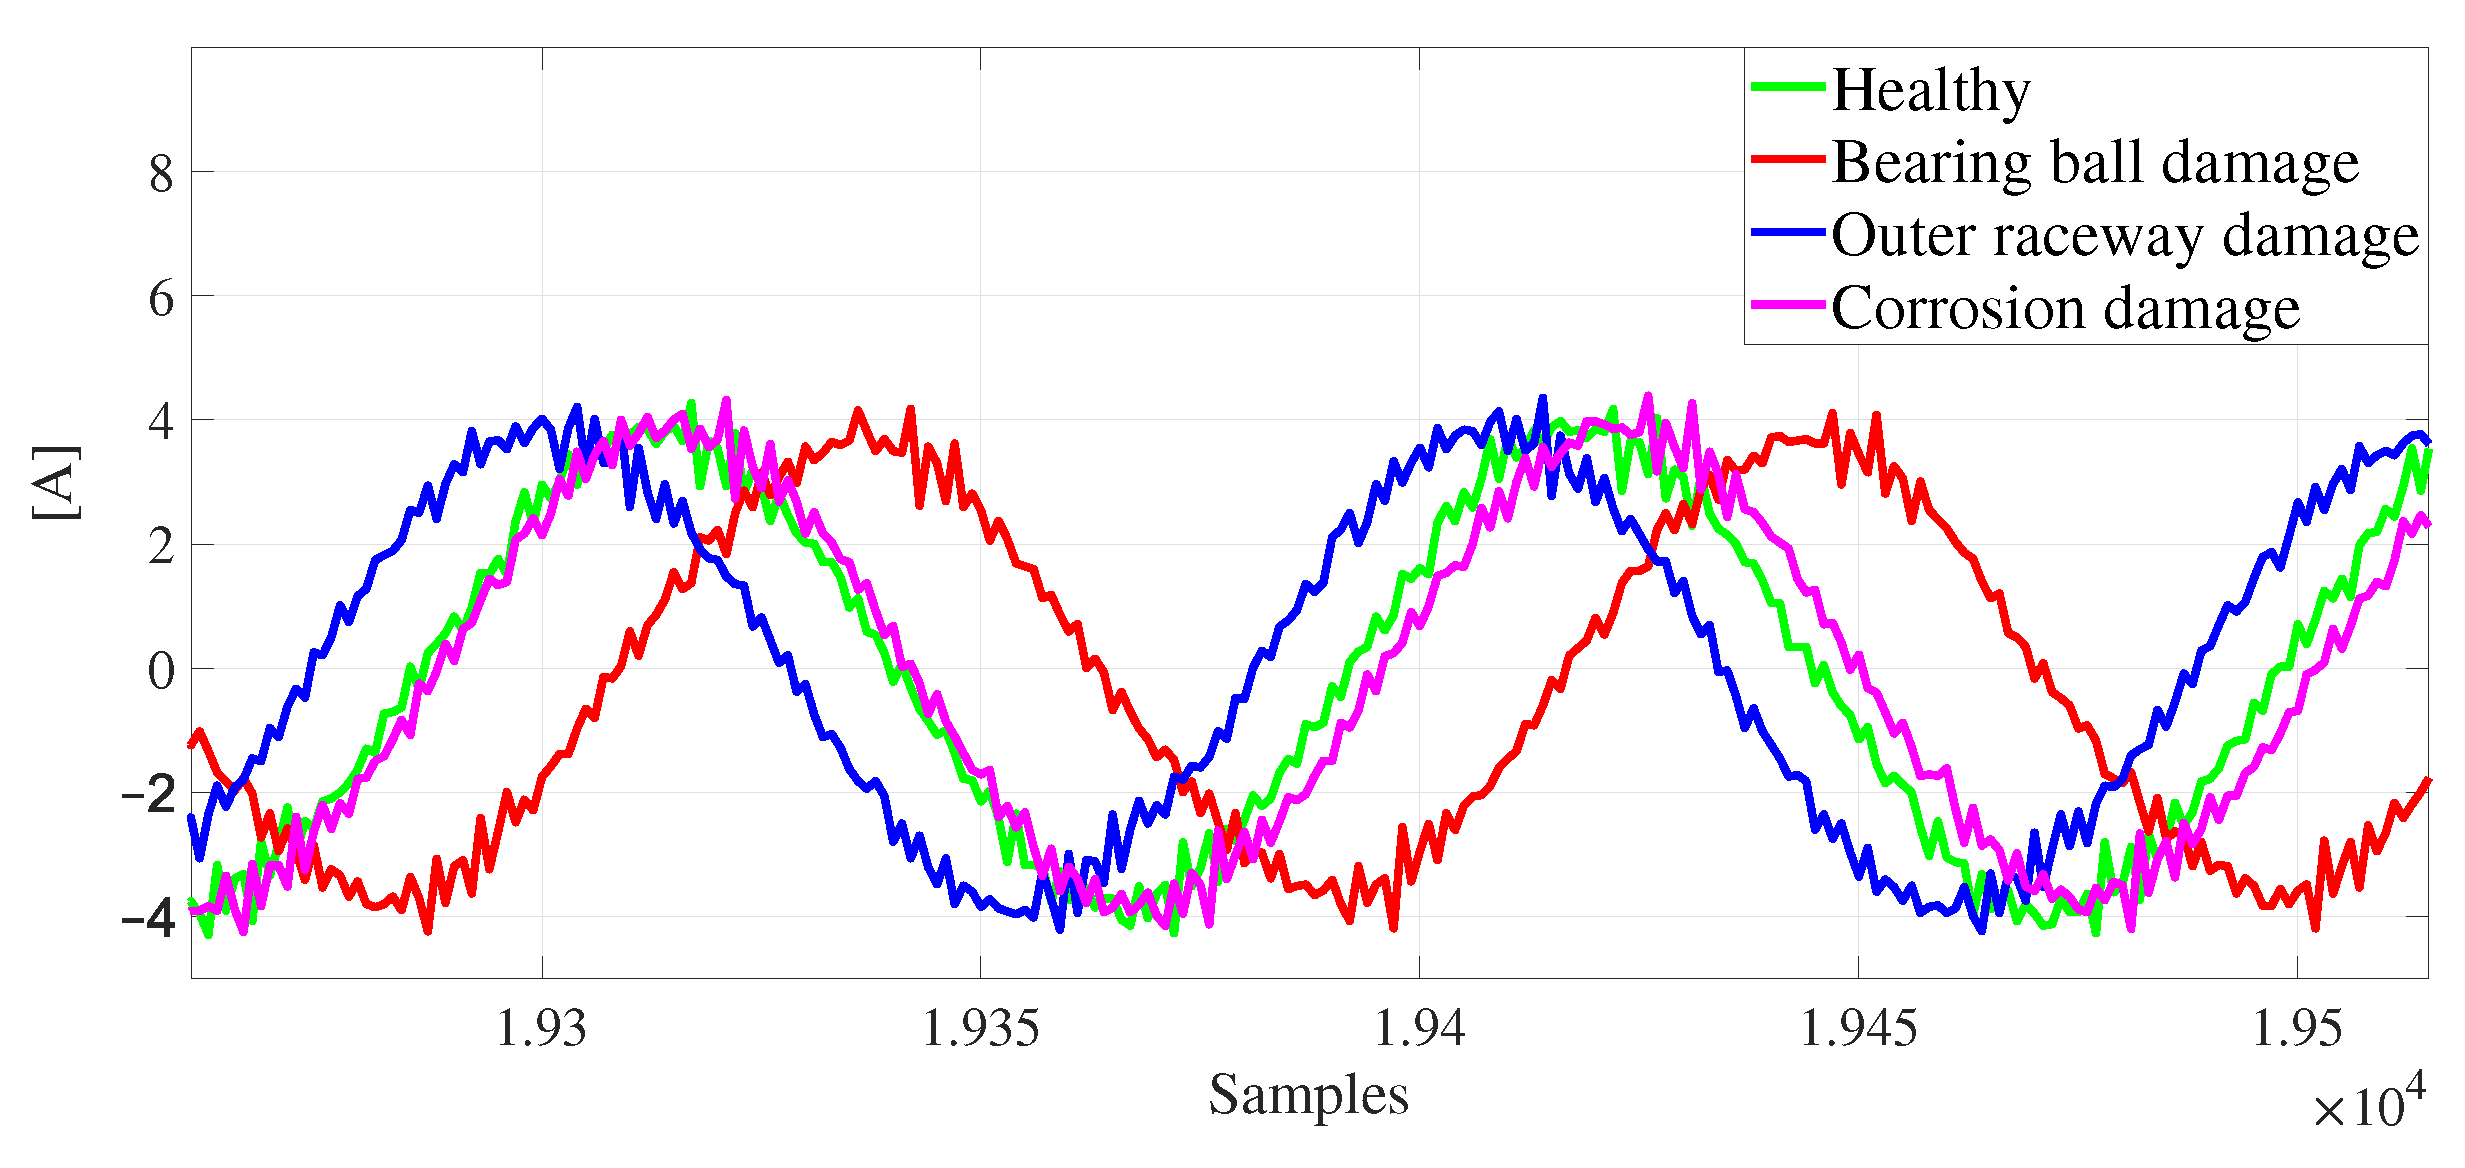
4.2. Experimental Results

To implement the detection and classification methodology, 100 stator current measurements for different scenarios were analyzed, giving a total of 4800 tests where each test represents the input signals. Current measurements for each damage condition were acquired at different sample rates and different operation frequencies (see Table 1 and Table 2) to obtain the same number of samples per cycle of the mentioned induction machine.
By analyzing the spectrum of a particular case just as an example, the fault components are identified to set the central frequency of the filter at 89.6 Hz, as depicted in Figure 12 [32] (the spurious components of the different faults will not necessarily be at the same frequency like this). Therefore, this value is selected as the central frequency for the bandpass filter, as shown in Figure 13. Notice the narrow bandwidth, which can be modulated depending on the fault component.
Below, the results for each fault condition are presented, where accuracy percentages are the ratio between the estimated fault prediction and the actual prediction.

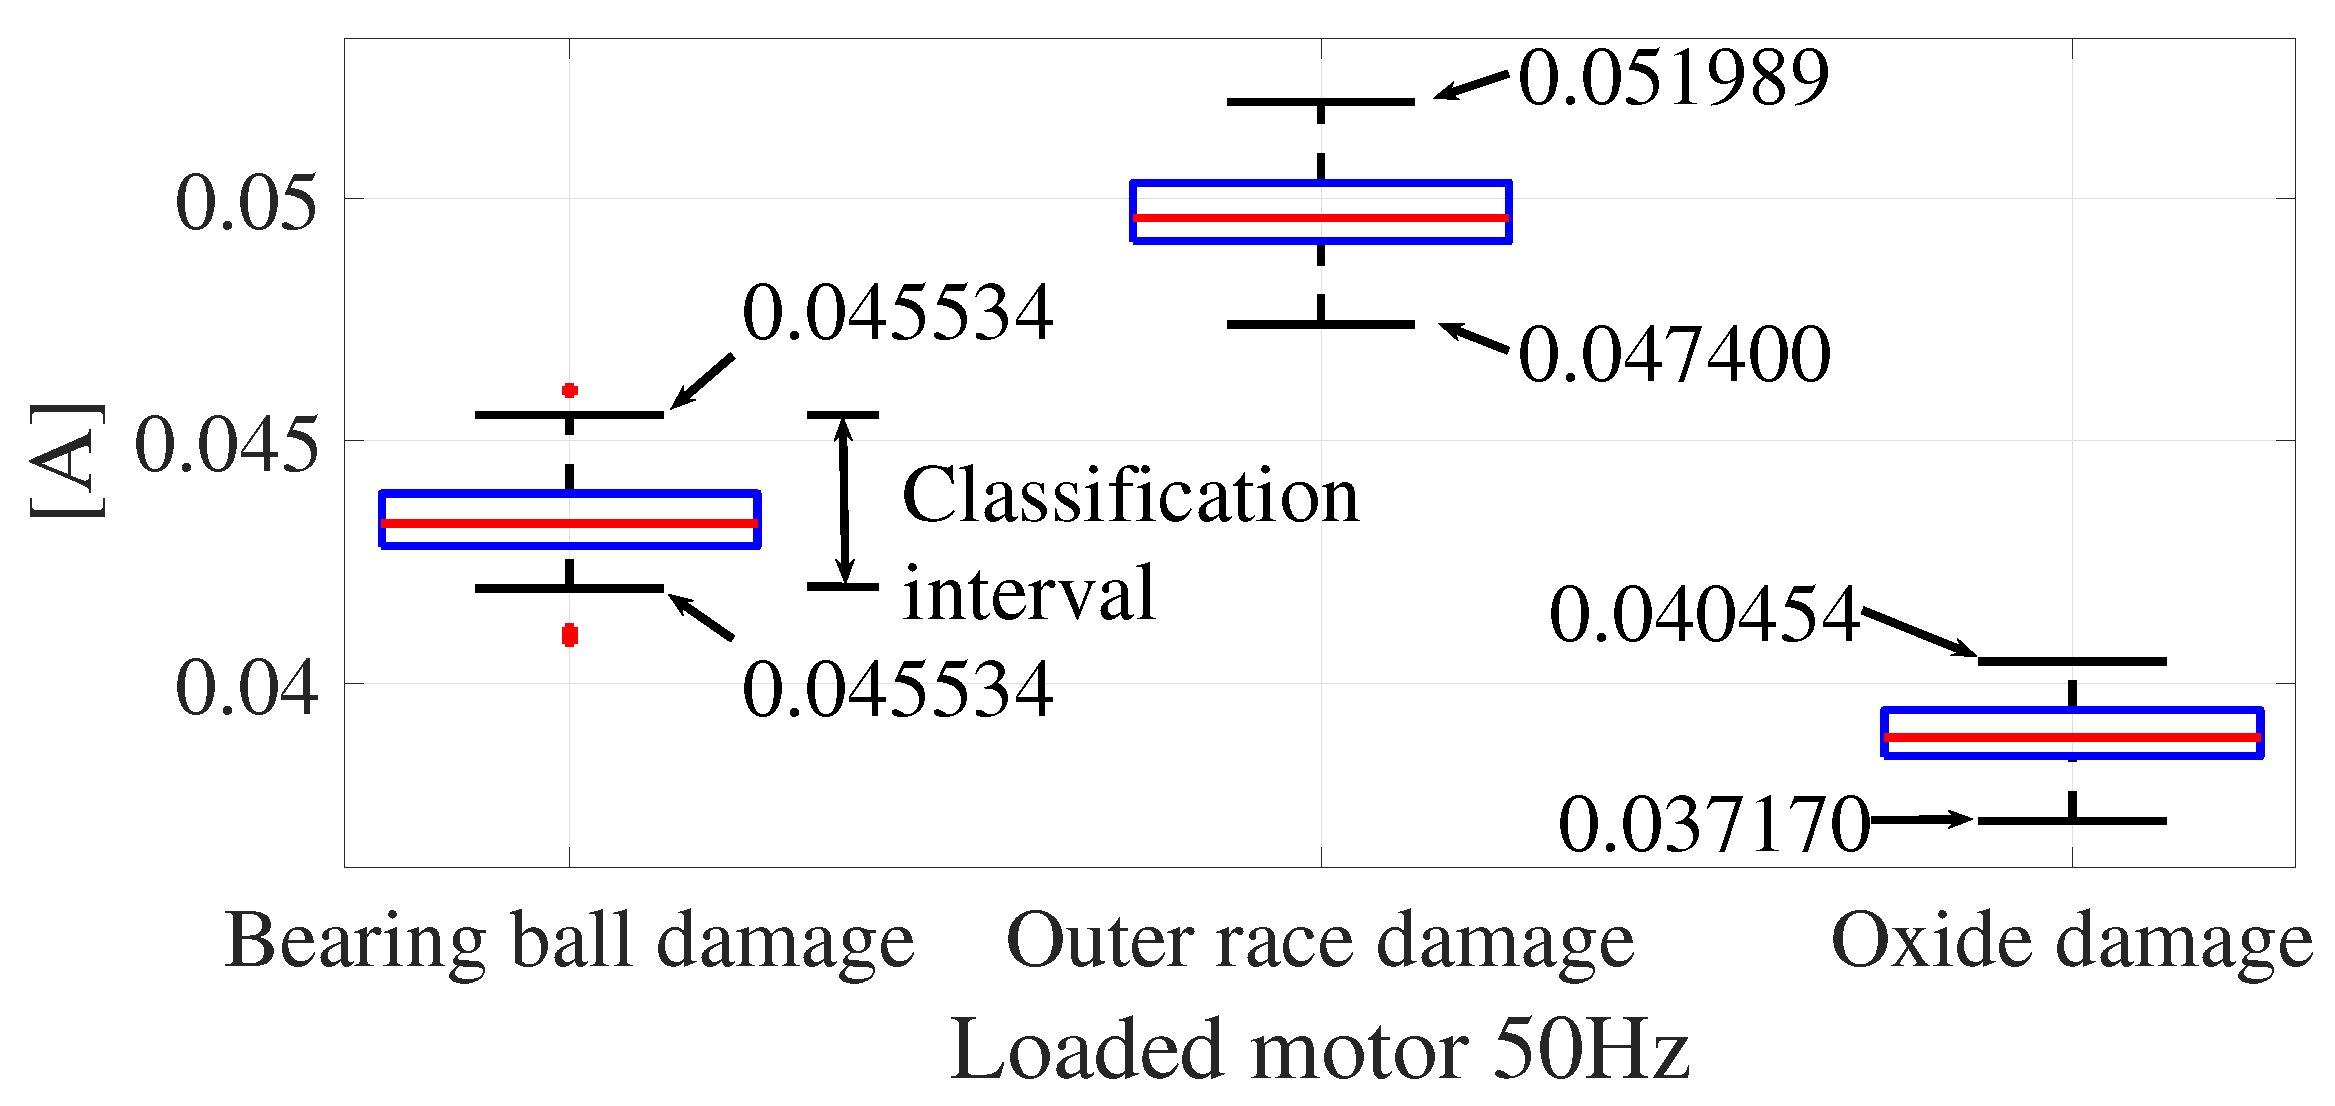
4.3. Bearing Ball Damage (BBD)

A total of 1400 measurements are filtered to characterize the signal in order to get the estimated amplitude for detection and classification purposes.
According to Section 3, the statistical analysis is performed to obtain the discriminant for detection and classification. To obtain the motor condition, the detection boxplot is constructed and presented in Figure 14, where label H represents the healthy motor condition, D represents a bearing damage condition, BBD is the bearing ball damage, ORD is the outer-race damage, and OD is the oxide damage. The tests were performed at 60, 50, 40, 30, 20, and 10 Hz. The classification accuracy percentage is presented in Table 1 and Table 2 for both loaded and unloaded motor conditions.

4.4. Outer-Race Damage (ORD)

In the same way, the measurements are filtered aiming to estimate the amplitudes and hence, to obtain the statistical information based on the boxplot, as illustrated in Figure 15, to detect and classify the fault.
Accuracy percentages are presented in Table 1 and Table 2. For that fault in the loaded motor condition, the worst accuracy percentage is 95%, and the best is 100%.

4.5. Corrosion Damage (OD)

Finally, for the oxide damage case, the statistical analysis (see Figure 16) is performed based on these damage measurements. As in the previous cases, the accuracy results are presented in Table 1 and Table 2.
Notice that the classification is successful for both load and unload conditions, considering that the statistical distribution is non-overlapping.
The filter location in some cases is different for detection and classification to avoid overlapping at the same frequency, aiming to replicate a boxplot similar to Figure 9 where the classification process is straightforward.
In Table 3, the proposed method is compared with other works based on the techniques used for diagnosis, the classifier, the type of faults considered, and the accuracy of the classification. One of the most prominent advantages of using the Taylor–Fourier transform is the high detection accuracy without requiring complex methods such as neural networks. It is important to mention that the accuracy percentages were reported in the literature and are used in this work only as references.

5. Discussion

In this work, three different types of faults were studied for six different operation frequencies for loaded and unloaded IMs. Based on the current signal characteristics of each motor condition, the Taylor–Fourier filters were designed, and amplitudes were estimated. Finally, faults were detected and classified according to the statistical distributions of the amplitude estimates.
The main difficulties encountered during the elaboration of this work were related to the design of the filter, given that the nature of the fault-related components demanded a fine filter. In this regard, the bandwidth had to be small enough for good amplitude estimates, so a larger number of samples in time had to be processed in each sliding window. This process made the computing time slow; however, once the statistical indicators were calculated and the threshold values were selected, the classification time was negligible in comparison with the signal processing time. In practice, once the motor is characterized, only the classification time is considered.

6. Conclusions

This paper uses a methodology for current-based analysis for bearing damage detection and classification through the DTFT. Exhibited results show that the filtering characteristics of the DTFT provide an excellent accuracy ratio, highlighting its capability to process signals in a transient state. Results show that the lowest accuracy percentage is 93%, but overall reaches 99%.
Classification accuracies for the unloaded condition are mostly lower than for the loaded condition; however, both cases presented an excellent performance. Notice that for 50 Hz and 60 Hz, which are the grid frequencies in Europe and America, respectively, the classification percentages go from 95% to 100%.
Those results could be useful for motor diagnosis in industrial applications and to give solutions to the challenges that the actual society demands, like the implementation of alternative power sources, electric transportation, the inclusion of smart devices in daily life, among others based on the low computational complexity of the algorithmic implementation. This implies the potential to develop a non-intrusive online detection and classification device based on the accurate results provided by the DTFT.
In future works, authors will describe the DTFT algorithm in hardware to analyze the real computational complexity and explore the possibilities of silicon implementation for an online device.

Author Contributions

Conceptualization, G.A.-A., S.A.-T. and J.d.J.R.-M.; validation, G.A.-A., S.A.-T. and J.d.J.R.-M.; investigation, S.A.-T., G.A.-A., M.R.A.-P. and J.d.J.R.-M.; resources, S.A.-T., G.A.-A. and J.d.J.R.-M.; writing—original draft preparation, G.A.-A. and S.A.-T.; writing—review and editing, G.A.-A., S.A.-T., M.R.A.-P. and J.d.J.R.-M.; supervision, J.d.J.R.-M. and M.R.A.-P.; All authors have read and agreed to the published version of the manuscript.

Funding

This research received no external funding.

Data Availability Statement

Data sharing not applicable No new data were created or analyzed in this study.

Conflicts of Interest

The authors declare no conflict of interest.

References

  1. Peeters, C.; Guillaume, P.; Helsen, J. Vibration-based bearing fault detection for operations and maintenance cost reduction in wind energy. Renew. Energy 2017, 116, 74–87. [Google Scholar] [CrossRef]
  2. Li, Y.; Liang, X.; Lin, J.; Chen, Y.; Liu, J. Train axle bearing fault detection using a feature selection scheme based multi-scale morphological filter. Mech. Syst. Signal Process. 2018, 101, 435–448. [Google Scholar] [CrossRef]
  3. Chen, J.; Pan, J.; Li, Z.; Zi, Y.; Chen, X. Generator bearing fault diagnosis for wind turbine via empirical wavelet transform using measured vibration signals. Renew. Energy 2016, 89, 80–92. [Google Scholar] [CrossRef]
  4. Ozcelik, N.G.; Dogru, U.E.; Imeryuz, M.; Ergene, L.T. Synchronous Reluctance Motor vs. Induction Motor at Low-Power Industrial Applications: Design and Comparison. Energies 2019, 12, 2190. [Google Scholar] [CrossRef]
  5. Kumar, S.; Mukherjee, D.; Guchhait, P.K.; Banerjee, R.; Srivastava, A.K.; Vishwakarma, D.N.; Saket, R.K. A Comprehensive Review of Condition Based Prognostic Maintenance (CBPM) for Induction Motor. IEEE Access 2019, 7, 90690–90704. [Google Scholar] [CrossRef]
  6. Blodt, M.; Granjon, P.; Raison, B.; Rostaing, G. Models for Bearing Damage Detection in Induction Motors Using Stator Current Monitoring. IEEE Trans. Ind. Electron. 2008, 55, 1813–1822. [Google Scholar] [CrossRef]
  7. Irgat, E.; Çinar, E.; Ünsal, A. The detection of bearing faults for induction motors by using vibration signals and machine learning. In Proceedings of the 2021 IEEE 13th International Symposium on Diagnostics for Electrical Machines, Power Electronics and Drives (SDEMPED), Dallas, TX, USA, 22–25 August 2021; Volume 1, pp. 447–453. [Google Scholar] [CrossRef]
  8. Jawad, S.; Jaber, A. Rolling Bearing Fault Detection Based on Vibration Signal Analysis and Cumulative Sum Control Chart. FME Trans. 2021, 49, 684–695. [Google Scholar] [CrossRef]
  9. Barusu, M.R.; Deivasigamani, M. Non-Invasive Vibration Measurement for Diagnosis of Bearing Faults in 3-Phase Squirrel Cage Induction Motor Using Microwave Sensor. IEEE Sens. J. 2021, 21, 1026–1039. [Google Scholar] [CrossRef]
  10. Zamudio-Ramirez, I.; Osornio-Rios, R.A.; Antonino-Daviu, J.A.; Cureño-Osornio, J.; Saucedo-Dorantes, J.J. Gradual Wear Diagnosis of Outer-Race Rolling Bearing Faults through Artificial Intelligence Methods and Stray Flux Signals. Electronics 2021, 10, 1486. [Google Scholar] [CrossRef]
  11. Luo, G.; Habetler, T.G.; Hurwitz, J. Stray Flux-Based Incipient Stage Bearing Fault Detection for Induction Machines via Noise Cancellation Techniques. In Proceedings of the 2020 IEEE Energy Conversion Congress and Exposition (ECCE), Detroit, MI, USA, 11–15 October 2020; pp. 764–768. [Google Scholar] [CrossRef]
  12. Ramirez-Nunez, J.A.; Antonino-Daviu, J.A.; Climente-Alarcón, V.; Quijano-López, A.; Razik, H.; Osornio-Rios, R.A.; Romero-Troncoso, R.d.J. Evaluation of the Detectability of Electromechanical Faults in Induction Motors Via Transient Analysis of the Stray Flux. IEEE Trans. Ind. Appl. 2018, 54, 4324–4332. [Google Scholar] [CrossRef]
  13. Song, X.; Wang, Z.; Hu, J. Detection of Bearing Outer Race Fault in Induction Motors using Motor Current Signature Analysis. In Proceedings of the 2019 22nd International Conference on Electrical Machines and Systems (ICEMS), Harbin, China, 11–14 August 2019; pp. 1–5. [Google Scholar] [CrossRef]
  14. Tang, H.; Dai, H.L.; Du, Y. Bearing Fault Detection for Doubly fed Induction Generator Based on Stator Current. IEEE Trans. Ind. Electron. 2022, 69, 5267–5276. [Google Scholar] [CrossRef]
  15. de Jesús Rangel-Magdaleno, J. Induction Machines Fault Detection: An Overview. IEEE Instrum. Meas. Mag. 2021, 24, 63–71. [Google Scholar] [CrossRef]
  16. Hoang, D.T.; Kang, H.J. A survey on Deep Learning based bearing fault diagnosis. Neurocomputing 2019, 335, 327–335. [Google Scholar] [CrossRef]
  17. Ali, M.Z.; Shabbir, M.N.S.K.; Liang, X.; Zhang, Y.; Hu, T. Machine Learning-Based Fault Diagnosis for Single- and Multi-Faults in Induction Motors Using Measured Stator Currents and Vibration Signals. IEEE Trans. Ind. Appl. 2019, 55, 2378–2391. [Google Scholar] [CrossRef]
  18. Choudhary, A.; Goyal, D.; Letha, S.S. Infrared Thermography-Based Fault Diagnosis of Induction Motor Bearings Using Machine Learning. IEEE Sens. J. 2021, 21, 1727–1734. [Google Scholar] [CrossRef]
  19. Yuan, L.; Lian, D.; Kang, X.; Chen, Y.; Zhai, K. Rolling Bearing Fault Diagnosis Based on Convolutional Neural Network and Support Vector Machine. IEEE Access 2020, 8, 137395–137406. [Google Scholar] [CrossRef]
  20. Zhang, S.; Zhang, S.; Wang, B.; Habetler, T.G. Deep Learning Algorithms for Bearing Fault Diagnostics—A Comprehensive Review. IEEE Access 2020, 8, 29857–29881. [Google Scholar] [CrossRef]
  21. Hoang, D.T.; Kang, H.J. A Motor Current Signal-Based Bearing Fault Diagnosis Using Deep Learning and Information Fusion. IEEE Trans. Instrum. Meas. 2020, 69, 3325–3333. [Google Scholar] [CrossRef]
  22. Mao, W.; Chen, J.; Liang, X.; Zhang, X. A New Online Detection Approach for Rolling Bearing Incipient Fault via Self-Adaptive Deep Feature Matching. IEEE Trans. Instrum. Meas. 2020, 69, 443–456. [Google Scholar] [CrossRef]
  23. Zhang, S.; Wang, B.; Kanemaru, M.; Lin, C.; Liu, D.; Miyoshi, M.; Teo, K.H.; Habetler, T.G. Model-Based Analysis and Quantification of Bearing Faults in Induction Machines. IEEE Trans. Ind. Appl. 2020, 56, 2158–2170. [Google Scholar] [CrossRef]
  24. Xu, M.; Zhang, H.; Miao, H.; Hao, J.; Li, C.; Song, W.; Yao, G.; Zhang, Y. Model-based vibration response analysis and experimental verification of lathe spindle-housing-belt system with rubbing. Mech. Syst. Signal Process. 2023, 186, 109841. [Google Scholar] [CrossRef]
  25. Pandarakone, S.E.; Mizuno, Y.; Nakamura, H. Distinct Fault Analysis of Induction Motor Bearing Using Frequency Spectrum Determination and Support Vector Machine. IEEE Trans. Ind. Appl. 2017, 53, 3049–3056. [Google Scholar] [CrossRef]
  26. Noureddine, B.; Remus, P.; Raphael, R.; Salim, S. Rolling Bearing Failure Detection in Induction Motors using Stator Current, Vibration and Stray Flux Analysis Techniques. In Proceedings of the IECON 2020 The 46th Annual Conference of the IEEE Industrial Electronics Society, Singapore, 18–21 October 2020; pp. 1088–1095. [Google Scholar] [CrossRef]
  27. Nath, S.; Wu, J.; Zhao, Y.; Qiao, W. Low Latency Bearing Fault Detection of Direct-Drive Wind Turbines Using Stator Current. IEEE Access 2020, 8, 44163–44174. [Google Scholar] [CrossRef]
  28. de la O Serna, J.A. Dynamic Phasor Estimates for Power System Oscillations. IEEE Trans. Instrum. Meas. 2007, 56, 1648–1657. [Google Scholar] [CrossRef]
  29. de la O Serna, J.A.; Ramirez, J.M.; Zamora Mendez, A.; Paternina, M.R.A. Identification of Electromechanical Modes Based on the Digital Taylor–Fourier Transform. IEEE Trans. Power Syst. 2016, 31, 206–215. [Google Scholar] [CrossRef]
  30. Aguayo-Tapia, S.; Ávalos Almazán, G.; Rangel-Magdaleno, J.; Paternina, M.R. Broken Rotor Bar Detection in Induction Motors using Digital Taylor–Fourier Transform. In Proceedings of the 2022 IEEE International Autumn Meeting on Power, Electronics and Computing (ROPEC), Ixtapa, Mexico, 9–11 November 2022; Volume 6, pp. 1–6. [Google Scholar] [CrossRef]
  31. de la O Serna, J.A.; Paternina, M.R.A.; Zamora-Méndez, A.; Tripathy, R.K.; Pachori, R.B. EEG-Rhythm Specific Taylor–Fourier Filter Bank Implemented With O-Splines for the Detection of Epilepsy Using EEG Signals. IEEE Sens. J. 2020, 20, 6542–6551. [Google Scholar] [CrossRef]
  32. Avalos, G.; Aguayo, S.; Rangel-Magdaleno, J.; Paternina, M. Bearing fault detection in induction motors using digital Taylor–Fourier transform. In Proceedings of the 2022 International Conference on Electrical Machines (ICEM), Valencia, Spain, 5–8 September 2022; pp. 1830–1835. [Google Scholar] [CrossRef]
  33. Serna, J.A.d.l.O. Dynamic Harmonic Analysis with FIR Filters Designed with O-Splines. IEEE Trans. Circuits Syst. I Regul. Pap. 2020, 67, 5092–5100. [Google Scholar] [CrossRef]
  34. Aguayo-Tapia, S.; Avalos-Almazan, G.; Rangel-Magdaleno, J.d.J.; Ramirez-Cortes, J.M. Physical Variable Measurement Techniques for Fault Detection in Electric Motors. Energies 2023, 16, 4780. [Google Scholar] [CrossRef]
  35. Huo, Z.; Zhang, Y.; Francq, P.; Shu, L.; Huang, J. Incipient Fault Diagnosis of Roller Bearing Using Optimized Wavelet Transform Based Multi-Speed Vibration Signatures. IEEE Access 2017, 5, 19442–19456. [Google Scholar] [CrossRef]
  36. Nishat Toma, R.; Kim, J.M. Bearing Fault Classification of Induction Motors Using Discrete Wavelet Transform and Ensemble Machine Learning Algorithms. Appl. Sci. 2020, 10, 5251. [Google Scholar] [CrossRef]
  37. Rostaghi, M.; Khatibi, M.M.; Ashory, M.R.; Azami, H. Bearing Fault Diagnosis Using Refined Composite Generalized Multiscale Dispersion Entropy-Based Skewness and Variance and Multiclass FCM-ANFIS. Entropy 2021, 23, 1510. [Google Scholar] [CrossRef]
  38. Zhang, Y.; Lv, Y.; Ge, M. A Rolling Bearing Fault Classification Scheme Based on k-Optimized Adaptive Local Iterative Filtering and Improved Multiscale Permutation Entropy. Entropy 2021, 23, 191. [Google Scholar] [CrossRef]
Figure 1. Bearing main parts.
Machines 11 00999 g001
Figure 2. Damage effects. (a) Initial stage damage signature. (b) Intermediate stage damage signature. (c) Advanced stage damage signature.
Machines 11 00999 g002
Figure 3. Bearing geometrics.
Machines 11 00999 g003
Figure 4. Taylor–Fourier filter responses based on the order of K.
Machines 11 00999 g004
Figure 5. Behavior of the Taylor–Fourier filter of third order and the Fourier filter.
Machines 11 00999 g005
Figure 6. Proposed methodology scheme.
Machines 11 00999 g006
Figure 7. Bearing current signals.
Machines 11 00999 g007
Figure 8. Fault detection criteria [34].
Machines 11 00999 g008
Figure 9. Fault classification intervals.
Machines 11 00999 g009
Figure 10. Data acquisition system.
Machines 11 00999 g010
Figure 11. Damaged bearing (From left to right): bearing ball damage, outer-race damage, and oxide damage.
Machines 11 00999 g011
Figure 12. Frequency spectrum of the fault component in each one of the conditions under study (loaded motor with adjustable speed driver at 60 Hz).
Machines 11 00999 g012
Figure 13. Fifth-order bandpass filter centered at the fault components.
Machines 11 00999 g013
Figure 14. Bearing ball damage boxplot.
Machines 11 00999 g014
Figure 15. Outer-race damage boxplot.
Machines 11 00999 g015
Figure 16. Oxide damage boxplot.
Machines 11 00999 g016
Table 1. Classification percentages for loaded motor.
Loaded Motor
FrequencyBBDORDODOut of Class Range
BBD 96%0%3%1%
ORD60 Hz0%98%0%2%
OD 4%0%95%1%
BBD 95%0%0%5%
ORD50 Hz0%100%0%0%
OD 0%0%99%1%
BBD 99%0%0%1%
ORD40 Hz0%99%0%1%
OD 0%0%100%0%
BBD 99%0%0%1%
ORD30 Hz0%95%1%4%
OD 0%1%97%2%
BBD 97%0%0%3%
ORD20 Hz0%98%1%1%
OD 0%0%94%6%
BBD 93%5%0%2%
ORD10 Hz0%97%0%3%
OD 0%0%98%2%
Table 2. Classification percentages for unloaded motor.
Unloaded Motor
FrequencyBBDORDODOut of Class Range
BBD 97%0%0%3%
ORD60 Hz0%98%0%2%
OD 0%0%98%2%
BBD 98%0%0%2%
ORD50 Hz0%100%0%0%
OD 0%0%98%0%
BBD 97%0%0%3%
ORD40 Hz0%97%0%3%
OD 0%0%99%1%
BBD 990%0%1%
ORD30 Hz0%95%0%5%
OD 0%0%100%0%
BBD 97%0%0%3%
ORD20 Hz0%98%0%2%
OD 0%0%98%2%
BBD 98%0%0%2%
ORD10 Hz0%91%0%9%
OD 0%1%98%1%
Table 3. Comparative review of proposed methods for bearing fault detection.
YearTechnique for Feature ExtractionType of FaultClassifierClassifier Accuracy
2017 [35]Adaptative impulse modelling based waveletBall, inner and outer raceStatistical analysis with neural network-based classifier100%
2020 [36]Discrete Wavelet transformInner and outer raceRandom forest and extreme gradient boosting99.3%
2021 [37]Refined composite generalized multiscale dispersion entropyBall, inner and outer raceMulticlass adaptative neuro-fuzzy classifier89.62–99.27%
2021 [38]k-optimized adaptive local iterative filtering and improved multiscale permutation entropyBall, inner and outer raceBack-propagation neural network91.57–99.98%
2021 [19]Continuous Wavelet transformBall, inner and outer raceConvolutional neural network and support vector machine98.75–98.89%
This workAmplitude estimation based on the Taylor–Fourier transformBall, inner and outer race and corrosionStatistical analysis93–100%
Disclaimer/Publisher’s Note: The statements, opinions and data contained in all publications are solely those of the individual author(s) and contributor(s) and not of MDPI and/or the editor(s). MDPI and/or the editor(s) disclaim responsibility for any injury to people or property resulting from any ideas, methods, instructions or products referred to in the content.

