Article

Optimization of a Turbine Flow Well Logging Tool Based on the Response Surface Method

1
School of Engineering and Technology, China University of Geosciences, Beijing 100083, China
2
Key Laboratory of Deep Geo-Drilling Technology, Ministry of Land and Resources, Beijing 100083, China
*
Author to whom correspondence should be addressed.
Machines 2023, 11(4), 455; https://doi.org/10.3390/machines11040455
Submission received: 22 February 2023 / Revised: 27 March 2023 / Accepted: 28 March 2023 / Published: 4 April 2023
(This article belongs to the Section Turbomachinery)

Abstract

:
As the exploration of ultra-deep layers and the development of geothermal resources continue, obtaining more accurate downhole parameters becomes increasingly important. Flow measurement, in particular, is a complex parameter that presents significant challenges. In order to enhance the accuracy of the turbine flow logging tool, this research focuses on optimizing the turbine flow metering structure through a range of methods. A calculation model related to the measurement process is established, and the flow field characteristics in the flowmeter are analyzed using CFD software. The sensitivity of various geometric parameters to the meter coefficient is also analyzed, and the significance of 11 influencing factors is classified and optimized using the Plackett–Burman climbing test design. The Box–Behnken design method is then used to conduct an experimental design for the significant influencing factors, and the results show that the regression model fits the actual situation well. The response surface method is used to optimize the structural parameters, and an orthogonal experimental design is carried out for the selected non-significant influencing parameters to obtain the optimal structure combination. After optimization based on the response surface method, the stability of turbine flow measurement accuracy is improved by 34.5%.

1. Introduction

Real-time collection and monitoring of downhole flow data are essential in drilling and production. The rapid development of green energy sources, such as hot dry rock, highlights the significance of effectively obtaining downhole flow information. This information enables engineers to promptly adjust and modify drilling and production technology to optimize the production layer’s yield [1]. Additionally, real-time monitoring of downhole conditions such as downhole kick and lost circulation can improve the accuracy of ground judgment and system control for complicated bottom hole conditions [2,3,4].
The turbine flow well logging tool is widely utilized in the downhole environment [5]. The turbine’s internal component is equipped with a turbine structure that can rotate due to the fluid’s impetus, converting the flow rate into the turbine’s speed [6]. The rotation of the turbine causes the magnetic line of force to be cut, generating an induction signal that is processed and uploaded to obtain the downhole flow value, as illustrated in Figure 1. The turbine induction component of the bottom hole turbine flowmeter is crucial to its sensitivity in fluid measurement, and the hydraulic performance of the turbine structure is directly associated with the measurement accuracy [7,8]. Thus, the mechanical structural parameters exert a significant impact on measurement accuracy, and the stability of measurements is frequently influenced by various factors. However, there exists a certain level of interaction between these parameters [9,10]. The response surface method and fluid simulation test are commonly employed research techniques, which can efficiently minimize the number of tests and enhance optimization efficiency [11].
Currently, the primary approach for investigating the optimization of turbine blades is to reduce the optimization cycle and production costs by employing computational fluid simulation [12,13]. Researchers in this field have utilized the Box–Behnken design method in combination with fluid simulation calculations to conduct experiments, optimizing the relevant structural parameters and ultimately enhancing the measurement accuracy of the flowmeter. Based on the orthogonal test method, Lu Jing et al. [14] analyzed the influence of the changing geometrical parameters of the slanting turbine structure on the internal flow field and the efficiency of the hydraulic turbine. Through optimization, the turbine energy utilization rate was increased by 42.71% [15]. According to the response surface method, Wang Liqi et al. conducted an optimization calculation of the axial flow turbine blade profile and investigated the correlation between the design parameters and geometric parameters of the turbine blade profile [16,17,18].
To tackle the challenge of optimizing the blade structure parameters of turbo drilling tools, both domestic and foreign scholars have utilized the Box–Behnken response design method and fluid simulation orthogonal test due to the complexity of the overall structure design. By focusing on turbine efficiency and torque, they have successfully designed the optimal turbine blade parameters to enhance the hydraulic performance of the turbine [19,20,21]. Additionally, the response surface optimization method has been utilized by numerous experts and scholars in various fields such as aviation wings, centrifugal compressors, diffusers, wind turbine blades, and structural optimization [22,23,24].
To enhance the measurement accuracy of the downhole turbine flow tool, the primary structures of the turbine and cascade are optimized. The Plackett–Burman experimental design is employed to screen the structural parameters, which are categorized into three levels based on their influence on the objective function: significant factors, sub-significant factors, and non-significant factors. Subsequently, the optimal design points of the structural parameters at all levels are determined using Box–Behnken design, central orthogonal experimental design, and response surface analysis. Based on the results of the CFD simulation test, an evaluation index for the stability of the measurement system is established, and the interaction effect between the structural parameters is analyzed. Through comparative analysis, the optimal model structure parameters are selected. The performance of the measurement system is significantly improved compared to the system before the optimization of each structural parameter. After optimization based on the response surface method, the stability of turbine flow measurement accuracy is improved by 34.5%. This study provides a new method for the development and optimization of downhole measurement tools.

2. Turbine Motion Mathematical Model and Analytical Methods

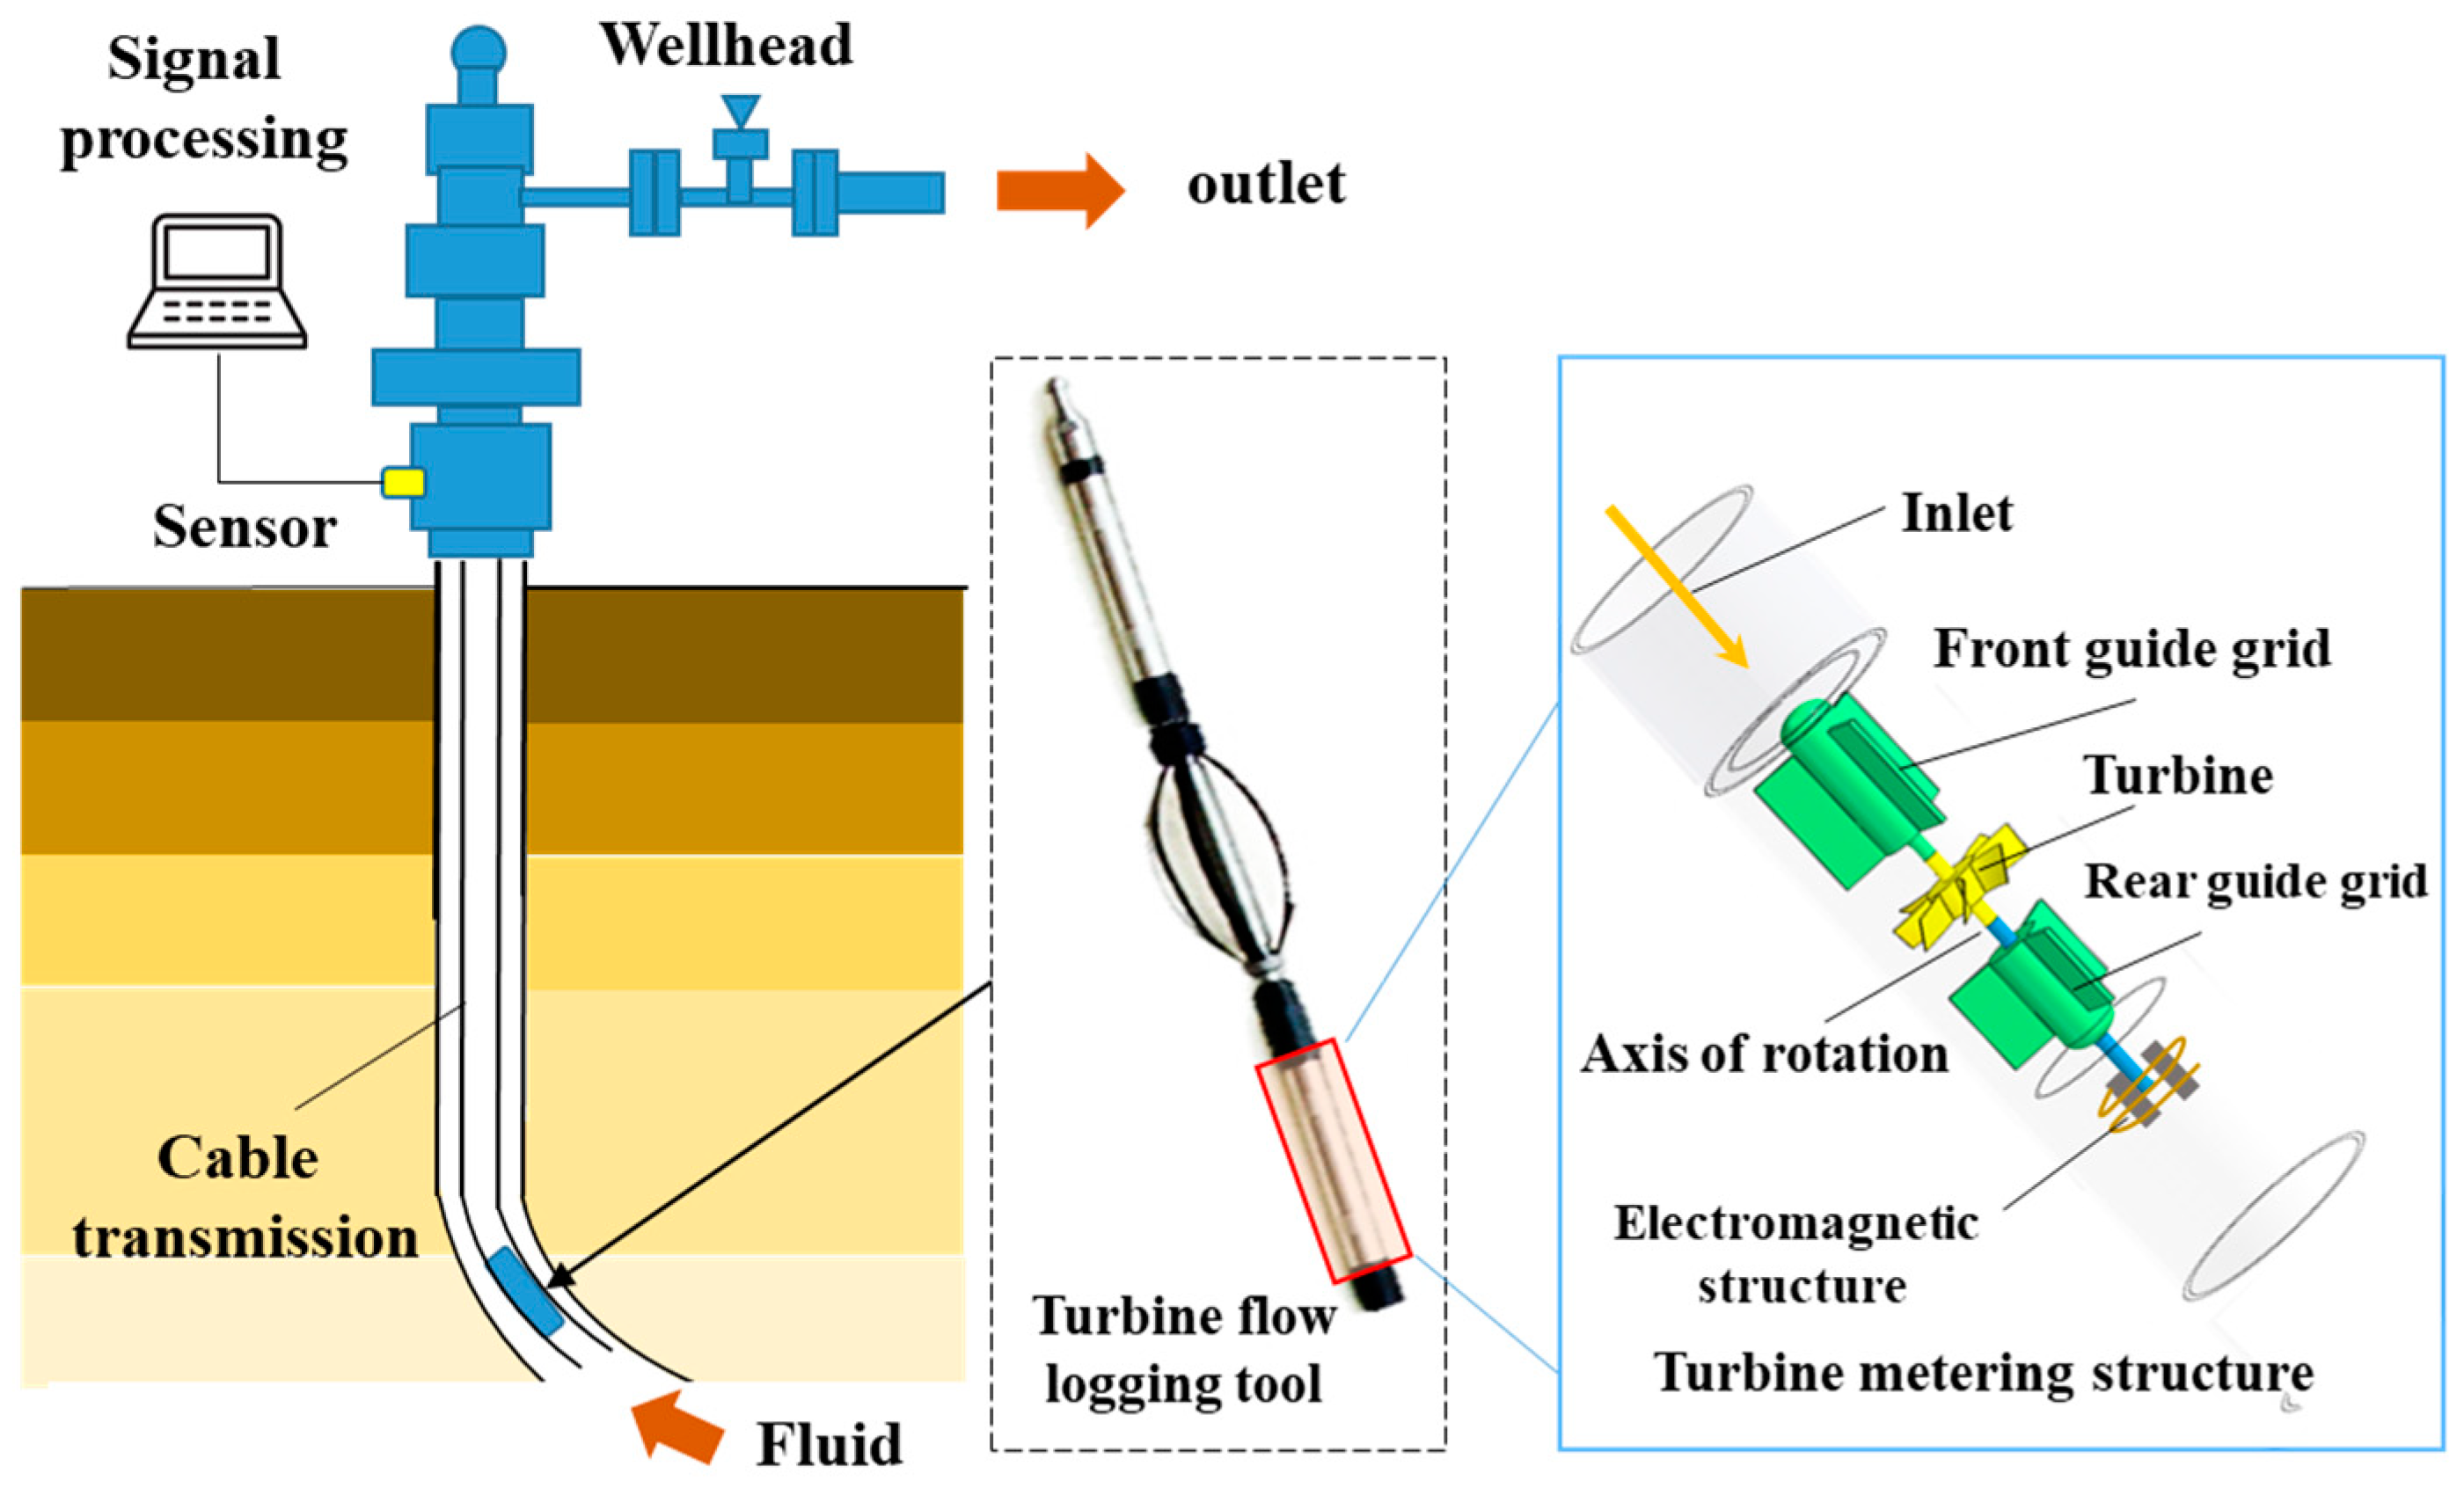
2.1. Computational Analysis Model

By analyzing the dynamic characteristics of the turbine structure during flow measurement, the following motion models can be established:
J d ω d t = M t + M w + M h + M b + M r 2 + M m
M r 2  is the viscous frictional drag torque on the blade surface;  M b  is the viscous resistance torque in the bearing-shaft clearance;  M h  is the viscous resistance torque on the peripheral surface of the hub;  M w  is the viscous resistance moment of hub end face;  M t  is the blade tip clearance viscous resistance moment; and  M m  is the mechanical friction resistance torque of the bearing. The calculation model of each part is shown in Figure 2.
The processing method of the turbine determines that the shape of the blade is a cylindrical helix. When analyzing the force and the speed of the entry and exit sections, the helical type can be expressed as a straight blade with an attack angle with the incoming flow velocity [25,26]. First, the turbine is unfolded into an in-line cascade, as shown in Figure 3. Let  u 1  be the axial flow velocity,  u 2  is the absolute velocity of the outflow,  α 1  is the angle between the upstream flow and the circumferential direction,  α 2  is the angle between the outflow and the circumferential direction,  β  is the angle between the turbine blade and the axial direction. According to the momentum theorem, the circumferential force on the turbine  f d  should be equal to the change in momentum in the circumferential direction per unit mass flow into the turbine. Therefore, the torque expression is:
f d = r ρ q v ( V z tan θ w r )
f d = ρ Q u 1 cos α 1 u 2 cos α 2
(1)
Viscous frictional drag torque on the blade surface
When the turbine rotates under the impetus of the fluid, there will be relative motion between the turbine blades and the fluid, so the blade surface will be subjected to the viscous force of the fluid on it. Considering the viscous force as the viscous friction force on the plate around the flow, the viscous force on the blade surface is obtained under laminar flow and turbulent flow, respectively. In the case of laminar flow, the formula for calculating the viscous force is:
M r 1 = C 1 ρ v 1 2 Q 1 2
In the case of turbulent flow, the viscous force is calculated as:
M r 2 = C 2 ρ v 1 7 Q 13 7
where,  C 1  is the turbine laminar flow structure coefficient;  C 2  is the turbine turbulent flow structure coefficient; V is the kinematic viscosity of the fluid.
(2)
Viscous resistance moment in bearing-shaft clearance
The turbine is equipped with rolling bearings on both ends, which are designed to support the shaft during operation. As the shaft rotates, a fluid is introduced between the shaft and the inner wall of the bearing, which creates a viscous resistance moment due to the relative movement between the fluid and the solid wall. Although the gap between the shaft and the bearing is small, the fluid flow in this narrow region can be considered to be in a laminar state [27]. This allows for the direct application of the Navier-Stokes equations to solve the flow field. To simplify the analysis, the N-S equation is used in cylindrical coordinates.
M b = 4 π R 1 2 R 2 2 R 2 2 R 1 2 L b ρ v w
(3)
Viscous resistance moment on hub surface
The viscous resistance moment acting on the turbine hub’s peripheral surface is composed of three components: the hub where the blade is situated, the hub at the blade inlet, and the hub at the blade outlet. To streamline the dynamic analysis, we introduce the concept of average relative velocity. Cascade theory reveals that the vector average of the upstream and downstream speeds of the cascade is equal to the flow velocity at an infinite distance in a single blade scenario, which we denote as  w ,
w = 1 2 w 1 + w 2
M h b = 1 2 ρ w h 2 A h R h C h t g β h cos β h
C h = 1.328 R e h 1 2 , R e h < 5000 0.074 R e h 1 3 , R e h 5000
M h f = 4 π R h 2 R 0 2 l f ρ v w R 0 2 R h 2
The viscous drag torque  M h  on the hub can be obtained:
M h = M h b + M h f
(4)
Viscous resistance moment of hub end face
On both end faces of the turbine hub, drag torque will also be generated due to the viscous friction and Coriolis force of the fluid. The moment can usually be expressed by the following formula:
M w = 1 2 ρ w 2 R h 5 C m
where  C m  is the drag coefficient of the hub end face. In laminar flow, it is negligible; in turbulent flow:
C m = 0.9822 I n R e m 2.58
In addition,  R em = w R h 2 v .
(5)
Blade tip clearance viscous drag moment
Considering that the turbine blades for flow measurement are relatively thin, the calculation formula is established by referring to the research results of Tsukamoto [28]:
M t = 1 2 ρ w R t 2 C t R t t b t N C D t
C D t = 2 R e t , R e t < 1000 0.016 R e e t 0.25 , R e t 1000
R et = w R t R 0 R t v
where Rt is the radius of the outer edge of the blade, Ct is the chord length of the outer edge of the blade, and tbt is the thickness of the blade at the outer edge of the blade.
(6)
Bearing mechanical frictional resistance torque
When the turbine starts to rotate or gradually stops rotating, there is a mixed state of coexistence of viscous friction and mechanical friction between the shaft and the bearing. In this mixed state, it is difficult to accurately calculate the mechanical friction torque. Usually, for a turbine flowmeter with a certain structure, the bearing friction resistance torque Mm can be calculated according to the following formula [29]:
M m = μ P d 2
where,  M m  represents friction torque, mN. m;  μ  represents friction coefficient; P represents the bearing load, N; d represents the nominal inner diameter of bearing, mm.

2.2. Turbine Metering Structural Optimization Evaluation Index

The relationship between the flow rate and the frequency induced by the turbine is:
q v = f k
In the formula:  q v  represents the instantaneous volume flow; f represents the pulse frequency; k represents the meter coefficient.
For the turbine flow logging tool, whose structural parameters are determined, after its stable operation, different flow rates correspond to the only different rotational speeds and frequencies f [30]. Therefore, the main factor affecting the accuracy of the flowmeter is the meter coefficient, and its expression is:
k = N 2 π t a n θ r A M t + M w + M h + M b + M r 2 + M m r 2 ρ q v 2
In the formula: N represents the number of blades; θ represents the blade helix angle; r represents the turbine radius; A represents the flow area; ρ represents the liquid density;  q v  represents the instantaneous volume flow.
The reliability of turbine metering structure is mainly based on the rotational stability of the turbine structure under steady state [31]. The measurement accuracy of the system under different working conditions is obtained through the simulation test, and the relationship between the flow rate and the turbine speed is:
K = N v π q
N represents the number of blades; q represents the inlet flow;  v  represents the average speed of the turbine under the same flow rate measured multiple times. The smaller the linearity error of the instrument coefficient, the higher the measurement accuracy, and vice versa. After calculating the simulated instrument coefficients of 4 points of 20 L/s, 25 L/s, 30 L/s, and 35 L/s by Formula (20), the linearity error ε of the instrument coefficient of the turbine flowmeter can be obtained. The calculation formula is:
ε = K m a x , i K m i n , i K m a x , i + K m i n , i × 100 %
In the formula,  K m a x , i  is the maximum value of the meter coefficient obtained by the flowmeter at five flow points;  K m i n , i  is the minimum value of the meter coefficient obtained by the flowmeter at four flow points. The accuracy of the measurement structure is evaluated by the change in ε.

3. Optimizing Analysis Methods

3.1. Model Parameters and Optimization Analysis

The optimization analysis of the turbine flow measurement structure is centered on the DN100 liquid turbine flow sensor [32]. The turbine blade structure parameters in the general turbine flowmeter are subject to certain requirements, including a blade helix angle within the range of 30°–45° (liquid), 6–8 blade numbers, a hub diameter of 8–10 mm, a blade thickness of 0.5–1 mm, and a tip clearance of 0.5–1 mm. By considering the value ranges of these structural parameters, the optimal parameter values for each parameter in the designed turbine flowmeter are presented in Table 1.
Using the Plackett–Burman climbing test design, the degree of influence of 11 factors on measurement accuracy was determined through CFD simulation analysis. The significant factors were then tested using the Box–Behnken design method, and the response surface method was employed to obtain optimal parameter values. For non-significant factors, a center compound orthogonal test was conducted to obtain the optimal parameter combination within the range of parameter quantitative analysis. The entire optimization process is illustrated in Figure 4.

3.1.1. Multivariate Significance Analysis and Experimental Design

According to the Plackett–Burman experimental design, 11 experimental factors are selected, including turbine tip radius, blade helix angle, number of turbine blades, turbine hub radius, turbine hub length, turbine lead, front deflector length, and rear deflector length and number of guide vanes. High and low levels are then set for each factor and the linearity error of the meter coefficient is taken as the response value. Table 1 presents the value range of the influencing factors [33]. To derive the performance parameter evaluation index K′, a comprehensive calculation is conducted across all working condition ranges. Polynomial fitting curves are utilized to obtain the performance curves in every working condition, and the resulting calculation outcomes undergo regression analysis to identify the extent of the influence that each factor has on the overall structure’s measurement accuracy ε.

3.1.2. Response Surface Optimization

In this study, the Box–Behnken center combination design method is utilized to investigate the relationship between turbine blade tip radius, turbine hub radius, turbine hub length, blade lead, and the linearity error of the flowmeter. Response surface optimization experiments are conducted with 29 test sites and four factors at three levels. The response surface method is employed to analyze the results of the orthogonal experiment and 11 influencing factors and to establish the functional relationship of these factors to identify the optimal value of the response.

3.2. Fluid Simulation Analysis

Currently, many experts and scholars use fluid simulation calculations to optimize flow measurement structures and verify the reliability of this method [34]. In order to bring the simulation results closer to the actual situation, Menter’s SST k-omge model is used to simulate the internal flow field of a dedicated flow meter [35,36]. The SST k-omge model not only captures the flow and boundary anisotropy well, but also better captures the distribution of pressure loss. The model equations are described below.
ρ k t + ρ u i k t = P k ρ k 3 2 l k w + x i μ + μ t δ t k x i
ρ ε + ρ u i ε t = α 2 ω k P ω β 2 ρ ω 2 + x i μ + μ t δ ω 2 k x i + 2 ρ δ ω 2 1 ω k x i ω x i
μ t = ρ m α 1 k m a x α 1 ω S F 1
where Pk P ω  are turbulent diffusion terms, F1 are mixing function, S are shear stress tensor constant terms, Sk α 1 α 2  are empirical coefficients,  ρ  is fluid density, 1300 kg/m³.  u i  is turbulent dynamic viscosity. The calculation model in Section 2 is imported to realize the passive startup of the turbine under the action of the drilling fluid, so as to achieve the dynamic stability of the turbine speed and the drilling fluid flow.
In CFD simulation software, unstructured tetrahedral mesh is used to divide the turbine watershed, diverter watershed, and the watershed of the front and rear straight pipe sections as shown in Figure 5. The computational domain is divided into three parts: front guide vane, rotor, and rear guide vane. The turbine area is set as a rotating area, and the other areas including the front and rear grate and pipes are set as static areas [35].
In Figure 6, the effect of changes in the grid division of the detection grid on the operating characteristics of the turbine under a flow rate of 25 L/s is demonstrated. The minimum value of the grid quality is 0.35, which is greater than 0.3. When the grid is at 38 × 105, the turbine efficiency is relatively stable.
Then, the volume flow of the inlet is set to 20 L/s, 25 L/s, 30 L/s, and 35 L/s. The specific parameters are shown in Table 2. These are analyzed and measured five times under different flow rates and the stability of the measurement and the measurement error of the system ε are analyzed.

4. Results and Discussion

4.1. Fluid Simulation Computational Analysis

Using an orthogonal experimental design, we selected four flow points for simulation and analyzed the impact of 11 factors and parameters on turbine speed. The mean value of the linearity error of the meter coefficient of the flowmeter was utilized as the criterion for assessment, and the optimal parameter value was selected based on this analysis.
With the four flow changes, it can be observed that as the flow rate increases, the intensity of internal turbulence also increases, as clearly depicted in Figure 7. The key areas of concern in terms of structure are the tail of the front guide grille and the hub surface of the turbine oncoming face. In accordance with Figure 8, the internal turbulence distribution exhibits a significant increase at a flow rate of 35 L/s, with the maximum value reaching 0.21 m2/s2. Any reduction in turbulent flow fluctuations within the measurement flow channel would have a direct impact on the measurement stability of the turbine. The structural modifications of the front and rear guide grids and the turbine are critical factors that influence the internal turbulence distribution and its fluctuations.
The alteration of flow has a direct impact on the fluid velocity within the internal flow channel. As the drilling fluid flow rate increases, the internal velocity change becomes more pronounced. The upper section of the velocity distribution cloud diagram exhibits a higher flow velocity, which is attributed to the asymmetric distribution of the front and rear guide vanes [37]. The velocity distribution within the middle and lower flow channels depicted in Figure 9 cross-sectional velocity cloud diagram is found to be uniformly distributed. Additionally, the velocity distribution at the front guide grid position exhibits a relatively uniform distribution.
The relationship between the rotational frequency of a turbine and the measured flow rate is proportional. This phenomenon can be explained by the momentum theorem, which states that the driving torque exerted on the turbine blade is dependent on the structural parameters of the blade. Figure 10 shows the velocity distribution clouds obtained at the front, middle, and back of the turbine for different numbers of blades at a flow rate of 30 L/s. The results of this experiment confirm the previously mentioned distribution law regarding the pressure exerted on turbine blades.
In Figure 11, it can be observed that the 8−blade turbine experiences the highest pressure among the tested turbines under the same flow rate, whereas the 6-blade turbine exhibits the smallest overall average pressure distribution [38]. The blade pressure distribution is found to be symmetric along the radial direction. Furthermore, an increase in the internal flow rate leads to a gradual rise in blade pressure, resulting in an increase in the radial force of the pressure acting on the blades and ultimately leading to an increase in turbine speed.

4.2. Parametric Significance Analysis

Utilizing the Plackett–Burman experimental design, a climbing orthogonal test was conducted to investigate the aforementioned influencing factors. Each factor was assigned two levels, high and low, and the instrument coefficient’s linearity error was measured as the response variable. The experimental design’s factors and levels are presented in Table 3. The impact of the independent variable factors was evaluated through the orthogonal test, and the degree of influence was determined. The results of the PB test, including the influence of various factors, are displayed in Table 4.
Among the parameters evaluated in this study, it was found that the thickness of the guide vane, the number of blades, the turbine lead, the blade helix angle, the tip clearance, and the distance between the turbine and the guide grid have significant negative impacts on the system. Conversely, the length of the rear guide piece, the length of the front guide piece, the tip clearance, the turbine hub radius, and the number of guide vanes have a significant positive effect. Based on the degree of influence of various factors, we have ranked them in the following order from high to low: number of blades, turbine lead, blade helix angle, blade tip clearance, blade thickness, turbine hub radius, length of front guide fence, rear guide fence length, turbine and front and rear guide fence lengths, thickness of the guide vane, and the number of guide vanes. Among the various factors that affect the overall degree, the number of blades, turbine lead, blade tip clearance, and blade helix angle are particularly noteworthy due to their significant impact. These four groups of factors have undergone thorough analysis and have been identified as key contributors to the overall performance. Additionally, blade thickness, turbine hub radius, and the length of the front deflector are also significant factors that warrant careful consideration.
In Table 5, our analytical model demonstrates a significant F value of 22.41, with only a 3% probability that it cannot be explained. Figure 12 further supports the significance of the model, with the p values of the seven factors analyzed. Notably, the number of blades, turbine lead, and blade helix angle all exhibit p values less than 0.05, indicating their importance to the model. Additionally, the predicted R2 value of 0.96 provides a reasonable explanation for the change in the correction coefficient of determination  R A d j 2  = 0.859. Overall, our model effectively captures the impact of each factor and accurately represents their changes.
To further scrutinize the influential factors, we conducted an experimental analysis and the results are presented in Table 6. The statistical analysis revealed that all the p values of the factors were less than 0.05, signifying the importance of the analyzed system. The significance levels of the three factors were found to be consistent with the findings of Table 3.

4.2.1. Significant Factor Response Surface Optimization

The Box–Behnken center combination design method was employed to investigate the significant influencing factors mentioned above. The independent variables were identified as the number of blades, tip clearance, blade helix angle, turbine lead, and radius, while the response value was the linearity error of the instrument coefficient. The remaining structural parameters were kept constant, and a response surface optimization experiment was conducted with four factors and three levels, comprising 29 experimental points [35]. The results of the interaction among the various factors are presented in Figure 13.
Optimization parameter results are as follows: the blade helix angle is 42.5°; the number of blades is 7; the impeller lead is 21; blade tip clearance is 0.75 mm; and blade tip clearance 0.8 mm. In the orthogonal experiment, the value of the missing-fit term of the analytical model is 0.0919 > 0.05, which is not significant, indicating that the predicted value and the measured value have a high degree of fit within the experimental range. Thus, this regression equation can be selected to analyze the experimental results. Fitted with a quadratic regression equation with cross terms, the regression equation for optimizing the linearity error R of the model is:
R = 1.93 + 0.31 × A 0.40 × B 0.037 × C 0.12 × D + 0.046 × A B + 0.088 × A C + 0.032 × A D 0.065 × B C + 0.011 B D 0.19 × C D + 0.40 × A 2 + 0.12 × B 2 + 0.23 × C 2 + 0.27 × D 2
The head gap between blades plays a crucial role in determining the rotational speed of the turbine. A wider head space between the blades results in an uneven pressure distribution inside the sensor, leading to a relative increase in the turbine speed. Conversely, if the head gap is too narrow, the velocity field will be unevenly distributed, and the fluid velocity before and after the blade will decrease. Additionally, a larger head gap between the blades leads to a greater pressure loss, and there exists a linear relationship between the head gap and the pressure loss. Therefore, optimizing the head gap between blades is essential for achieving maximum efficiency in turbine performance.
The blade helix angle is a crucial parameter that significantly impacts the flow field. A higher inclination angle leads to a reduction in the high-pressure area on the blade’s flow surface while increasing the low-pressure area on the backside. Furthermore, as depicted in Figure 13, a larger blade helix angle results in a higher velocity gradient and reduced fluidity. Therefore, it is essential to carefully consider the blade helix angle during the design and optimization of fluid machinery. Furthermore, it is worth noting that as the blade helix angle increases, the pressure loss also increases, though an anomalous point is observed at high flow rates. Based on the results obtained, it can be inferred that the turbine efficiency is optimized when the blade helix angle is set to 42.5°. A graphical representation of the turbine efficiency at varying blade helix angles is depicted in Figure 14. After conducting the simulation test, it was found that the turbine efficiency was higher when the number of turbine blades was 7, as depicted in Figure 15. This finding is in line with the results obtained from the response surface optimization analysis.

4.2.2. Response Surface Optimization for Sub-Significance Factors

After the optimization of the aforementioned significant factors, the sub-significant influencing factors, namely the length of the front guide grille, the radius of the hub, and the thickness of the turbine blade, were subjected to the Box–Behnken center combination design method. In this study, we employed a three-factor three-level response surface optimization analysis group. Our experimental results demonstrate that the model p value of 0.0005 is less than the accepted threshold of 0.05, indicating a high level of overall significance for the model. Additionally, the lack-of-fit item 0.197 is greater than 0.05, which is not statistically significant. This suggests that the predicted values and the measured values are highly correlated within the test range, and the regression equation can be used to analyze the test results. Specifically, the regression equation for the linearity error R is:
R = 1.77 0.16 A + 0.17 B + 0.17 C 0.16 A B + 0.16 A C 0.07 B C 0.8 A 2 0.61 B 2 0.15 C 2 + 0.27 D 2
The response surface interaction test results, as depicted in Figure 16, reveal that the optimal parameters for the three factors are as follows: the length of the front guide fence is 115 mm, the hub radius is 9 mm, and the turbine blade thickness is 1.5 mm.

4.2.3. Orthogonal Experiment Optimization of Non-Significant Factors

The present study investigates the impact of four independent variables, namely the length of the rear guide grid, the length of the turbine and the front and rear guide grids, the thickness of the guide grid blades, and the number of guide grid blades, on the linear error response value. To systematically explore these factors, an orthogonal experiment was designed using the L9 (3) method, which is a widely adopted approach for conducting such experiments. The experimental design and corresponding levels are presented in Table 7.
As shown in Table 8, the mean value 2 corresponding to the length of the rear guide grid is the smallest, indicating that the linearity error exhibited by it is the smallest. As shown in Figure 17, the system stability is best when the thickness of the guide vanes and the number of guide vanes correspond to the second and third levels. Therefore, the optimal combination is: the length of the rear guide grid is 90 mm, the distance between the turbine and the guide grid is 25 mm, the thickness of the guide grid blades is 2 mm, and the number of the guide grid blades is 3 pieces.

4.3. Performance Test Comparison after Optimization

The fluid simulation was utilized to analyze the optimized parameters. Table 9 presents the optimal parameter combination for each influencing factor following the optimization process. Based on the optimized parameters, a CFD simulation analysis was conducted to evaluate the impact of changes in related parameters on the original structure, and to compare the optimization effect.
Upon comparing the cloud diagrams of turbulent flow distribution, shown in Figure 7 and Figure 18, for the turbine measurement pipeline before and after optimization, it can be inferred that the turbulent flow phenomenon in the turbine measurement flow channel has been considerably mitigated post-optimization. Specifically, the turbulence levels at the front and rear guide grids have been visibly reduced, and the turbulence generated by the optimized wall effect has also been significantly decreased.
After optimization, the internal velocity distribution (b) in Figure 19 appears to be smoother compared to the uneven distribution (a) before optimization, as depicted in Figure 9. Moreover, there is no discernible whirl in the flow. Before optimization, the flow channel exhibited relatively high velocity in the front and rear guide grids. The high velocity of the oncoming surface of the turbine leads to a greater impact force on the turbine, causing instability when the flow changes. Consequently, the accuracy of the measurements becomes compromised. To address this issue, the front and rear guide grids can be designed to regulate the fluid viscosity and Reynolds number. Furthermore, the structure of the annular channel cross section can be modified to reduce the variation in fluid velocity profile at the turbine flowmeter blade inlet, thereby enhancing measurement stability.
Compared with before optimization, the measurement accuracy after optimization is significantly improved. The overall change in the measuring instrument coefficient k’ under the four flow rates is relatively stable, and the measurement repeatability of each measurement point is good, generally 0.09% to 0.4%; the curve is shown in Figure 20. It is verified that the measurement accuracy of the optimized model is better than that before optimization. Meter coefficient linearity error ε is improved by 34.5% relative to before optimization at the average flow rate. The optimized structural parameters have higher measurement stability in this flow range, which improves the overall flow measurement accuracy.

5. Conclusions

This study designed and optimized the turbine flow well logging tool, resulting in a significant improvement in the overall accuracy and stability of flow measurement. The feasibility of optimizing the turbine flow meter was validated through the combination of fluid simulation calculations and numerical statistical analysis. The main conclusions are as follows: (1) This study established a dynamic mathematical model and utilized fluid simulation to analyze the internal fluid state distribution and changes in relevant parameters of turbine flow meters, such as turbine efficiency, providing a basis for optimization analysis.
(2) The significant and secondary significant parameters affecting the measurement accuracy of the turbine flowmeter structure were analyzed using the Plackett–Burman method. In addition, the influencing parameters were tested using the Box–Behnken design method, and a multiple regression model of the linear error of the turbine flowmeter was established. The results showed that the regression model could adapt well to the actual situation, verifying the reliability of response surface methodology for optimizing downhole flow measurement tools.
(3) The results indicate that the main factors affecting the measurement are the top radius of the impeller, the number of impeller blades, the shaft radius, and length of the impeller. By optimizing the dynamic performance of the turbine flow measurement, significant improvements were achieved. Compared to the original structure, the stability of the optimized turbine flow measurement accuracy increased by 34.5%.

Author Contributions

Conceptualization, J.Q. and Q.X.; Methodology, J.Q.; Software, J.W. and J.Q.; Validation, J.Q.; Formal analysis, J.W.; Investigation, J.L.; Resources, J.S.; Data curation, J.Q.; Writing—original draft preparation, J.Q.; Writing—review and editing, J.Q. and Q.X.; Visualization, J.L.; Project administration, Q.X.; Funding acquisition, Q.X. All authors have read and agreed to the published version of the manuscript.

Funding

This work was supported by the Natural Science Foundation of China (42072341).

Data Availability Statement

All the data are shown in the tables and figures of this paper.

Conflicts of Interest

The authors declare no conflict of interest.

Nomenclature

  T r Push torque, N.m
  T r m Mechanical frictional resistance torque, N.m
  T r f Fluid resistance torque, N.m
  u 1 Axial flow velocity, m/s
  u 2 Absolute velocity of outflow, m/s
  α 1 The angle between the upflow and the circumferential direction, °
  α 2 The angle between the outflow direction and the circumferential direction, °
MmBearing friction resistance torque, N.m
AThe flow area of the stator orifice, m2
As(t)Stator and rotor axial clearance overflow area, m2
  μ Drilling fluid viscosity, pa.s
  q v Instantaneous volume flow, L/s
  f Turbo pulse frequency, Hz
eTip clearance, mm
Nnumber of turbine blades
  θ Blade helix angle, °
  H 2 rear deflector length, mm
  d d Deflector thickness, mm
urTurbulent Dynamic Viscosity, Pa.s
SShear Stress Tensor Constant Term
  T r e Disc valve reaction resistance torque, N.m
  β The angle between the turbine blade and the axial direction, °
  f d Turbine circumferential force, N
  C m Wheel hub end face drag coefficient
  R t Blade outer edge radius, mm
  C t Chord length of outer edge of blade, mm
  t b t Blade thickness at the outer edge of the blade, mm
  ρ Drilling fluid density, kg/m3
  e Stator and rotor axial clearance, mm
  q Drilling fluid flow, L/s
aPropagation speed of water hammer pressure wave, m/s
kMeter factor
  H 1 Front deflector length, mm
  d Y Turbine Blade Thickness, mm
  N 1 Number of guide vanes, mm
LTurbine lead, mm
  R 0 Turbine Hub Radius, mm
  L 2 Turbine and guide grid spacing, mm
  R A d j 2 Corrected coefficient of determination
  ε mean measurement error

References

  1. Wang, C. Study on Flow Measurement Technology of Multiphase Flow Frequency Difference Method; Xi’an Shiyou University: Xi’an, China, 2021. [Google Scholar] [CrossRef]
  2. Mehdi, G.; Qiu, X.; Gallyam, A.; Mustapha, A. Streaming potential measurements for downhole monitoring of reservoir fluid flows: A laboratory study. J. Pet. Sci. Eng. 2018, 161, 38–49. [Google Scholar] [CrossRef]
  3. Hongwei, S.; Haimin, G.; Shuai, G. Partial phase flow rate measurements for stratified oil-water flow in horizontal wells. Pet. Explor. Dev. 2020, 47, 613–622. [Google Scholar]
  4. Nalmis, H. Flow Measurement Optimization Using Surface Measurements and Downhole Sound Speed Measurements from Local or Distributed Acoustic Sensors. SPE Prod. Oper. 2021, 36, 437–450. [Google Scholar] [CrossRef]
  5. Nozomu, Y.; Hill, A.; Ding, Z. Comprehensive Modeling of Downhole Temperature in a Horizontal Well with Multiple Fractures. SPE J. 2018, 23, 1580–1602. [Google Scholar] [CrossRef]
  6. Ren, Z.; Zhou, W.; Li, D. Investigation on pressure fluctuations of dual—And analogical single-rotor turbine flowmeters. Proc. Inst. Mech. Eng. 2022, 236, 7166–7178. [Google Scholar] [CrossRef]
  7. Liu, Q.; Zhuang, S.; Bao, H.; He, Z.; Wang, K.; Liu, H. The Optimization of a First-Stage Liquid-Sealing Impeller Structure for a Turbopump Based on Response Surface Methodology. Processes 2022, 10, 1999. [Google Scholar] [CrossRef]
  8. Maël, B.; Johan, B.; Laura, V.; Ainhoa, R.C.; Edwin, C. Design optimization of an Archimedes screw turbine for hydrokinetic applications using the response surface methodology. Renew. Energy 2021, 172, 941–954. [Google Scholar] [CrossRef]
  9. Sarallah, A.; Afshin, G. Performance optimization of an axial turbine with a casing injection based on response surface methodology. J. Braz. Soc. Mech. Sci. Eng. 2021, 43, 435. [Google Scholar] [CrossRef]
  10. Al-Manie, M.A.; Wang, W.J. Turbine Flowmeter Condition Monitoring using Evolutionary Spectral Analysis. Proc. Natl. Acad. Ences India 2015, 85, 451–455. [Google Scholar] [CrossRef]
  11. Rusin, K.; Wróblewski, W.; Rulik, S. Efficiency based optimization of a Tesla turbine. Energy 2021, 236, 121448. [Google Scholar] [CrossRef]
  12. Gu, Y.-F.; Zhao, Y.; Lv, R.-Q.; Yang, Y. Theory and structure of a modified optical fiber turbine flowmeter. Flow Meas. Instrum. 2016, 50, 178–184. [Google Scholar] [CrossRef] [Green Version]
  13. Zhang, X.; Li, J.; Gong, Y. Optimization of the design of a turbine flowmeter based on the response surface method and orthogonal tests. J. Beijing Univ. Chem. Technol. 2019, 46, 80–86. [Google Scholar] [CrossRef]
  14. Lu, J.; Tang, Y.; Cheng, J. Optimization and analysis of oblique-hitting water turbine based on orthogonal experiment. Chin. J. Drain. Irrig. Mech. Eng. 2019, 37, 38–42. [Google Scholar]
  15. Mou, B.; He, B.J.; Zhao, D.X.; Chau, K.W. Numerical simulation of the effects of building dimensional variation on wind pressure distribution. Eng. Appl. Comput. Fluid Mech. 2017, 11, 293–309. [Google Scholar] [CrossRef] [Green Version]
  16. Wang, L. Study on Axial Turbine Airfoil Design Based on Response Surface Method; Dalian University of Technology: Dalian, China, 2020. [Google Scholar]
  17. Song, X.W.; Qi, Y.C. Application and optimization of drag reduction characteristics on the flow around a partial grooved cylinder by using the response surface method. Eng. Appl. Comput. Fluid Mech. 2019, 13, 158–176. [Google Scholar] [CrossRef] [Green Version]
  18. Li, G.; Dai, J.; Zhang, F.; Zuo, C. New Two-BWT Blade Aerodynamic Design and CFD Simulation. Machines 2023, 11, 399. [Google Scholar] [CrossRef]
  19. Wang, C.; Peng, H.; Ding, J. Optimization for vortex pump based on response surface method. Nongye Jixie Xuebao/Trans. Chin. Soc. Agric. Mach. 2013, 44, 59–65. [Google Scholar]
  20. Miao, X.D. Research on Flow Field Characteristics and Measurement Performance of Turbine Flowmeter; Shandong University: Jinan, China, 2019. [Google Scholar]
  21. Zhu, Y.; Chi, Q.; Gong, Y.; Guo, S.; Wang, F. Structural optimization to improve the dynamic performance of turbine flowmeters. Measurement 2023, 213, 112698. [Google Scholar] [CrossRef]
  22. Ren, Z.; Zhou, W.; Li, D. Response and flow characteristics of a dual-rotor turbine flowmeter. Flow Meas. Instrum. 2022, 83, 102120. [Google Scholar] [CrossRef]
  23. Jazni, J.; Cova, W.; Salomone, J.E.; Gonzalez, G. Development of a liquid flow meter for aerospace instrumentation. IEEE Lat. Am. Trans. 2013, 11, 155–161. [Google Scholar] [CrossRef]
  24. Yuan, Y.; Zhang, T. Research on the dynamic characteristics of a turbine flow meter. Flow Meas. Instrum. 2017, 55, 59–66. [Google Scholar] [CrossRef]
  25. Xue, Q.; Leung, H.; Huang, L.; Zhang, R.; Liu, B.; Wang, J.; Li, L. Modeling of torsional oscillation of drillstring dynamics. Nonlinear Dyn. 2019, 96, 267–283. [Google Scholar] [CrossRef]
  26. Chen, X. The Structure Optimal Design for Turbine Flow Meters Based on CFD; Northeast Petroleum University: Daqing, China, 2015. [Google Scholar]
  27. Tsukamoto, H.; Hutton, S.P. Theoretical prediction of meter factor for a helical turbine flowmeter. In Proceedings of the Conference of Fluid Control and Measurement, Tokyo, Japan, 2–5 September 1985; Pegramon Press: Oxford, UK, 1986; pp. 973–978. [Google Scholar]
  28. Feng, Y.; Ren, J.Q.; Wang, Y.H. Research on Improvement of Front Diversion Body of Turbine Flowmeter Based on Fluent. Chin. J. Sens. Actuators 2021, 34, 663–669. [Google Scholar]
  29. Sun, L. Research on Reducing Turbine Flowmeter’s Sensitivity to Viscosity Change; Tianjin University: Tianjing, China, 2004. [Google Scholar]
  30. Wang, B.; Du, Y.; Xu, N. Simulation and experimental verification on dynamic calibration of fuel gear flowmeters. Measurement 2019, 138, 570–577. [Google Scholar] [CrossRef]
  31. Liu, Y.; Zhang, T.; Zhang, M.; Zhang, M. Numerical and experimental investigation of aerodynamic performance for a straight turbine cascade with a novel partial shroud. ASME J. Fluids Eng. 2016, 138, 031206. [Google Scholar] [CrossRef]
  32. Lizarraga-Garcia, E.; Buongiorno, J.; Al-Safran, E. Computational Fluid Dynamics (CFD) Simulations of Taylor Bubbles in Vertical and Inclined Pipes with Upward and Downward Liquid Flow. SPE J. 2021, 26, 3832–3847. [Google Scholar] [CrossRef]
  33. Jia, C.; Cheng, X.; Zhang, C.; Qin, Y.; Cheng, X.; Li, L. Common Flow Meters and Their Applications in Oil and Gas Fields; Petroleum Industry Press: Beijing, China, 2021. [Google Scholar]
  34. Zhang, J.-X.; Zhang, J.-Y.; Zhou, Y.; Cheng, Z.-Y.; Cao, G.-D. Investigation on the performance of a helico-axial multiphase pump under slug flow. Pet. Sci. 2022, 19, 1812–1824. [Google Scholar] [CrossRef]
  35. Li, Z.; Zhang, Y. Numerical Simulation of Flow in Flowrate Measurement Section of Natural Gas Pipelines. Pet. Sci. 2006, 3, 79–85. [Google Scholar]
  36. Wang, M.; Zheng, D.; Xu, Y. A new two-fluid model for flow rate measurement of annular flow in horizontal pipe. Measurement 2022, 196, 111224. [Google Scholar] [CrossRef]
  37. Dilgen, C.B.; Dilgen, S.B.; Fuhrman, D.R.; Sigmund, O.; Lazarov, B.S. Topology Optimization of Turbulent Flow. Comput. Methods Appl. Mech. Eng. 2018, 331, 363–393. [Google Scholar] [CrossRef] [Green Version]
  38. Thakkar, S.; Vala, H.; Patel, V.; Patel, R.S. Performance improvement of the sanitary centrifugal pump through an integrated approach based on response surface methodology, multi-objective optimization and CFD. J. Braz. Soc. Mech. Sci. Eng. 2021, 43, 24. [Google Scholar] [CrossRef]
Figure 1. Schematic Diagram of Working Process Turbine Flow Well Logging Tool.
Machines 11 00455 g001
Figure 2. Mathematical model of mechanical turbine flowmeter operation.
Machines 11 00455 g002
Figure 3. Schematic diagram of the force of the passive motion of the turbine.
Machines 11 00455 g003
Figure 4. Flow chart of optimization design analysis.
Machines 11 00455 g004
Figure 5. Turbine flowmeter profile domain and boundary condition model with boundary conditions.
Machines 11 00455 g005
Figure 6. Robustness Analysis of Simulation Process.
Machines 11 00455 g006
Figure 7. Cloud map of internal turbulent kinetic energy distribution under four flow rates.
Machines 11 00455 g007
Figure 8. Maximum turbulent kinetic energy and dynamic axial velocity under four flow rates.
Machines 11 00455 g008
Figure 9. Cloud map of instantaneous dynamic axial velocity distribution under four flow rates.
Machines 11 00455 g009
Figure 10. Cloud map of velocity distribution at different positions of the turbine. (a) 6−blade turbine velocity distribution cloud map. (b) 7−blade turbine velocity distribution cloud map. (c) 8−blade turbine velocity distribution cloud map.
Machines 11 00455 g010
Figure 11. Surface pressure distribution of blades with different number of blades. (a) 6−blade turbine stress distribution cloud map. (b) 7−blade turbine stress distribution cloud map. (c) 8−blade turbine stress distribution cloud map.
Machines 11 00455 g011
Figure 12. Experimental p value of each factor.
Machines 11 00455 g012
Figure 13. Four-factor interaction curve and contour map.
Machines 11 00455 g013
Figure 14. Turbine rotational efficiency at different helix angles.
Machines 11 00455 g014
Figure 15. Turbine efficiency corresponding to different number of blades.
Machines 11 00455 g015
Figure 16. Three-factor interaction curve and contour map. (a) Interaction of blade thickness K1 and turbine hub radius K2. (b) Interaction of blade thickness K1 and front guide grid K3. (c) The interaction between the turbine hub radius K2 and the front spoiler K3.
Machines 11 00455 g016
Figure 17. Five-factor three-level average comparison.
Machines 11 00455 g017
Figure 18. Cloud map of cross-section turbulence distribution (30 L/s).
Machines 11 00455 g018
Figure 19. Comparison of internal fluid velocity traces. (a) Before optimization internal velocity distribution. (b) The optimized internal velocity distribution.
Machines 11 00455 g019
Figure 20. Change curve of instrument coefficient linearity error before and after optimization.
Machines 11 00455 g020
Table 1. Influencing factors and horizontal parameter values.
FactorUnitLevel
−11
  Tip   clearance d mm0.51
Number of turbine blades Nmm68
  Blade   helix   angle   θ °40°45°
  Front   deflector   length   H 1 mm80150
  Turbine   Blade   Thickness   d Y mm0.51
  Number   of   guide   vanes   N 1 mm35
Turbine lead Lmm2022
  Turbine   Hub   Radius   R 0 mm810
  Rear   deflector   length   H 2 mm80100
  Deflector   thickness   d d mm13
  Turbine   and   guide   grid   spacing L 2 mm1535
Table 2. Process parameters of simulation experiment.
ParameterValueParameterValue
Flow range20–35 L/sDevice outer diameter135 mm
Maximum working pressure5 MPaMinimum working pressure0.2 MPa
Drilling fluid density1200 kg/m3Drilling fluid viscosity8 Pa·s
  Bearing   friction   coefficient   μ 0.0005Turbine materialStainless steel
Table 3. Fluid simulation results.
Flow (L/s)20253035
Rotating speed (rpm)95–99125–130145–155173–182
K0.2–0.210.212–0.220.205–0.2190.209–0.218
  ε 0.0240.01850.0330.021
Table 4. Influence degree of factors.
FactorSum of Mean SquaresEffectInfluences %
Rear   deflector   length   H 2 /mm0.250.292.54
Front   deflector   length   H 1 /mm0.350.343.77
Guide   vane   thickness   d d /mm0.065−0.150.70
Number of turbine blades N 2.80−0.9730.50
Turbine lead L/mm2.48−0.8925.83
Blade   thickness   d Y /mm0.72−0.497.82
Blade   helix   angle   θ /mm1.020.5911.23
Tip   clearance   d /mm1.05−0.5710.73
Turbine   Hub   Radius   R 0 /mm0.460.395.05
  Number   of   guide   vanes   N 1 0.0280.0970.30
Turbine   and   guide   grid   spacing   L 2 /mm0.12−0.21.31
Table 5. Significance table of experimental factors of significant influencing factors.
FactorSum of Mean SquaresDegrees of FreedomMean SquareF Valuep ValueSalience
Model9.19110.8722.410.03Significant
Number of leaves H12.812.8103.050.008****
Turbine lead H22.4812.4889.430.015***
Blade helix angle H31.0511.0561.300.019**
Tip clearance H41.0211.0252.710.025*
residual1.2140.24
Corrected sum17.7511
  R 2 0.96
  R A d j 2 0.859
Table 6. Significance table of experimental factors of more significant influencing factors.
FactorMean Square SumDegrees of FreedomMean SquareF Valuep Value
Blade thickness K10.7210.7240.350.032
Turbine hub radius K20.5610.5623.400.040
Front deflector length K30.4510.456.970.047
Table 7. Orthogonal experimental factors and levels.
FactorLevel
123
The length of the rear guide grille8090100
Turbine and front and rear spoiler lengths152535
Guide vane thickness123
Number of guide vanes543
Table 8. Orthogonal experiment results and mean.
Serial NumberThe Length of the Rear Guide Grille/L1Turbine and Front and Rear Spoiler Lengths/L2Guide Vane Thickness/L3Number of Guide Vanes/L4Response/%
18015150.082
28025240.086
38035330.081
49015230.055
59025350.056
69035140.064
710015340.076
810025130.067
910035250.069
Mean 10.0830.0710.0710.069
Mean 20.0580.0690.0700.075
Mean 30.0700.0710.0710.067
Table 9. Parameter values after system optimization.
ParameterParameter ValueParameterParameter Value
Number of leaves7Turbine lead/mm21
Blade helix angle/°42.5tip clearance/mm0.75
blade thickness/mm1.5Turbine Hub Radius/mm9
Front spoiler length/mm115The length of the rear guide grille/mm90
Turbine and front and rear spoiler lengths/mm25Guide vane thickness/mm2
Number of guide vanes3
Disclaimer/Publisher’s Note: The statements, opinions and data contained in all publications are solely those of the individual author(s) and contributor(s) and not of MDPI and/or the editor(s). MDPI and/or the editor(s) disclaim responsibility for any injury to people or property resulting from any ideas, methods, instructions or products referred to in the content.

