Article

Quasi-Zero Stiffness Isolator Suitable for Low-Frequency Vibration

1
State Key Laboratory of Robotics and System, Harbin Institute of Technology, Harbin 150001, China
2
Yangtze River Delta HIT Robot Technology Research Institute, Wuhu 241000, China
3
School of Astronautics, Harbin Institute of Technology, Harbin 150001, China
4
Tianjin Key Laboratory of Microgravity and Hypogravity Environment Simulation Technology, Tianjin 300301, China
*
Author to whom correspondence should be addressed.
Machines 2023, 11(5), 512; https://doi.org/10.3390/machines11050512
Submission received: 23 March 2023 / Revised: 19 April 2023 / Accepted: 24 April 2023 / Published: 26 April 2023
(This article belongs to the Section Machine Design and Theory)

Abstract

:
This paper proposes a quasi-zero stiffness (QZS) isolator based on an inclined trapezoidal beam to explore its advantages in low-frequency passive vibration isolation. The nonlinear stiffness of the inclined trapezoidal beam due to the buckling effect is investigated through finite element simulation, and a linear positive stiffness spring is connected in parallel to form a QZS isolator with high-static and low-dynamic stiffness performance. The natural frequency of the isolator in the QZS region is simulated and analyzed, and the dynamic response of the QZS isolator under different damping ratios, excitation and load conditions is explored. The prototype of the QZS isolator was manufactured, and a static compression experiment was conducted to obtain its nonlinear stiffness. The dynamic experiment results verify the correctness of the simulation conclusions. The simulation and experimental data demonstrate that the QZS isolator has the characteristics of lower initial isolation frequency compared with the equivalent linear isolator. The proposed QZS isolator has an initial isolation frequency of 2.91 Hz and achieves a 90% isolation efficiency at 7.02 Hz. The proposed QZS isolator has great application prospects and can provide a reference for optimizing low-frequency or ultra-low-frequency isolators.

1. Introduction

Low-frequency vibration is a challenge in many engineering fields [1,2]. Structural damage or system performance degradation can occur due to low-frequency vibrations. Therefore, in many fields, such as aerospace [3], medical equipment [4], ultra-precision machining [5], etc., low-frequency vibration control is a central issue. Vibration control methods include active control [6,7,8], semi-active control [9,10,11], and passive control [12,13,14]. Active control requires high-precision sensors, controllers, and actuators, and semi-active control requires precise adjustment and design of the control method, which significantly increases the system’s complexity. Passive vibration isolation technology is widely used because of its simple structure and high reliability.
The initial isolation frequency of a linear isolator is 2 times its natural frequency [15,16]. In other words, a lower natural frequency is required to achieve low-frequency isolation using a linear isolator. However, reducing the stiffness of the linear isolator can weaken its stability. Therefore, a quasi-zero stiffness (QZS) isolator with high static stiffness and low dynamic stiffness is required [17,18,19,20]. In addition, mechanisms with QZS characteristics also be applied to energy-free systems [21,22,23] or constant-force generators [24,25,26]. Tong et al. [27] proposed a compliant constant force mechanism based on finite element analysis and a multi-objective genetic algorithm, which can be applied to compliant constant-force microgrippers. Zhang et al. [28] designed a quasi-constant force mechanism based on a curved beam to achieve a quasi-constant force output with a large motion stroke and improved the existing design by using a multi-segment curved beam model and finite element method. Scholars interested in constant-force mechanisms can refer to the literature [25,26,29]. At present, there are two main methods for designing QZS [30]: one is to provide a QZS region for nonlinear stiffness by optimizing the geometric shape of the elastic element [31]; another is to meet the QZS characteristics by connecting negative stiffness and positive stiffness in parallel [32]. This design method has higher flexibility, and the structural parameters of the QZS isolator can be flexibly adjusted according to actual application conditions. Zhang et al. [33] designed a QZS metamaterial to achieve nonlinear force-displacement curves with multiple QZS regions. Vibration experimental tests confirm the low-frequency vibration isolation capability of the proposed isolator. Gong et al. [34] proposed a new type of geometric anti-spring isolator, used dimensionless optimization of its structural parameters, and studied its stiffness nonlinearity. Afterward, Gong et al. [35] conducted a dynamic test on the geometric anti-spring isolator to explore the influence of parameters such as excitation acceleration amplitude, load, and damping on the vibration isolation performance. Zhou and Wang et al. [36,37] analyzed a QZS curved beam to study the attenuation of low-frequency waves and underwater sound insulation. Due to the special performance of the QZS curved beam, it can also be used to design QZS isolators and is also suitable for low-frequency conditions. Yu et al. [38] designed a QZS structure for vibration isolation under strong acceleration shock excitation by paralleling negative stiffness fixed guide beams and positive stiffness Roberts configuration compliant beams. Experiments showed that this structure exhibits good full-stroke constant-force characteristics during the isolation process.
At present, mechanisms to achieve negative stiffness mainly include mechanical springs [39,40], pre-buckled beams [41], geometrically nonlinear structures [42], magnetic structures [43,44], and composite material structures [45]. Linear springs and magnetic repulsion provide positive stiffness. Carrella et al. [46] analyzed the relationship between the stiffness of a QZS isolator composed of two inclined springs and one vertical spring and the geometry of the springs. Xie et al. [47] used an electromagnetic spring providing negative stiffness and a pneumatic spring providing positive stiffness in parallel to form a QZS isolator. Among them, the stiffness spring can adjust the system’s stiffness by changing the pressure and coil current, so the QZS isolator can adapt to variable loads and expand the application conditions. Qi et al. [48] used parallel sliding beams and magnetic repulsion to form a magnetically modulated sliding structure. The static experiment of its prototype verifies the effectiveness of realizing QZS, and the dynamic experiment results show that the initial vibration isolation frequency is 4 Hz. Zhang et al. [49] designed a compact magnetic Halbach isolator with high negative stiffness from the perspective of light weight and integration. Optimizing the magnetic array to provide negative stiffness can significantly reduce the volume and weight of the isolator. In addition, dynamic experiments show that the initial isolation frequency of the proposed compact magnetic array isolator is significantly lower than other magnetic array isolators. The isolators studied above have only one QZS region, and in order to realize the low-frequency effective vibration isolation of the QZS isolator for various loads, the isolator needs to have multiple QZS regions. Ye et al. [50] proposed a QZS system adaptable to different loads using a cam-roller mechanism. The principle of the isolator is that the cam structure is designed into multiple periods and connected in parallel with the linear spring to realize multiple QZS regions. The dynamic test of the prototype shows that the test results are consistent with the theoretical results. Zheng et al. [51] proposed a QZS isolator consisting of N elements in series, which has multiple QZS regions and can also achieve low-frequency isolation with different loads.
In the study of inclined buckling beams, Zhang et al. [52] proposed a cylindrical shell element structure and experimentally verified that there is a negative stiffness region in inclined rectangular beams. Wang et al. [53] designed QZS isolators and QZS locally resonant metamaterials using cosine-shaped beams. Cai et al. [54] designed the QZS metamaterial unit cell by using inclined rectangular beams and folded beams, which can solve the attenuation problem of low-frequency waves after combining N unit cells in series. Several studies [55,56,57] introduced honeycomb energy absorption devices with different beam shape structures. The energy absorber utilizes the negative stiffness characteristic of the inclined beam under compression to complete the energy absorption.
The inclined buckling beams studied above are all rectangular beams with constant width, but there are few studies on trapezoidal beams with variable width. In this paper, a QZS isolator is designed by using the buckling effect of the trapezoidal beam with variable width for low-frequency vibration isolation. The proposed structure and working principle are introduced in Section 2. In Section 3, the dynamic response of the QZS isolator under different damping ratios, different excitation conditions, and different loads is explored by finite element simulation. In Section 4, the static compression test and dynamic vibration excitation test are carried out on the prototype to verify the accuracy of the simulation and the feasibility of the QZS isolator. Finally, the conclusions and future work are presented in Section 5.

2. Working Principle of QZS Isolator

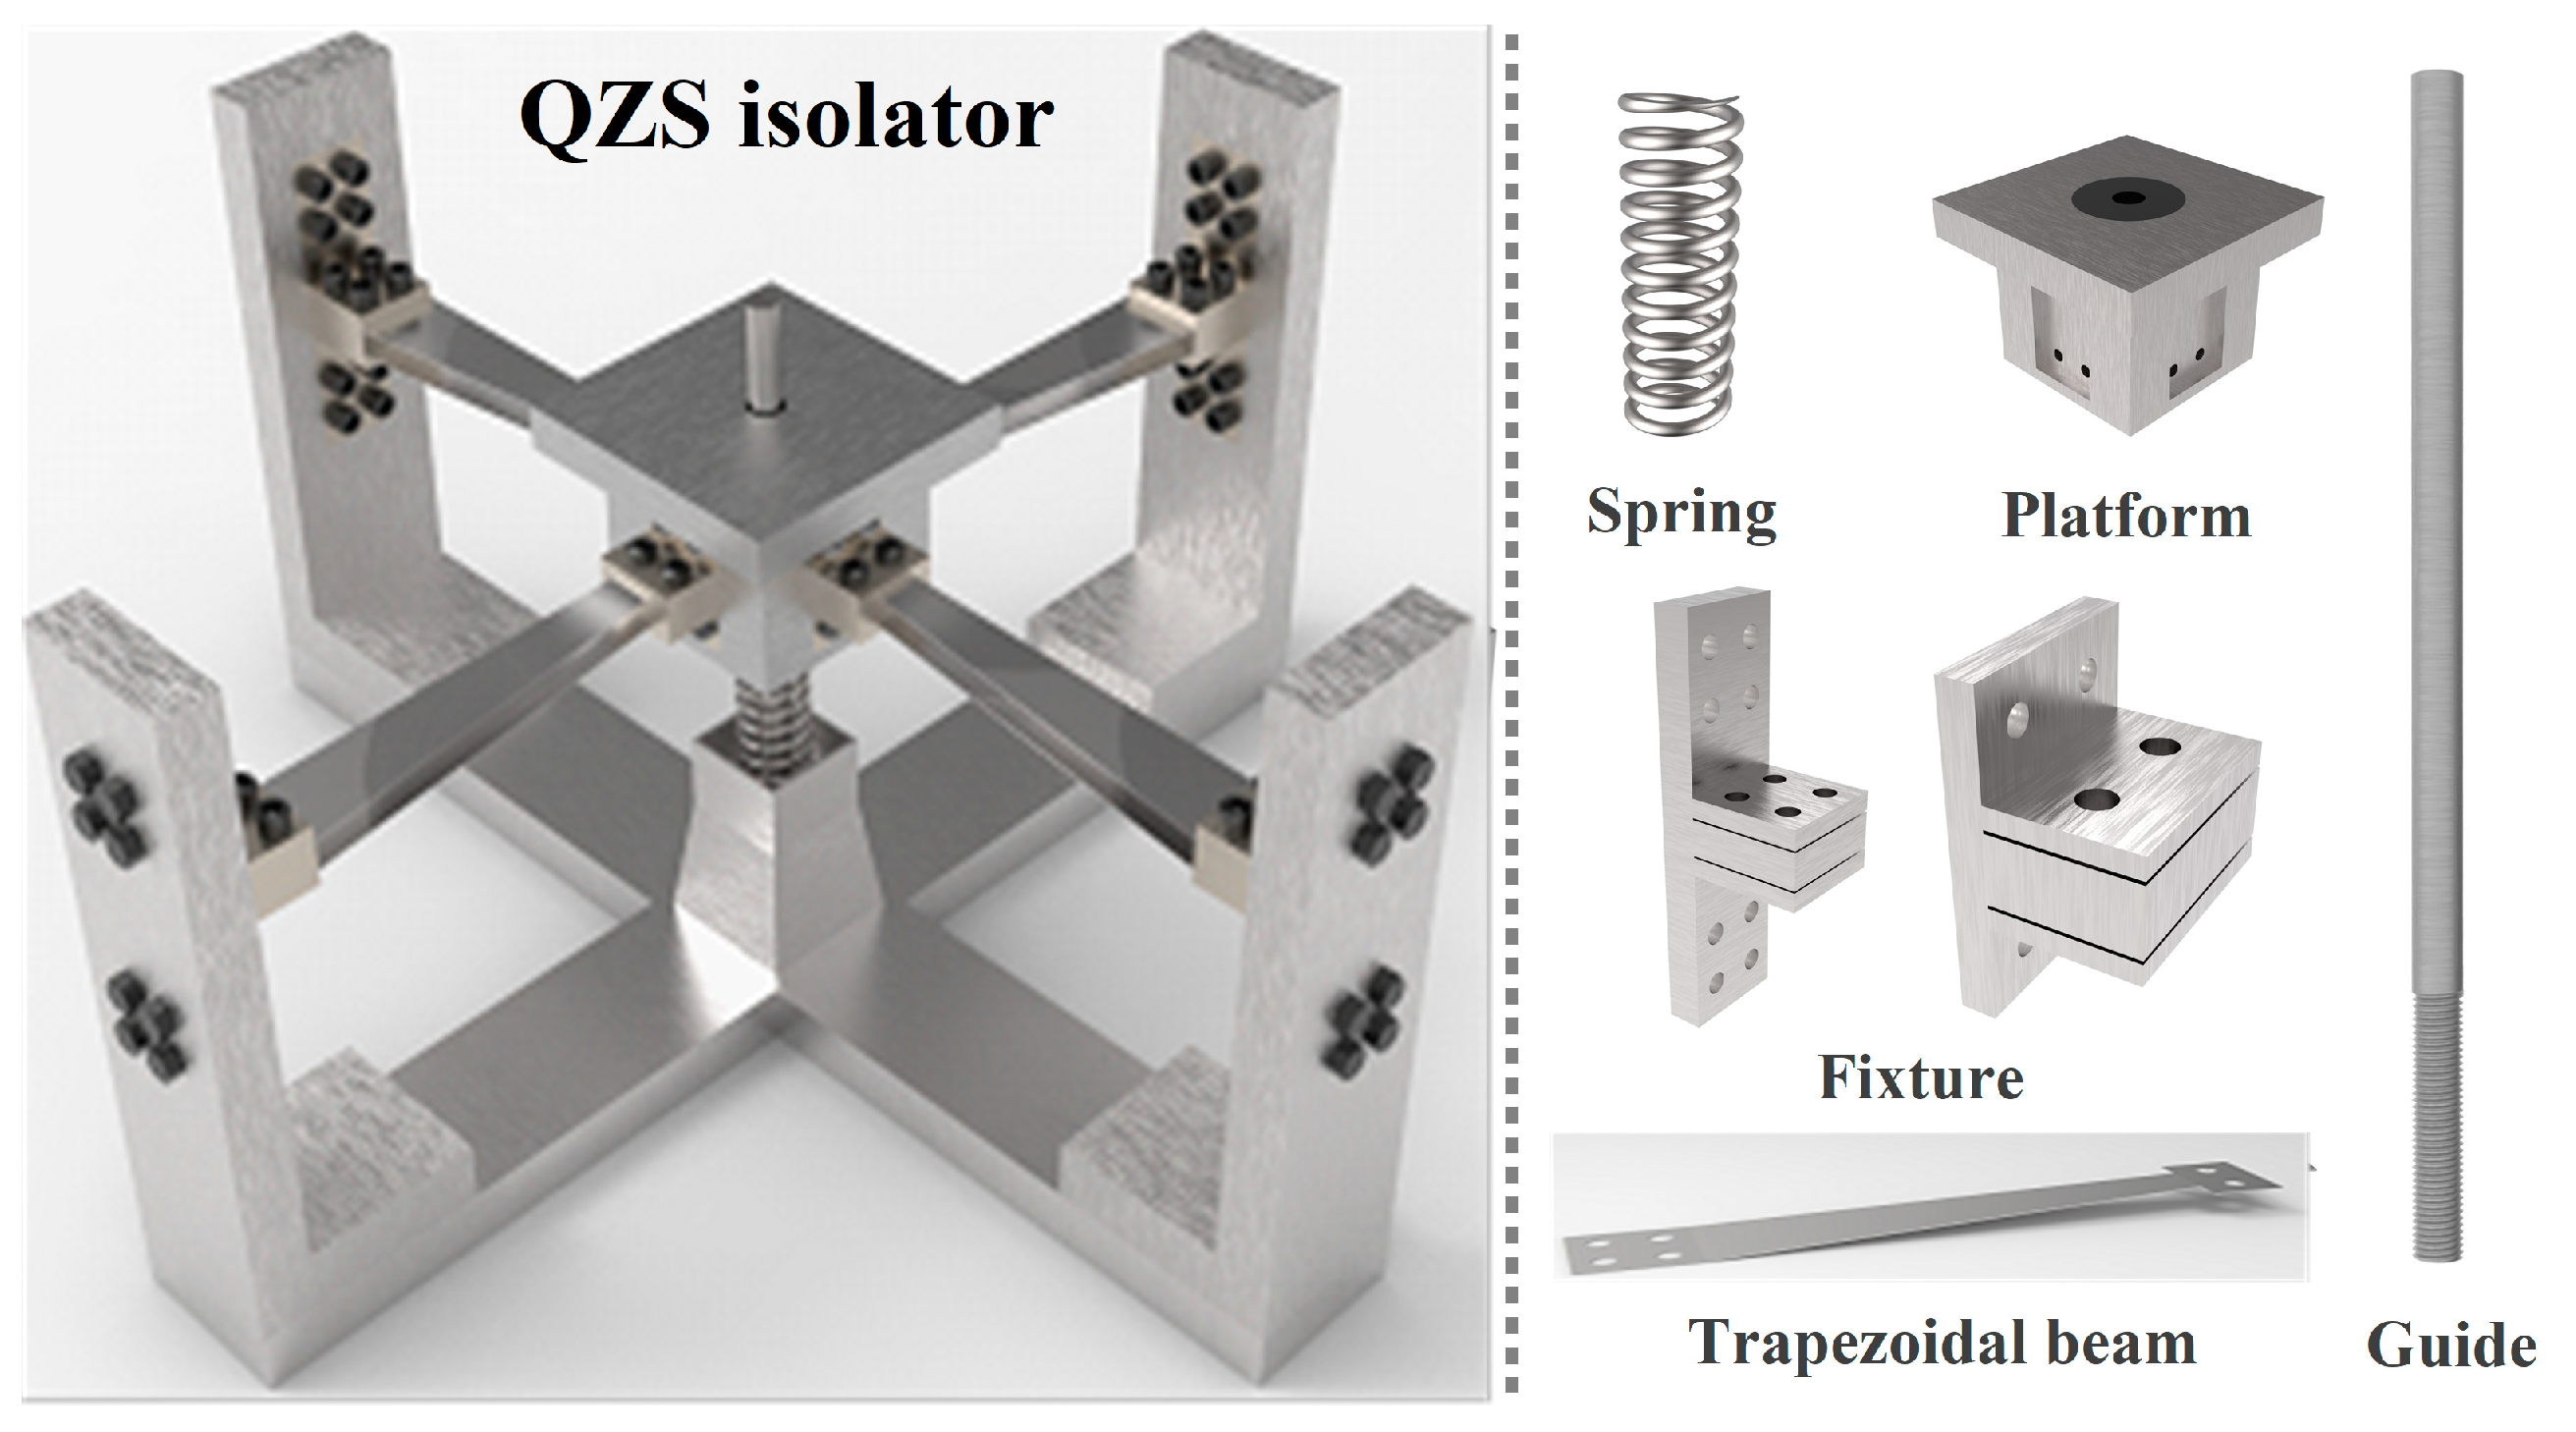
2.1. Structural Design

Figure 1 shows the structure diagram of the QZS isolator with a trapezoidal beam structure. The QZS isolator structure consists of trapezoidal beams, a linear spring, a guide rod, and a support platform. The load force acts on the support platform, and the guide rod has a guiding effect on the support platform, ensuring stable system operation. The two ends of the trapezoidal beam are fixed on the side column and the support platform by clamps. The angle between the trapezoidal beam and the horizontal plane is called the inclination angle of the trapezoidal beam. When the external load reaches a critical value, the inclined trapezoidal beam buckles and shows negative stiffness characteristics, while a linear spring acts under the support platform to provide stable support and to guarantee positive stiffness. The negative stiffness provided by the trapezoidal beam is paralleled with the positive stiffness of the linear spring, making the dynamic stiffness of the system close to zero. The static stiffness of the system is provided by linear springs, so the QZS system has high static stiffness and low dynamic stiffness performance.

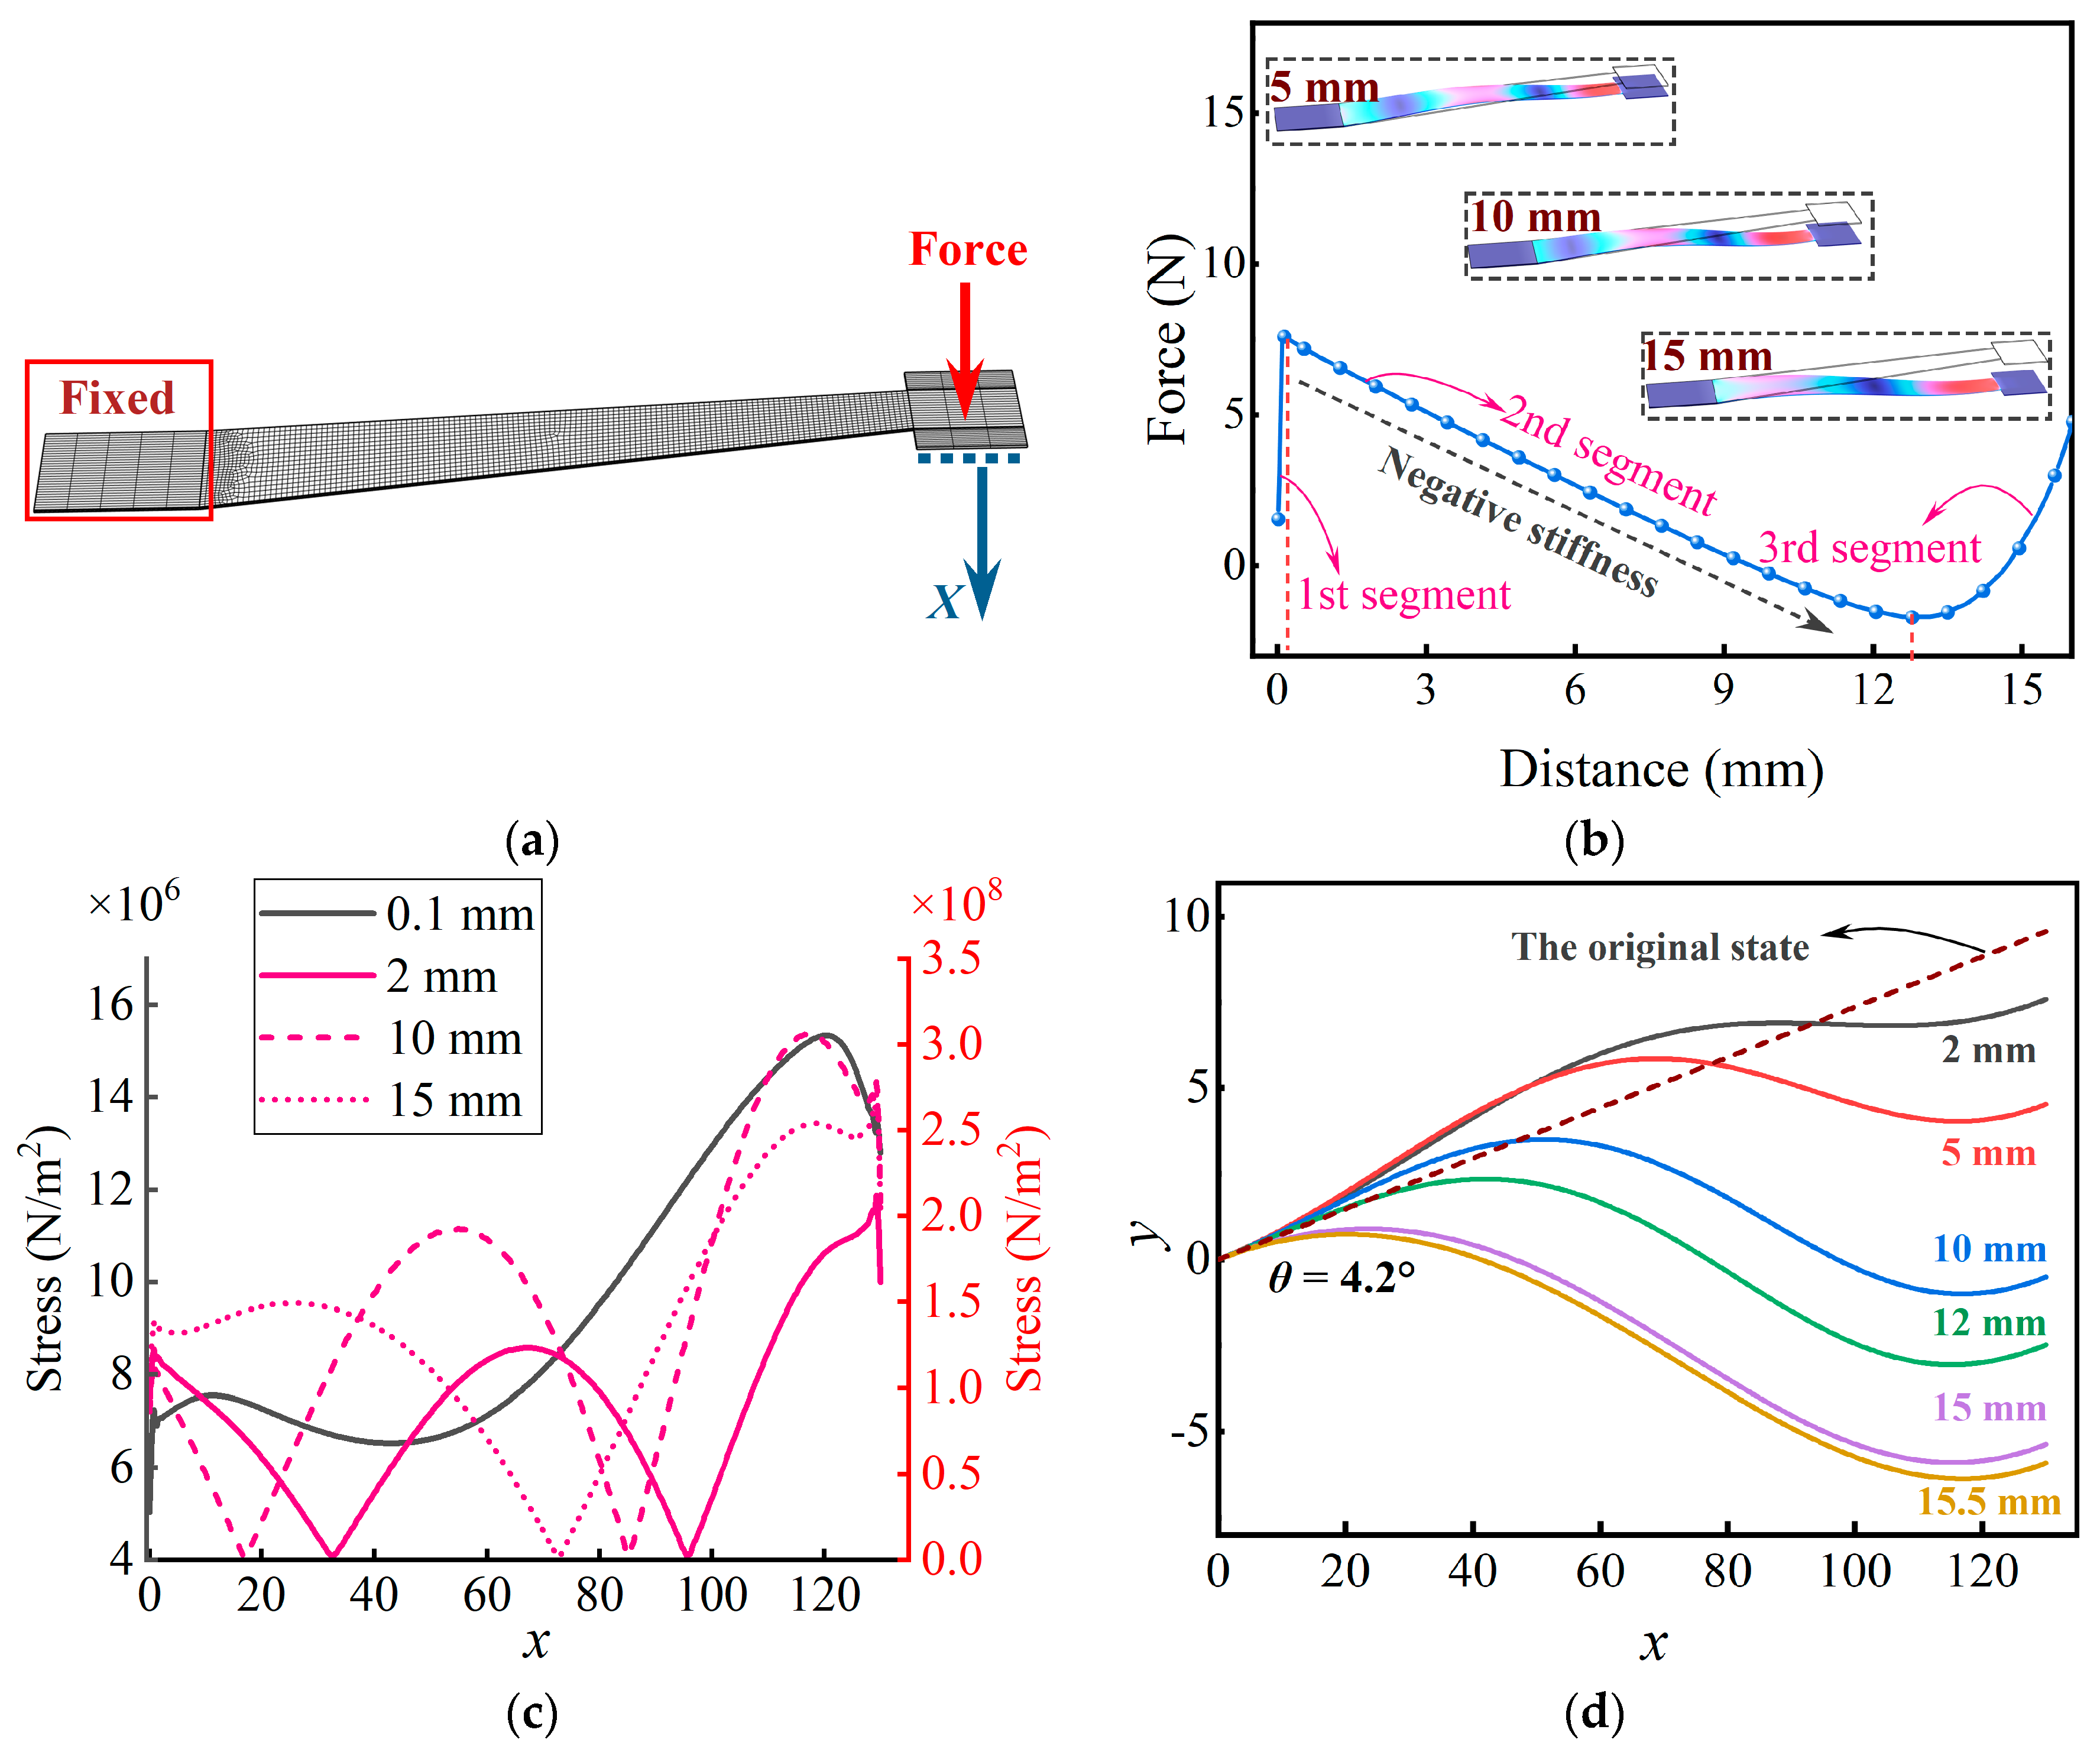
2.2. Static Analysis

Table 1 shows the structural and material parameters of trapezoidal beams. The material of the trapezoidal beam is elastic metal steel. The negative stiffness characteristics of the inclined trapezoidal beam and the deformation of the beam under different loads are explored by COMSOL6.0 finite element simulation, as shown in Figure 2a. A quadrilateral grid is set on the upper surface of the trapezoidal beam and refined, and then the mesh is swept along the thickness direction of the beam. The number of sweeping layers is three, and the trapezoidal beam has 5806 elements. One end of the trapezoidal beam is fixed, and the other end is constrained by the roller support boundary condition to limit the vertical displacement; the load is gradually applied to obtain the relationship between the load and the displacement. The static analysis should choose “stationary” and include geometric nonlinearity. The solver is selected as PARDISO, and the relative tolerance is set to 0.001, ensuring the model’s solution accuracy. Simulating the force-displacement relationship of a single inclined trapezoidal beam takes about 9 min. Of course, the time required for the simulation is related to the number of meshes and the step size of the applied load.
The force-displacement relationship shown in Figure 2b can be divided into three parts. The curve first increases significantly, then decreases gradually, and finally shows an upward trend again. The first and third segments of the curve exhibit positive stiffness properties. In the second segment, because the trapezoidal beam exhibits a buckling effect under compression, the force-displacement curve shows a downward trend, showing negative stiffness. Figure 2b also shows the stress contours of trapezoidal beams at different compression displacements, where the blue area indicates zero stress. When the compression displacement is 5 mm and 10 mm, there are two blue areas in the stress nephogram of the trapezoidal beam part, which also proves that the buckling effect of the beam occurs here. However, when the compression displacement is 15 mm, only one blue area in the stress nephogram shows positive stiffness characteristics. Figure 2c shows the stress of trapezoidal beams under different compressive displacements. It can be seen that when the compression displacement is 0.1 mm, the beam exhibits positive stiffness characteristics (corresponding to the first segment of Figure 2b), and the stress curve has no zero-stress point. When the compression displacement is 2 mm and 10 mm, there are two zero stress points in the stress curve (corresponding to the second segment of Figure 2b), and the beam exhibits a buckling effect and negative stiffness characteristics. When the compression displacement is 15 mm, the stress curve has a zero-stress point (corresponding to the third segment of Figure 2b), and the beam presents positive stiffness. The dotted line in Figure 2d is the original state coordinate point of the midline of the trapezoidal beam. When the compression is within the range of 2 mm to 12 mm, an intersection point exists between the shape curve of the beam and its original state, which provides evidence for the occurrence of buckling in the beam [58]. When compressing 15 mm and 15.5 mm, respectively, there is no intersection point between the shape curve of the beam and the original state, and the beam is in a stable state after buckling, showing positive stiffness characteristics.
The QZS isolator model is divided into 64,055 grid cells to explore its mechanical properties. The trapezoidal beam and linear spring are key components that directly affect the performance of the isolator, so mesh refinement is required to improve the simulation accuracy (Figure 3a). The roller support boundary condition is set on the support platform to replace the guiding function of the guide rod to improve the convergence of the model. Since the stiffness of the side column is large enough, both the column and the base are set as fixed constraints to improve the convergence speed of the model. The reaction force and vertical displacement of the support platform are extracted to obtain the force-displacement relationship curve of the QZS isolator (Figure 3b). It can be seen from Figure 3b that the force-displacement curve of the QZS isolator with eight inclined trapezoidal beams and linear springs connected in parallel also has three parts. At the initial compression stage, the reaction force increases significantly with vertical displacement because the trapezoidal beam and linear spring exhibit positive stiffness characteristics. When the vertical displacement exceeds a critical value, the trapezoidal beam buckles, resulting in negative stiffness properties. The force-displacement curves of positive and negative stiffness in parallel tend to be flat, showing QZS characteristics. As the vertical displacement increases, the trapezoidal beam transitions to another stable state, resulting in a positive stiffness, where the stiffness value of the QZS isolator is greater than that of the linear spring.
Figure 4 shows the first-order mode diagram of the isolator under different load conditions, and its color indicates the displacement (blue indicates the smallest displacement, and red indicates the largest displacement). In the finite element simulation, “Eigenfrequency” is selected to solve the isolator’s natural frequency under the condition of no load, the solver is ARPACK, and the relative tolerance is set to 1 × 10⁻⁶. Since the QZS isolator is a nonlinear stiffness system, selecting “Eigenfrequency, Prestressed” is necessary to solve the isolator’s natural frequency under load. This study needs to solve two steps, the first step is “stationary” (note that the selection includes geometric nonlinearity), and the load is gradually applied through auxiliary sweep. The solver is PARDISO, and the relative tolerance is 0.001. The second step is “Eigenfrequency”. Its solver is MUMPS, and the relative tolerance is set to 1 × 10⁻⁶. Figure 4a–c shows that the bending behavior of two trapezoidal beams in the same group is synchronous, and they do not contact each other during deflection.
The first-order natural frequency of the isolator without load is 63.3 Hz. When 51 N and 70 N vertical downward loads are gradually applied to the support platform through the auxiliary sweep, the first-order natural frequencies of the isolator are 2.8 Hz and 8.2 Hz, respectively. The load does not affect the linear isolator’s natural frequency, and the first-order natural frequency of the linear isolator (without trapezoidal beam) is 7.3 Hz. It can be seen from the mode shape diagram in Figure 4a–c that the first-order mode shape of the isolator makes the support platform move vertically, while the mode shape of the trapezoidal beam is affected by different loads. When the load is 51 N, the trapezoidal beam buckles, so the mode shape of the trapezoidal beam is significantly deformed. The natural frequency of the QZS isolator loaded with 51 N is 96% and 62% lower than that of the unloaded QZS isolator and the linear isolator, respectively. When the load is 70 N, the trapezoidal beam has transitioned to another stable state and exhibits positive stiffness characteristics; the stiffness of the system is greater than the linear spring stiffness, so the first-order natural frequency increases. In summary, the vertical downward preload can significantly reduce the stiffness and natural frequency of the isolator, which also verifies that this type of QZS isolator can be applied to low-frequency vibration. However, since the nonlinear isolator is sensitive to the load, it is necessary to analyze the influence of different loads on the dynamic characteristics of the isolator.

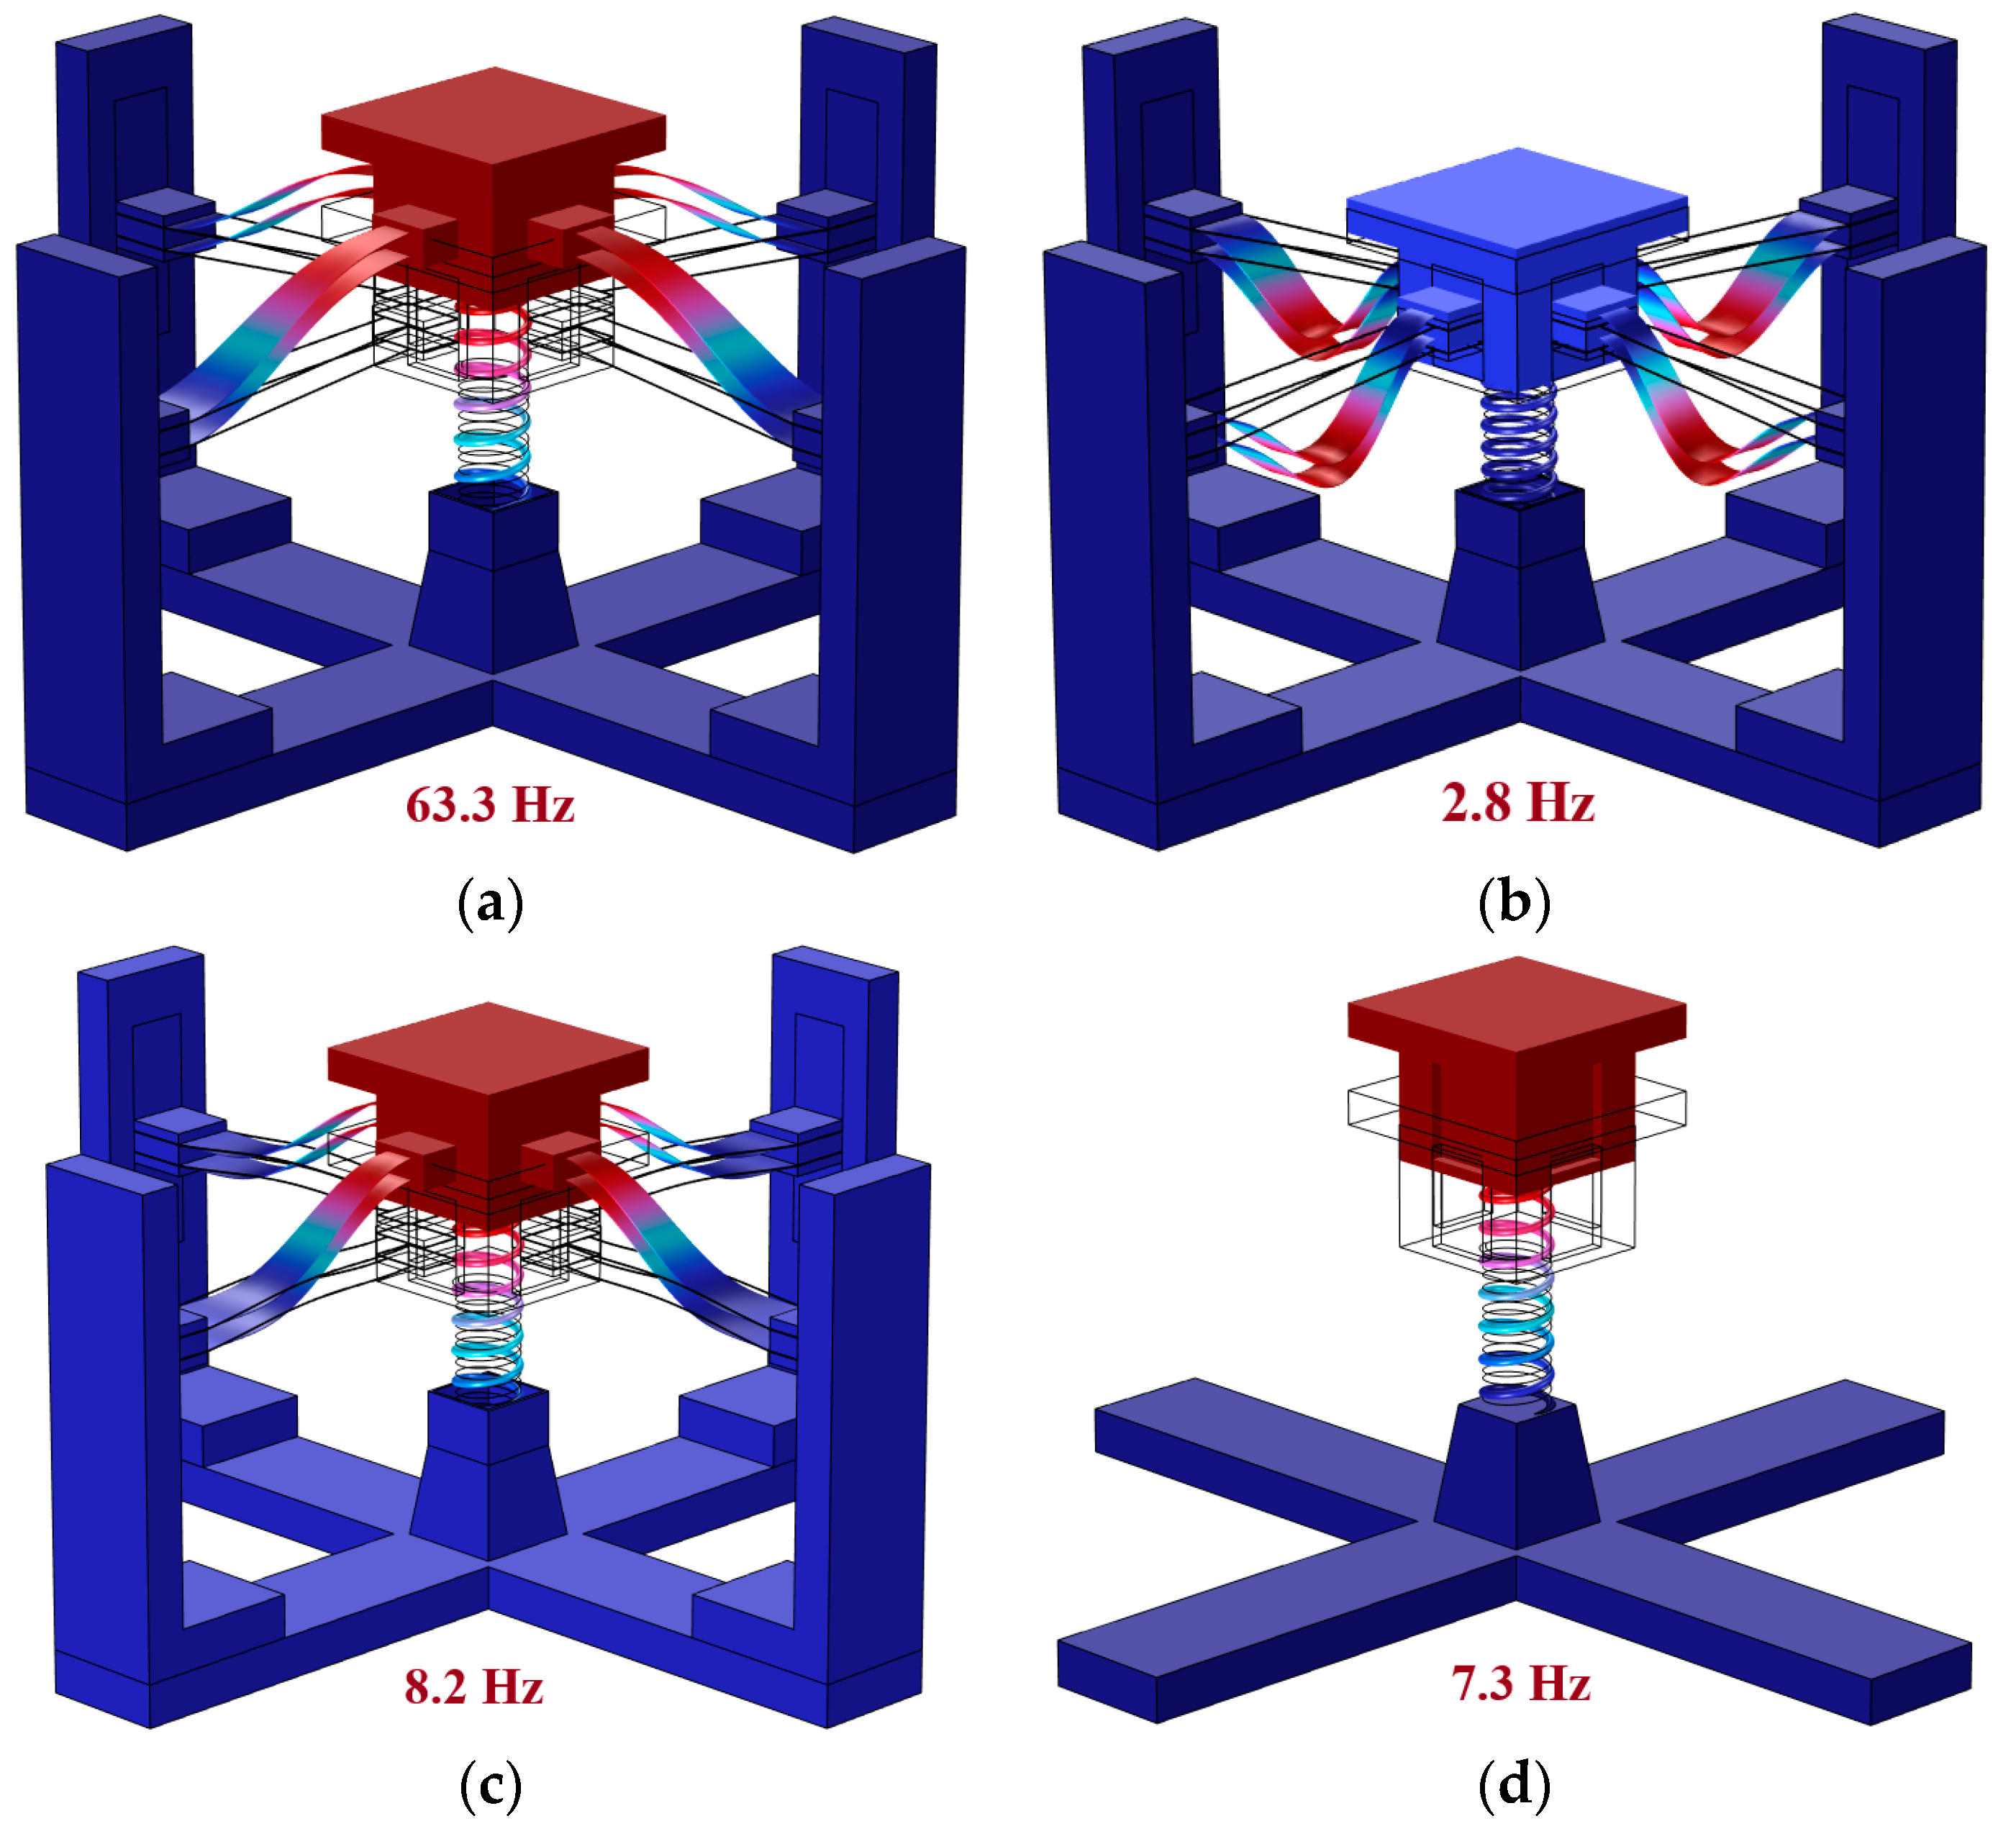
3. Dynamics Analysis

Transmissibility is an important index to evaluate the performance of the isolator. In this paper, the transmissibility is expressed in decibels and can be calculated as follows:
T = 20 log 10 O u t p u t I n p u t
The “Input” in Equation (1) refers to the displacement of the isolator base, and the “Output” refers to the displacement of the support platform of the isolator.
We select “Frequency Domain, Prestressed” to study the dynamic response of the QZS isolator under load. This study requires a solution in two steps. The first step is “stationary” (note that the selection includes geometric nonlinearity), and the load is gradually applied through auxiliary sweep for easier convergence. The solver is PARDISO, and the relative tolerance is set to 0.001. The second step is “Frequency Domain Perturbation” to complete the frequency sweep simulation. The effects of different damping ratios, accelerations, and excitation amplitudes on the transmissibility of the QZS isolator can be explored through the auxiliary sweep. Among them, the influence of different accelerations on the isolator’s performance is explored by setting the body load parameters. Note that when analyzing the effects of different damping ratios and different acceleration conditions on the performance of the QZS isolator, it is necessary to set harmonic perturbation for its body load. When analyzing the influence of different excitation amplitudes on the performance of the QZS isolator, it is necessary to set up harmonic perturbation for its input displacement. The nonlinear method of frequency domain perturbation is set to “Automatic (Newton)”, its initial damping factor is 1, the minimum damping factor is 1 × 10⁻⁴, and the relative tolerance is set to 0.001.

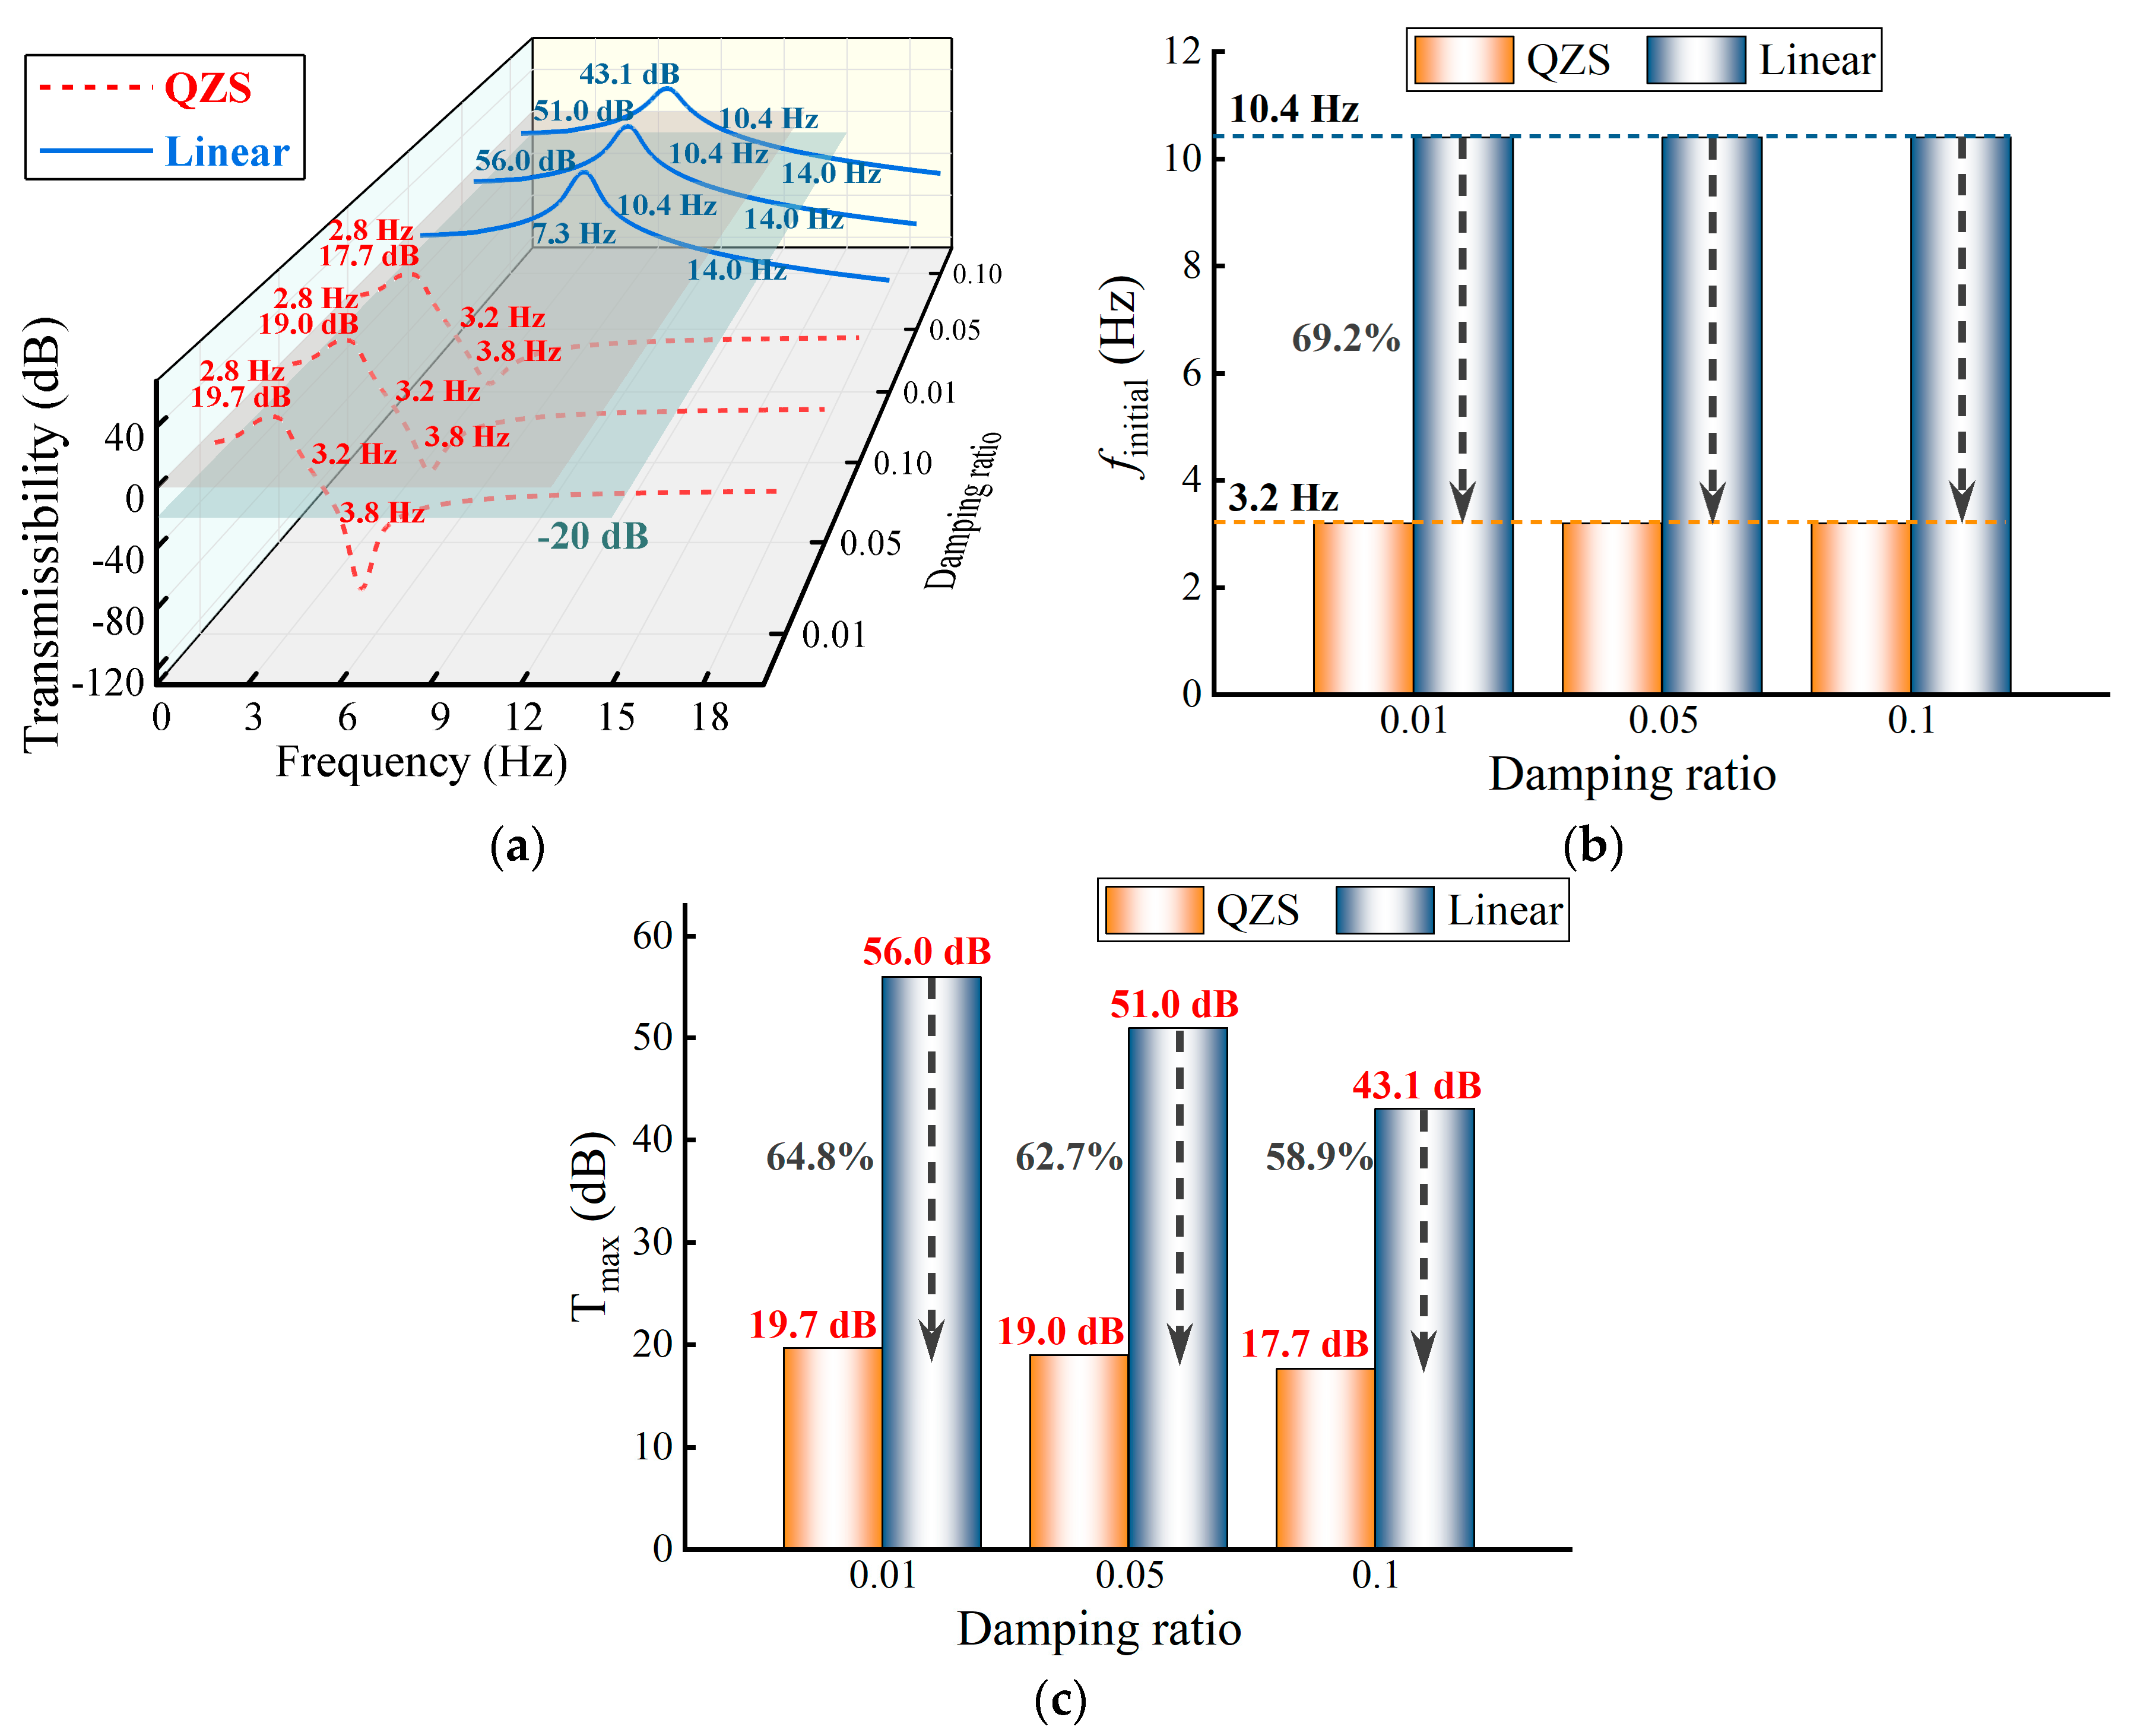
3.1. Effects of the Damping

Figure 5 shows the transmissibility characteristics of the QZS and linear isolators for different damping ratios. It is worth noting that the prestress of both isolators is 51 N. Among them, the linear isolator is formed by removing the inclined trapezoidal beam from the QZS isolator. In other words, the spring of the linear isolator and the spring of the QZS isolator are the same. The analysis of the two isolators only considers the base excitation. Whether it is a linear isolator or a QZS isolator, the peak transmissibility (Tmax) decreases significantly with the increase of the damping ratio, while the initial isolation frequency (finitial) does not change with the damping ratio. It can be found that the finitial of the linear isolator is 10.4 Hz, which is 2 times its first-order natural frequency (7.3 Hz); this also verifies the correctness of the finite element analysis method. The initial isolation frequency (3.2 Hz) of the QZS isolator is 69.2% lower than that of the linear isolator (10.4 Hz). Moreover, the peak transmissibility of the QZS isolator is smaller than that of the linear isolator. When the damping ratio is 0.01, 0.05, and 0.1, the peak transmissibility (19.7 dB, 19.0 dB, and 17.7 dB) of the QZS isolator is 64.8%, 62.7%, and 58.9% lower than that (56 dB, 51 dB, and 43.1 dB) of the linear isolator, respectively. In summary, although the damping ratio affects the transmissibility performance of the isolator, it can be found that the QZS isolator has significant advantages when comparing the finitial and Tmax of the QZS and linear isolator.

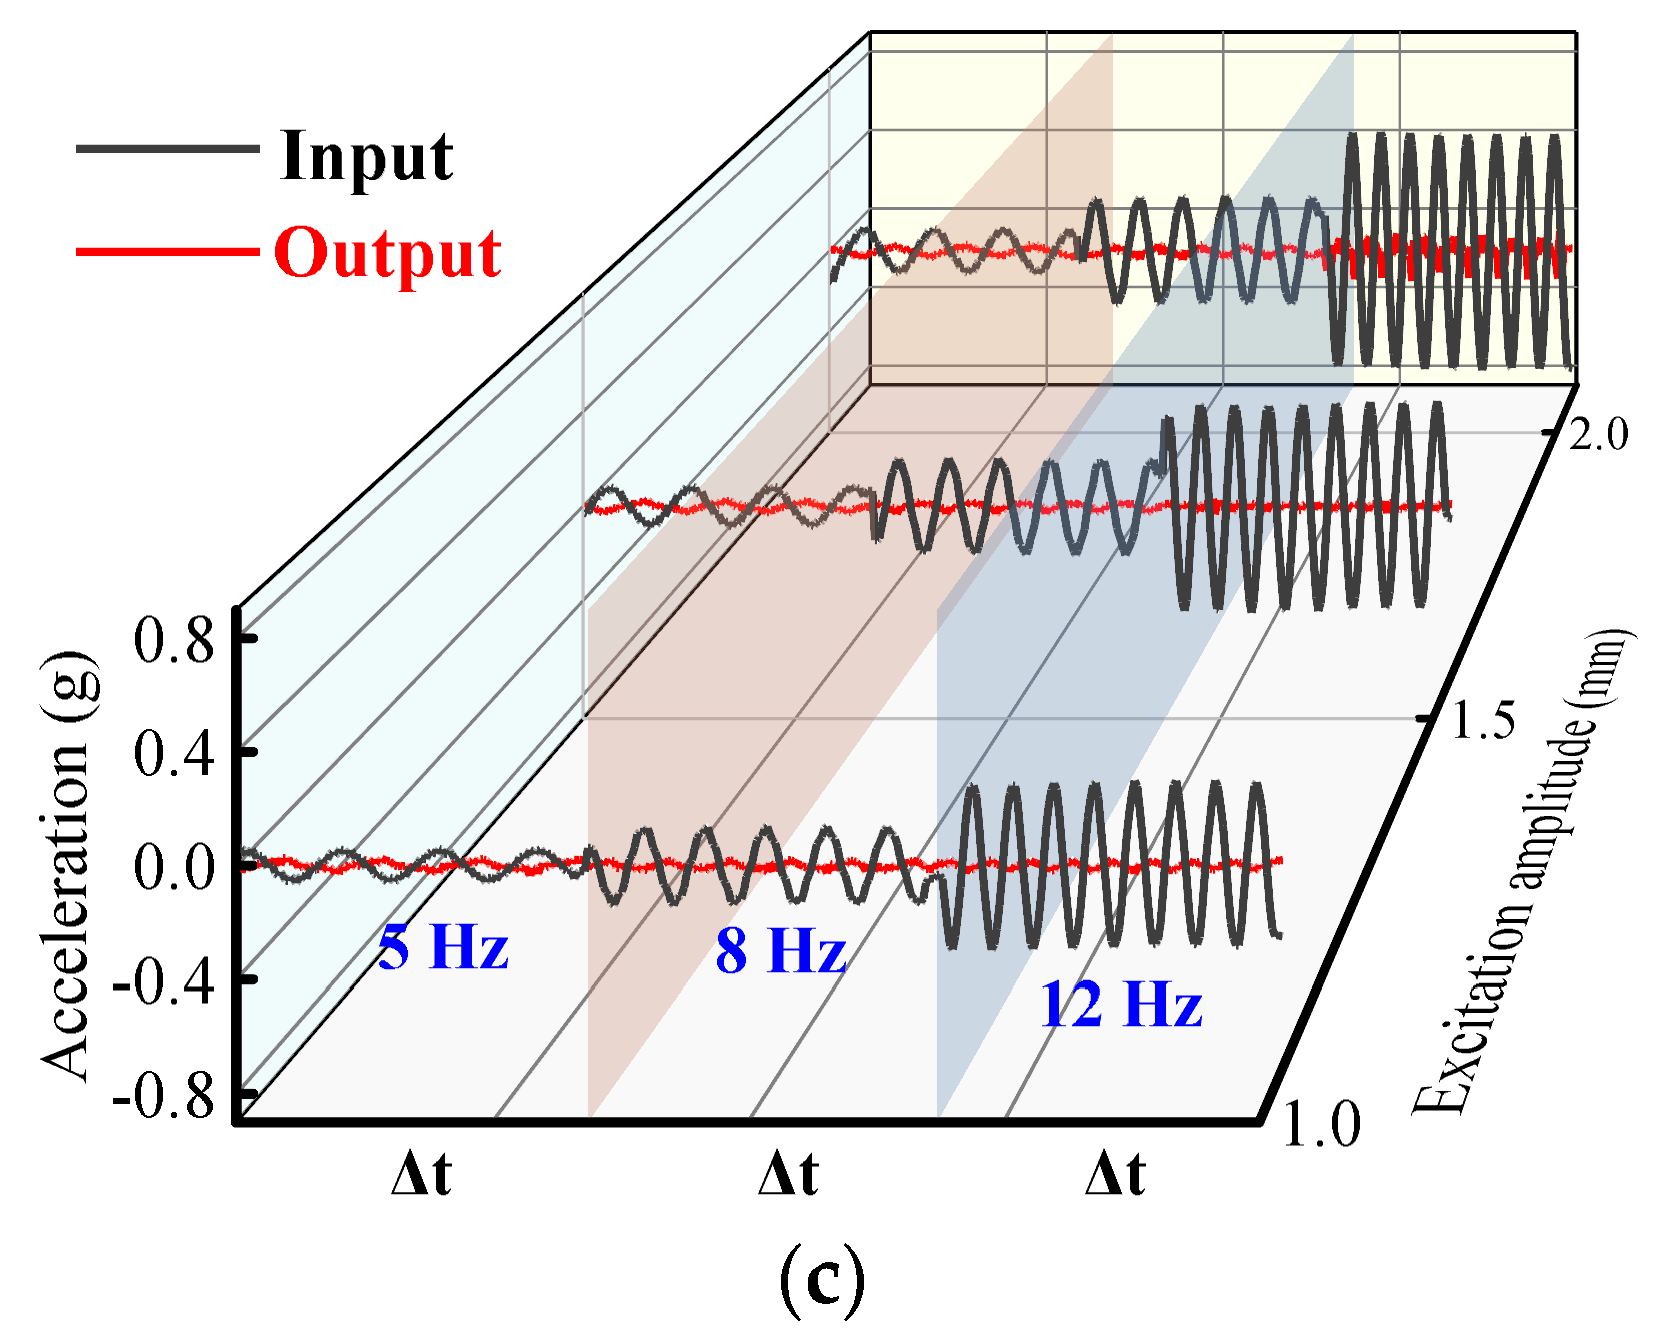
3.2. Effects of the Acceleration and Amplitude

Figure 6 shows the performance of the QZS and linear isolator under different acceleration and amplitude excitations. It is worth noting that both the QZS and the linear isolator are subjected to dynamic finite element simulation under the load of 51 N, with the damping ratio set to 0.1. In this paper, different excitation accelerations are analyzed by adjusting the body load parameters of the model. In addition, the analysis of transmissibility characteristics under different amplitudes refers to setting different displacement amplitudes for the model’s base. Harmonic response analysis shows that the performance of the QZS isolator is significantly better than that of the equivalent linear isolator, regardless of force or displacement excitation. The finite element simulation software handles nonlinear factors by linearizing them near the system operating point. Therefore, the frequency domain analysis conducted in this paper is carried out by linearizing the nonlinear isolation system at its equilibrium point. The simulation results show that the transmissibility curve is not affected by the amplitude of the acceleration and displacement excitations. However, because the QZS isolator has low dynamic stiffness characteristics, the finite element simulation can still verify that the QZS isolator has a low finitial. It can be seen from Figure 6c,d that the finitial and Tmax of the QZS isolator are reduced by 69.2% and 58.9%, respectively, compared with the linear isolator.

3.3. Effects of the Load

Figure 7 shows the transmissibility performance of nonlinear and linear isolators for different loads. It is worth noting that the dynamic simulations of the two isolators are carried out under the condition that the excitation amplitude is 2 mm and the damping ratio is set to 0.1. The loads in the QZS region range from 50 N to 68 N (Figure 3b). Therefore, in this section, the nonlinear isolator when the load is 51 N is called the QZS isolator, and the nonlinear isolator when the load is 70 N is called the load_70 N isolator. The shape of the transmissibility curves of the QZS isolator and the load_70 N isolator are similar, and both the initial isolation frequency and the peak value of the transmissibility are smaller than those of the linear isolator (Figure 7a). It can be seen from Figure 7b,c that the initial vibration isolation frequency of the QZS isolator and the load_70 N isolator are 69.2% and 16.3% lower than that of the linear isolator, and the peak transmissibility decreases by 58.9% and 23.2%, respectively. The black line in Figure 7d represents the excitation displacement of 2 mm, and the red line represents the supporting platform’s output displacement. It can be seen intuitively from the time domain diagram that the QZS isolator sees an obvious vibration isolation effect at 5 Hz. However, the displacement amplification of the load_70 N isolator and the linear isolator is at 8 Hz, and the output displacement amplification of the linear isolator is more obvious than that of the load_70 N isolator. In addition, the QZS isolator and load_70 N isolator have an obvious vibration isolation effect at 12 Hz; the linear isolator can also isolate vibration, but the effect is not obvious. However, the nonlinear isolator is sensitive to load requirements, so the structural parameters of the nonlinear isolator need to be designed according to actual application conditions.

4. Experimental Results and Discussion

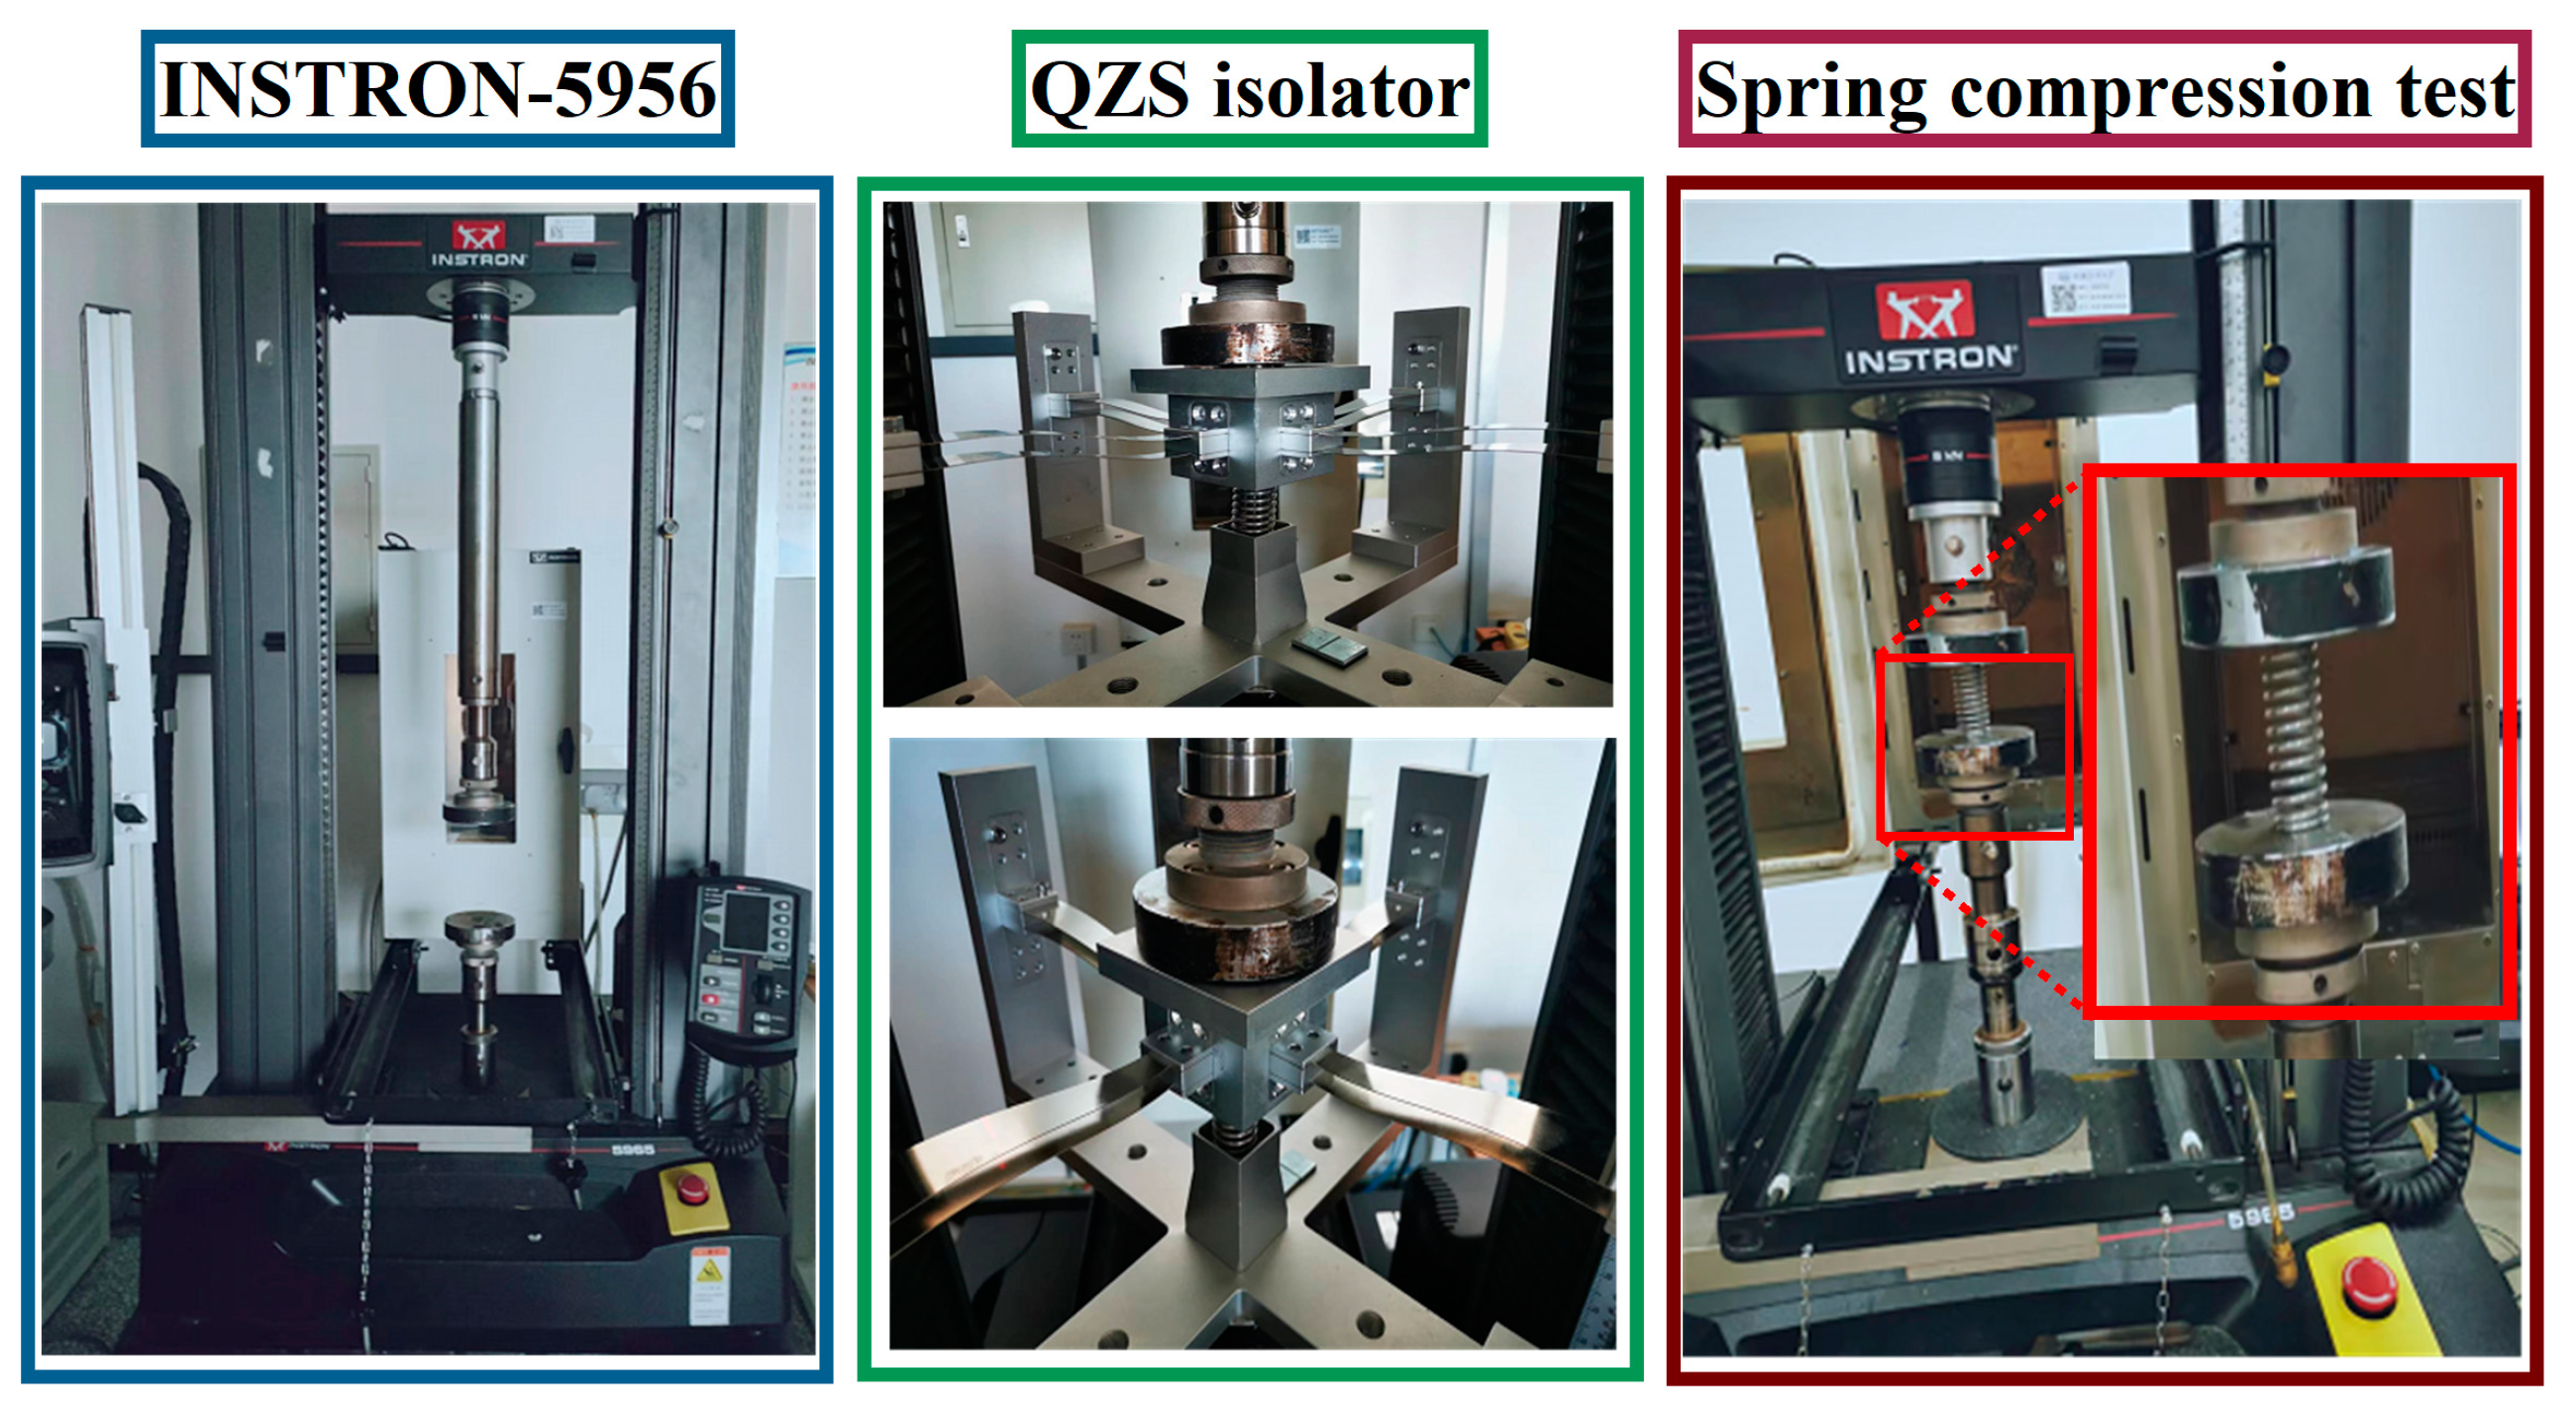
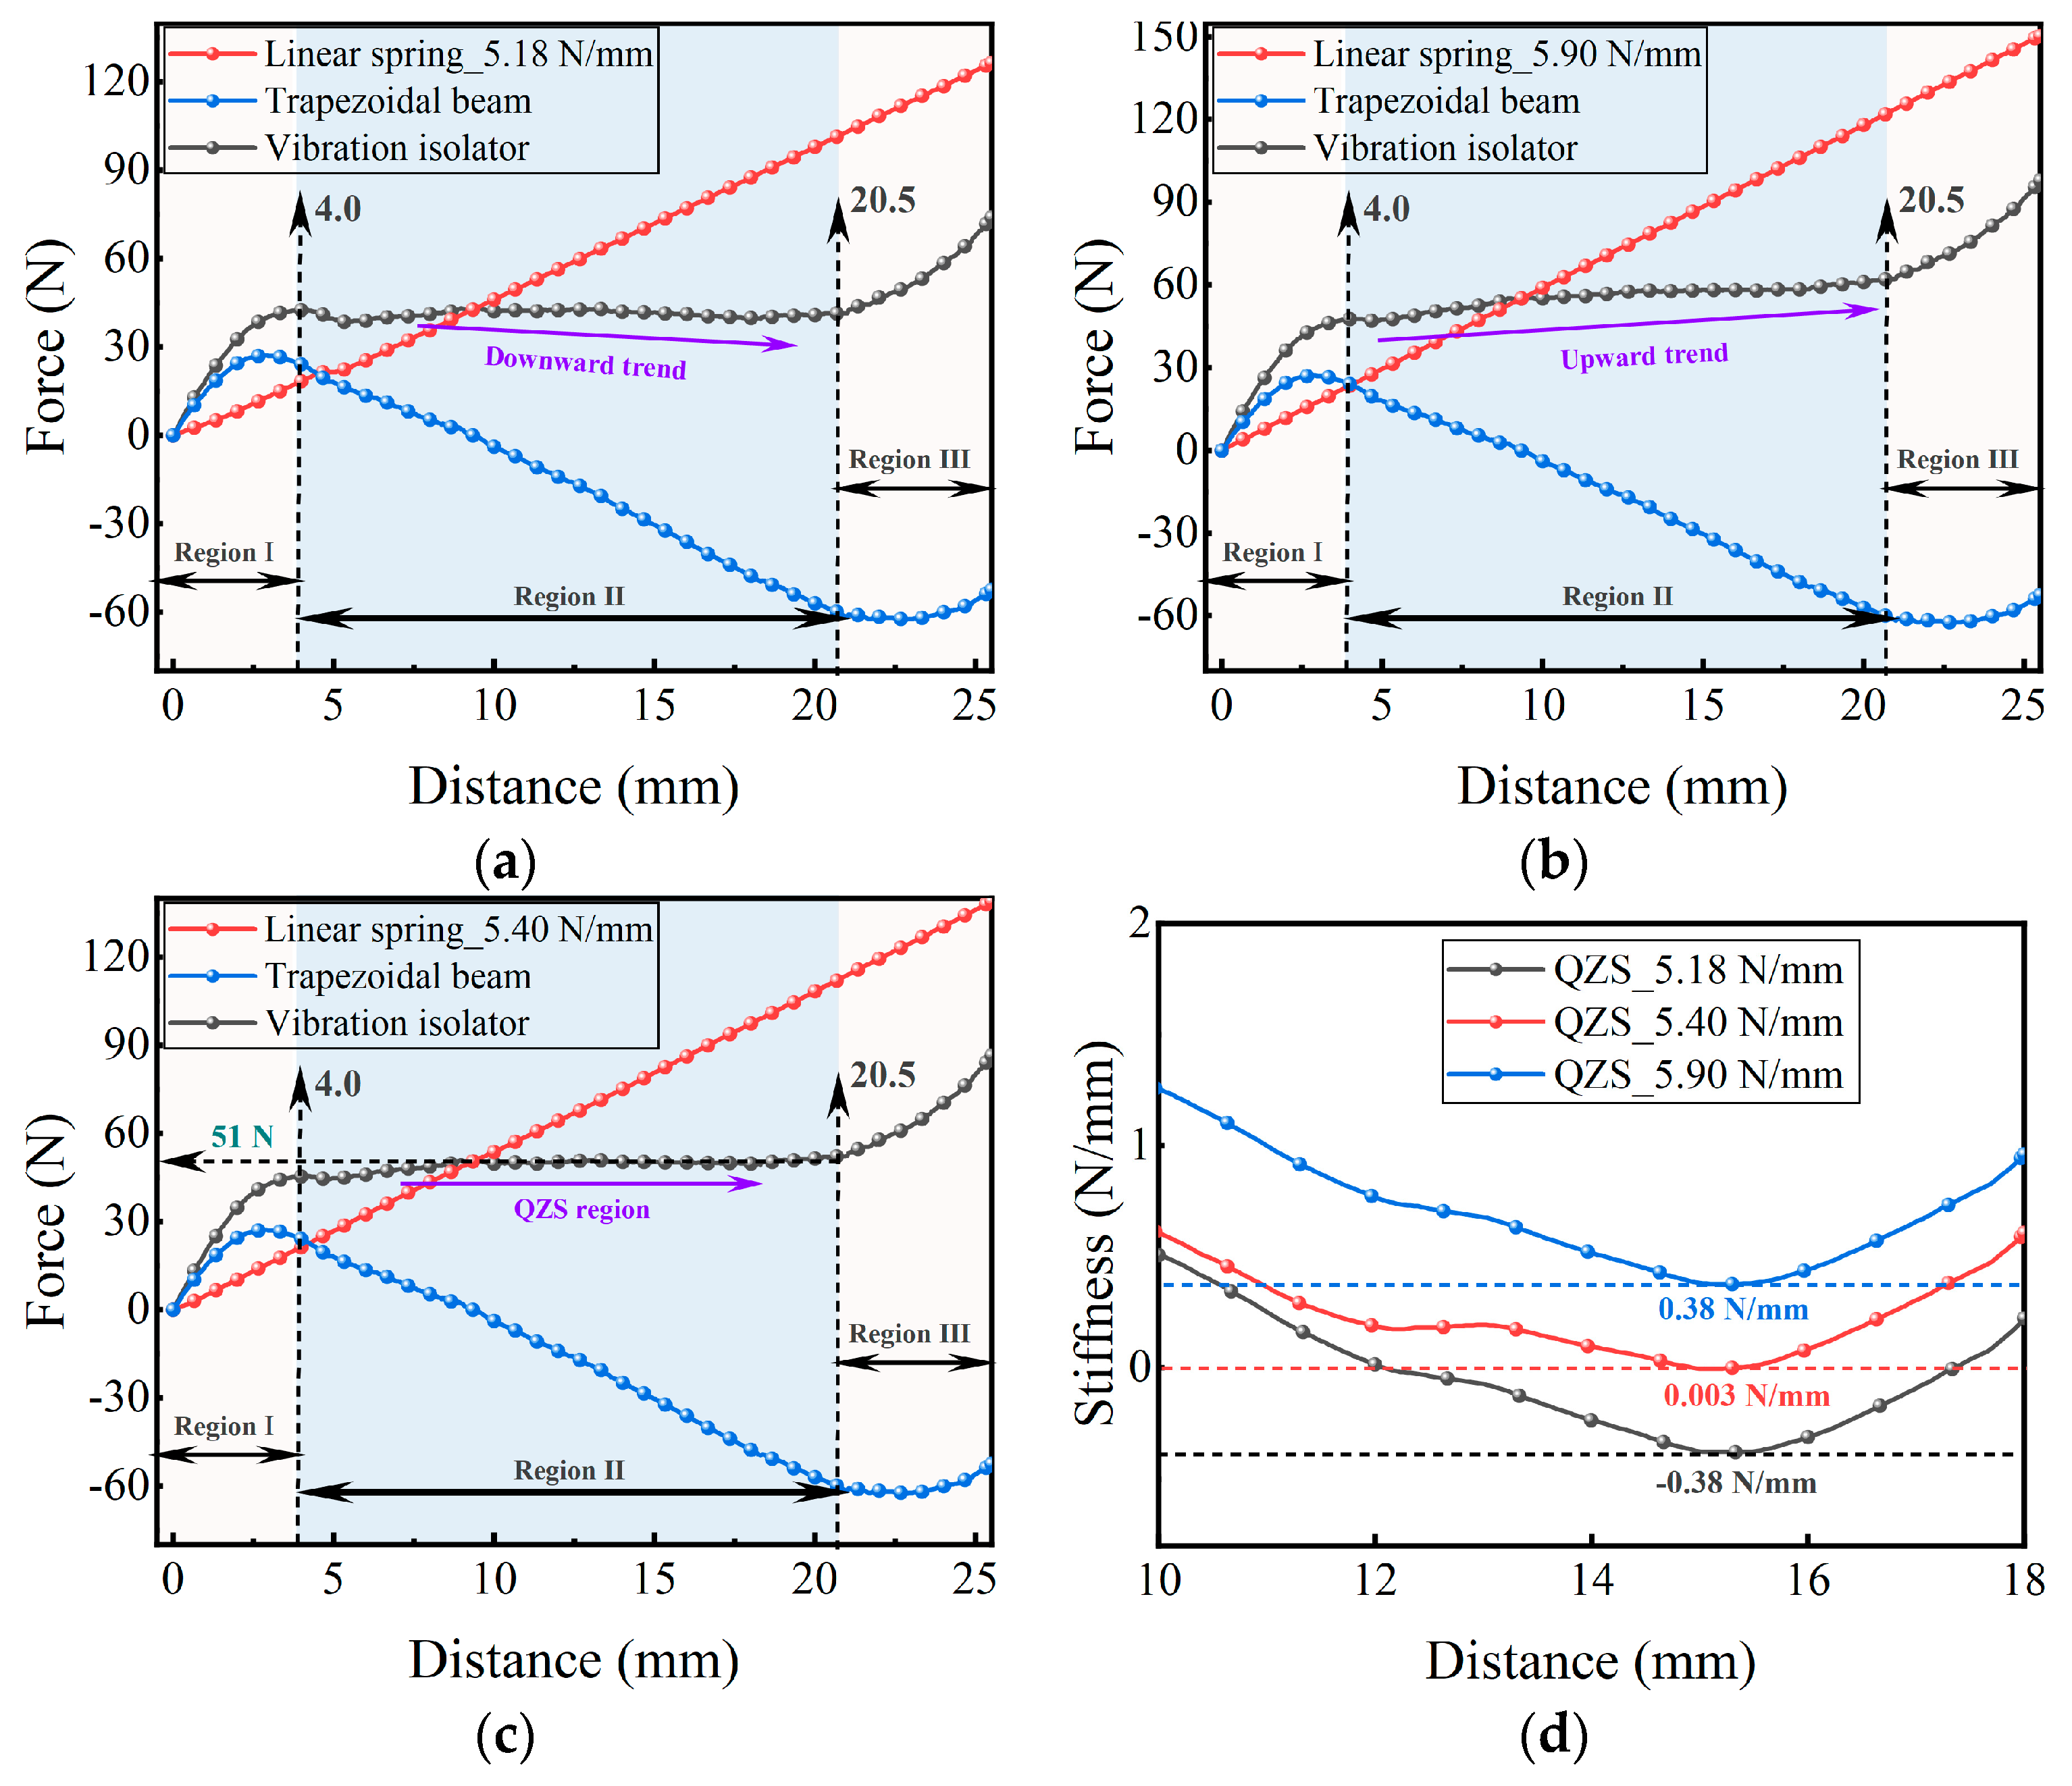
4.1. Static Experiment

Figure 8 shows the static compression test system to verify the existence of the QZS region of the nonlinear isolator. This paper uses the INSTRON-5956 electronic universal material testing machine, which has a vertical test space of 1256 mm and a compressive load capacity of 5 kN and can fully meet the static test requirements of the isolator. The testing machine slowly applies displacement to the support platform at a rate of 0.083 mm/s and collects the reaction force at a sampling frequency of 12 Hz to obtain the force-displacement curve of the isolator.
The static compression tests are performed sequentially on isolators installed with different linear stiffness springs (5.18 N/mm, 5.90 N/mm, 5.40 N/mm) to give the isolator a perfect QZS region. It can be seen from Figure 9a–c that the positive stiffness spring has a good linear relationship. It is worth noting that the force-displacement curve of the trapezoidal beam shown in Figure 9 is obtained by subtracting the data of the linear spring from the data of the isolator and does not represent the actual test result. The main reason for the error in the negative stiffness behavior shown by the experimental data and the finite element analysis results lies in the installation and experimental operation. However, this does not affect the existence of the QZS region of the nonlinear isolator. The force-displacement relationship curve of the nonlinear isolator is divided into three regions, and the inclined trapezoidal beams and linear springs with different stiffnesses in parallel present different stiffness performances. When the trapezoidal beam is connected in parallel with a 5.18 N/mm linear spring, region II of the force-displacement curve shows a downward trend, that is, the linear spring stiffness is insufficient. When connected in parallel with a 5.9 N/mm linear spring, region II of the force-displacement curve shows an upward trend, that is, the linear spring stiffness is too large. In parallel with a 5.4 N/mm linear spring, the isolator has a flat force-displacement curve in region II, which corresponds to a load of 51 N. In other words, the nonlinear isolator performs best when the isolator load is 51 N. The stiffness of the isolator can be obtained by differentiating the force-displacement experimental data. It is worth noting that directly differentiating the experimental data increases the noise of the measurement data. In this paper, the Savitzky-Golay quintic term smoothing filter is used to reduce the noise and ensure the data accuracy. The minimum stiffness of the QZS isolator can reach 0.003 N/mm when connected in parallel with a 5.40 N/mm linear spring (Figure 9d).

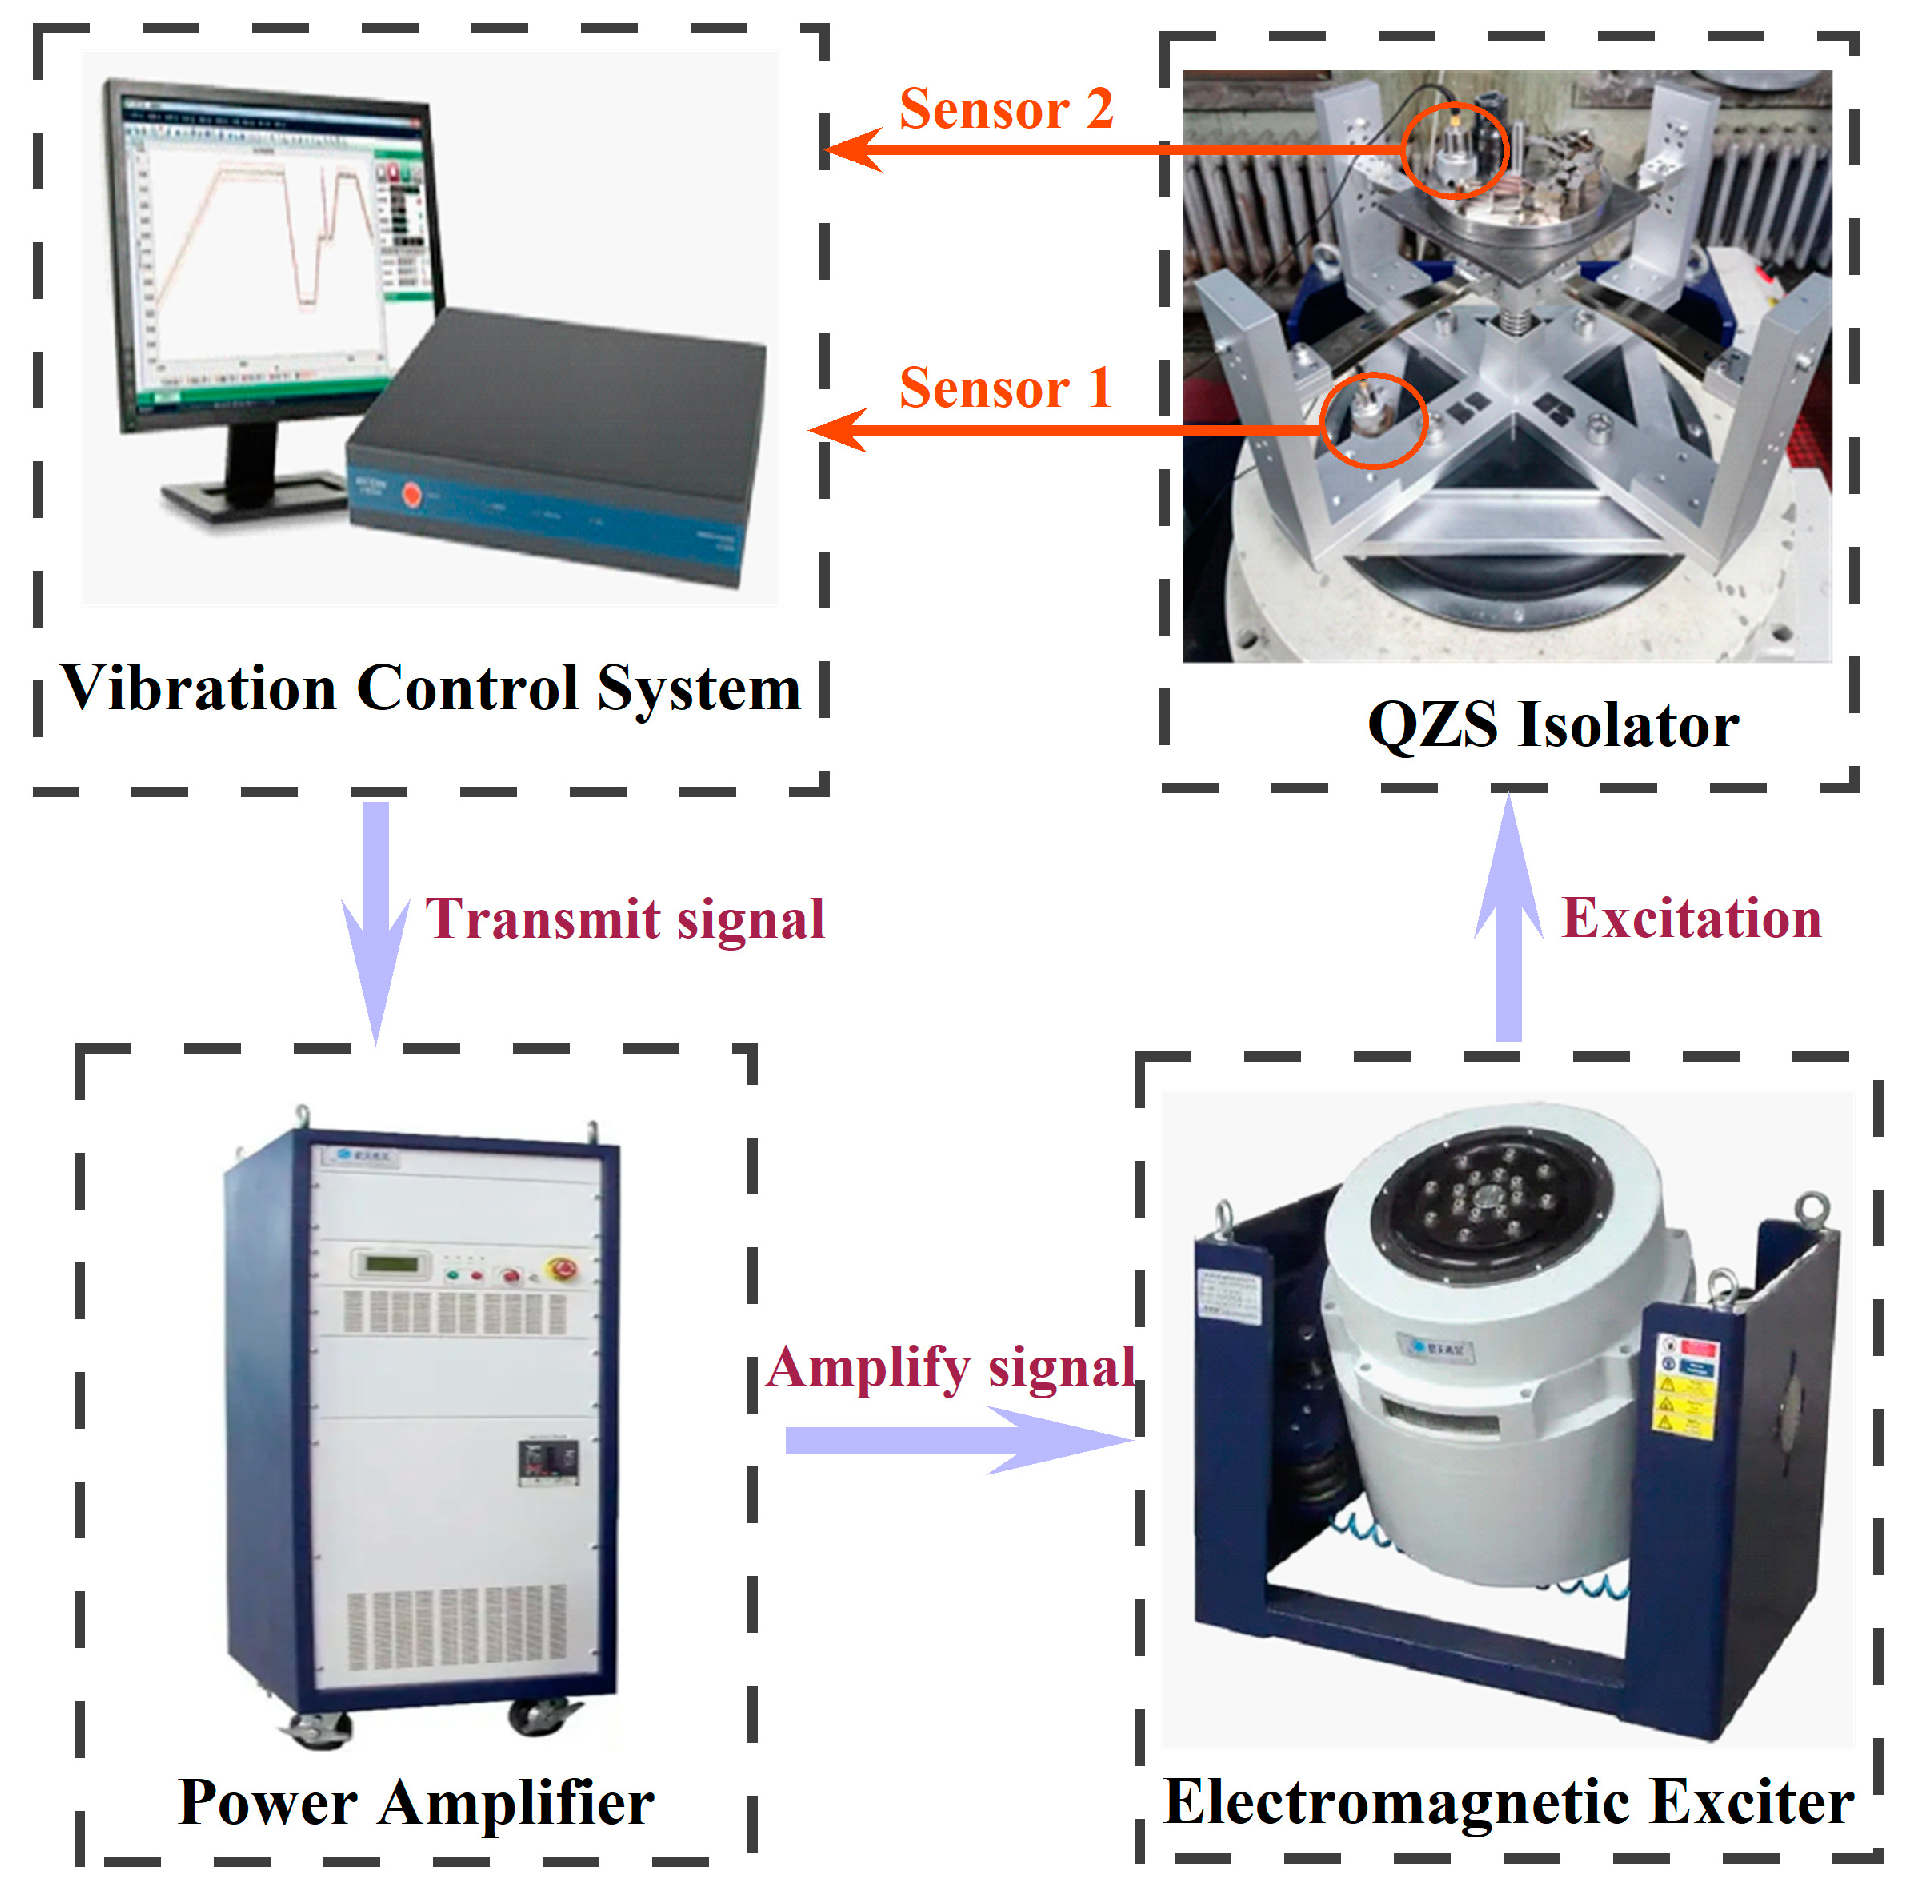
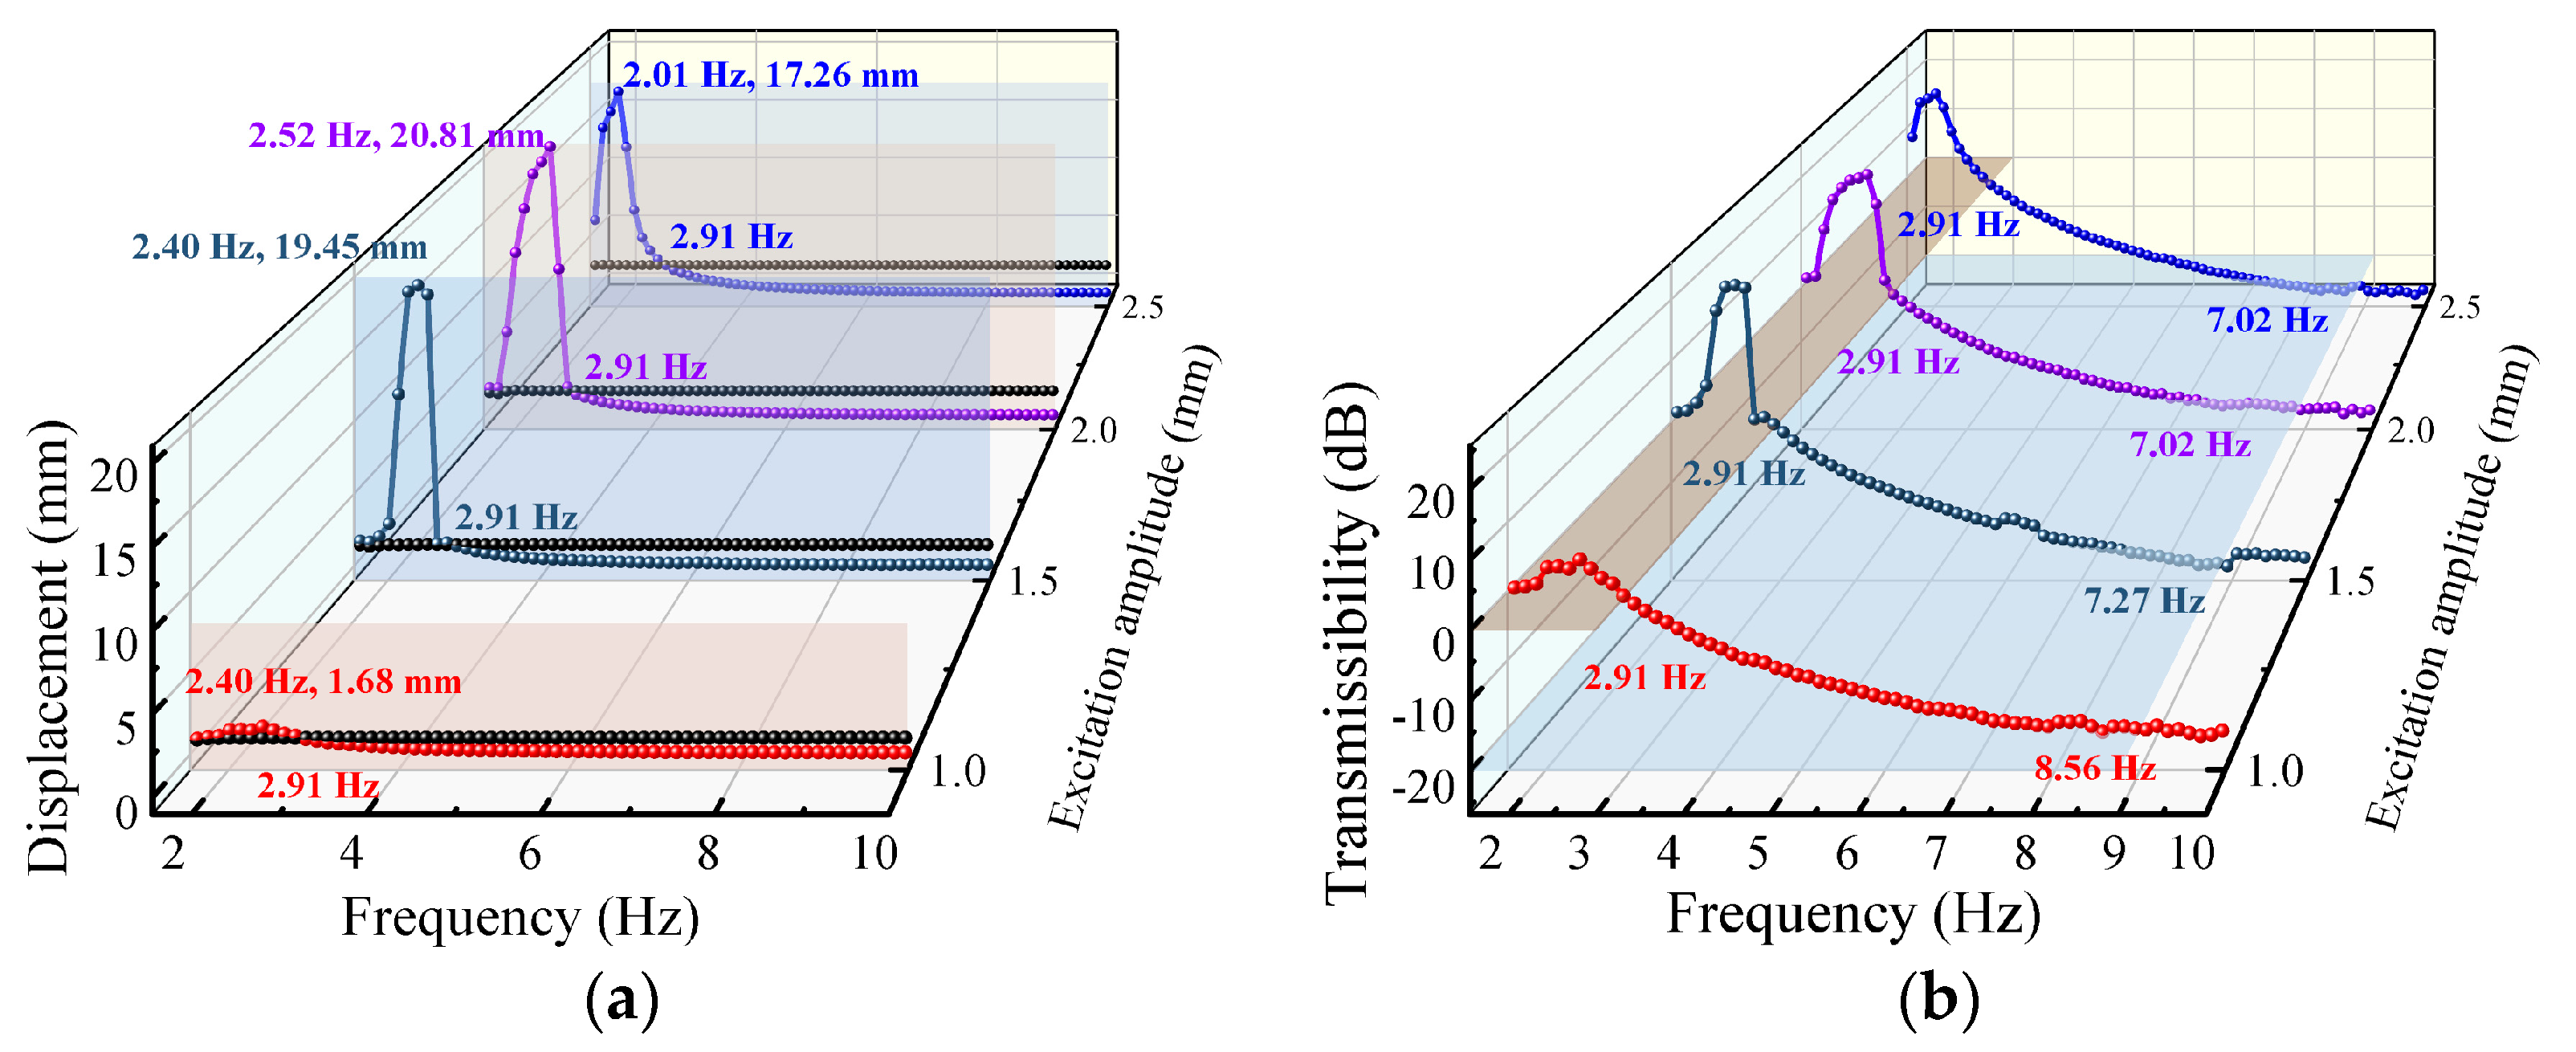
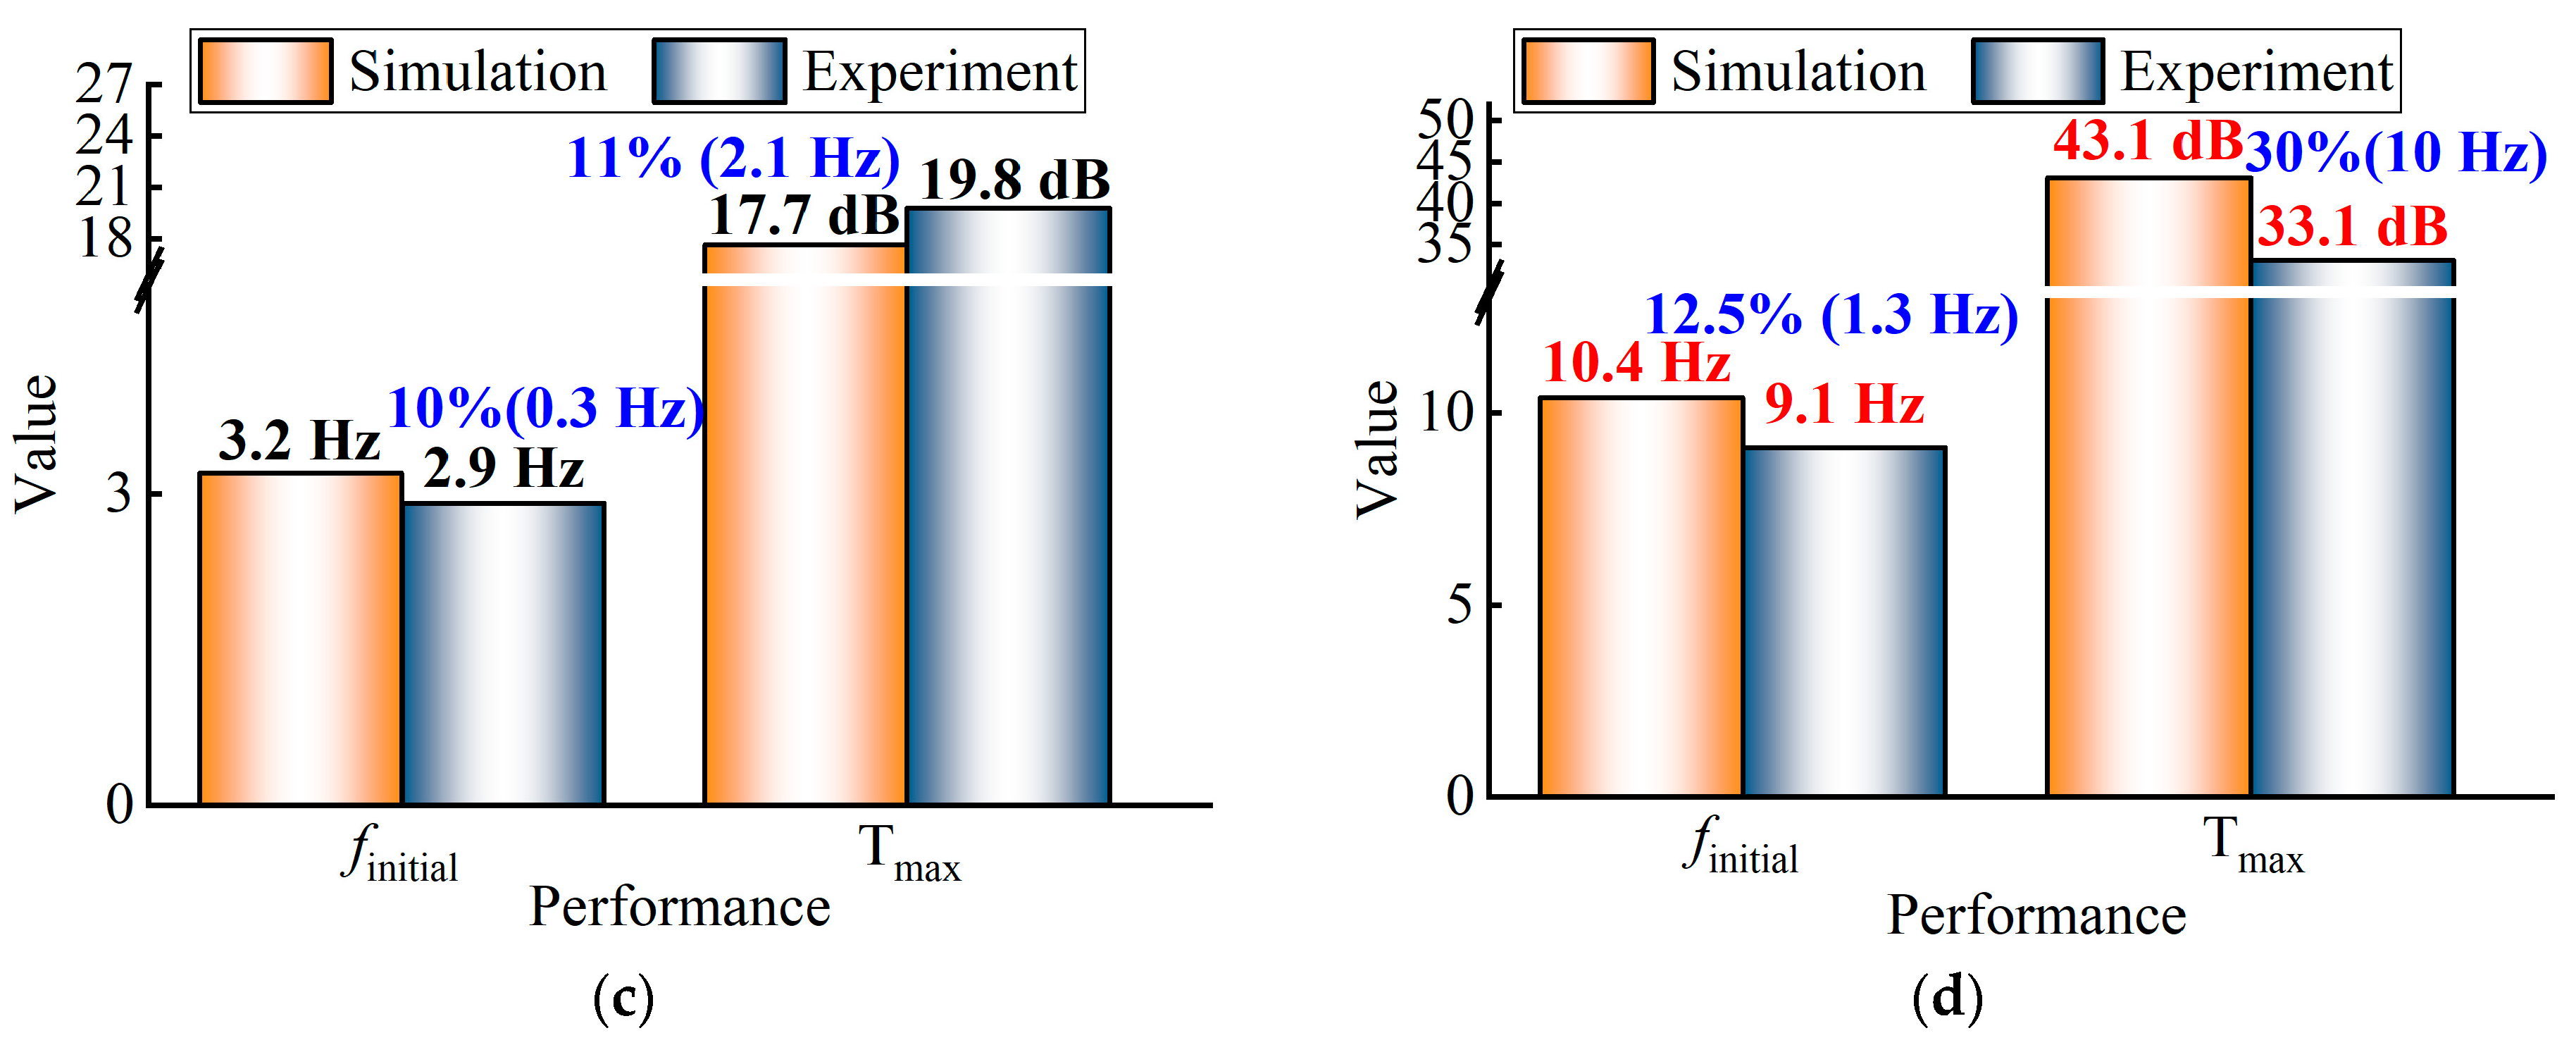
4.2. Dynamic Experiment

Figure 10 shows the dynamic experimental system of the QZS isolator. The vibration control system can set different kinds of excitation signals, and the excitation signals are amplified by the power amplifier and transmitted to the electromagnetic exciter. The excitation signal of the electromagnetic exciter is directly transmitted to the base of the isolator, and the acceleration sensor 1 directly collects the vibration signal of the base of the isolator in real time and, at the same time, feeds the data back to the vibration control system to complete the closed-loop control. The acceleration sensor 2 can collect the output signal of the support platform in real time and transmit the data to the controller to complete data recording and processing.
The amplitude-frequency response curves of the QZS isolator under different excitation amplitudes (1 mm, 1.5 mm, 2 mm, and 2.5 mm) are obtained by frequency sweep (1.5 Hz~10 Hz) (Figure 11a). The black line represents the vibration amplitude of the input signal. The output displacement first increases and then decreases with the frequency, and the frequency corresponding to the intersection point of the output displacement is the initial isolation frequency. The experimental data shows that the initial isolation frequency of the QZS isolator is 2.91 Hz, and as the excitation frequency gradually increases, the transmissibility curve shows a downward trend, which also means that the isolation performance is enhanced. When the QZS isolator is excited by displacements of 1 mm, 1.5 mm, 2 mm, and 2.5 mm, the frequencies corresponding to the transmissibility of −20 dB are 8.56 Hz, 7.27 Hz, 7.02 Hz, and 7.02 Hz. Figure 11c shows the experimental data of two acceleration sensors under different excitation amplitudes and frequencies. It can be found that the QZS isolator is suitable for low frequencies.
The transmissibility of the linear isolator is not affected by the amplitude. The support platform of the isolator designed in this paper is placed on the spring. Since the peak transmissibility of the linear isolator is very large at the resonant frequency, if the input excitation displacement is too large, it will cause a more significant output displacement of the platform. There is an actual risk of separation between the platform and the spring. Therefore, this paper only conducts frequency sweep experiments on the linear isolator with an amplitude of 0.5 mm and a load of 51 N to avoid the actual risk of separation at the resonant frequency. Figure 12a shows that the linear isolator’s peak transmissibility and initial isolation frequency are 33.1 dB and 9.05 Hz, respectively. The corresponding frequency is 21.17 Hz when the transmissibility is −20 dB, so the linear isolator is unsuitable for low frequency. The peak transmissibility, initial isolation frequency, and frequency corresponding to the transmissibility of −20 dB of the QZS isolator shown in Figure 12b are significantly smaller than those of the linear isolator. Compared with the linear isolator, the initial isolation frequency of the QZS isolator is reduced by 67.8%. When the excitation amplitude is 2 mm, the peak transmissibility of the QZS isolator and the frequency corresponding to the transmissibility of −20 dB are reduced by 40.1% and 66.8%, respectively.
Figure 12c,d shows the comparison of simulation data and experimental data. The error of the initial isolation frequency and peak transmissibility of the QZS isolator is only 10% and 11%. However, because the boundary conditions of the finite element simulation are set too ideally, and the influence of the actual frictional damping is not considered, the errors of the linear isolator’s initial isolation frequency and the peak transmissibility are 12.5% and 30%, respectively.
In summary, the finite element simulation and experimental results show that the QZS isolator is suitable for a low-frequency vibration, verifying the correctness of the conclusions obtained from the simulation analysis.
The performance comparison between QZS isolators with different structures is summarized in Table 2 to directly demonstrate the advantages of the trapezoidal beam structure isolators proposed in this paper. Qi et al. [48] used parallel sliding beams and magnetic repulsion to form a QZS isolator. The peak frequency (fpeak) and finitial were 2.67 Hz and 4.0 Hz, respectively, under a load of 29.4 N. Yan et al. [59] proposed a nonlinear compensation method to realize QZS by using the rhombic structure and magnetic repulsion. The experimental results showed that the QZS isolator’s fpeak and finitial were 2 Hz and 4 Hz, respectively, when the load was 5 kg. Liang et al. [60] proposed a statically balanced compliant mechanism consisting of a linear component with positive stiffness (two parallelograms in parallel) and a nonlinear component with negative stiffness (two sets of post-buckled fixed-guided compliant beams in parallel) composition. The finitial was 5.5 Hz when the load was 5.42 N. A W-shaped compliant mechanism with direct QZS was proposed by Xu et al. [61]. Experimental data showed that under load 0.11 kg, the fpeak and finitial were 6.5 Hz and 6.7 Hz, respectively. Yu et al. [62] proposed a hydro-pneumatic near-zero frequency isolator by using the bellows structure to fill the solid and liquid mixture. The isolator could control the gas pressure to adjust the loading capacity and was mainly used for low-frequency isolation of heavy machines. Experimental results showed that when the isolator was loaded with 82 kg, its fpeak and finitial were 3.0 Hz and 4.3 Hz, respectively. Comparing the above studies, it can be found that the QZS isolator designed in this paper has a lower fpeak and finitial.

5. Conclusions

This paper proposes a nonlinear isolator suitable for low-frequency environments, which realizes QZS by inclined trapezoidal beams and linear springs. The static finite element simulation analysis shows that the buckling effect of the trapezoidal beam under compression causes the isolator to have negative stiffness in the vertical direction. After parallel connection with the linear positive stiffness spring, the isolator has a QZS region, forming a QZS isolator. The first-order natural frequency of the QZS isolator is significantly lower than that of the equivalent linear isolator, which is also the working principle of the QZS isolator suitable for low-frequency vibration isolation. In terms of dynamics, finite element simulation analysis and experiments show that the peak transmissibility of the QZS isolator decreases with the damping increase. Compared with the equivalent linear isolator, the QZS isolator has a lower initial isolation frequency. The experimental results verify the accuracy of the finite element simulation and the performance superiority of the proposed QZS isolator. The isolator can be applied to low-frequency vibration isolation of drones, intelligent handling robots, and precision instruments.
According to the conclusions obtained in this paper, future work needs to establish a theoretical mathematical model for large deflection deformation of variable width beams and obtain trapezoidal beams with optimal size parameters through optimization algorithms. The size of the QZS isolator can be flexibly designed for specific loads using dimensionless analysis. Since the stress of the trapezoidal beam is constantly changing during the working process, it is necessary for future work to analyze the fatigue failure of the beam and analyze the influence of different ambient temperatures on the performance of the beam.

Author Contributions

Conceptualization, validation, writing—original draft, resources, G.S.; data curation, validation. X.Z. and S.H.; writing—review and editing, funding acquisition, supervision. X.S., W.H. and J.L. All authors have read and agreed to the published version of the manuscript.

Funding

This research was funded by Yangtze River Delta HIT Robot Technology Research Institute (No. HIT-CXY-CMP2-VSEA-21-01) and the Open Project Program (No. WDZL-2021-03).

Data Availability Statement

The data of this work are available from the corresponding author upon reasonable request.

Conflicts of Interest

The authors declare no conflict of interest.

References

  1. Erfani, A.; Ghandehariun, A.; Afsharfard, A. Experimental investigation and optimization of low-frequency vibration-assisted drilling. Int. J. Adv. Manuf. Technol. 2022, 123, 3171–3182. [Google Scholar] [CrossRef]
  2. Xin, S.; Peng, F.; Tang, X.; Yan, R.; Li, Z.; Wu, J. Research on the influence of robot structural mode on regenerative chatter in milling and analysis of stability boundary improvement domain. Int. J. Mach. Tools Manuf. 2022, 179, 103918. [Google Scholar] [CrossRef]
  3. Lian, X.; Deng, H.; Han, G.; Jiang, F.; Zhu, L.; Shao, M.; Liu, X.; Hu, R.; Gao, Y.; Ma, M.; et al. A low-frequency micro-vibration absorber based on a designable quasi-zero stiffness beam. Aerosp. Sci. Technol. 2023, 132, 108044. [Google Scholar] [CrossRef]
  4. Li, Q.; Du, Z.; Liu, F.; Yu, H. Tactile Perception for Surgical Status Recognition in Robot-Assisted Laminectomy. IEEE Trans. Ind. Electron. 2022, 69, 11425–11435. [Google Scholar] [CrossRef]
  5. Ding, Y.; Rui, X.; Chen, Y.; Lu, H.; Chang, Y.; Wei, W. Theoretical and experimental investigation on the surface stripes formation in ultra-precision fly cutting machining. Int. J. Adv. Manuf. Technol. 2023, 124, 1041–1063. [Google Scholar] [CrossRef]
  6. Li, J.-Y.; Zhu, S. Self-Powered Active Vibration Control: Concept, Modeling, and Testing. Engineering 2022, 11, 126–137. [Google Scholar] [CrossRef]
  7. Liu, X.; Lv, L.; Peng, F.; Cai, G. Wave-based active vibration control of a membrane structure. J. Vib. Control 2023, 29, 118–130. [Google Scholar] [CrossRef]
  8. Xu, J.; Zhou, W.; Jing, J. An electromagnetic torsion active vibration absorber based on the FxLMS algorithm. J. Sound Vibr. 2022, 524, 116734. [Google Scholar] [CrossRef]
  9. Abe, M.; Hara, Y.; Otsuka, K.; Makihara, K. Semi-active switching vibration control with tree-based prediction and optimization strategy. J. Intell. Mater. Syst. Struct. 2023, 34, 440–460. [Google Scholar] [CrossRef]
  10. Takamoto, I.; Abe, M.; Hara, Y.; Otsuka, K.; Makihara, K. Comprehensive predictive control for vibration suppression based on piecewise constant input formulation. J. Intell. Mater. Syst. Struct. 2022, 33, 901–917. [Google Scholar] [CrossRef]
  11. Zheng, S.; Shen, Q.; Guan, C.; Cheng, H.; Zhuang, H.; Zhou, M. Semi-Active Control of Seismic Response on Prestressed Concrete Continuous Girder Bridges with Corrugated Steel Webs. Appl. Sci. Basel 2022, 12, 12881. [Google Scholar] [CrossRef]
  12. Feng, X.; Jing, X.; Guo, Y. Vibration isolation with passive linkage mechanisms. Nonlinear Dyn. 2021, 106, 1891–1927. [Google Scholar] [CrossRef]
  13. Ikeda, Y.; Matsumoto, Y. Unified description of passive vibration control for buildings based on pole allocation applied to three-degree-of-freedom model. Struct. Control. Health Monit. 2022, 29, e2995. [Google Scholar] [CrossRef]
  14. Jiang, G.; Wang, Y.; Li, F.; Jing, X. An integrated nonlinear passive vibration control system and its vibration reduction properties. J. Sound Vibr. 2021, 509, 116231. [Google Scholar] [CrossRef]
  15. Al Rifaie, M.; Abdulhadi, H.; Mian, A. Advances in mechanical metamaterials for vibration isolation: A review. Adv. Mech. Eng. 2022, 14, 16878132221082872. [Google Scholar] [CrossRef]
  16. Gong, W.; Li, A.; Huang, C.; Che, H.; Feng, C.; Qin, F. Effects and Prospects of the Vibration Isolation Methods for an Atomic Interference Gravimeter. Sensors 2022, 22, 583. [Google Scholar] [CrossRef]
  17. Chong, X.; Wu, Z.; Li, F. Vibration isolation properties of the nonlinear X-combined structure with a high-static and low-dynamic stiffness: Theory and experiment. Mech. Syst. Signal Proc. 2022, 179, 109352. [Google Scholar] [CrossRef]
  18. Su, P.; Jun, C.; Liu, S.; Wu, J. Design and Analysis of a Vibration Isolator with Adjustable High Static-Low Dynamic Stiffness. Iran J. Sci. Technol. Trans. Mech. Eng. 2022, 46, 1195–1207. [Google Scholar] [CrossRef]
  19. Wang, X.; Yu, N.; Wu, C.; Zhang, W.; Yan, B. Lever-type high-static-low-dynamic-stiffness vibration isolator with electromagnetic shunt damping. Int. J. Non Linear Mech. 2022, 146, 104128. [Google Scholar] [CrossRef]
  20. Habegger, J.; Hassan, M.; Oliver, M. An Experimental Investigation of the Displacement Transmissibility for a Two-Stage HSLD Stiffness System. Vibration 2022, 5, 676–691. [Google Scholar] [CrossRef]
  21. van Dorsser, W.D.; Barents, R.; Wisse, B.M.; Schenk, M.; Herder, J.L. Energy-free adjustment of gravity equilibrators by adjusting the spring stiffness. Proc. Inst. Mech. Eng. Part C J. Eng. Mech. Eng. Sci. 2008, 222, 1839–1846. [Google Scholar] [CrossRef]
  22. Franco, J.A.; Gallego, J.A.; Herder, J.L. Static Balancing of Four-Bar Compliant Mechanisms With Torsion Springs by Exerting Negative Stiffness Using Linear Spring At the Instant Center of Rotation. J. Mech. Robot. 2021, 13, 031010. [Google Scholar] [CrossRef]
  23. Nguyen, V.L. Gravity Balancing of a Two-Degree-of-Freedom Parallel Robotic Platform With Variable Payloads. J. Mech. Des. 2023, 145, 024501. [Google Scholar] [CrossRef]
  24. Mottola, G.; Cocconcelli, M.; Rubini, R.; Carricato, M. Gravity Balancing of Parallel Robots by Constant-Force Generators. In Gravity Compensation in Robotics; Arakelian, V., Ed.; Springer International Publishing: Cham, Switzerland, 2022; pp. 229–273. [Google Scholar]
  25. Wang, P.; Xu, Q. Design and modeling of constant-force mechanisms: A survey. Mech. Mach. Theory 2018, 119, 1–21. [Google Scholar] [CrossRef]
  26. Ling, J.; Ye, T.; Feng, Z.; Zhu, Y.; Li, Y.; Xiao, X. A survey on synthesis of compliant constant force/torque mechanisms? Mech. Mach. Theory 2022, 176, 104970. [Google Scholar] [CrossRef]
  27. Tong, Z.; Zhang, X.; Wang, G. Automatic Optimization for Compliant Constant Force Mechanisms. Actuators 2023, 12, 61. [Google Scholar] [CrossRef]
  28. Zhang, Q.; Yan, P.; Wang, H. A curved-beam based quasi-constant force mechanism supporting large range and force-sensitive robotic manipulation. Mech. Mach. Theory 2022, 172, 104799. [Google Scholar] [CrossRef]
  29. Schenk, M.; Guest, S.D. On zero stiffness. Proc. Inst. Mech. Eng. Part C J. Eng. Mech. Eng. Sci. 2014, 228, 1701–1714. [Google Scholar] [CrossRef]
  30. Ma, Z.; Zhou, R.; Yang, Q. Recent Advances in Quasi-Zero Stiffness Vibration Isolation Systems: An Overview and Future Possibilities. Machines 2022, 10, 813. [Google Scholar] [CrossRef]
  31. Cai, C.; Zhou, J.; Wang, K.; Lin, Q.; Xu, D.; Wen, G. Quasi-zero-stiffness metamaterial pipe for low-frequency wave attenuation. Eng. Struct. 2023, 279, 115580. [Google Scholar] [CrossRef]
  32. Yan, G.; Zou, H.X.; Wang, S.; Zhao, L.C.; Gao, Q.H.; Tan, T.; Zhan, W.M. Large stroke quasi-zero stiffness vibration isolator using three-link mechanism. J. Sound Vibr. 2020, 478, 115344. [Google Scholar] [CrossRef]
  33. Zhang, Q.; Guo, D.; Hu, G. Tailored Mechanical Metamaterials with Programmable Quasi-Zero-Stiffness Features for Full-Band Vibration Isolation. Adv. Funct. Mater. 2021, 31, 2101428. [Google Scholar] [CrossRef]
  34. Yan, L.; Gong, X. Experimental Study of Vibration Isolation Characteristics of a Geometric Anti-Spring Isolator. Appl. Sci. Basel 2017, 7, 711. [Google Scholar] [CrossRef]
  35. Yan, L.; Xuan, S.; Gong, X. Shock isolation performance of a geometric anti-spring isolator. J. Sound Vibr. 2018, 413, 120–143. [Google Scholar] [CrossRef]
  36. Zhou, J.; Pan, H.; Cai, C.; Xu, D. Tunable ultralow frequency wave attenuations in one-dimensional quasi-zero-stiffness metamaterial. Int. J. Mech. Mater. Des. 2021, 17, 285–300. [Google Scholar] [CrossRef]
  37. Wang, D.W.; Zhang, Q.; Hu, G.K. Low Frequency Waterborne Sound Insulation Based on Sandwich Panels With Quasi-Zero-Stiffness Truss Core. J. Appl. Mech. Trans. ASME 2023, 90, 031006. [Google Scholar] [CrossRef]
  38. Yu, B.; Liu, H.; Fan, D.; Xie, X. Design of quasi-zero stiffness compliant shock isolator under strong shock excitation. Precis. Eng. J. Int. Soc. Precis. Eng. Nanotechnol. 2022, 78, 47–59. [Google Scholar] [CrossRef]
  39. Liu, C.; Yu, K. Design and experimental study of a quasi-zero-stiffness vibration isolator incorporating transverse groove springs. Arch. Civ. Mech. Eng. 2020, 20, 67. [Google Scholar] [CrossRef]
  40. Xu, D.; Zhang, Y.; Zhou, J.; Lou, J. On the analytical and experimental assessment of the performance of a quasi-zero-stiffness isolator. J. Vib. Control 2014, 20, 2314–2325. [Google Scholar] [CrossRef]
  41. Meng, H.; Huang, X.; Chen, Y.; Theodossiades, S.; Chronopoulos, D. Structural vibration absorption in multilayered sandwich structures using negative stiffness nonlinear oscillators. Appl. Acoust. 2021, 182, 108240. [Google Scholar] [CrossRef]
  42. Chondrogiannis, K.A.; Colombi, A.; Dertimanis, V.; Chatzi, E. Computational Verification and Experimental Validation of the Vibration-Attenuation Properties of a Geometrically Nonlinear Metamaterial Design. Phys. Rev. Appl. 2022, 17, 054023. [Google Scholar] [CrossRef]
  43. Zhao, Y.M.; Cui, J.N.; Zou, L.M. Genetic Optimization of Repulsive Magnetic Array Negative Stiffness Structure for High-Performance Precision Micro-vibration Isolation. J. Vib. Eng. Technol. 2022, 10, 1325–1336. [Google Scholar] [CrossRef]
  44. Wang, S.; Xin, W.; Ning, Y.; Li, B.; Hu, Y. Design, Experiment, and Improvement of a Quasi-Zero-Stiffness Vibration Isolation System. Appl. Sci. Basel 2020, 10, 2273. [Google Scholar] [CrossRef]
  45. Virk, K.; Monti, A.; Trehard, T.; Marsh, M.; Hazra, K.; Boba, K.; Remillat, C.D.L.; Scarpa, F.; Farrow, I.R. SILICOMB PEEK Kirigami cellular structures: Mechanical response and energy dissipation through zero and negative stiffness. Smart Mater. Struct. 2013, 22, 084014. [Google Scholar] [CrossRef]
  46. Carrella, A.; Brennan, M.J.; Waters, T.P. Static analysis of a passive vibration isolator with quasi-zero-stiffness characteristic. J. Sound Vibr. 2007, 301, 678–689. [Google Scholar] [CrossRef]
  47. Xie, Y.; Niu, F.; Sun, J.; Meng, L. Design and Analysis of a Novel Quasi-Zero Stiffness Isolator under Variable Loads. Math. Probl. Eng. 2022, 2022, 9082752. [Google Scholar] [CrossRef]
  48. Qi, W.H.; Yan, G.; Lu, J.J.; Yan, H.; Shi, J.W.; Wei, X.S.; Wang, S.; Zhang, W.M. Magnetically modulated sliding structure for low frequency vibration isolation. J. Sound Vibr. 2022, 526, 116819. [Google Scholar] [CrossRef]
  49. Zhang, Y.; Liu, Q.H.; Lei, Y.G.; Cao, J.Y.; Liao, W.H. Halbach high negative stiffness isolator: Modeling and experiments. Mech. Syst. Signal Proc. 2023, 188, 110014. [Google Scholar] [CrossRef]
  50. Ye, K.; Ji, J.C.; Brown, T. Design of a quasi-zero stiffness isolation system for supporting different loads. J. Sound Vibr. 2020, 471, 115198. [Google Scholar] [CrossRef]
  51. Zheng, Y.W.; Shangguan, W.B.; Yin, Z.H.; Liu, X.A. Design and modeling of a quasi-zero stiffness isolator for different loads. Mech. Syst. Signal Proc. 2023, 188, 110017. [Google Scholar] [CrossRef]
  52. Zhang, Z.W.; Xu, Z.D. Cylindrical metastructure simulating yielding with elastic deformation: Theoretical and experimental studies. Mater. Today Commun. 2022, 33, 104455. [Google Scholar] [CrossRef]
  53. Wang, D.X.; Zhao, J.L.; Ma, Q.; Zhou, G.; Zhang, D.Z.; Zhu, R. Uncertainty analysis of quasi-zero stiffness metastructure for vibration isolation performance. Front. Phys. 2022, 10, 957594. [Google Scholar] [CrossRef]
  54. Cai, C.Q.; Zhou, J.X.; Wu, L.C.; Wang, K.; Xu, D.L.; Ouyang, H.J. Design and numerical validation of quasi-zero-stiffness metamaterials for very low-frequency band gaps. Compos. Struct. 2020, 236, 111862. [Google Scholar] [CrossRef]
  55. Cortes, S.; Allison, J.; Morris, C.; Haberman, M.R.; Seepersad, C.C.; Kovar, D. Design, Manufacture, and Quasi-Static Testing of Metallic Negative Stiffness Structures within a Polymer Matrix. Exp. Mech. 2017, 57, 1183–1191. [Google Scholar] [CrossRef]
  56. Tan, X.; Wang, L.; Zhu, S.; Chen, S.; Wang, B.; Kadic, M. A general strategy for performance enhancement of negative stiffness mechanical metamaterials. Eur. J. Mech. A Solids 2022, 96, 104702. [Google Scholar] [CrossRef]
  57. Correa, D.M.; Klatt, T.; Cortes, S.; Haberman, M.; Kovar, D.; Seepersad, C. Negative stiffness honeycombs for recoverable shock isolation. Rapid Prototyp. J. 2015, 21, 193–200. [Google Scholar] [CrossRef]
  58. Zhao, J.; Jia, J.; He, X.; Wang, H. Post-buckling and snap-through behavior of inclined slender beams. J. Appl. Mech.-Trans. ASME 2008, 75, 041020. [Google Scholar] [CrossRef]
  59. Yan, G.; Wu, Z.Y.; Wei, X.S.; Wang, S.; Zou, H.X.; Zhao, L.C.; Qi, W.H.; Zhang, W.M. Nonlinear compensation method for quasi-zero stiffness vibration isolation. J. Sound Vibr. 2022, 523, 116743. [Google Scholar] [CrossRef]
  60. Liang, H.T.; Hao, G.B.; Olszewski, O.Z.; Pakrashi, V. Ultra-low wide bandwidth vibrational energy harvesting using a statically balanced compliant mechanism. Int. J. Mech. Sci. 2022, 219, 107130. [Google Scholar] [CrossRef]
  61. Xu, L.; Xiang, Z. Compliant quasi-zero stiffness device for vibration energy harvesting and isolation. Sens. Actuator A-Phys. 2022, 347, 113964. [Google Scholar] [CrossRef]
  62. Yu, H.; Gao, X. Modeling and Stiffness Properties for the Hydro-pneumatic Near-Zero Frequency Vibration Isolator with Piecewise Smooth Stiffness. J. Vib. Eng. Technol. 2022, 10, 527–539. [Google Scholar] [CrossRef]
Figure 1. The structure diagram of the trapezoidal beam QZS isolator.
Machines 11 00512 g001
Figure 2. Finite element simulation analysis of inclined trapezoidal beam. (a) Mesh and boundary conditions of inclined trapezoidal beams; (b) Stiffness characteristic curve of trapezoidal beam; (c) Stress of trapezoidal beams under different compressive displacements; (d) Shape changes of trapezoidal beams under different compression displacements.
Machines 11 00512 g002
Figure 3. Static compression simulation of isolator. (a) Meshing and boundary conditions; (b) Force-displacement curve.
Machines 11 00512 g003
Figure 4. First-order vibration mode diagram. (a) Vibration mode diagram of the isolator without load; (b) Vibration mode diagram of the isolator when the load is 51 N; (c) Vibration mode diagram of the isolator when the load is 70 N; (d) Vibration mode diagram of linear system.
Machines 11 00512 g004
Figure 5. Performance of isolators affected by different damping. (a) Transmissibility curves of QZS isolator and linear isolator with a load of 51 N; (b) Performance comparison chart of initial vibration isolation frequency (finitial) of QZS isolator and linear isolator; (c) Performance comparison chart of peak transmissibility (Tmax) of QZS isolator and linear isolator.
Machines 11 00512 g005
Figure 6. Performance of isolators affected by different acceleration and amplitude. (a) Transmissibility curves of the isolator affected by different accelerations under the condition that the load is 51 N and the damping ratio is 0.1; (b) Transmissibility curves of the isolator affected by different excitation amplitudes under the condition that the load is 51 N and the damping ratio is 0.1; (c) Performance comparison chart of finitial of QZS isolator and linear isolator; (d) Performance comparison chart of Tmax of QZS isolator and linear isolator.
Machines 11 00512 g006
Figure 7. Performance of isolators affected by different load. (a) Transmissibility curves of the isolator affected by different loads when the excitation amplitude is 2 mm and the damping ratio is 0.1; (b) Performance comparison chart of finitial of QZS isolator and linear isolator; (c) Performance comparison chart of Tmax of QZS isolator and linear isolator; (d) Time-domain displacement plots of isolators with different loads.
Machines 11 00512 g007
Figure 8. Static compression experiment.
Machines 11 00512 g008
Figure 9. The force-displacement curve of the QZS isolator. (a) In parallel with the stiffness 5.18 N/mm linear spring; (b) In parallel with the stiffness 5.90 N/mm linear spring; (c) In parallel with the stiffness 5.40 N/mm linear spring; (d) Stiffness values of region II.
Machines 11 00512 g009
Figure 10. Dynamic experimental system of QZS isolator.
Machines 11 00512 g010
Figure 11. Dynamic responses of QZS isolators at different excitation amplitudes. (a) Amplitude frequency curve; (b) Transmissibility curve; (c) Acceleration curve of the QZS isolator subjected to different excitation frequencies.
Machines 11 00512 g011aMachines 11 00512 g011b
Figure 12. (a) Dynamic responses of linear isolator; (b) Performance comparison between QZS isolator and linear isolator; (c) Comparison of simulation and experimental data of QZS isolator; (d) Comparison of simulation and experimental data of linear isolator.
Machines 11 00512 g012aMachines 11 00512 g012b
Table 1. Structural and material parameters of trapezoidal beams.
ParametersValuesUnits
Width30 and 15mm
Length130.35mm
Thickness0.5mm
Inclination angle4.2°
Density7810kg/m3
Young’s Modulus159.15GPa
Poisson’s Ratio0.3
Table 2. Performance comparison between the reported and designed QZS isolator.
LiteratureLoadfpeak (Hz)finitial (Hz)
[48]29.4 N2.674.0
[59]5.0 kg2.04.0
[60]5.42 N-5.5
[61]0.11 kg6.56.7
[62]82.0 kg3.04.3
This work51.0 N2.01 2.9
Disclaimer/Publisher’s Note: The statements, opinions and data contained in all publications are solely those of the individual author(s) and contributor(s) and not of MDPI and/or the editor(s). MDPI and/or the editor(s) disclaim responsibility for any injury to people or property resulting from any ideas, methods, instructions or products referred to in the content.

