1. Introduction
Physical activity is defined as any body movement that originates from the musculoskeletal system and has energy consumption [
1]. Physical activity is being broadly researched in various areas: chronic disease prevention; injury risk reduction; increasing work ergonomics; eliminating function disorders caused by disability, etc. There is a connection between human body movements and general health, especially related to cardiovascular diseases, diabetes, or obesity. Musculoskeletal dysfunction means an increased risk of comorbidities [
2]. The aforementioned reasons together with increasing technological possibilities have resulted in the musculoskeletal system becoming an increasingly frequent object of study. This is further supported by the increasing burden of musculoskeletal disorders worldwide [
3,
4]. There are many ongoing projects involving modeling and analysis of a whole or part of a kinematic or dynamic human body system. Ergonomics and movements related to everyday work are particularly relevant and often studied. This can be explained by the fact that a person spends a large part of the day at work. For this reason, many studies are conducted to identify hazards, assess risks, or provide recommendations and solutions to make daily tasks easier or safer as work-related musculoskeletal disorders are one of the most common health problems in the healthcare sector [
5].
Healthcare and social welfare sectors are increasing on a yearly basis as noted in various studies [
6]. This growth has resulted in an increase in the number of women working in the social welfare sector, where they are more susceptible to developing musculoskeletal injuries. Furthermore, with the general population aging, the risk of developing such injuries has also increased [
7]. These injuries are not limited to acute incidents, but also include chronic conditions, particularly among patient transportation workers, where the impact of load-bearing activities on the human body is difficult to standardize and define. Studies conducted by Mai, H.B. and Kim, J. on 265 Vietnamese participants revealed that most of the participants experienced work-related muscle skeletal disorders in their lower back (65.3%), neck and shoulder (61.8%), and knee (42.2%) [
8]. Similar results were also identified in a study conducted on the Swedish population [
9]. This highlights the importance of understanding the impact of work-related activities on the musculoskeletal system, particularly as it pertains to lower back and leg modeling, which have been the focus of recent research [
10,
11,
12].
Despite recent advancements in lower back and leg modeling, there is a dearth of models focusing on the arms. In a study conducted by Hellig T. et. al., limitations were identified in that only static observations were conducted, and it was recommended that dynamic movements and arm analysis be conducted [
13]. As the arms are highly susceptible to developing musculoskeletal disorders and are less researched compared to other body parts, this research will focus specifically on arm modeling, even though, when fully developed it should allow analysis of the full body. This study aims to provide further insights into the relationship between work-related activities and musculoskeletal disorders in the arms, while developing a new tool to further perform such analyses. The musculoskeletal systems of humans mechanically are very complex and computational models must be highly simplified in order to be efficient [
14]. Gathering and processing biomechanical data requires compromises to define boundary conditions. Model availability and accessibility are a resource that might limit researchers if there is a lack of it or usage is limited or constrained. Biomechanical data processing softwares, such as Biomechanics of Bodies (BoB), AnyBody, or OpenSim has native skeletal models incorporated with ability to calculate kinematics and dynamics. Kinematics is a very important part, because the results of the dynamics depend on it. A lot of the models on the market today focus on the lower body and mostly gait [
15,
16,
17]. BTS Bioengineering motion capture system has widely developed the Helen Hayes Protocol which allows to perform detailed gait analysis [
18]. But what if a researcher needs full body analysis with particular attention to the upper extremities? This creates a need for the customization and alteration of existing models. If another movement is analyzed, but not gait, then problems are immediately encountered, such as which model to choose for such cases, and unfortunately the offer is very limited. In that case, having access to different software broadens the accessibility to the research being done. Grasshopper is an algorithmic modeling plugin that is a supplementary component of 3D modeling software—Rhino. It is a visual programming language tool that allows the user to manipulate node elements to create various geometrical and mathematical operations within the design canvas. It was first released in September 2007 [
19]. It is a powerful tool widely used by various engineers and designers to develop custom scripts [
19]. Since it is flexible tool that is able to read, write, and manipulate or process various data with pre-integrated tools it was recommended that it might be supplementary for the biomechanics field [
20,
21,
22,
23]. This tool brings biomechanical research access at a very affordable price and allows engineers and researchers who already have 3D modeling or visual programing experience to use their knowledge in building skeletal models in Rhino Grasshopper. Every additional model that calculates body kinematics or dynamics increases diversity by increasing the variety of research tools available. Eventually, every new model might provide a new approach to the solution being made and this increases the accessibility of research being done in a field. This flexibility and variety of tools becomes extremely important when customizations are needed, since learning a new software, programing, or script language might take a lot of time and undergo trial and error. Even so, creating a new model, data processing, or algorithm interpretation in a known biomechanical software requires confirmation and verification with an appropriate sample and population just as with any new tool. Having this in mind, it can be created in any software that is capable of generating the needed data.
This paper aims to develop and investigate Rhino Grasshopper software and its capabilities to serve as a platform for a kinematics computational pilot model. The model was created to introduce an additional tool that could be used for body motion analysis. Computational data of arms range of motion (ROM) were used to compare the BoB model with Rhino Grasshopper.
2. Materials and Methods
2.1. Subject and Movement Selection
The model of this research was created and evaluated on the basis of a single case. It is recommended to test a kinematic computation model through each joint’s range of motions by matching experimental data [
24]. For the test subject, a regular size male was chosen. The test subjects’ anthropometric data can be seen in
Table 1. To make the lifting procedure more realistic, a person imitating a patient was chosen. For the accompanying patient, a 53 kg, 176 cm height female was chosen. Various research uses a small sample size ranging from 3 to 10 for mode verifications [
25,
26,
27,
28]. To have statistical reliability, 5 measurements were made of which the 3 best were taken for further processing and analysis. As this study focuses on the model confirmation, it was identified that different measurements of the same person provide sufficient kinematic differences between measurements and movement. This produces at least 3 different measurements that are the statistical minimum needed to perform analysis.
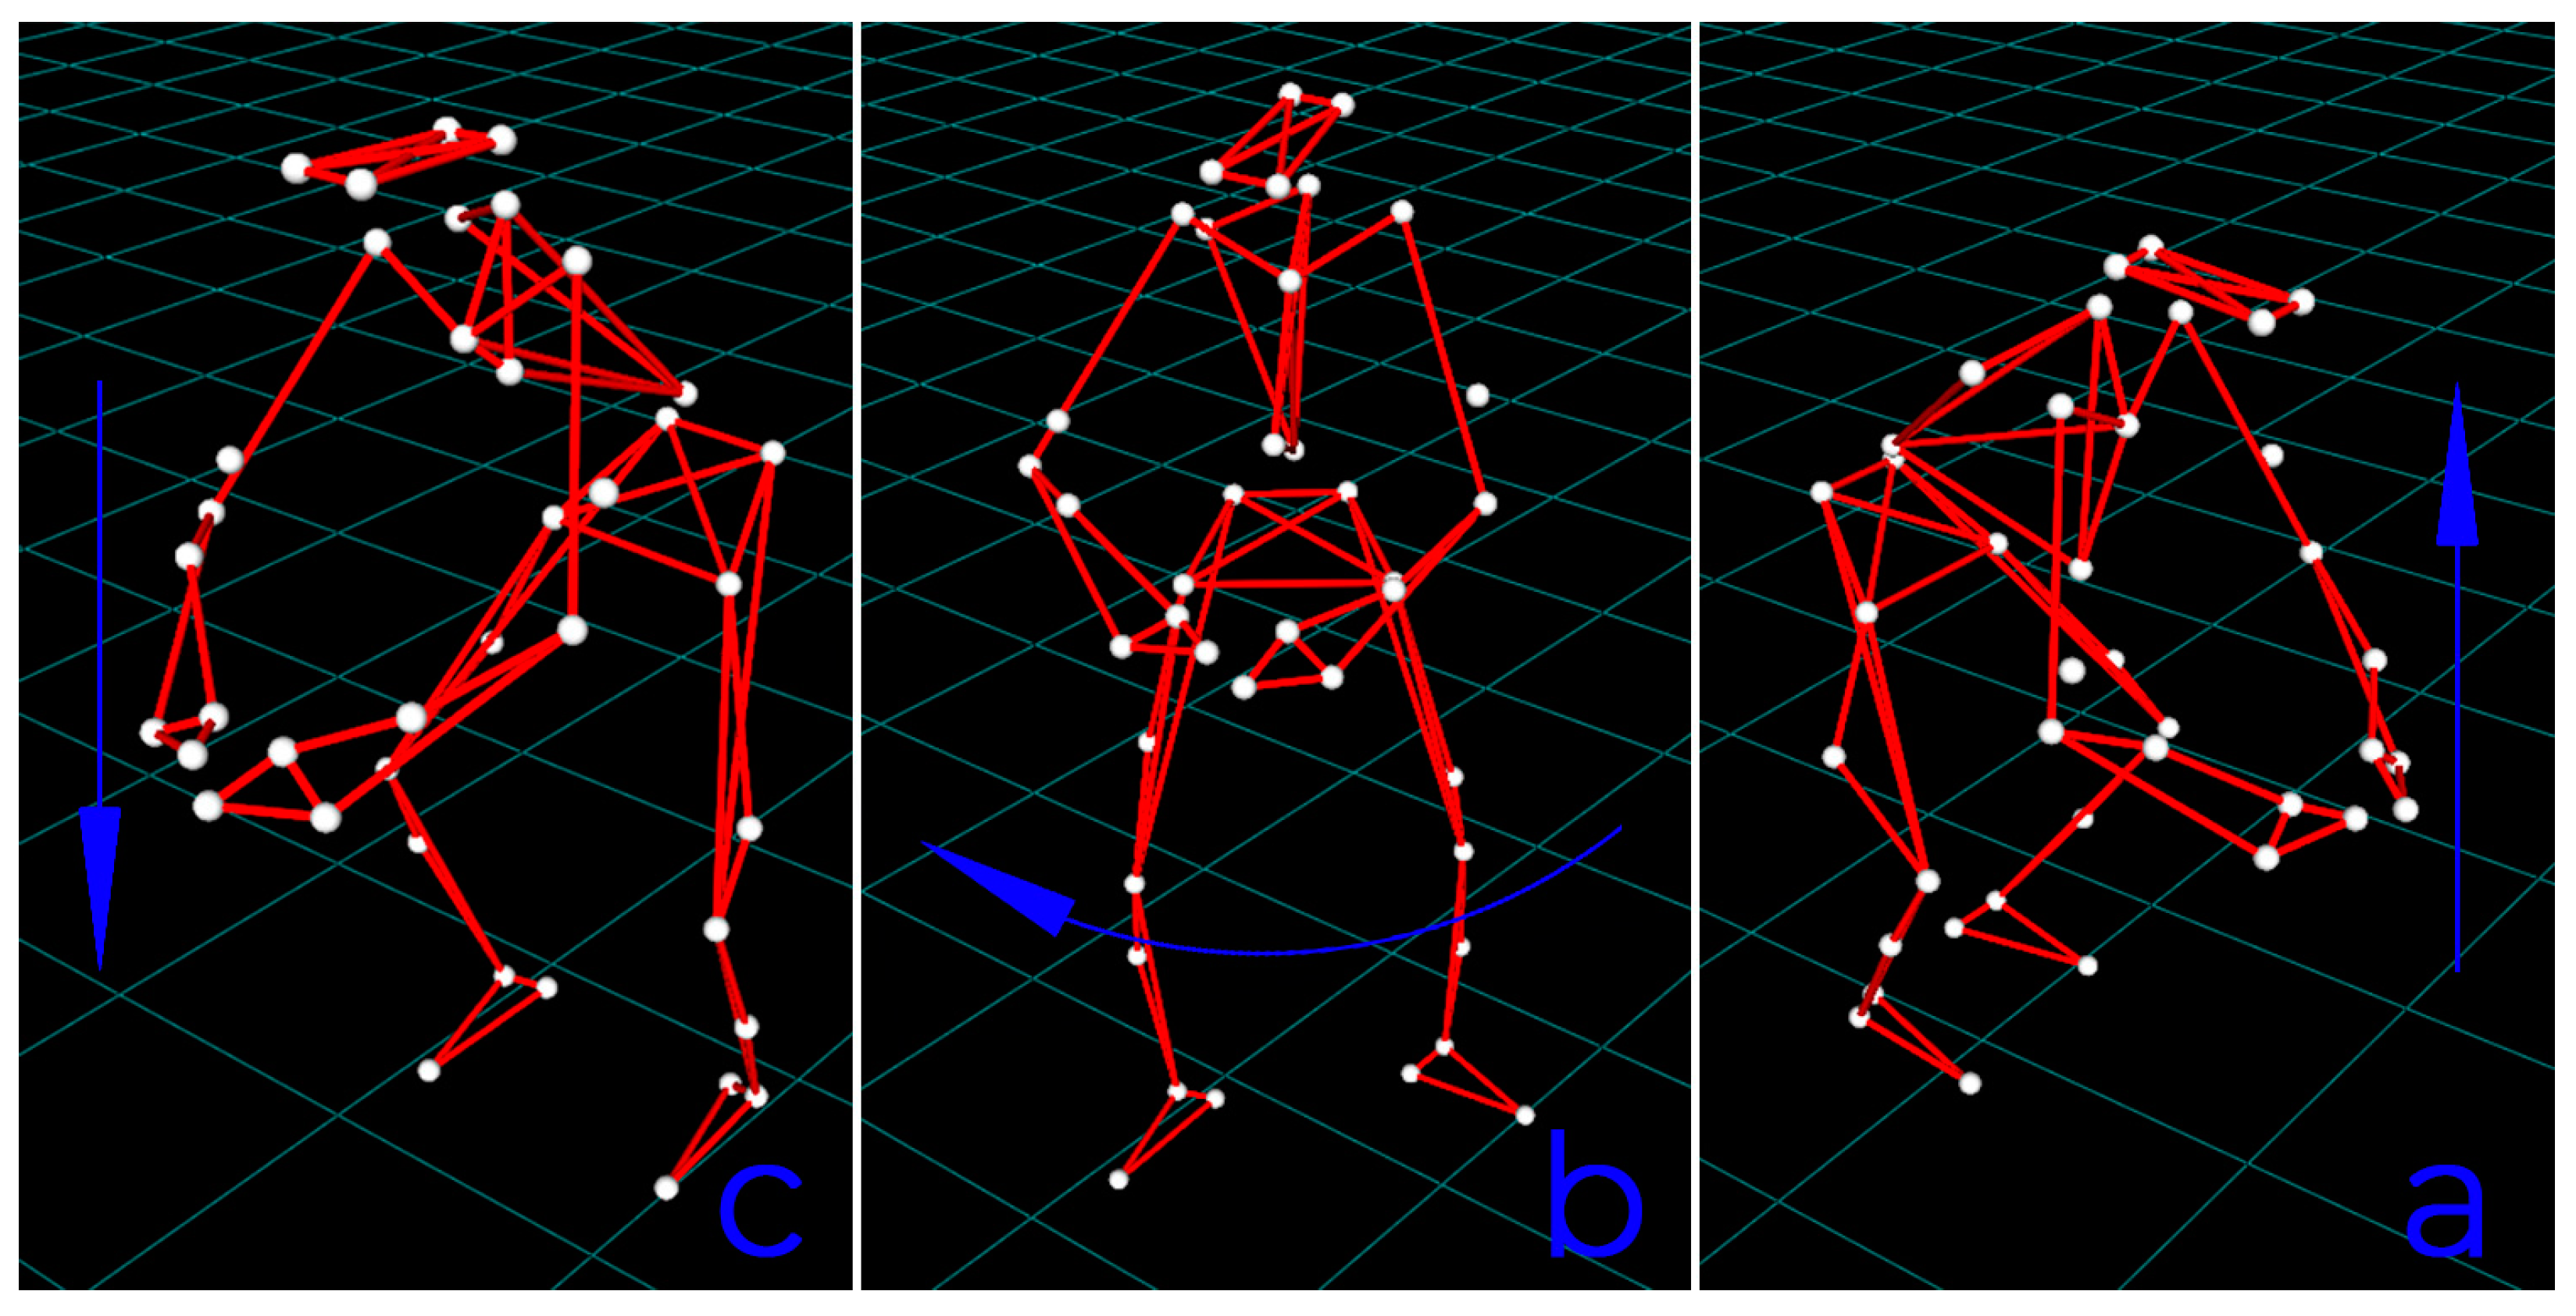
In order to study the movement characteristics of the upper body limbs, a transfer movement was chosen. It is based on the physiotherapists’ patient lift and transfer recommendations prepared by the state labor inspectorate [
29]. The movement sequence combines 3 basic motions—lifting patient up, pivoting, and putting him down. The main motion phases can be seen in
Figure 1.
Lifting and putting down a patient are almost identical motions. The main difference is when the patient is being held by the test subject. On the other hand, pivoting is a motion when the patient is being held and the body weight of test subject is being shifted from both legs to a single leg so that a 90° rotation can be made. Additionally, the test setup contained two surfaces: the origin surface of the patient and the destination surface of the patient. Both of these surfaces were at a 53 cm height oriented 90° apart from each other to imitate a wheelchair and a bed where patient would be placed.
2.2. Equipment and Measurement Procedure
It was decided to measure the movement of the whole body in order to see the general picture of the movement and to analyze only the upper limbs, i.e., movements of the shoulders and elbows, as they play the biggest role in the lift. In addition, the biomechanics of the hands in lifting is less studied than the upper part of the spine, the torso. The Plug-in-Gait (PiG) model was chosen [
30], which is made of 39 markers all over the test subjects’ body for a full body motion tracking. The layout of the used marker set is shown in
Figure 2. The model incorporates all main joints and limbs of a body allowing most of the kinematic calculations to be done. Some degrees of freedom are limited, for example ankles, hands, and fingers. Nevertheless, this model is widely used in biomechanics motion tracking field, so it brings a new modeling approach to a wider audience [
31].
To record motion for this study, a BTS infrared camera system was used. BTS Bioengineering does not have incorporated PiG marker protocols, but the ones that BTS Bioengineering has are limited regarding arm kinematics. Additionally, it would not be recognized by other tools. This makes the PiG marker set more universal between different software and research. That is why, the PiG marker protocols were created for the BTS camera system so it would be acceptable between more universal musculoskeletal tools, in this case—BoB. Data gathering was done with 6 BTS Smart DX-600 (BTS Bioengineering, Italy) cameras. The resolution was up to 2.2 Megapixels, and the recording was done in 240 frames per second frequency. The stated accuracy was 0.1 mm in 4 × 3 × 3 m volume. Initial data cleaning and processing were done with BTS Bioengineering 1.10 Smart Tracker and Smart Analyzer 1.10 software.
The study was performed in sequence, shown in
Figure 3. The test subject was equipped with the aforementioned PiG marker set. Equipment of the scene was set up and calibrated to define the axis and volume of the data gathered. Since this was a trial study to develop a later validated the tool, only 5 measurements were taken. Using the specified equipment, three-dimensional (3D) marker trajectories were measured, which allow, if necessary, to calculate speed and acceleration.
After measurements, Plug in Gait models were made and data evaluated visually to decide which 3 measurements should be used for further analysis.
2.3. Tools and Methods for Kinematics
When evaluating the data collected, the greatest attention was paid to the markers of the shoulders, chest, and spine, because they are the most important for making the necessary calculations or determining the reference axes. Using BTS Bioengineering Smart 1.10 software package (Smart Tracker and Smart Analyzer), data were grouped according to PiG model. Afterwards, it was filtered to reduce data noise spikes and errors. Interpolation and smoothing protocols were followed to make motion trajectories smooth and organic. Data interpolation was necessary to account for missing sensor data which were covered during exploratory movement. The final visual data confirmation was done before exporting them to output files. This visual confirmation is used to see if there are any markers that are moving inconsistently, or its trajectory is floating in unrealistic pattern. If this happens, data are returned to the data grouping and filtering so they could be cleaned. Most often, if a marker is floating away from a rigged model, it means that raw data are lacking and smaller fragments of raw data need to be left uncut, so that the interpolation process would have more reference.
After the data were cleaned and pre-processed, they were exported to the Mokka 0.6.2 software from which the model frames could be additionally cut. Afterwards, they were exported to a .c3d file needed for BoB and a .csv file which is read by Rhino Grasshopper. This file type was chosen, because it is easy to read, open, and navigate the filetype, marking each marker location at a different time frame. Data are given in columns. Each column represents the X, Y, and Z coordinate axis values at a given timeframe.
For the baseline range of motion calculation, native BoB 10.5 software (Biomechanics of bodies 10.5) was chosen. Data were processed and the physical range of motion angles were exported. Since Euler angles can be written in different sequences of XYZ rotation (being YXZ, ZYX, etc.), it was decided to stay with the physical evaluation of joint movements. Three different joints were evaluated: shoulder, elbow, and wrist. The Rhino Grasshopper model were made with 7SR22 software version. The kinematic skeletal model in Rhino Grasshopper was created using BoB data as a reference. When the ROMs calculation was gathered, it was exported to the csv file providing points of physical joint movement graphs. After having the final data of both models, they were grouped by normalizing time of measurements, so it would be conducted at the same time. Then, data were compared using statistical methods.
ROMs were evaluated to determine and verify the model. The aim was to evaluate shoulder, elbow, and wrist joints, as all of them are being loaded during the lifting movement sequence. This means, that if, during a stationary position (when joints are locked for the lift), the joints are in non-ergonomic position, the load will have a negative effect on them. The shoulder consists of three synovial joins and one physiologic articulation. These four articulations work in unison to produce and control various movements of the shoulder complex [
32]. While the biomechanical definition of ROM consists of complex bone and ligament movements, in the gathered data models, we have only sensor data to guide these motions.
2.4. Parametric Model
The developed skeletal model is an early version of a research study that will be used to estimate ergonomics of the lift motion from multiple calculations at once. The model is shown in
Figure 4.
First, input data files should be listed and assigned to the data processing script as shown in
Figure 5. C# code that can be used to read and sort a .csv file is shown in
Appendix A,
Figure A1. This script reads the data package stored in a .csv file and sorts it into a nested array. Every array element is a frame that stores the position values of x, y, z of every marker. This allows to easily access the needed data set if individual frames are analyzed or animation played. Later, the data are simplified and only every 25th data item continues to be calculated if a high data transfer rate was used to collect the data and a faster calculator response is required.
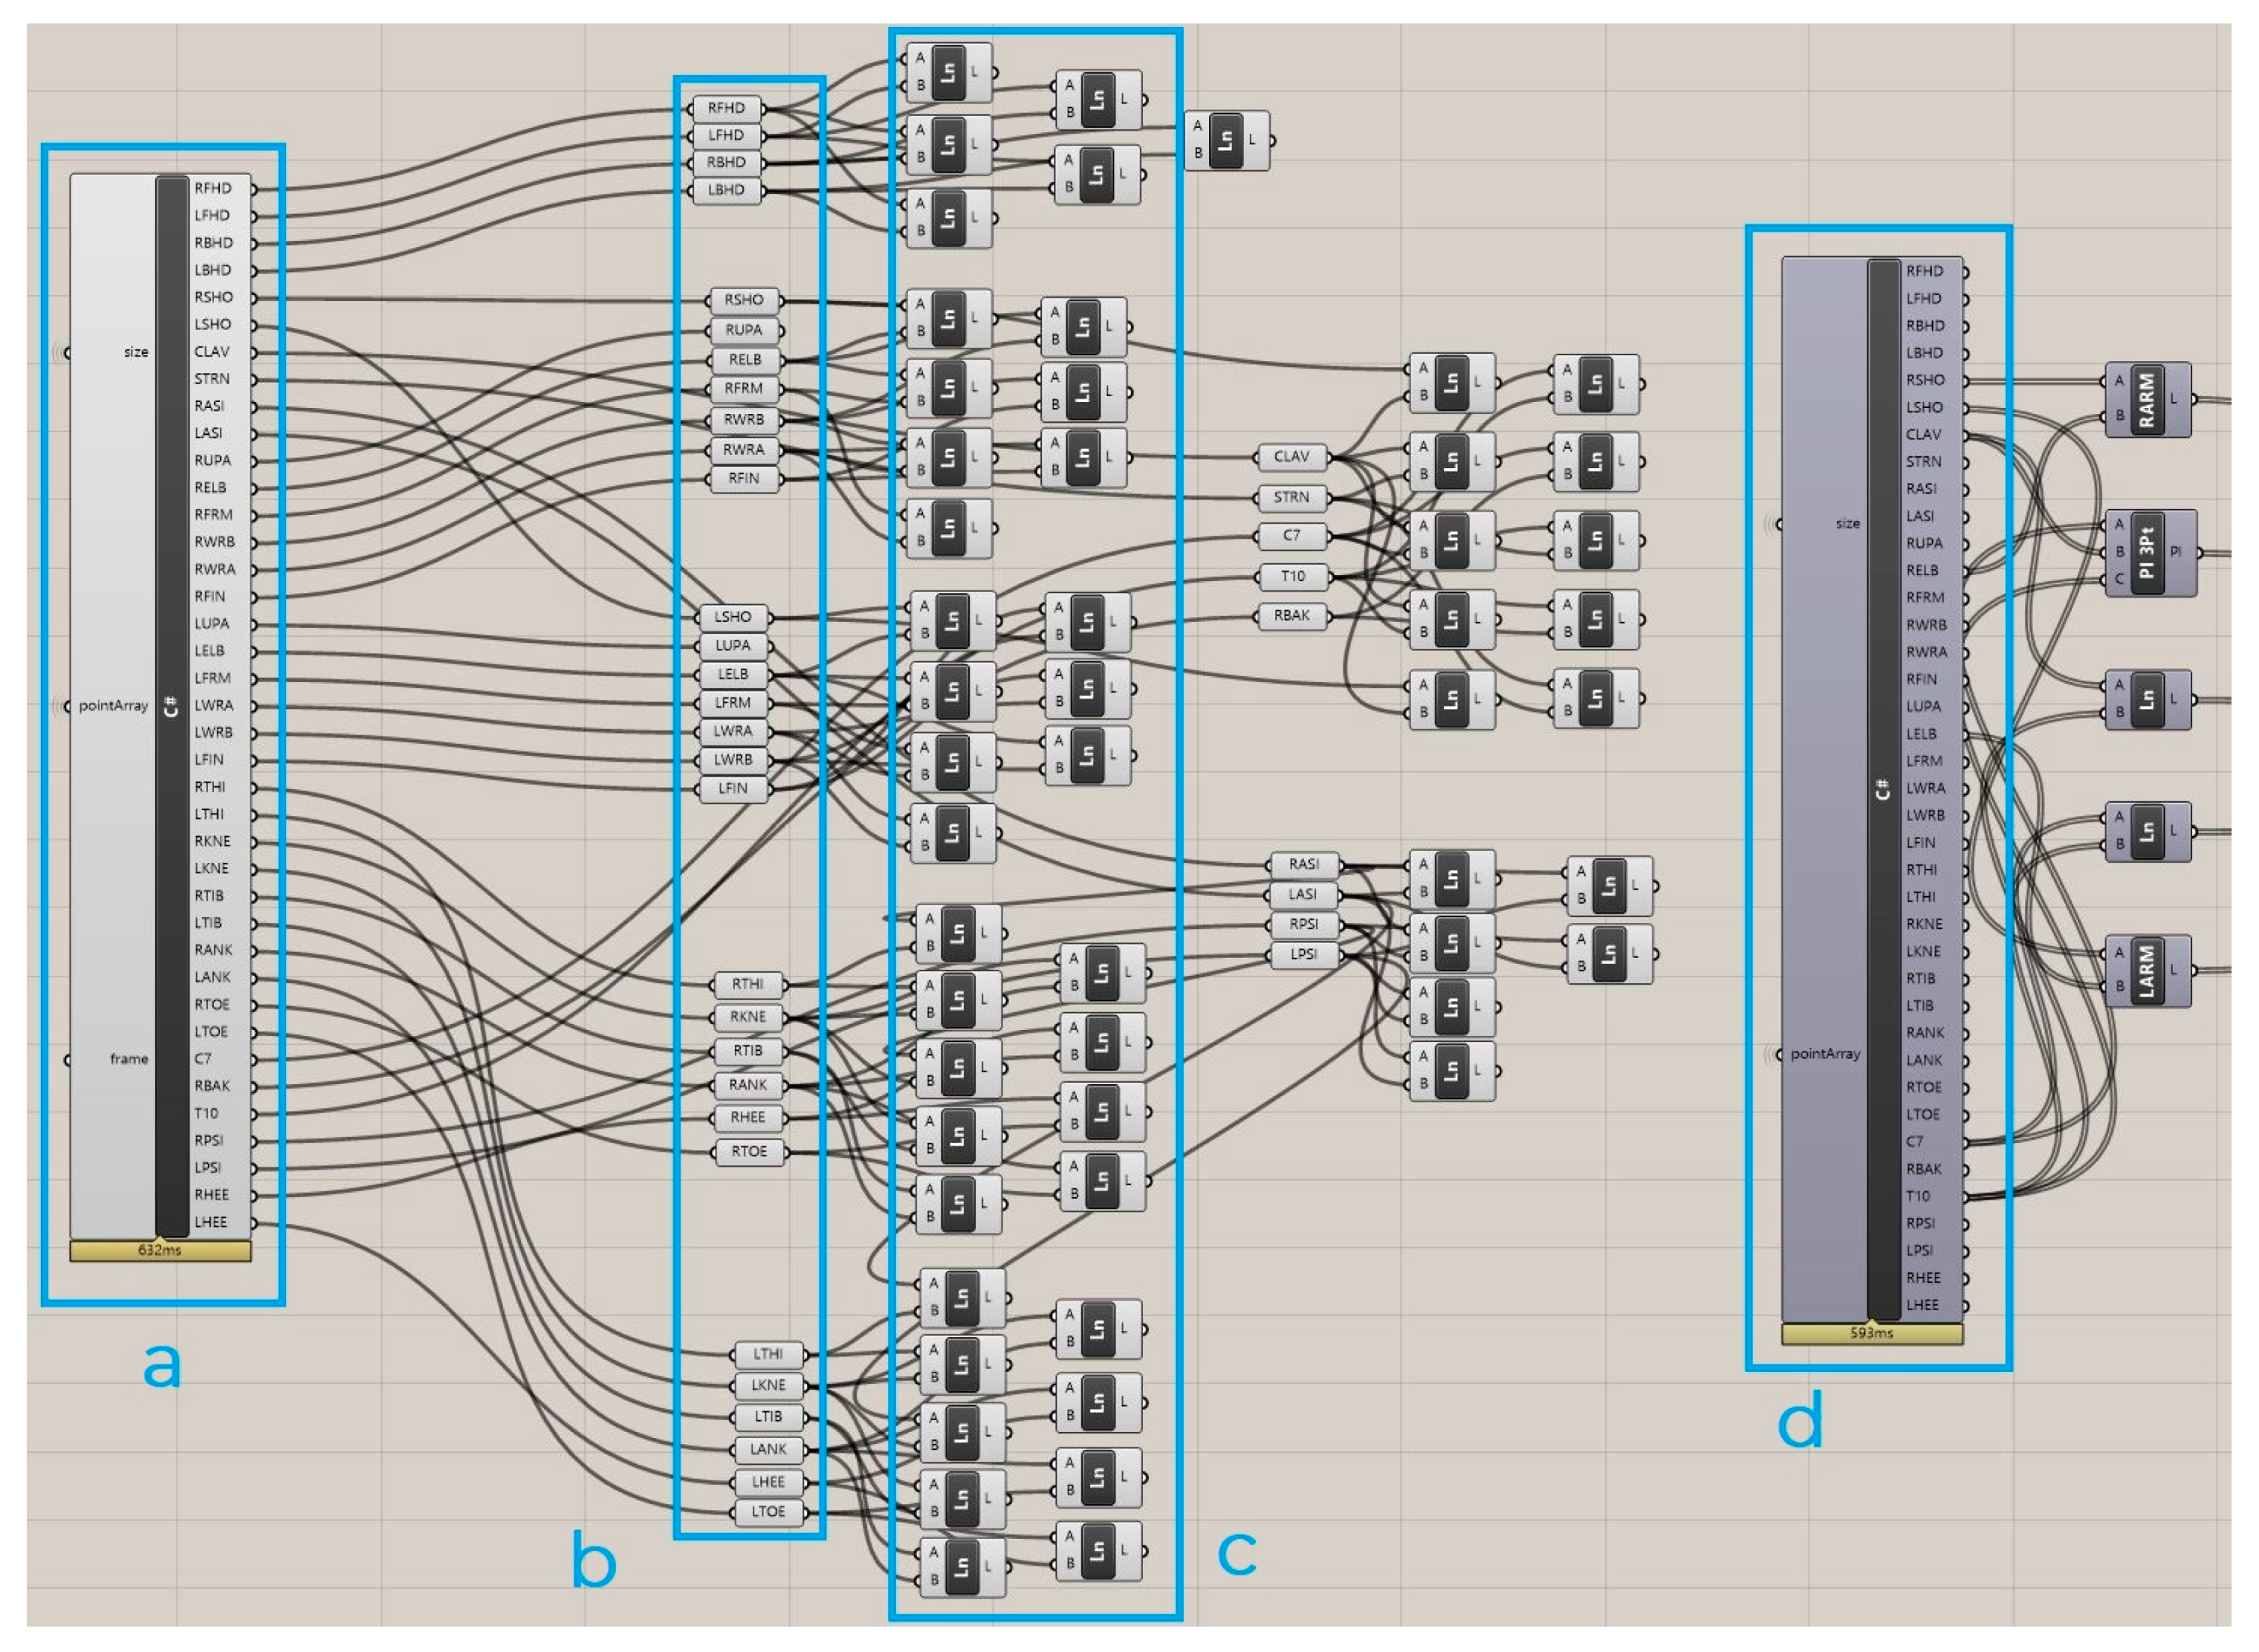
The data were processed further as shown in the
Figure 6. The script on the left (a) assigns each array element of a given frame to the external geometry node point. Afterward this is used to rig a skeletal model in a display window for debugging and visualization purposes. The script on the right (d) sorts and assigns data in arrays so that the calculations of all frames would be done at the same time, providing instant feedback of ROM.
Figure 7 and
Figure 8 represent the configuration of different ROM calculations that are being done, together with data conversion, the name of the motion type is being inserted as a first row inside the data tree.
Data export logic is based on grouping components and merging them into the data tree that can be exported to the Excel sheet in a clearly readable array. This element is shown in
Figure 9. In the exported data tree, where components are being merged, the first column represents time, afterwards, every other column represents a different motion type with the first line being the name of that column.
2.5. Confirmationof the Results
The model results were compared in numerous ways with the conclusion that the data between these two models correlate and the tested model has a sufficient accuracy. The validation process spans philosophical issues to practical procedures on how model reliability is quantified [
33].
For the current model quality estimation, different calculations were made using the following methods:
Standard deviation;
Squared deviation;
The Root-mean-square error (RMSE);
Pearson correlation coefficient r;
Coincidence of the graphs within the given error;
Since the goal of this validation is to determine the difference between the BoB and Rhino Grasshopper models, the standard and square deviations were calculated. Standard deviation allow to visualize how data collected are dispersed in a relation to the referenced data. Squared deviations allow one to neglect the impact of the negative and positive numerical values of evaluation and emphasize the significance of the data difference. It is expected to see a mean standard deviation of 5° for the high accuracy of the model and 10° for the significant accuracy of the model.
Root-mean-square-error was calculated as a direct deviation of the data expressed in degrees. To evaluate the relative accuracy, RMSE as a percentage of the amplitude was recalculated. Data which had <20% of RMSE% show that the model is accurate and data between 20% to 50% show that the model is relatively accurate, while any higher values indicate a lack of accuracy [
34].
The Pearson correlation coefficient is another tool used to compare data. The Pearson correlation is used for data sets that are quantitative, normally distributed, and have no significant outliers. Absolute values are interpreted as follows: if the Pearson coefficient value is 0, then there is no correlation, while if the value is 1, it is total correlation. A correlation value that is 0.7 or more is represented as a strong correlation [
35].
2.6. Representation of Results and Analysis Methods
Visual data comparison can be a helpful tool to determine data correlation qualitatively. Data set coincidence allows to detect less accurate sections. The data of the same measurement postprocessed with different models will be given in the same graph indicating the coincidence of such data sets. For the purpose of visualization, shoulder ROMs will be represented with a margin. ROM is identified as the difference between the maximum and minimum values of the performed motion. For data visualization, Origin 2018 software was used. The margin was determined based on research evaluating the measurement errors of ROMs. It is noted that a measurement with 5.8° to 6.1° error is good reproducibility. Overall, the given research indicates the ROM measurement error in range of 4.2° to 11°. Based on such results, the shoulder range of motion graph is visualized with a 5° margin and a mean deviation below 10° margin will be treated as an acceptable deviation [
36]. Only the most representative graph of the shoulders range of motion is provided. For other measurements, only the numerical values are provided. Each ROM plot is accompanied by a relative error graph showing the error in degrees and squared errors in degrees to remove the effects of negative values.
To identify the dispersion of errors in different measurements and ROMs, a table graph of errors is provided showing the mean value, median line, range with 1.5 interquartile range (IQR), and outliers of data if any are present. A bigger dispersion means more differences in the model and potentially less accurate data.
Results are provided in the measurement versus joint and ROMs’ type table. Three different measurements and five different ranges of motion were calculated in this research. The mean and RMSE were given in degrees while, additionally, the RMSE with the percentage of the total amplitude was calculated.
3. Results
RMSE% were evaluated to determine the initial model reliability. Evaluated values ranged from 9.71% to 32.44%. The data are shown in
Table 2. All values fall under a relatively accurate model range (<50%), while seven values could not be treated as fully accurate as their values were >20%. These values represent the first measurement of the left shoulder internal–external rotation and the left wrist abduction–adduction and the third measurement of the left shoulder abduction–adduction, the right shoulder internal–external rotation, both sides of the elbow extension, and the flexure and left wrist abduction and adduction. There is no consistent pattern in the data that suggest a relationship between observed decrease of accuracy.
Table 3 represents the mean deviation, root mean square error, and Pearson correlation coefficient results. The mean deviation ranges from −4.82° to 11.93°. This represents a 8.89% deviation of the maximum amplitude where the largest mean deviation is observed. RMSE in the numerical value ranges from 1.58 to 19.05 degrees. This can be tied up with the overall correlation of the graph. If the Pearson correlation coefficient is lower than 0.9, then the RMSE and mean deviation are noticeably larger. For example, there is a measurement of 1 for both the left and right shoulder internal–external rotation.
In terms of the correlation coefficient, all data sets seem to strongly correlate (r > 0.7), but the shoulder internal–external rotation are the worst out of all the shoulder data sets. Measurement 3 of the right-hand wrist was way out of bounds and was excluded as false data.
The sholuder ROMs graph is shown in
Figure 10. The flexure–extension motion allows to easily identify different motion sections as the ROM peaks are the lift and put down motions, respectively. The errors are greatest in those motion segments because that is where the motion activity peaks. The internal and external rotation are the most deviating ROMs, as there is a slight shift from the nominal value with which the results are being compared to. Visually, this seems to be a shift in the reference system as the results are concise and different phases of movement require the correction coefficient to be concise with the main reference graph.
The box plot of ROMs are shown in
Figure 11. The shoulder flexure–extension motion data sample varies in less than 5°. The same with the shoulder abduction–adduction, elbow flexure–extension, and wrist abduction–adduction. The biggest data variance can be observed in the shoulder internal–external rotation. For the shoulder internal–external rotation data, the error variance of the main sample is within 30°. This identifies a significant deviation from the reference model and requires improvement.
4. Discussion
Kinematic analysis of human motion can be a beneficial research tool, helping to understand and evaluate motion. Analyzing data can help to evaluate ergonomic motion and harmful movements [
37]. A ddynamic analysis can be more informative and offer better depth of research, but every dynamic simulation starts with kinematics as a baseline. That is why this model is first of all oriented to kinematics, which in some cases might be enough to acquire insights into tendencies and raise hypotheses that would later be supplemented by dynamic analysis. Even so, this requires measurement equipment, software with models that are able to interpret measured data and used marker sets, and knowledge and skills to manipulate the given model. Especially if a custom approach is needed. Thus, broader availability of different software and models increases the chances of researchers finding the right technical and financial solution for their needs.
The results of the compared model showed the accuracy of the custom model designed with Rhino Grasshopper analyzed with a different metric tool. The difference between the reference model and newly created model was evaluated in order to estimate if the accuracy is good enough. The kinematic data between these two models definitely correlates; however, it shows different deviations at different ranges of motion. It was decided to judge the deviation range based on the possible measurement error of range of motion. If medical application measurements are fine with the given error, then the computation of the kinematic model with the same margin of error would have a closely related reliability [
36].
The shoulder range of motion was relatively easy to calculate and evaluate as it has a broad motion throughout the analyzed movement. However, the wrist range of motion was hard to evaluate as it was static almost throughout the whole movement and the range of motion was expressed in small amplitudes. Consequently, the wrist model lacked reference points to identify and evaluate wrist motions. This suggests that different motions should be taken into account when modeling and verifying the range of motions of the wrist. The same approach should be taken with the whole model, generating broad motions in generic range of motion planes and axes and this way calibrating the model.
Another reason for the hard assessment of the wrist’s range of motion and the general accuracy of the model is the marker set used. For wrists and elbows, more markers would be significantly helpful, as it would create a broader reference system and would allow more distinct interpretation between different motions. This way, the analysis could be more closely related to the anatomic replication of the given hand motion.
Based on the estimated data, shoulder internal–external rotations require a revision of model to improve the accuracy and representation of this ROM. The mean deviation ranged from 7.76 to 11.93°. This is higher than our estimated 10° boundary [
37]. The shoulder internal–external rotation data correlation average was 0.86, compared to other measurements which have a higher than 0.95 correlation coefficient.
The model accuracy was evaluated with the RMSE, Pearson correlation coefficient, and mean deviation as the main confirmation tools. These values helped to identify that all model values correlated, but some of them were less accurate, having more than 20% of RMSE expressed in percentage of the amplitude. Most of the correlation coefficients were >0.9. This shows a very strong correlation and sufficient data for validation, as there are cases where the correlation between the predicted and observed data that is higher than 0.75 and is confirmed as viable [
38].
The coincidence of the graphs was provided as a visual representation of the results, allowing to investigate where graphs are not aligned and mismatched. In this particular kinematic analysis case, coincidence of graphs allows to investigate different sections of motions and analyze where mismatch is happening. In
Figure 7, the shoulder’s internal–external rotation seems to have a crossing of reference graph. In the first ¼ of the motion, it has a positive deviation, in the middle of the motion, between the lift and put down, where the pivoting of body is happening, it has a negative deviation, and in the last ¼ of the motion once again data crosses the referenced graph and have a positive deviation.
It is planned to continue in this direction with the model and its improvement, as it is believed that it is important to broaden the scope of the available tools for research. Having this in mind, the flexibility of the models and their ability to calculate large datasets in a short time are important features that can be investigated and analyzed further on.
During this research, a few key limitations were observed. The amount of data gathered and analyzed does not allow to fully verify the model but rather confirms that its development is worth continuing. Furthermore, only kinematics were being evaluated at the given time, so the features and results are limited. Some motions during the lift sequence were relatively static and this limited the availability to correlate and build a model, so a broader spectrum of movements should be taken into account.
It is well known that general medical conclusions can not be made based on a single person analysis. This poses a serious limitation for verifying the model and its functionality. Measurements conducted in this research scope provide a small sample, as it is still in the early stages of the model development and more extensive testing and data comparison are recommended to be conducted further on this matter. Thus, this can only be stated as a model confirmation and further verifications with a bigger sample rate and population are needed.
Our future work is aimed at improving the currently developed tool with more data gathered and tested; in this way, the correlating model will be more accurate and the sections of the model where the accuracy was lower than expected will be improved. If the model algorithm is not implemented correctly, or is not verified, all resulting simulations or calculations will be incorrect. Any conclusions drawn from these data will be contaminated. This is one of the most substantial errors that are most problematic [
24]. We understand that calculating only kinematics limits the depth of the research. This presents the opportunity to improve the developed tool beyond its current limitations by introducing a dynamic simulation or an integration with available solutions.


