Article

Evaluating Some Functional Properties of Surfaces with Partially Regular Microreliefs Formed by Ball-Burnishing

1
Department of Motor Vehicles, Ternopil Ivan Puluj National Technical University, 46001 Ternopil, Ukraine
2
Department of Manufacturing Technologies and Machine Tools, Technical University of Varna, 9010 Varna, Bulgaria
3
Department of Mechanics and Machine Elements, Technical University of Varna, 9010 Varna, Bulgaria
*
Author to whom correspondence should be addressed.
Machines 2023, 11(6), 633; https://doi.org/10.3390/machines11060633
Submission received: 17 May 2023 / Revised: 29 May 2023 / Accepted: 2 June 2023 / Published: 7 June 2023
(This article belongs to the Special Issue Performance Analysis of Sliding Bearings)

Abstract

:
In the present work, functional properties of three different types of regular microreliefs, formed by ball burnishing process on flat surfaces are evaluated. For their estimation, heights and material ratio curve’s criteria were used, according to the international standard ISO 21920-2:2021. The influence of the regular relief’s type and ball burnishing process parameters on the surface functional properties were investigated using full factors experimental design. Based on the obtained results, statistical models were derived that describe the dependencies between the topography characteristics and the regular reliefs’ types and regime parameters of the ball burnishing process. Based on the obtained results, several conclusions have been formulated about the applicability of these standardized methods and criteria for evaluating the functional characteristics of the different types of regular reliefs at the end of the work.

1. Introduction

Constantly increasing requirements are placed on the life extension of machine parts and units, indicating the need for advanced load-bearing structures with surfaces that have superior functional characteristics. Enhancing the wear resistance and durability of friction pairs working under heavy loads and harsh conditions is one of the major challenges facing mechanical engineering today. According to the traditional understanding and improving of the contact behavior of the surfaces subjected on friction, this is mostly related to reducing the surface roughness [1,2,3,4]. However, high specific pressures and high service temperatures inevitably lead to adhesion that appears between interacting surfaces, causing the formation of surface defects even under short-term overloads [5,6]. Therefore, a traditional approach appears to be impractical when used to improve the working surfaces of load-bearing friction pairs.
There is alternative mechanical processing that enhances the wear resistance of friction surfaces, which has been related to forming the so-called “regular micro-reliefs” (RMRs) on the contact surfaces of the machine parts. Specific patterns made of shallow traces, which are formed by plastic deformation in the surface layer can provide a number of significant advantages [7,8]. State-of-the-art processing equipment allows such RMRs to be formed using high-precision CNC milling machines. However, such equipment is costly, and it takes more time to create RMRs than the forced vibration-based technologies used for the same purpose. The latter usually employ an oscillating reciprocating movement of a hard ball with a certain amplitude and frequency. The vibration-based technologies prove to be more efficient when it comes to forming the microrelief of a simple shape, especially on flat surfaces, since they meet the requirements of mass production placed on surfaces to which there are not too many high requirements.
The dependence between the functional properties and the surface topography parameters is described by the material ratio curve (MRC), also known as the “Abbott-Firestone curve”. In Hamdi et al. [9], the functional properties were evaluated using MRC parameters, rather than the surface roughness parameters. The authors claimed that the three parameters determined from the Abbott–Firestone curve, that is, Rpk, Rk, and Rvk, illustrate the ability of the surface texture to resist frictional wear.
Certain features deemed to be inherent in the evaluation of the surface condition using the MR curve were described by Kubatova et al. [10]. The authors have found that the surface integrity demonstrates the relationship between the required functional properties of the surface and the variations in the new surface properties. The surface can be evaluated using two basic properties, namely, the spatial distribution of the material (i.e., surface topography pattern), and the physical and chemical properties of the surface layer. Moreover, the authors in Cao et al. [11] stated that ball-burnishing technology could enhance the corrosion resistance and improve the surface integrity of the processed materials. The test specimen used in that study was a flat metal surface made of an AZ31 Mg Alloy.
Significant improvements of the functional properties can be achieved using vibration-assisted ball burnishing, which results in patterns of RMR traces being formed on the surface treated. This method was proposed in Shneider [12], where the author described how RMRs formed on friction surfaces could improve their functional properties as a result. In addition, the classification of the RMR types were explained in that study, and the design of tools for its application were also presented. According to Shneider [12], the RMRs, which have a pattern of traces that touch each other, belong to the II nd type of RMRs. With regard to partial RMRs, such traces can be divided into three subtypes: traces whose radial axis coincides, traces whose axis is shifted by 0.5 of the angular step, and traces whose axis is shifted with a value between 0 and 0.5.
To create RMRs using forced vibration-free technology, CNC milling machines can be used. In Slavov et al. [13], technology basics are described in detail, and its application for different surfaces was demonstrated. Moreover, the methodology that allows for determining the influence of ball-burnishing regime parameters on the geometric parameters of the RMR elements formed on different surfaces types, such as flat, cylindrical, and shaped has been presented. To this end, the HAAS VF-3 CNC milling center equipped with the HAAS TR-110 dual axis rotary table was used, along with a specially designed ball-deforming tool.
The main regularities in the impact caused by a newly formed relief on the friction and wear mechanisms have been actively investigated using deterministic and stochastic approaches, as well as direct physical experiments [14,15,16]. Attention has also been paid to improving the technology of forming RMRs on friction surfaces. In addition, other methods that may be useful to form RMRs that are known to date, include hot rolling, stamping of various types, and laser-based texturing. These methods make it possible to attain the specified texture geometry, but have certain disadvantages, in particular, the difficulty in reproducing the relief of a complex shape, for which the complex equipment is required.
RMRs formed on the operational surface of friction pair parts could extend its life by easily providing the required conditions to reach liquid friction sliding, a greater lubrication capacity of the friction surfaces, and a shorter duration of the run-in period; lower friction coefficients in the friction pair, and consequently, a higher wear resistance have been detailed in Swirad et al. [17].
In Aftanaziv et al. [18], RMRs were formed on the outer cylindrical surfaces of specimens made of the medium-carbon steel 1C45 and the low-carbon alloy steel 18CrMn4-4 to investigate the effect of finishing on the surface quality parameters. The major finding from that research was a significant influence of the RMR on the surface height criterion, Ra. According to ISO 1302:2002 [19], the relative area Fн of a RMR is the Fкaн versus F ratio expressed as a percentage, where Fкaн is the area occupied by the RMR, and F is the surface area of the part being processed. In Shneider [12], the relative surface area Fн is the parameter of partially regular microreliefs that most fully characterizes almost all the functional properties of the surface and the actual contact area of a given surface.
Therefore, the relative surface area of the RMR Fн is the major indicator, which characterizes the operational characteristics of the surface on which it is formed. Its optimal value varies between 30–45% depending on the conditions under which the pairing surfaces operate, according to ISO 1302:2002 [19], and Shneider [12].
Similar problems were addressed with regard to RMRs formed on the face surfaces of rotary bodies. In particular, the I st type of RMR that is characterized by traces with coaxial axes was considered in Nagit et al. [20], and the II th type of RMR that is characterized by traces with axes shifted by 0.5 of the angular step were investigated in Dzyura et al. [21,22].
To obtain RMRs of various types, specifically designed tools and/or tooling equipment must be used, as explained in [13,23]. As evidenced by experimental research, such tooling equipment and tools make it possible to form RMRs of any type on surfaces, even with free shape. CNC processing equipment provides a high geometric accuracy of the traces formed, and accordingly, can produce RMR patterns with a high accuracy in their geometrical properties.
Banh et al. [24] investigated the force which is applied when pressing the ball during burnishing, and its effect on the treated surface and the variation of its roughness. They proposed a numerical model that describes the surface burnishing process using a ball, which consists of two stages: the elastic-plastic pressing of the ball into the workpiece surface, and the sliding movement of the ball tool along the treated surface. The proposed technique was verified through conducting the relevant experiments. The roughness measurement results and those obtained using the mathematical model were found to be very similar.
The prospects for obtaining a structured surface by means of burnishing were addressed in [25]. The main advantages of this technique were highlighted, along with the difficulties encountered when designing this technique. The resulting surface roughness was found to depend significantly on the interaction between the ball and the initial surface condition. The high frequency of vibrations imposed on the tool during processing places more stringent requirements on the rigidity of the tool’s structure, and the accuracy of its workmanship.
The findings summarized in Pawlus et al. [26] are similar to the investigation results described herein. The authors proposed evaluating the surface topography using the functional value rather than the level parameters, which are normally used to evaluate the surface quality obtained during treatment. Notably, apart from the level parameters, many other parameters and functions were found to exist, which can provide valuable additional information regarding the functional behavior of surfaces in various environments. In this regard, the three-dimensional surface analysis is preferable, which allows for a wider analysis of the treated surface and its properties.
However, finding the optimal configuration of the RMR pattern, which would provide for the best functional properties of the contact surface during the entire operational life based on pre-set requirements, such as the wear intensity, the surface ability to retain lubricants, etc., is an issue that needs further consideration. In addition, a large part of the reviewed research and development used the older versions of the international standards [19,27,28] that are not quite relevant for current times, given the development of science and technology in determining the properties of the surfaces of parts. For this reason, there is a need to update the information such that the old concepts and criteria used in previous studies are updated with those introduced by the new international standards and norms. Therefore, the main purposes of the current research are to assess the applicability of the surface texture parameters included in the contemporary international standard ISO 21920-2:2021 [29] from one side, and to investigate how they can be used as an estimation of the functional properties of the three types of partially regular microreliefs formed by the vibration-free ball-burnishing approach. The functional properties of these three types of RMRs were assessed using the topography’s height, the bearing capacity, and the lubricants retention ability, based on the correspondent criteria defined from the Abbott–Firestone’s MR curve.

2. Methods and Materials

2.1. Lubricants Retention Ability Assessment

The current research is based on the methodologies for the determination of some of the surface texture parameters and criteria introduced by the international standard ISO 21920-2. This was performed to obtain comparable results with the other surface textures obtained by the different finishing methods. In order to assess the lubricants retention ability of the RMRs, the subject of interest was the quantitative determination of the area, according to the Rak2 area from ISO 21920-2 (see Figure 1). shown in Figure 1 the Rak2 area is equal to the area of the rectangular triangle obtained from the dales depth. The vertical side of the triangle was denoted as Rvk (see Figure 1b) and the horizontal side was calculated as (100%—Rmrk2), respectively. Here Rvk denotes reduced pit depth parameter that is the depth of the protruding pits below the core profile (see Rk parameter in Figure 1b) of the surface topography, and Rmrk2 denotes the material ratio of the dales parameter that is the material ratio at the intersection height, which separates the protruding dales from the core profile.
To determine the height of the Rvk criterion, a straight line must be fitted using the linear section F of the material ratio curve (MRC) that intersects the 100% on the rightward axis (see Figure 1b). From that point, a horizontal line is plotted parallel to the x-axis (i.e., denoted as “wear, %” in Figure 1b). Its intersection with the Abbott–Firestone curve defines the material ratio Rmrk2 in the dales of the topography.
Using these parameters, the triangle’s area Rak2 can be calculated approximately as:
R a k 2 = R v k · 100 % R m r k 2 200
The criterion Rak2 (i.e., the area of dales parameter) can be used as an estimation of the lubricants retention ability of the obtained surface topography. The standard ISO 21920-2 indicates that the parameters Rk, Rvk, and Rmrk2, the meaning of which have been explained graphically in Figure 1b, are relevant if the MRC is S-shaped, and thus has one single point of inflection. In addition, there is a remark included in that the S-shaped curve is the most characteristic material ratio curve in the case of lapped, ground, or honed surfaces.

2.2. Methodology for the Build the Material Ratio Curve on the Measured Profilograms Basis, and the Operational Parameters Determination

MRCs can be built easily if using the measured profilogram data for the R-profile of RMR topography, which can be stored as an inspection-protocol file in an MS Excel format, using a simple algorithm as follows:
R m c c = F o r   R t m i n c R t m a x F o r   0 i l e p o i n t s       R m l c = R m l c + ,     R t i R t c 0 ,     R t i < R t c   E n d   F o r         E n d   F o r R m c c = R m l c l e · 100 ,   % ,  
where:
R m c c —a vector, which contains the calculated material ratios within the RMR total height, in percent;
c ,   i —denotes the indexes of the total height levels, and number of the measured values in the evaluation length distance;
R t  μm—the total height of the R-profile according to the ISO 21920-2 standard;
l e  mm—the evaluation length of the R-profile;
Rml, mm—the material length of the R-profile at the given c—level;
Δ, μm—the discrete’ length along to x-axis of the measured profilogram.
After the MRC values were calculated, they were then visualized graphically as the next step, in order of the linear section F (see Figure 1b) of the MR curve to be identified. The x and y coordinates of the Rmc (see Equation (2)) vector elements, which correspond best to the linear MRC-segment, were used to calculate the coefficients of the intercept and the slope of a best-fitted straight line using the least-squares approach. As a result, the corresponding MRC-diagrams were obtained having the form as shown in Figure 1b. They were used for the topography parameters determination, and further to evaluate functional parameters of RMR topographies.

2.3. Materials, Experimental Design, and Equipment for Preparing the Test Specimens

Based on the principle similarity between the honed and partially burnished surfaces, the same criteria was used for the assessment of the surface topographies, which have RMRs from the I st, II nd, and III rd type. They were formed onto the flat surfaces of test specimens that were made of stainless steel 304 L by the ball-burnishing process [13], using a special burnishing tool [23] which was designed to work with CNC-milling machines. Three different types of toolpaths were programmed to obtain the corresponding RMR’s types. The resulting surface topographies after ball burnishing are shown in Figure 2.
A full set of combinations between the investigated three types of RMRs and three different feedrates of the deforming tool were researched, according to the full factorial orthogonal experimental design [30]. These two factors are varied on three levels, as shown in Table 1. The deformation force used was constant for all burnished specimens and was F = 400 N. The feedrates were fin.i = 500, 1000, and 1500 mm/min for all of the 3 types of RMRs, respectively. Three identical samples were burnished for each combination of RMR type and feedrate.
The specimens with RMRs were created using ball-burnishing operations conducted on a HAAS (Philadelphia, PA, USA) TM-1 CNC milling machine through a specially designed ball-burnishing tool that does not use forced vibrations [16,17]. After the RMRs were created, the specimens, which have dimensions of 30 × 40 × 4 mm were cut-off from the raw material sheet using a fiber laser cutter machine GN NCF 3015.
The surface topography was measured using a surface roughness tester—Mitutoyo, America Corporation, USA, and model SurfTest SJ-301 (see Figure 3a), following the same measure directions for all specimens according to the diagram shown in Figure 3b–d. To calculate the MRC parameters, R-profiles from the measured profilograms were used under the following settings: the evaluation length  l e = 8   mm ; and the discrete’ length along to x-axis s Δ = 5 μm, which is the hardware preset by the manufacturer of the device.
Three raw specimens were also cut-off from the material sheet, which did not have RMRs formed. Their topography were also measured (see rows 28–30 in Table 1), and were used for comparisons between the raw material surface topography characteristics, and those obtained after the application of the ball-burnishing operations (see Figure 4).
For every experimental design combination from Table 1, three profilograms were measured using the ball-burnished specimens that corresponded to the experimental design (see Figure 3b–d).

3. Experimentally Obtained Results

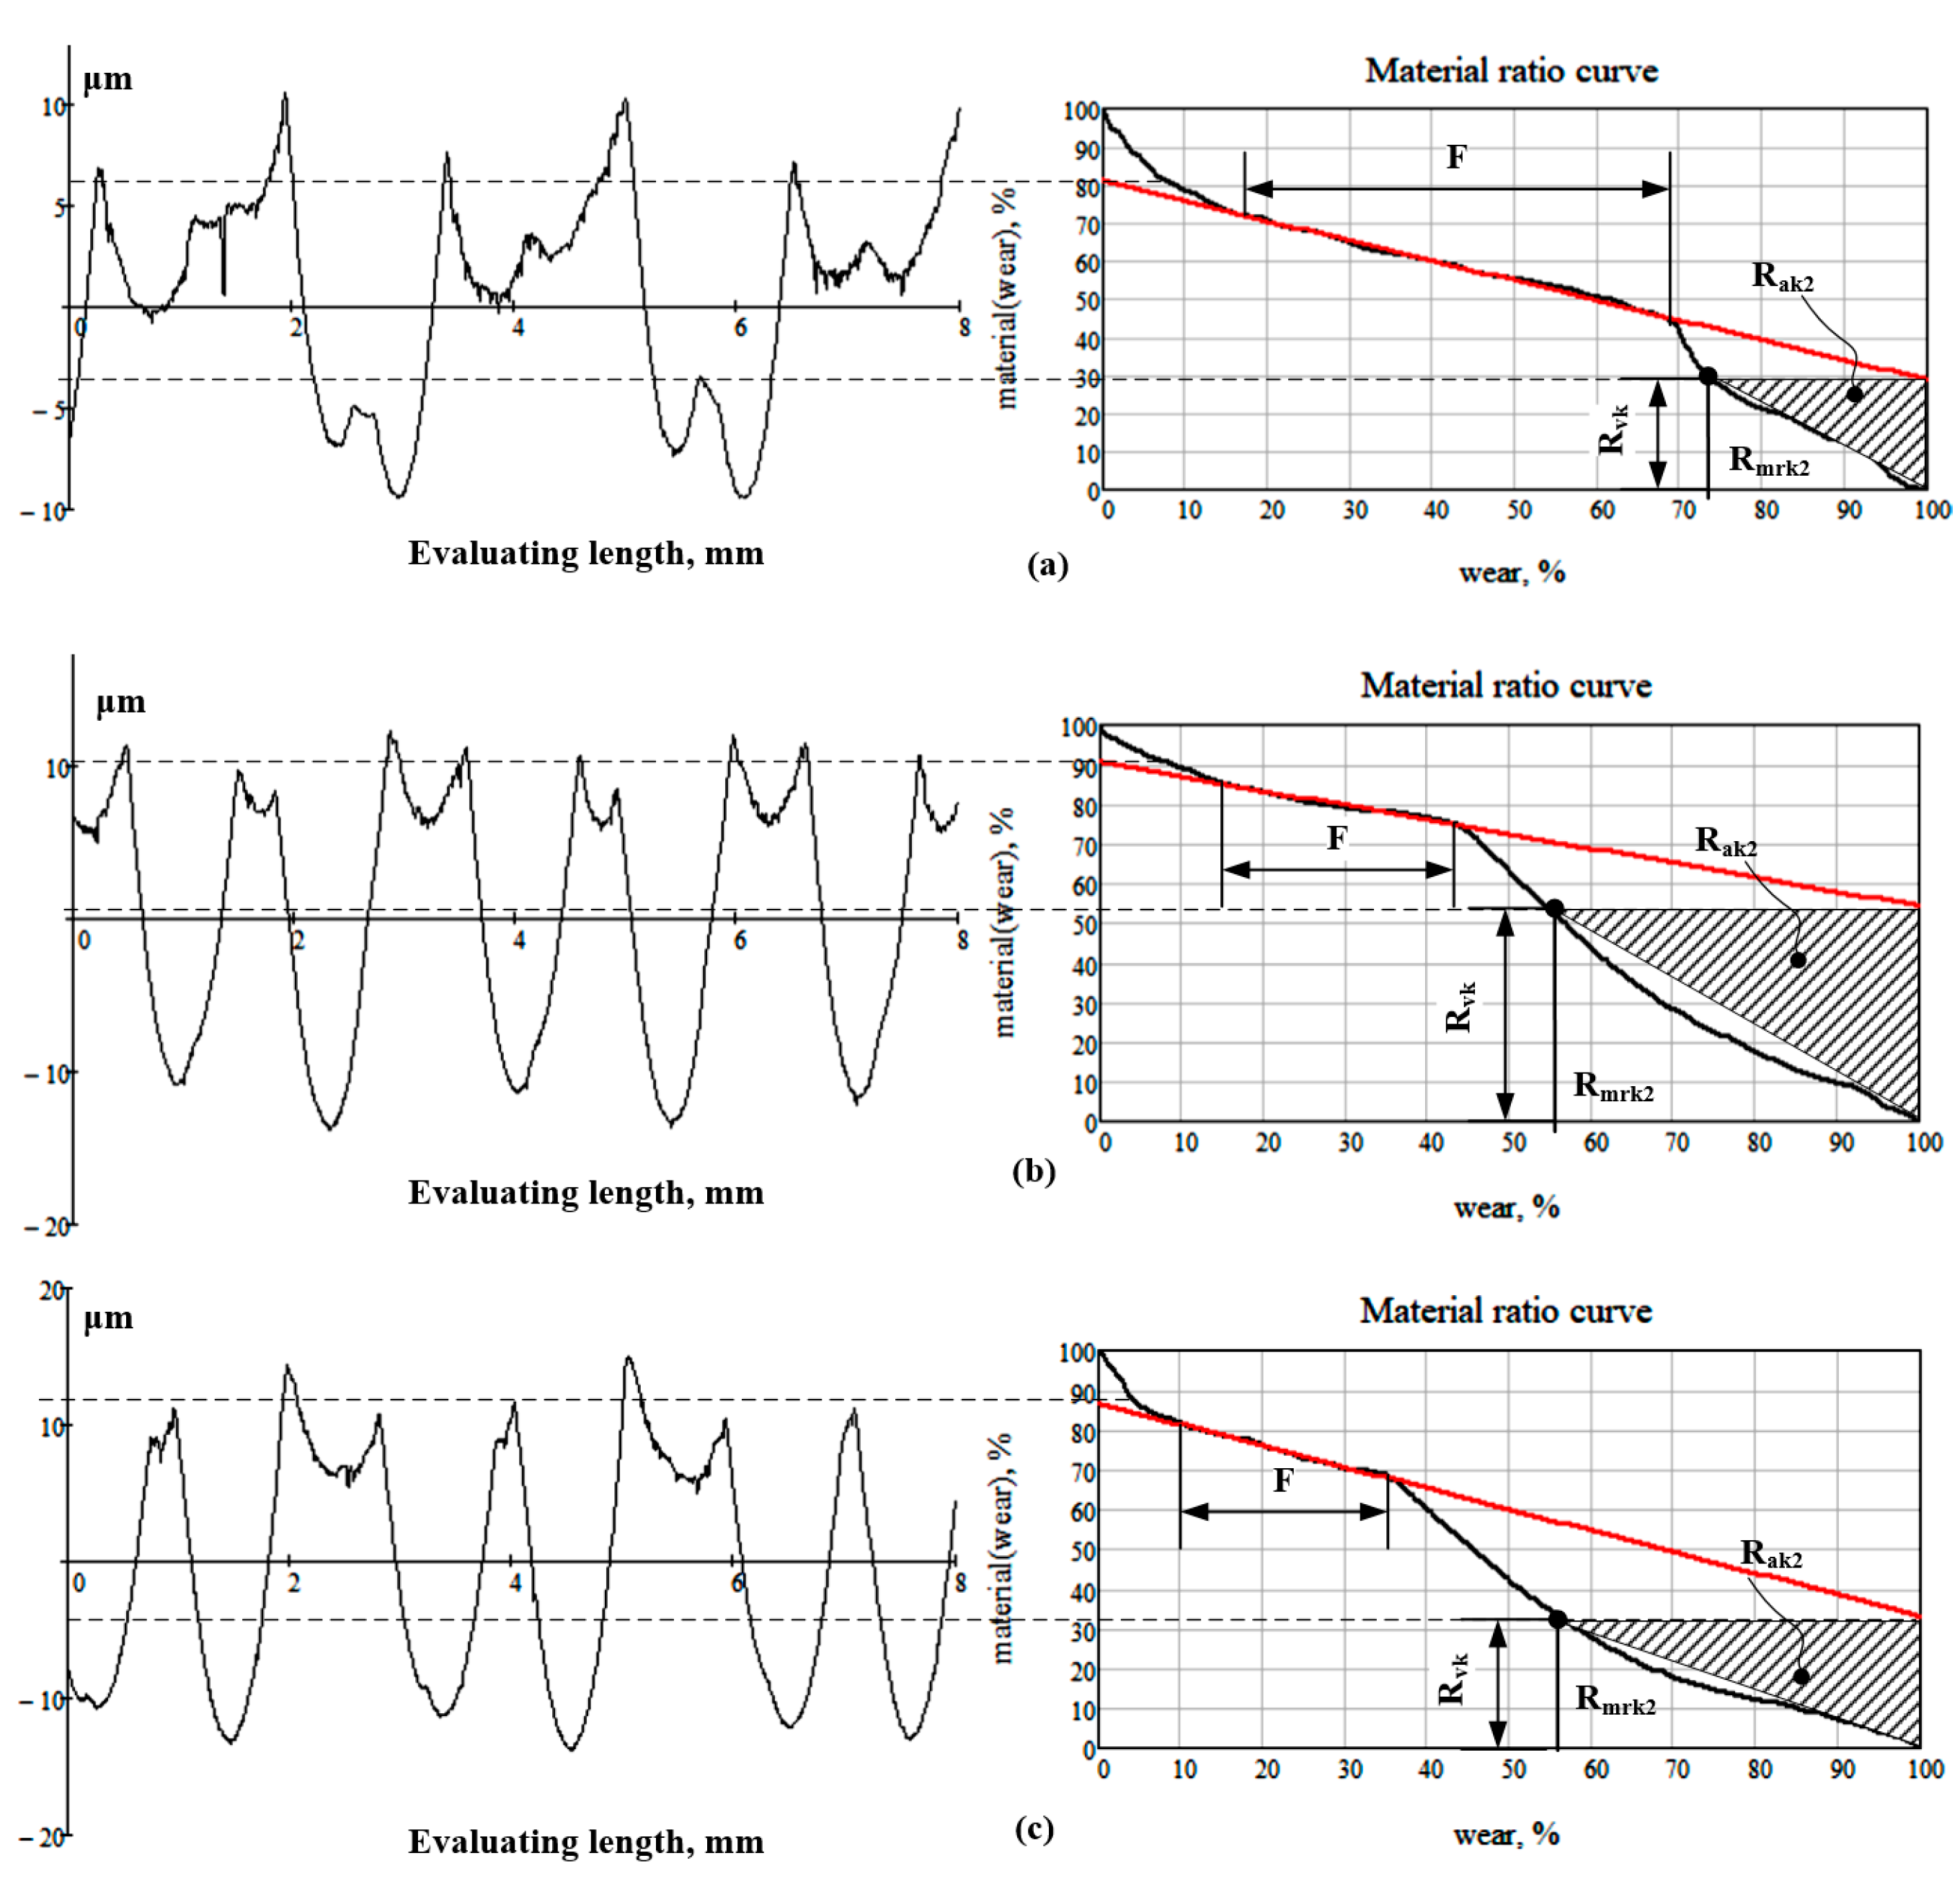
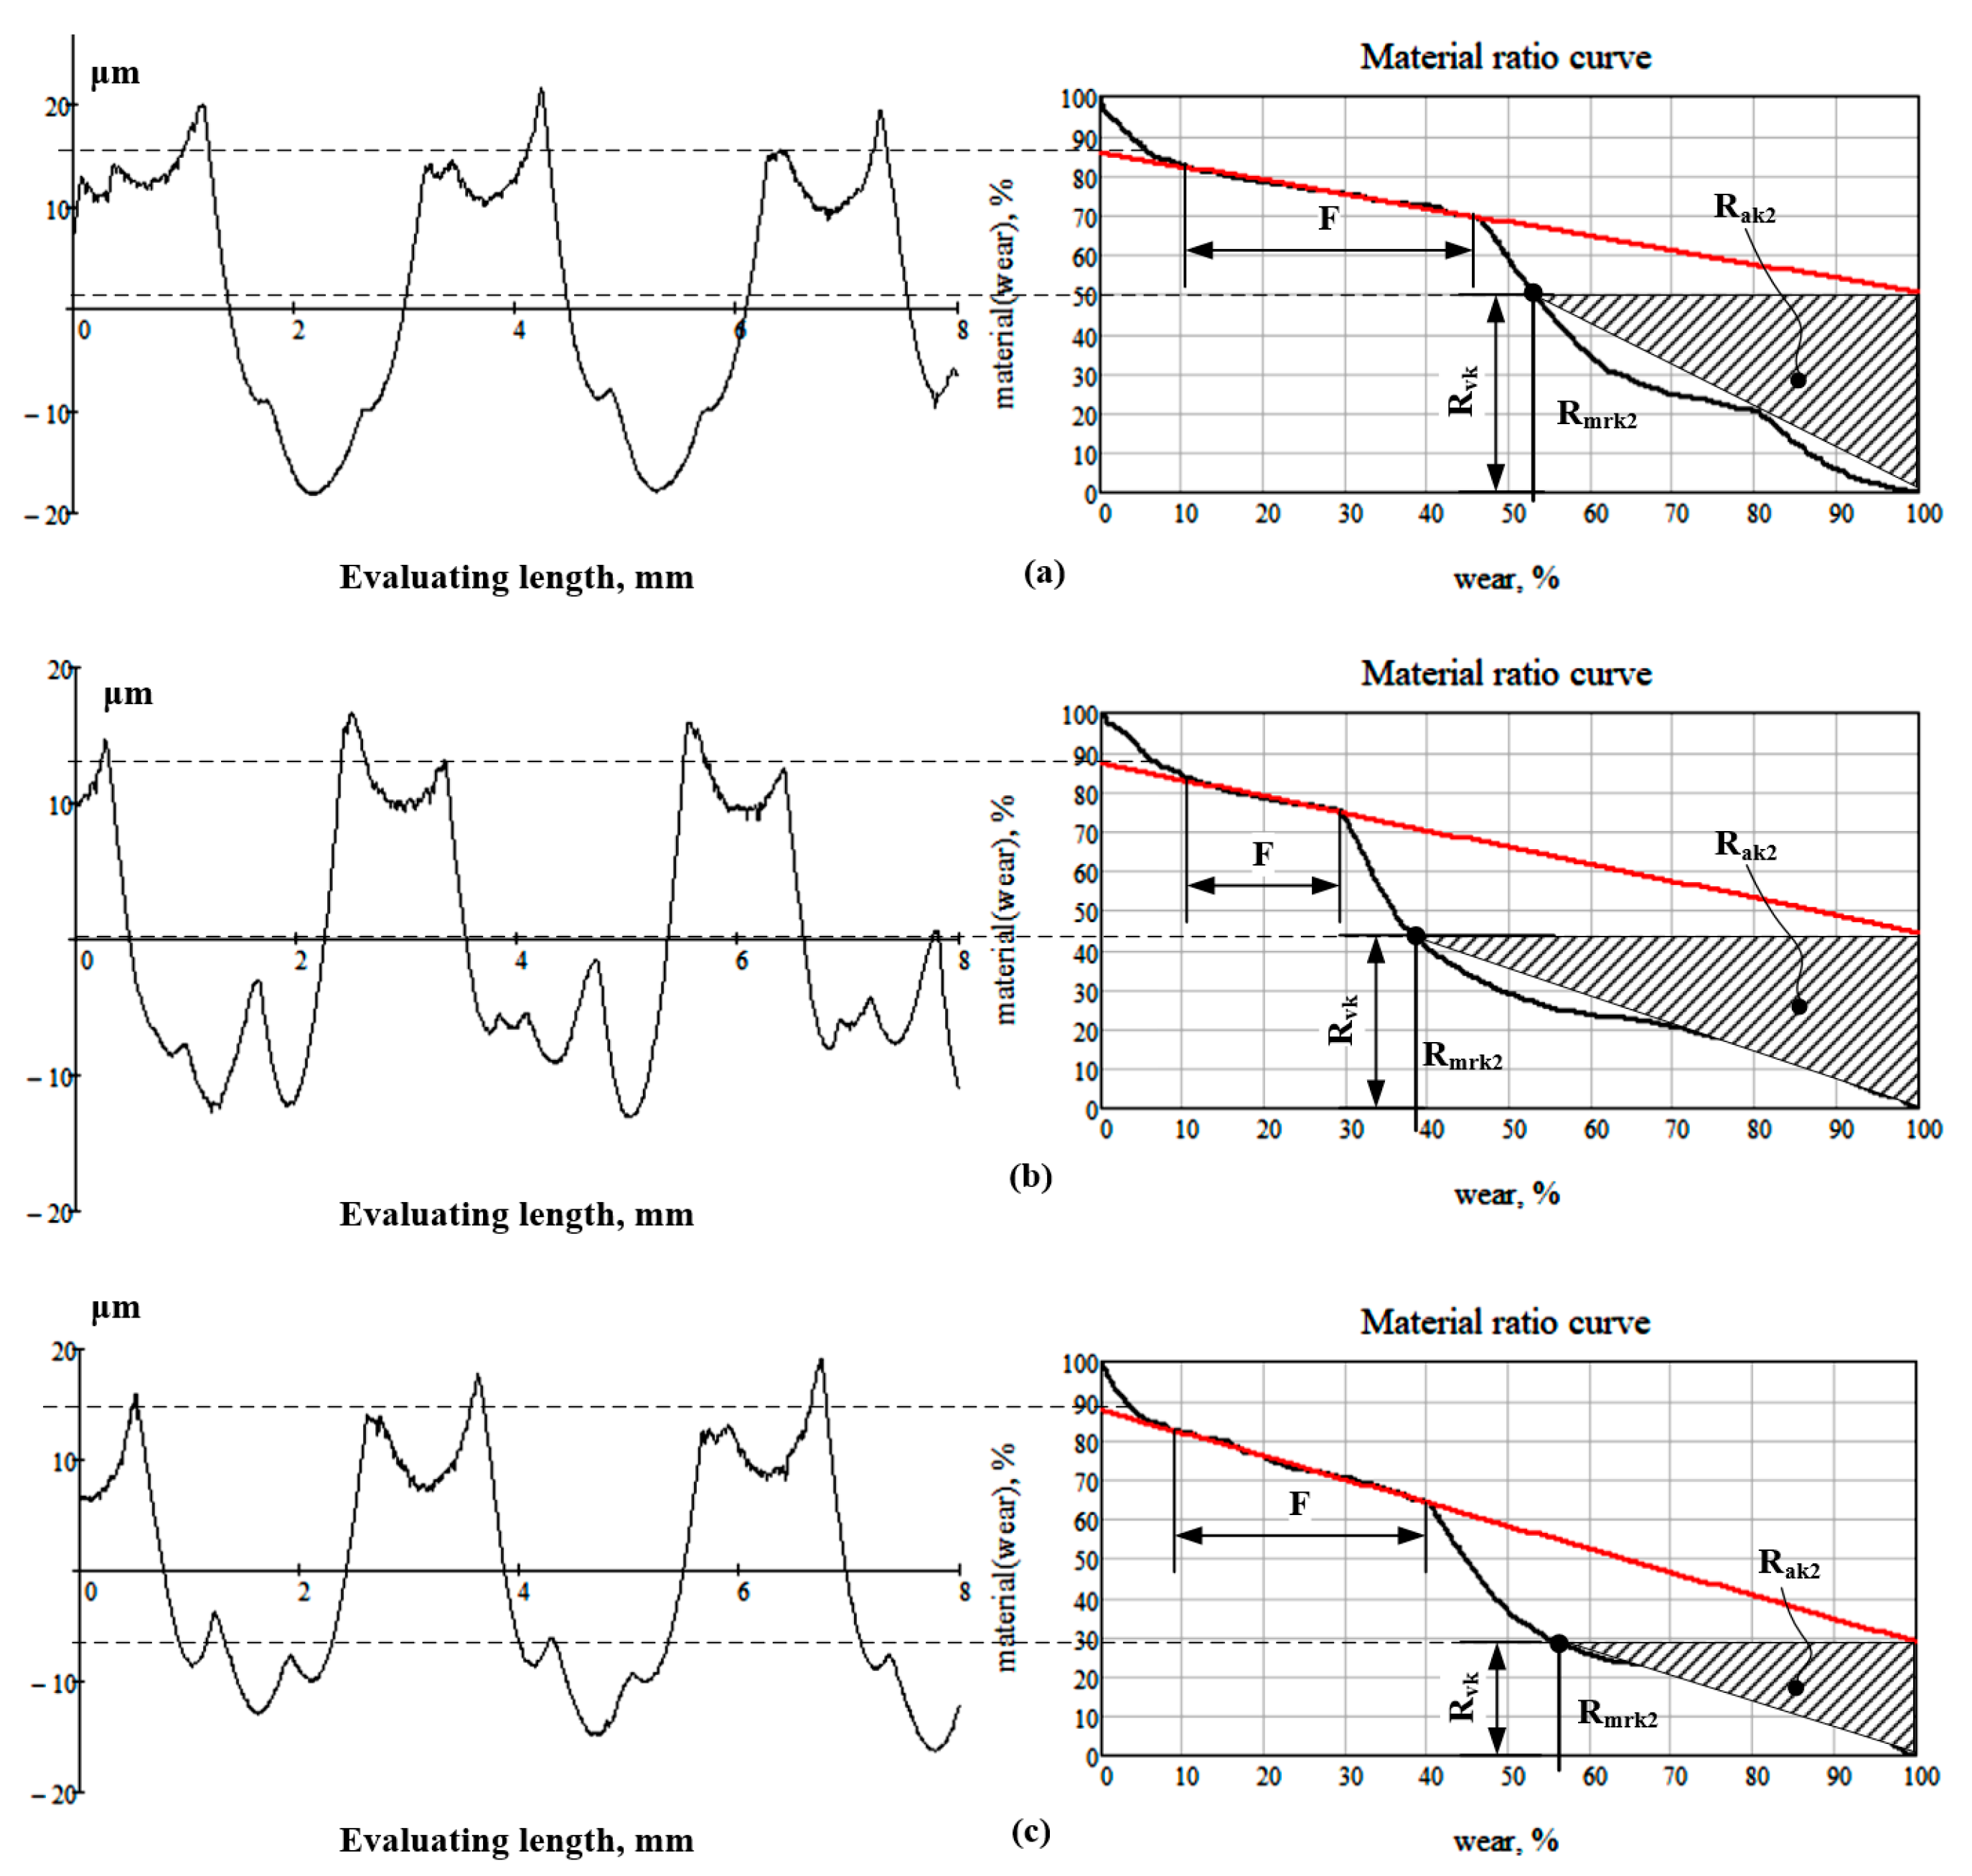
After topographies with the RMRs were measured, the corresponding MRCs were built using the methodology from Section 2.2 and measured data from the profilograms. Examples of the resulting profilograms and MRCs, derived for each of the three types of RMRs and feedrates are presented in Figure 5, Figure 6 and Figure 7.
Following the recommendations of EN ISO 21920-2 and the methodology detailed from Section 2.2, the standardized parameters (see Figure 5, Figure 6 and Figure 7): arithmetic mean height (Ra), maximum height per section (Rzx), approximate triangle area (Rak2), and material ratio function at 25% wear of the material Rmc (25%) were all calculated. The Rmc(c) function is the ratio of the material length parameter at a given level c, within the limits of the evaluation length le. It is calculated using following equation [29]:
R m c c = R m l c l e
The Rmc(c) function is important to evaluate, as it directly affects the wear resistance of the paired surfaces, and depends on the relative material length of the profile. The material ratio is expressed as a percentage, but in the current investigation, it is expressed in the form of a ratio.
The derived values are summarized in Table 1, and were then used further to conduct regression analyzes in order to reveal the influence of the RMR types and feedrate magnitude over these topography parameters.

4. Results, Analyzes, and Discussion

In order to estimate the effects of the three different types of RMRs and the ball-burnishing feedrate regime’s parameter over the above-mentioned operational parameters of the burnished surfaces, the regression analysis approach was used [30]. As independent variables (i.e., predictors) the partial RMR types and feed rates were selected in the present study. The standardized surface texture parameters Rzx, Rak2, and  R m c  (25%) were chosen as the dependent variables. A multiple linear regression model with a two-way interaction between the predictors was used for statistically modeling the researched dependencies. Minitab 19 (Minitab, LLC, State College, PA, USA) software was used to conduct the statistical analyzes [31].

4.1. Influence on the Maximum Height Criteria Rzx

The obtained coefficients of the regression equation for the maximum height criteria Rzx are as follows:
Rzx(RMR, F) = 28.934 − 1.908·RMRI − 5.444·RMRII + 7.352·RMRIII + 2.236·F500 − 2.704·F1000 + 0.467·F1500
− 0.655·RMRI·F500 + 4.018·RMRI·F1000 − 3.363·RMRI·F1500 − 1.100·RMRII·F500 − 0.506·RMRII·F1000 +
+ 1.606·RMRII·F1500 + 1.755·RMRIII·F500 − 3.512·RMRIII·F1000 + 1.757·RMRIII·F1500
The derived Rzx(RMR, F) model has a standard deviation of σ = 2.04595, and a R-square = 93.30%, respectively, which demonstrates a good fit to the experimentally obtained results. An analysis of variance (ANOVA) was also performed (see Table 2), from which it is clear that the null hypothesis H0 was not accepted for the two predictors, as well as for the interaction between them. This means that the type of the RMR and feedrate have a statistically significant effect over the maximum height of the Rzx criterion. From the “Contribution” column of Table 2, it is shown that the RMR type predictor had 69.84% of the overall impact, while the feedrate and the two-way interaction between predictors had a general 23.46% influence. The total error of the resulting model was within 6.7%.
In other words, the maximum height parameter Rzx was mainly influenced by the type of RMR, and to a lesser extent by the feedrate regime parameter of the ball-burnishing process.

4.2. Influence on the Approximated Valley Area Rak2

The obtained coefficients of the regression equation for the criteria Rak2 are as follows:
Rak2(RMR, F) = 0.009784 − 0.00189·RMRI − 0.00613·RMRII + 0.00802·RMRIII + 0.00055·F500 0.00064·F1000 +
+ 0.00009·F1500 −0.00009·RMRI·F500 + 0.00473·RMRI·F1000 − 0.00465·RMRI·F1500 − 0.00191·RMRII·F500
− 0.00170·RMRII·F1000 + 0.00361·RMRII·F1500 + 0.00199·RMRIII·F500 − 0.00303·RMRIII·F1000 + 0.00104·RMRIII·F1500
The derived Rak2(RMR, F) model has a standard deviation σ = 0.0050683, and a R-square = 72.01%, which indicate a worst fit than those obtained for the Rzx parameter. The results from the ANOVA (see Table 3) showed that the null hypothesis H0 was not accepted for only the RMR type predictor, while it was rejected for the feedrate predictor and the interaction between them. Thus, the type of the RMR was the only factor that held a statistically significant effect over the approximated valley area Rak2 criterion. Feedrate was also found to have an non-significant impact. From Table 3, it has been shown that RMR type predictor had 57.49% of the overall impact, while the feedrate was accounted to only be 0.39%, respectively. The two-way interaction between the predictors were found to have around 14% influence, but as the p-value exceeded 0.05, it was therefore considered as non-significant. The total error of the derived model (5) was almost 28%, due to the nature of the change in the Abbott–Firestone curves built for the RMR topographies, as shown in Figure 4, Figure 5 and Figure 6, where they do not have the shape of the S-curve described in the ISO 21920-2 standard, especially in the sections which corresponded to the topography valleys.
From the point of view of the lubricant retention capacity of the RMRs, the main influence was exerted by the manner of the deforming element trace crossing, while the feedrate was not found to have any noticeable influence.

4.3. Influence on the Material Ratio Function Rmc(25%)

The obtained coefficients of the regression equation for the criteria Rak2 are as follows:
Rmc(25%)(RMR, F) = 0.3003 + 0.0578·RMRI − 0.0977·RMRII + 0.0399·RMRIII − 0.0283·F500 + 0.0150·F1000 +
+ 0.0133·F1500 − 0.0494·RMRI·F500 + 0.1076·RMRI·F1000 − 0.0581·RMRI·F1500 + 0.0167·RMRII·F500
− 0.0317·RMRII·F1000 + 0.0150·RMRII·F1500 + 0.0328·RMRIII·F500 − 0.0759·RMRIII·F1000 + 0.0431·RMRIII·F1500
The derived Rmc(25%) (RMR, F) stochastic model has a standard deviation σ = 0.0695517, and a R-square = 71.99%, respectively, which indicates a similar fit degree as was obtained for the Rak2 parameter. The results from the ANOVA (see Table 4) were found to be quite similar to those obtained for the Rak2 criterion. While the null hypothesis H0 was rejected for the RMR type and interaction predictors, for the feedrate predictor it was accepted. Therefore, the type of the RMR and its interaction predictors are the factors that have statistically significant effects over the approximated material ratio function Rmc(25%). Feedrate was also found to have an insignificant impact over that criterion. It can be seen from Table 4 that the RMR type predictor had 41.88% of the overall impact, while the feedrate had 3.49%. The twp-way interaction between the predictors had 26.62% of the influence, and as its p-value does not exceed 0.05, it was considered as statistically significant. The derived model’s (6) total error was again around 28%, due to the same reason as the approximated valley area Rak2. As it can be seen, they do not have the shape of the S-curve, described in the ISO 21920-2 standard, especially in the sections which corresponded to the topography valleys.
The statistical assessment of regression Equation (6) showed that on the bearing capacity of the RMR’s topography, the most significant effect was the RMR type, while the feedrate regime parameter participates only significantly in the two-way interaction between them.

4.4. Estimation of the Main Effects and Interactions

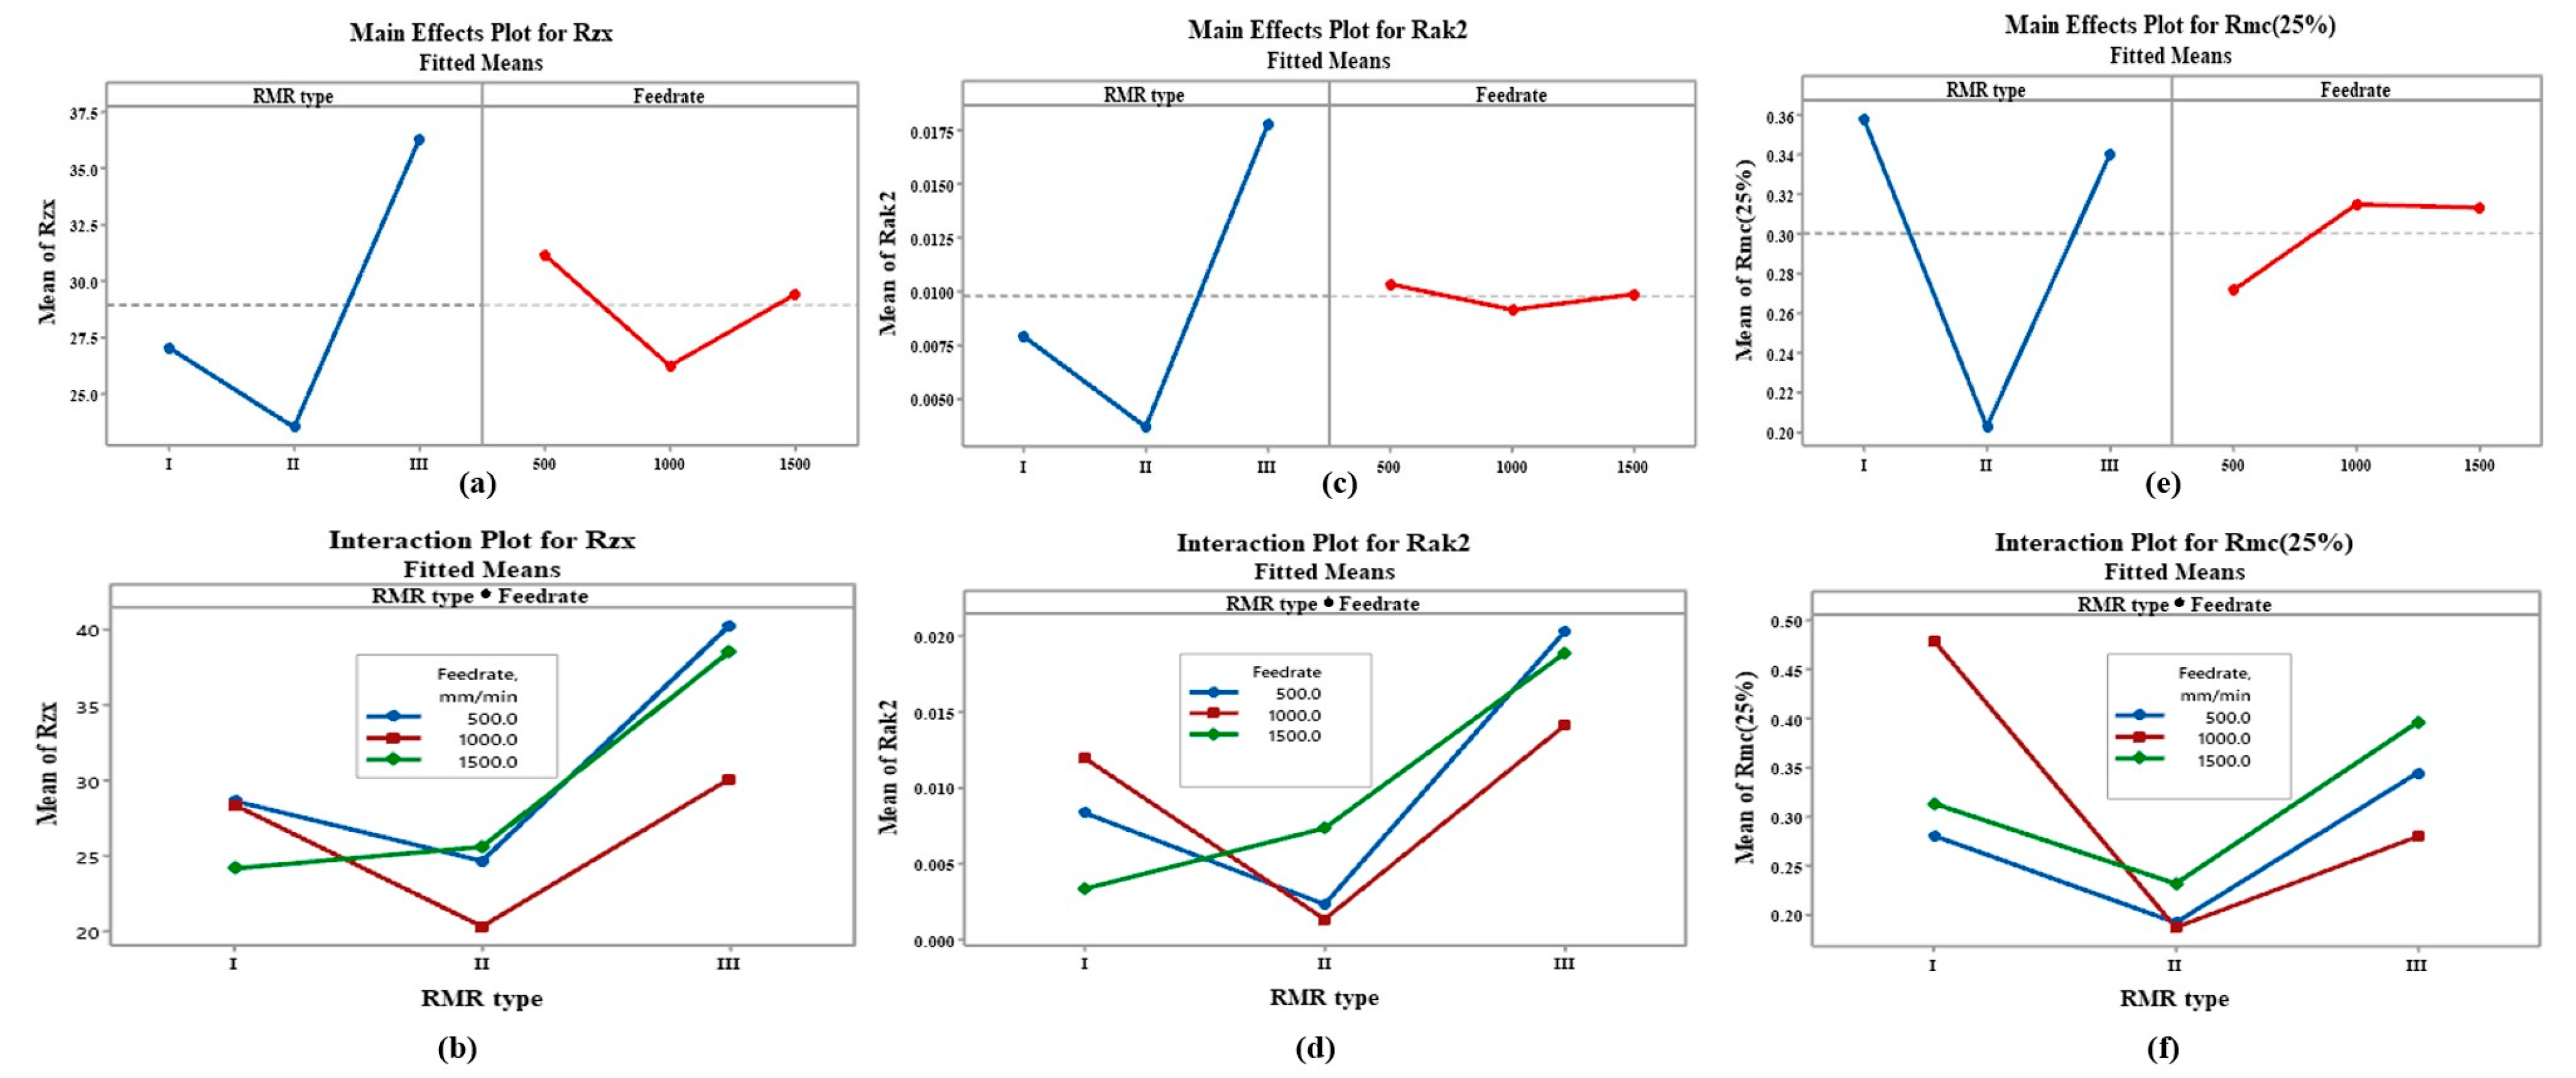
Diagrams of the main effects and interactions obtained from the regression models (see Equations (4)–(6)) are shown in Figure 8a–f). They were used to analyze the predictor’s influence over the dependent variables behavior.
The main effects diagrams show a similar influence of the predictors RMR type and feedrate for the three investigated topography criteria. It can be seen from Figure 8 that the lowest topography height occurred for the RMR of the II nd type, which is natural, due to the smallest concentration of the plastically deformed traces per unit area of the burnished surface for this type of relief (see Figure 2). In the other two types of partially regular reliefs, the traces of the deforming tool were more densely located, leading to an increase in the height of their surface texture, and this was more pronounced for the relief of the III rd type. The other two criteria, Rak2 and Rmc(25%), followed the same manner of variation (see Figure 8c,e), as their magnitude was found to be related to the material distribution in texture height.
The highest lubricant retention ability (0.02597 mm2) was observed for the RMRs of the III rd type, according to the effect calculated for Rak2, while the lowest one (0.00132 mm2) was for the RMRs of the II nd type, as according to the data in Table 1. Similar behavior was observed for the Rmc(25%) criterion, where the highest values (0.474) were achieved for the RMRs from the I st and III rd type. These findings indicate that the RMR type has a significant impact on both the lubricant retention ability and the material ratio length of the surface topography.
As shown from ANOVA Table 2, Table 3 and Table 4 and Figure 8a–f, feedrate was only found to have significant effect on the height of the surface topography, while it held no significant effects on the surface capacity to retain lubricant, and the material ratio length of the surface topography. Therefore, it can be set on its highest possible levels to ensure the maximum productivity of the ball-burnishing operation. The interactions plots (see Figure 8b,d,f) also confirmed these tendencies.
It should be noted that the present analysis was conducted according to the standardized methods for determining the criteria to evaluate the topographic patterns contained in the ISO 21920-2 standard, which mainly refer to the characteristic topographic surfaces processed by the traditional cutting methods. However, when comparing the profilograms measured and the MRCs derived, shown in Figure 3 and Figure 5, Figure 6 and Figure 7, it can be seen that in case of RR topographies, the MRCs have a different shape to the typical S-shape, which relate to the traditionally machined surfaces, especially in the part of the valleys sections. Therefore, using right-angled triangles to estimate the lubricant holding volume for some of the RRs can lead to a poor fit of the real curve shape, as shown in Figure 5b,c and Figure 7a–c. The relatively low R-square estimations obtained for the regression models for Rak2 and Rmc(25%) criteria can also be explained with same reason.

5. Conclusions

Summarizing the discussed results obtained after experimental research conducted, the following conclusions can be drawn:
  • Partially regular PMRs, regardless of their type, show about a 10 times higher lubricant retaining capacity than those surfaces which do not have patterns with plastically deformed traces. However, this feature reduces their bearing capacity respectively. Therefore, both the required lubricant retaining capacity and bearing capacity of the burnished surface must be considered when designing the parameters of the ball-burnishing operation.
  • Among the different types of RMRs investigated, the I st and III rd types of RMR demonstrated a better combination of functional properties than the II nd type of RMR which produced the lowest results in terms of the functional properties. Therefore, future research must be focused mostly on these two types of RMRs.
  • The standardized methodology for the calculation area of the dales and the Rak2 criterion included in the EN ISO 21902-2 standard are not very suitable to RMRs, due to the difference between the shapes of the MR curves. As shown from the empirically built MR curves of the RMRs (see Figure 7a–c) there was an additional area, which was not taken into account in the determination of the Rak2 criterion, and therefore, the functional parameter for the lubricant retaining capacity of the RMRs had an underestimated value. This gives us reason to research in the future other methods for determining the Rak2 criterion to take into account that additional unused area of the MR curve.

Author Contributions

Conceptualization, V.D. and P.M.; methodology, S.S., V.D. and P.M.; validation, S.S., D.D., V.S. and O.M.; investigation, V.D., P.M., S.S., D.D., V.S. and O.M.; writing—original draft preparation, V.D. and S.S.; writing—review and editing, V.D., P.M., S.S., D.D. and V.S.; visualization, S.S., D.D., V.S. and O.M.; project administration, S.S. and V.D.; funding acquisition, P.M. and S.S. All authors have read and agreed to the published version of the manuscript.

Funding

This research was funded by the Bulgarian National Science Fund (BNSF), grant number KΠ-06-H57/6, and the APC was funded by the grant contract KΠ-06-H57/6, entitled “Theoretical and experimental research of models and algorithms for formation and control of specific relief textures on different types of functional surfaces”.

Data Availability Statement

Not applicable.

Conflicts of Interest

The authors declare no conflict of interest.

References

  1. Thomas, T.R. Rough Surfaces; Longman: New York, NY, USA, 1982. [Google Scholar]
  2. Whitehouse, D.J. Handbook of Surface and Nanometrology; CRC Press: Boca Raton, FL, USA, 2011. [Google Scholar]
  3. Willis, E. Surface finish in relation to cylinder liners. Wear 1986, 109, 351–366. [Google Scholar] [CrossRef]
  4. GOST 2789-73; Surface Roughness. Parameters and Characteristics. Gospotrebstandart: Moscow, USSR, 1975. (In Russian)
  5. Tomanik, E.; El Mansori, M.; Souza, R.; Profito, F. Effect of waviness and roughness on cylinder liner friction. Tribol. Int. 2018, 120, 547–555. [Google Scholar] [CrossRef] [Green Version]
  6. Grützmacher, P.G.; Profito, F.J.; Rosenkranz, A. Multi-Scale Surface Texturing in Tribology—Current Knowledge and Future Perspectives. Lubricants 2019, 7, 95. [Google Scholar] [CrossRef] [Green Version]
  7. GOST 24773-81; Surfaces with Regular Microshape. Classification, Parameters and Characteristics. Izdatelstvo Standartov: Moscow, Russia, 1988.
  8. Mezghani, S.; Demirci, I.; Zahouani, H.; El Mansori, M. The effect of groove texture patterns on piston-ring pack friction. Precis. Eng. 2012, 36, 210–217. [Google Scholar] [CrossRef] [Green Version]
  9. Hamdi, A. Effect of cutting variables on bearing area curve parameters (BAC-P) during hard turning process. Arch. Mech. Eng. 2020, 67, 73–95. [Google Scholar] [CrossRef]
  10. Kubatova, D.; Melichar, M. Roughness Evaluation Using Abbott-Firestone Curve Parameters. In Proceedings of the 30th DAAAM International Symposium, 23–26 October 2019, Zadar, Croatia; Katalinic, B., Ed.; DAAAM International: Vienna, Austria, 2019; pp. 0467–0475. ISBN 978-3-902734-22-8. ISSN 1726-9679. [Google Scholar] [CrossRef]
  11. Cao, C.; Zhu, J.; Tanaka, T. Influence of Burnishing Process on Microstructure and Corrosion Properties of Mg Alloy AZ31. In Advanced Surface Enhancement; Itoh, S., Shukla, S., Eds.; INCASE 2019. Lecture Notes in Mechanical Engineering; Springer: Singapore, 2019. [Google Scholar] [CrossRef]
  12. Shneider, Y.G. Service Properties of Parts with Regular Microrelief, 2nd ed.; Revised and Augmented; Mashinostroenie: Leningrad, USSR, 1982; 248p. (In Russian) [Google Scholar]
  13. Slavov, S.; Dimitrov, D.; Konsulova-Bakalova, M. Advances in burnishing technology. In Advanced Machining and Finishing; Elsevier: Amsterdam, The Netherlands, 2021; pp. 481–525. [Google Scholar]
  14. Pawlus, P.; Reizer, R.; Wieczorowski, M. Reverse Problem in Surface Texture Analysis—One-Process Profile Modeling on the Basis of Measured Two-Process Profile after Machining or Wear. Materials 2019, 12, 4169. [Google Scholar] [CrossRef] [PubMed] [Green Version]
  15. Nanbu, T.; Ren, N.; Yasuda, Y.; Zhu, D.; Wang, Q.J. Micro-textures in concentrated conformal-contact lubrication: Effects of texture bottom shape and surface relative motion. Tribol. Lett. 2008, 29, 241–252. [Google Scholar] [CrossRef]
  16. Wos, S.; Koszela, K.; Pawlus, P. Comparing tribological effects of various chevron-based surface textures under lubricated unidirectional sliding. Tribol. Int. 2020, 146, 106205. [Google Scholar] [CrossRef]
  17. Swirad, S.; Pawlus, P. The Effect of Ball Burnishing on Dry Fretting. Materials 2021, 14, 7073. [Google Scholar] [CrossRef] [PubMed]
  18. Aftanaziv, I.S.; Kyrychok, P.O.; Melnychuk, P.P. Improving the reliability of machine parts by surface plastic deformation. In Zhytomyr; ZhTI Publishing: New York, NY, USA, 2001; p. 516. (In Ukrainian) [Google Scholar]
  19. ISO 1302:2002; Geometrical Product Specifications (GPS)—[Indication of Surface Texture in Technical Product Documentation]. 2002. International Organization for Standardization: Geneva, Switzerland. Available online: https://www.iso.org/standard/28089.html (accessed on 12 April 2023).
  20. Nagit, G.; Slatineanu, L.; Dodun, O.; Ripanu, M.; Mihalache, A. Surface layer microhardness and roughness after applying a vibroburnishing process. J. Mater. Res. Technol. 2019, 8, 4333–4346. [Google Scholar] [CrossRef]
  21. Dzyura, V.; Maruschak, P.; Kozbur, H.; Kryvyi, P.; Prentkovskis, O. Determining optimal parameters of grooves of partially regular microrelief formed on end faces of rotary bodies. Smart Sustain. Manuf. Syst. 2021, 5, 18–29. [Google Scholar] [CrossRef]
  22. Dzyura, V.; Maruschak, P.; Kuchvara, I.; Tkachenko, I. Ensuring a stable relative area of burnishing of partially regular microrelief formed on end surfaces of rotary bodies. Stroj. Časopis 2021, 71, 41–50. [Google Scholar] [CrossRef]
  23. Slavov, S.D.; Iliev, I.V. Design and FEM Static Analysis of An Instrument for Surface Plastic Deformation of Non-Planar Functional Surfaces of Machine Parts. Fiability Durab. 2016, 1, 3–9. Available online: https://doaj.org/article/5d09023126684e709cca46eb394d5573 (accessed on 16 April 2023).
  24. Banh, Q.-N.; Nguyen, H.-D.; Tran, A.S. Numerical Simulation and Experimental Validation of Surface Roughness by the Smoothing Small Ball-Burnishing Process. Machines 2021, 9, 48. [Google Scholar] [CrossRef]
  25. Jerez-Mesa, R.; Llumà, J.; Travieso-Rodriguez, J.A. Vibration-Assisted Ball Burnishing. Encyclopedia 2021, 1, 460–471. [Google Scholar] [CrossRef]
  26. Pawlus, P.; Reizer, R.; Wieczorowski, M. Functional Importance of Surface Texture Parameters. Materials 2021, 14, 5326. [Google Scholar] [CrossRef] [PubMed]
  27. GOST ISO 4287-2014; Geometric Characteristics of Products (GPS). Surface Structure. [Profile Method. Terms, Definitions and Parameters of the Surface Structure]. Federal Technical Regulation and Metrology Agency: Moscow, Russia, 2014. Available online: https://www.russiangost.com/p-141391-gost-r-iso-4287-2014.aspx (accessed on 14 April 2023). (In Russian)
  28. ISO 13565-2:1996; Geometrical Product Specifications (GPS)—[Surface Texture: Profile Method; Surfaces Having Stratified Functional Properties—Part 2: Height Characterization Using the Linear Material Ratio Curve]. International Organization for Standardization: Geneva, Switzerland, 1996.
  29. ISO 21920-2:2021; Specifications, Geometrical Product. “Surface Texture: Profile—Part 2: Terms, Definitions and Surface Texture Parameters”. International Organization for Standardization: Geneva, Switzerland, 2021. Available online: https://www.iso.org/standard/72226.html (accessed on 12 May 2023).
  30. Montgomery, D.C. Design and Analysis of Experiments—Douglas C. Montgomery—Google KHИΓИ. Eight Edition. 2013. Available online: https://www.academia.edu/42781722/Design_and_Analysis_of_Experiments_Eighth_Edition (accessed on 24 April 2023).
  31. Mathews, P.G. Design of Experiments with MINITAB; ASQ Quality Press: Milwaukee, WI, USA, 2005; Volume 446. [Google Scholar]
Figure 1. (a) A typical surface profilgoram measured for a milled surface; and (b) the material ratio curve (Abbott–Firestone) that corresponds to the measured profilogram.
Machines 11 00633 g001
Figure 2. Test specimens with partial RMRs from: (a) I st type; (b) II nd type; (c) III rd type; and (d) a tool [23] for BB that was used to form the three types of RMRs.
Machines 11 00633 g002
Figure 3. (a) RMRs surface topography measuring using the stylus roughness tester Mitutoyo, SurfTest SJ-301; Diagrams of profilograms measurements, for partial RMRs from the: (b) I st type; (c) II nd type; and (d) III rd type.
Machines 11 00633 g003
Figure 4. A profilogram and its corresponding MRC diagram for a raw material sheet surface.
Machines 11 00633 g004
Figure 5. Profilograms and MRC diagrams for RMRs from the I st type and their feedrates: (a) 500 mm/min; (b) 1000 mm/min; and (c) 1500 mm/min, respectively.
Machines 11 00633 g005
Figure 6. Profilograms and MRC diagrams for RMRs from the II nd type and their feedrates: (a) 500 mm/min; (b) 1000 mm/min; and (c) 1500 mm/min, respectively.
Machines 11 00633 g006
Figure 7. Profilograms and MRC diagrams for RMRs from the III th type and their feedrates: (a) 500 mm/min; (b) 1000 mm/min; and (c) 1500 mm/min, respectively.
Machines 11 00633 g007
Figure 8. Main effects and interactions plots for the: (a,b) Rzx criterion; (c,d) Rak2 criterion; and (e,f) Rmc(25%) criterion.
Machines 11 00633 g008
Table 1. Topography parameters of the RMRs and the raw material (the designations used are according to EN ISO 21920-2 and Figure 1b). The Ra, Rmrk2, and Rvk criteria were included only for reference.
Type of RMRFeed Rate,
fin.i. mm/min
Ra,
[µm]
Rzx,
[µm]
Rmrk2,
[mm]
Rvk,
[µm]
Rak2,
[mm2]
Rmc(25%), −
1I5008.1432.112.2858.030.009171 0.291
2I5007.5427.562.1356.890.007353 0.319
3I5007.2726.152.1258.050.008549 0.231
4I10008.8628.802.25513.900.015676 0.504
5I10008.5228.111.95511.040.010794 0.469
6I10008.5228.031.89010.040.009487 0.469
7I15007.6425.111.5955.020.004004 0.302
8I15005.1023.641.2154.920.002992 0.319
9I15005.0923.331.2234.910.002989 0.311
10II5006.7427.501.2752.950.001879 0.171
11II5007.3726.411.2303.050.001874 0.268
12II5004.2219.971.5753.990.003145 0.134
13II10003.3119.411.2902.040.001318 0.068
14II10005.6021.020.6001.000.000300 0.232
15II10004.9220.411.5203.060.002327 0.258
16II15007.8728.742.8756.930.009969 0.196
17II15007.2424.862.5257.960.010044 0.338
18II15003.7623.090.6756.020.002033 0.159
19III50011.2139.752.21011.930.013177 0.297
20III50013.4240.212.46021.120.025972 0.393
21III50010.6640.873.14013.960.021910 0.344
22III10009.4130.223.25015.110.024554 0.375
23III10008.1229.713.6807.920.014578 0.233
24III10008.2930.281.6254.040.003281 0.230
25III150010.7338.302.27518.150.020641 0.474
26III150010.7939.652.72017.850.024272 0.413
27III150011.9837.582.6708.900.011882 0.303
Raw material surface topography parameters:
28--0.323.410.961.0230.0004910.861
29--0.243.531.411.1520.0008130.825
30--0.282.840.560.640.0001790.869
Table 2. ANOVA results for regression Equation (4).
SourceDFSeq SSContributionAdj SSAdj MSF-Valuep-Value
Model Rzx(RMR, F)81049.9793.30%1049.97131.24731.350.000
  Linear4898.6979.86%898.69224.67253.670.000
  RMR type2785.9269.84%785.92392.96193.880.000
  Feedrate2112.7710.02%112.7756.38313.470.000
  Two-way Interactions4151.2913.44%151.2937.8219.040.000
  RMR type · Feedrate4151.2913.44%151.2937.8219.040.000
Error1875.356.70%75.354.186
Total261125.32100.00%
Table 3. ANOVA results for regression Equation (5).
SourceDFSeq SSContributionAdj SSAdj MSF-Valuep-Value
Model Rak2(RMR, F)80.00119072.01%0.0011900.0001495.790.001
  Linear40.00095657.88%0.0009560.0002399.310.000
  RMR type20.00095057.49%0.0009500.00047518.490.000
  Feedrate20.0000060.39%0.0000060.0000030.130.882
  Two-way Interactions40.00023314.13%0.0002330.0000582.270.102
  RMR type · Feedrate40.00023314.13%0.0002330.0000582.270.102
Error180.00046227.99%0.0004620.000026
Total260.001652100.00%
Table 4. ANOVA results for regression Equation (6).
SourceDFSeq SSContributionAdj SSAdj MSF-Valuep-Value
Model Rmc(25%) (RMR, F)80.2238371.99%0.223830.0279785.780.001
  Linear40.1410645.37%0.141060.0352667.290.001
  RMR type20.1302141.88%0.130210.06510713.460.000
  Feedrate20.010853.49%0.010850.0054251.120.348
  Two-way Interactions40.0827626.62%0.082760.0206914.280.013
  RMR type · Feedrate40.0827626.62%0.082760.0206914.280.013
Error180.0870728.01%0.087070.004837
Total260.31090100.00%
Disclaimer/Publisher’s Note: The statements, opinions and data contained in all publications are solely those of the individual author(s) and contributor(s) and not of MDPI and/or the editor(s). MDPI and/or the editor(s) disclaim responsibility for any injury to people or property resulting from any ideas, methods, instructions or products referred to in the content.