Article

Effect of Wiper Edge Geometry on Machining Performance While Turning AISI 1045 Steel in Dry Conditions Using the VIKOR-ML Approach

1
Department of Mechanical Engineering, College of Engineering, King Saud University, P.O. Box 800, Riyadh 11421, Saudi Arabia
2
Department of Mechanical Engineering, Maharishi Markandeshwar Engineering College, Maharishi Markandeshwar (Deemed to be University), Mullana 133207, India
3
Department of Mechanical Engineering, Graphic Era (Deemed to be University), Dehradun 248002, India
4
Institute for Automation and Applied Informatics, Karlsruhe Institute of Technology, 76344 Eggenstein-Leopoldshafen, Germany
*
Author to whom correspondence should be addressed.
Machines 2023, 11(7), 719; https://doi.org/10.3390/machines11070719
Submission received: 10 June 2023 / Revised: 26 June 2023 / Accepted: 4 July 2023 / Published: 6 July 2023
(This article belongs to the Special Issue Precision Engineering in Manufacturing: Challenges and Future)

Abstract

:
AISI 1045 can be machined well in all machining operations, namely drilling, milling, turning, broaching and grinding. It has many applications, such as crankshafts, rollers, spindles, shafts, and gears. Wiper geometry has a great influence on cutting forces (Fr, Ff, Fc and R), temperature, material removal rate (MRR) and surface roughness (Ra). Wiper inserts are used to achieve good surface quality and avoid the need to buy a grinding machine. In this paper, an optimization-based investigation into previously reported results for Taguchi’s based L27 orthogonal array experimentations was conducted to further examine effect of the edge geometry on the turning performance of AISI 1045 steel in dry conditions. Three input parameters used in current research include the cutting speed (Vc), feed (f) and depth of cut (ap), while performance measures in this research were Ra, Fr, Ff, Fc, R, temperature (temp) and MRR. The Vise Kriterijumska Optimizacija Kompromisno Resenje (VIKOR) method was used to normalize and convert all the performance measures to a single response known as the VIKOR-based performance index (Vi). The machine learning (ML) approach was used for the prediction and optimization of the input variables. A correlation plot is developed between the input variable and Vi using the ML approach. The optimized setting suggested by Vi-ML is Vc: 160 m/min; ap: 1 mm and f: 0.135 mm/rev, and the corresponding value of Vi was 0.2883, while the predicted values of Ra, Fr, Ff, Fc, R, temp and MRR were 2.111 µm, 43.85 N, 159.33 N, 288.13 N, 332,16 N, 554.4 °C and 21,600 mm3/min, respectively.

1. Introduction

The 1045 steel alloys are very common in the manufacturing sector and have many applications, such as connecting rods, a crankshaft, gears, bolts, shafts, etc. The machining techniques to process AISI 1045 steel alloys were fully developed, but to obtain higher productivity and good surface quality, researchers are still working in this direction. The research community is working on the development of advanced techniques in machining and optimization by which better productivity and surface quality can be obtained.
Nowadays, controlling surface quality along with productivity is the requirement of most of these industries and is the most difficult challenge for researchers. In the manufacturing process, the raw material was converted into the finished products so as to be used for different applications. Therefore, an item with enhanced features and being financially stable are important aspects to be taken into consideration [1,2]. Almost 95% of the energy during machining is transformed into heat due to the movement between the workpiece and the tool to be machined [3,4]. The energy formed is waste, and surface quality, along with tool, wear also suffers [5]. Although fast machining is preferable in order to have excellent productivity, the cutting speed is restricted because of the relative motion of the tool and the workpiece. Therefore, it is better to control the heat generated in order to have a good quality product and also an improved tool life. Additionally, such heat causes the microstructural distortion of the components [6]. The quality of these components is also compromised due to the relative motion between the material and the tool [7]. This issue can be solved by introducing the cutting fluids on the interface of the tool and workpiece [3,8]. The prime utilization of such fluids is to overcome the heat produced at the interface of the tool and workpiece [9]. Other than this, it also overcomes the friction between the tool and material during the machining [10]. Additionally, cutting fluids help to remove the metal chips during machining [11], and coolants make the tool–work interface chips free and ensure smoothness over the workpiece [12]. These features of coolants and lubricants enable their utilization in various procedures such as drilling, grinding, turning, etc. [13]. The mechanism of deformation is greatly impacted by the cooling technique that is applied [14]. Although coolants and lubricants have a number of benefits, they also have certain outcomes as well [12]. During machining, the usage of coolants and lubricants facilitates the colonization of fungi and bacteria [15]. Not only this, coolants and lubricants are made up of cryogenic materials [16], which can cause an allergy or cancer when it comes in contact with the skin of humans [17]. Additionally, they enhanced the manufacturing expenses by 8% of the total expenses, which is important when taken into consideration for a daily scenario [18]. Therefore, to overcome the drawbacks of coolants and lubricants, various investigators have focused on finding alternatives to coolants and lubricants while considering the advantages of the two. NDM (Near dry machining) is a stride toward using fewer coolants and lubricants while machining [12]. The main purpose of NDM is to ensure green and sustainable manufacturing in the latest environment [19,20,21,22,23]. NDM is exceptionally advantageous for greener and more sustainable processes [24]. Taguchi defines the item’s nature as “the base loss is ensured whenever the item [is] dispatched among the general public” [25]. The overall loss is considered a combination of spending by the clients, disappointment, a guarantee of cost, loss because of a network, the mismanagement of assets, and so on. One of the methodologies is robust design in order to find the circumstances of the process and product, which can ensure low expenses in production and good quality products. One such technique is the Taguchi approach, which ensures the optimization of quality, cost and performance. The most important tools for robust design are the signal-to-noise ratio and orthogonal arrays. The former ensures good quality for the outcomes and later contains various control factors. Taguchi’s technique completely supports the trials of the measurable plan. This approach fulfills the advancement in the process and reduces the time needed for the experimental examination [26,27,28]. Various practitioners and researchers have used the DOE (design of experiments) and its upgradation to Taguchi’s method to make a strategy for the experiments and also perform the optimization of the parameters for machining. In Bajić et al. [29], a sequence of experimentation was carried out with DOE so as to examine how surface roughness became impacted by the cutting parameters such as ap, f and Vc in the operation of face milling. Yang and Chen [30] used the Taguchi method to plan the process, which eventually ensured an exact technique that could productively differentiate the perfect surface roughness. In Filho and Diniz [31], DOE was utilized in order to examine the effect of surface finish, tool wear, the feed rate per tooth, and cutting velocity in contrast with the processing activity. Tsao [32] projected another technique named Gray–Taguchi in order to improvise the parameters for the aluminum combination, which demonstrated good finishing over the surface. The literature states how various investigators have studied machining in the field of the DOE and NDM application. However, some issues have arisen while considering the NDM idea, which signifies that more research must be carried out so as to find out a reasonable panacea.
After the review of the literature, it was found that numerous research has been conducted on the processing of steel by a carbide tool [33,34,35]. Another aspect of research by investigators is using the one parameter at a time approach, the Taguchi method and the Grey relational approach. However, a dearth of research has reported on the processing of AISI 1045 steel using the wiper geometry tool insert [36]. However, few works of research have been published on the implementation of the VIKOR-ML approach to investigate performance measures while processing AISI 1045 steel using wiper tool inserts. The planning of this experiment is conducted using the Taguchi-based L27 orthogonal array. The Vc, f and ap were the input variables, while Ra, Fr, Ff, Fc, R, temp and MRR were the performance measures. All the output variables were changed into a single performance measure, termed the performance index, and this was investigated using VIKOR. Thus, this is known as the VIKOR-based performance index (Vi). The machine learning approach was used for the investigation and correlation of the Vi with the input variables.

2. Materials and Methods

This manuscript presents an extended investigation into the machining responses of AISI 1045 steel under dry turning conditions, previously reported by Abbas et al. [35,36]. The material processed in the present work was AISI 1045 steel. This steel has applications in different industries, requiring high strength and wear resistance. Table 1 provide the composition (chemical) and mechanical characteristics of the material.
The bars of AISI 1045 steel were received in hot-rolled and normalized conditions. For microstructural testing, the steel bars were sawed into small samples using a coolant in order to avoid excessive heating. For metallographic preparation, the steel samples were ground using SiC sandpaper with different grit sizes, after which polishing was performed using a polishing cloth and colloidal silica suspension. This was followed by an etching process using 2% Nital solution for 10 s which was subsequently washed and dried. This was followed by an etching process using a 2% Nital solution for 10–20 s which was subsequently washed and dried. The microstructure was examined using the scanning electron microscope, SEM (JEOL-6600, Tokyo, Japan). Figure 1a shows a secondary electron image (SEI) on the etched surface. The microstructure was composed of fine grains of proeutectoid α-ferrite (dark phase) and fine pearlite (lamellar structure of ferrite (dark phase) and cementite, Fe3C, white phase). The microstructure represents a typical example of normalized hypoeutectoid plain carbon steel.
The conventional lather of the Emco make (EMCOMAT-20D, Hallein-Taxach, Austria) was used to machine the material [37]. This machine tool had the following specifications: Electronic speed control: 40–3000 rpm, longitudinal feed: 0.045–0.787 mm/rev, drive motor: 5.3 kw and stepless speeds. The Sandvik make (Stockholm, Sweden) carbide tool insert with wiper geometry (DCMX11 T304-WF 4315) was used to process AISI 1045 steel with a length of 120 mm, diameter of 70 mm and cutting length of 30 mm for each pass was used for the experimentation [35,36].
A total of 27 test runs were as follows: three levels of surface speed (Vc) 80, 120, and 160 m/min, three levels of depth of cut (ap): 0.5, 0.75, and 1.0 mm, three levels of the feed rate (f): 0.045, 0.09, and 0.135 mm/revolution [35,36]. Figure 2 depicts the microscopic image of a normal tool insert (Figure 1b) and a wiper geometry tool insert (Figure 1c). The Sandvik make of conventional (DCMT11T304-PF) and wiper geometry (DCMX11T304-WF) tool inserts were used to machine AISI 1045 steel [36]. The rake angle for the conventional and wiper geometry tool inserts was 6° and 18°, respectively. However, both inserts had the same cutting-edge angle (55°), clearance angle (7°) and nose radius (0.4 mm). In the processing of the material during turning, the nose radius and feed rate played a pivotal role. Conventional round-nose tool inserts limited productivity. The main reason for this was the limitation of the upper feed value. The possible solution to this problem was to use a large nose radius, which could enhance the forces value along with the chatter. This could either improve productivity or surface quality but not both. With the introduction of wiper geometry in tool inserts, the nose with a large radius of curvature increased productivity with a high feed value. This would increase the surface quality. Feed force (Ff), cutting force (Fc) and Radial force (Fr) were observed using a Kistler make of dynamometer (Model 5070, (Liechtenstein, Switzerland). The resulting force (R) could be calculated from the formula:
R = F r 2 + F f 2 + F c 2
Fr, Ff, Fc and R were computed [38] in Newtons (N). The MRR could be computed using Equation (1).
M R R = 1000   V c   f   a p
where,
  • V c   = Surface speed (m/min)
  • f = Feed rate (mm/rev)
  • a p = Depth of cut (mm)
  • MRR was measured in (mm3/min)
Figure 2. Distribution of forces in turning operation [38].
Machines 11 00719 g002
As reported in [37], the average roughness values measured from the peak and valleys are known as the arithmetic average of the surface roughness (Ra). The value of Ra was measured using the Tesa (Rugosurf 90-G) make (Bugnon, Switzerland) surface roughness tester [37]. The Ra value was measured perpendicular to the axis of cutting. The surface was cleaned with acetone before it was measured, and an average of three readings were selected in the present work for analysis purposes [39,40]. The process flow in the current research is represented in Figure 3.

3. Results and Discussion

The experimental plan of all three input parameters and the corresponding values of Ra, Fr, Ff, Fc, R, Temp and MRR are represented in Figure 4 [37]. The experiments were conducted considering the concept of randomness, repeatability and blocking. It was evident from the responses that out of seven, six (Ra, Fr, Ff, Fc, R, Temp) were of the lower-the-better type, while one (MRR) was a larger-the-best type quality attribute. This made the present problem a Multi-Criteria Decision Making (MCDM) problem [40,41]. Thus, to solve this, the MCDM approach of VIKOR-ML was adopted.

3.1. Statistical Analysis of Response Variables

Table 2 presents a statistical analysis of the response variables (namely Ra, Fr, Ff, Fc, R, Temp and MRR). From the analysis of Ra, it is clear that f had the maximum influence (56.84%) for investigating Ra, preceded by Vc (18.94%) and ap (14.47%). A high F-value showed the larger contribution of the control factors. The p-values in the analysis were the probability value, and for a good model, these were less than 0.05. The interaction of Vc and ap; ap and f; Vc and f presented p-values less than 0.05, which depicted the significant influence of these interactions on the computation of Ra. The value of R2 predicted the future outcomes of the present model. In the present work, the value of R2 was 99.09, and Adjusted-was 97.05, which depicted a close agreement with each other.
The ANOVA of Fr showed that ap had a maximum contribution (45.7%), followed by f (21%) and Vc (20.4%). The interaction between Vc and ap played a significant role due to the p-value being less than 0.05. Similarly, CS, ap and f had p-values less than 0.05 in the case of Fr. The summary of Ff depicted that all the input parameters and respective interactions had a significant influence on the investigations of Ff.
The feed value had a maximum influence (38.3%), followed by ap (35.7%) and Vc (15.3%). The statistical summary of Fc represented that ap (44.57%) had a maximum influence on the investigation of Fc while turning AISI 1045 steel using wiper tool inserts, followed by f (25.60%) and Vc (18.37%). The summary suggested that the Vc, ap, f, interaction plots of Vc and f, ap and f played an influential effect on the Fc, as evident from the p-values. Similar trends were depicted from the F-values. The value of R2 (99.32%) was in close agreement with the adjusted R2 (97.78%). R2 presented the future outcomes from the model due to significant and non-significant terms; however, adjusted-R2 provided the predictions of future outcomes due to significant terms only. The statistical summary of the reaction ® showed that ap (42.7%) had a maximum influence on the computation of a response during the turning of AISI 1045 steel using wiper tool inserts, followed by f (28.10%) and Vc (17.9%). The summary suggests that Vc, ap, f, the interaction plots of Vc and f, ap and f, Vc and ap played an influential effect on R, as evident from the p-values.
It was evident from the ANOVA that Vc (53.2%) had a maximum influence that was preceded by f (15.9%) and ap (11.2%) for the calculation of temperature during the processing of AISI 1045 steel by wiper geometry. The interaction of CS and ap also played a significant role in the temperature, with a p-value of 0.03, which was less than 0.05. The analysis of MRR revealed that p-values for all the parameters and interactions were less than 0.05. Therefore, every parameter and interaction played an important role in the calculation of MRR. From the pcp values it is clear that f had the maximum contribution (48.18%) for the investigation of MRR, preceded by Vc (21.41%) and ap (21.41%). The values of R2 and adjusted R2 for all the responses (namely Ra, Fr, Ff, Fc, R, Temp and MRR) had close compliance with each other.

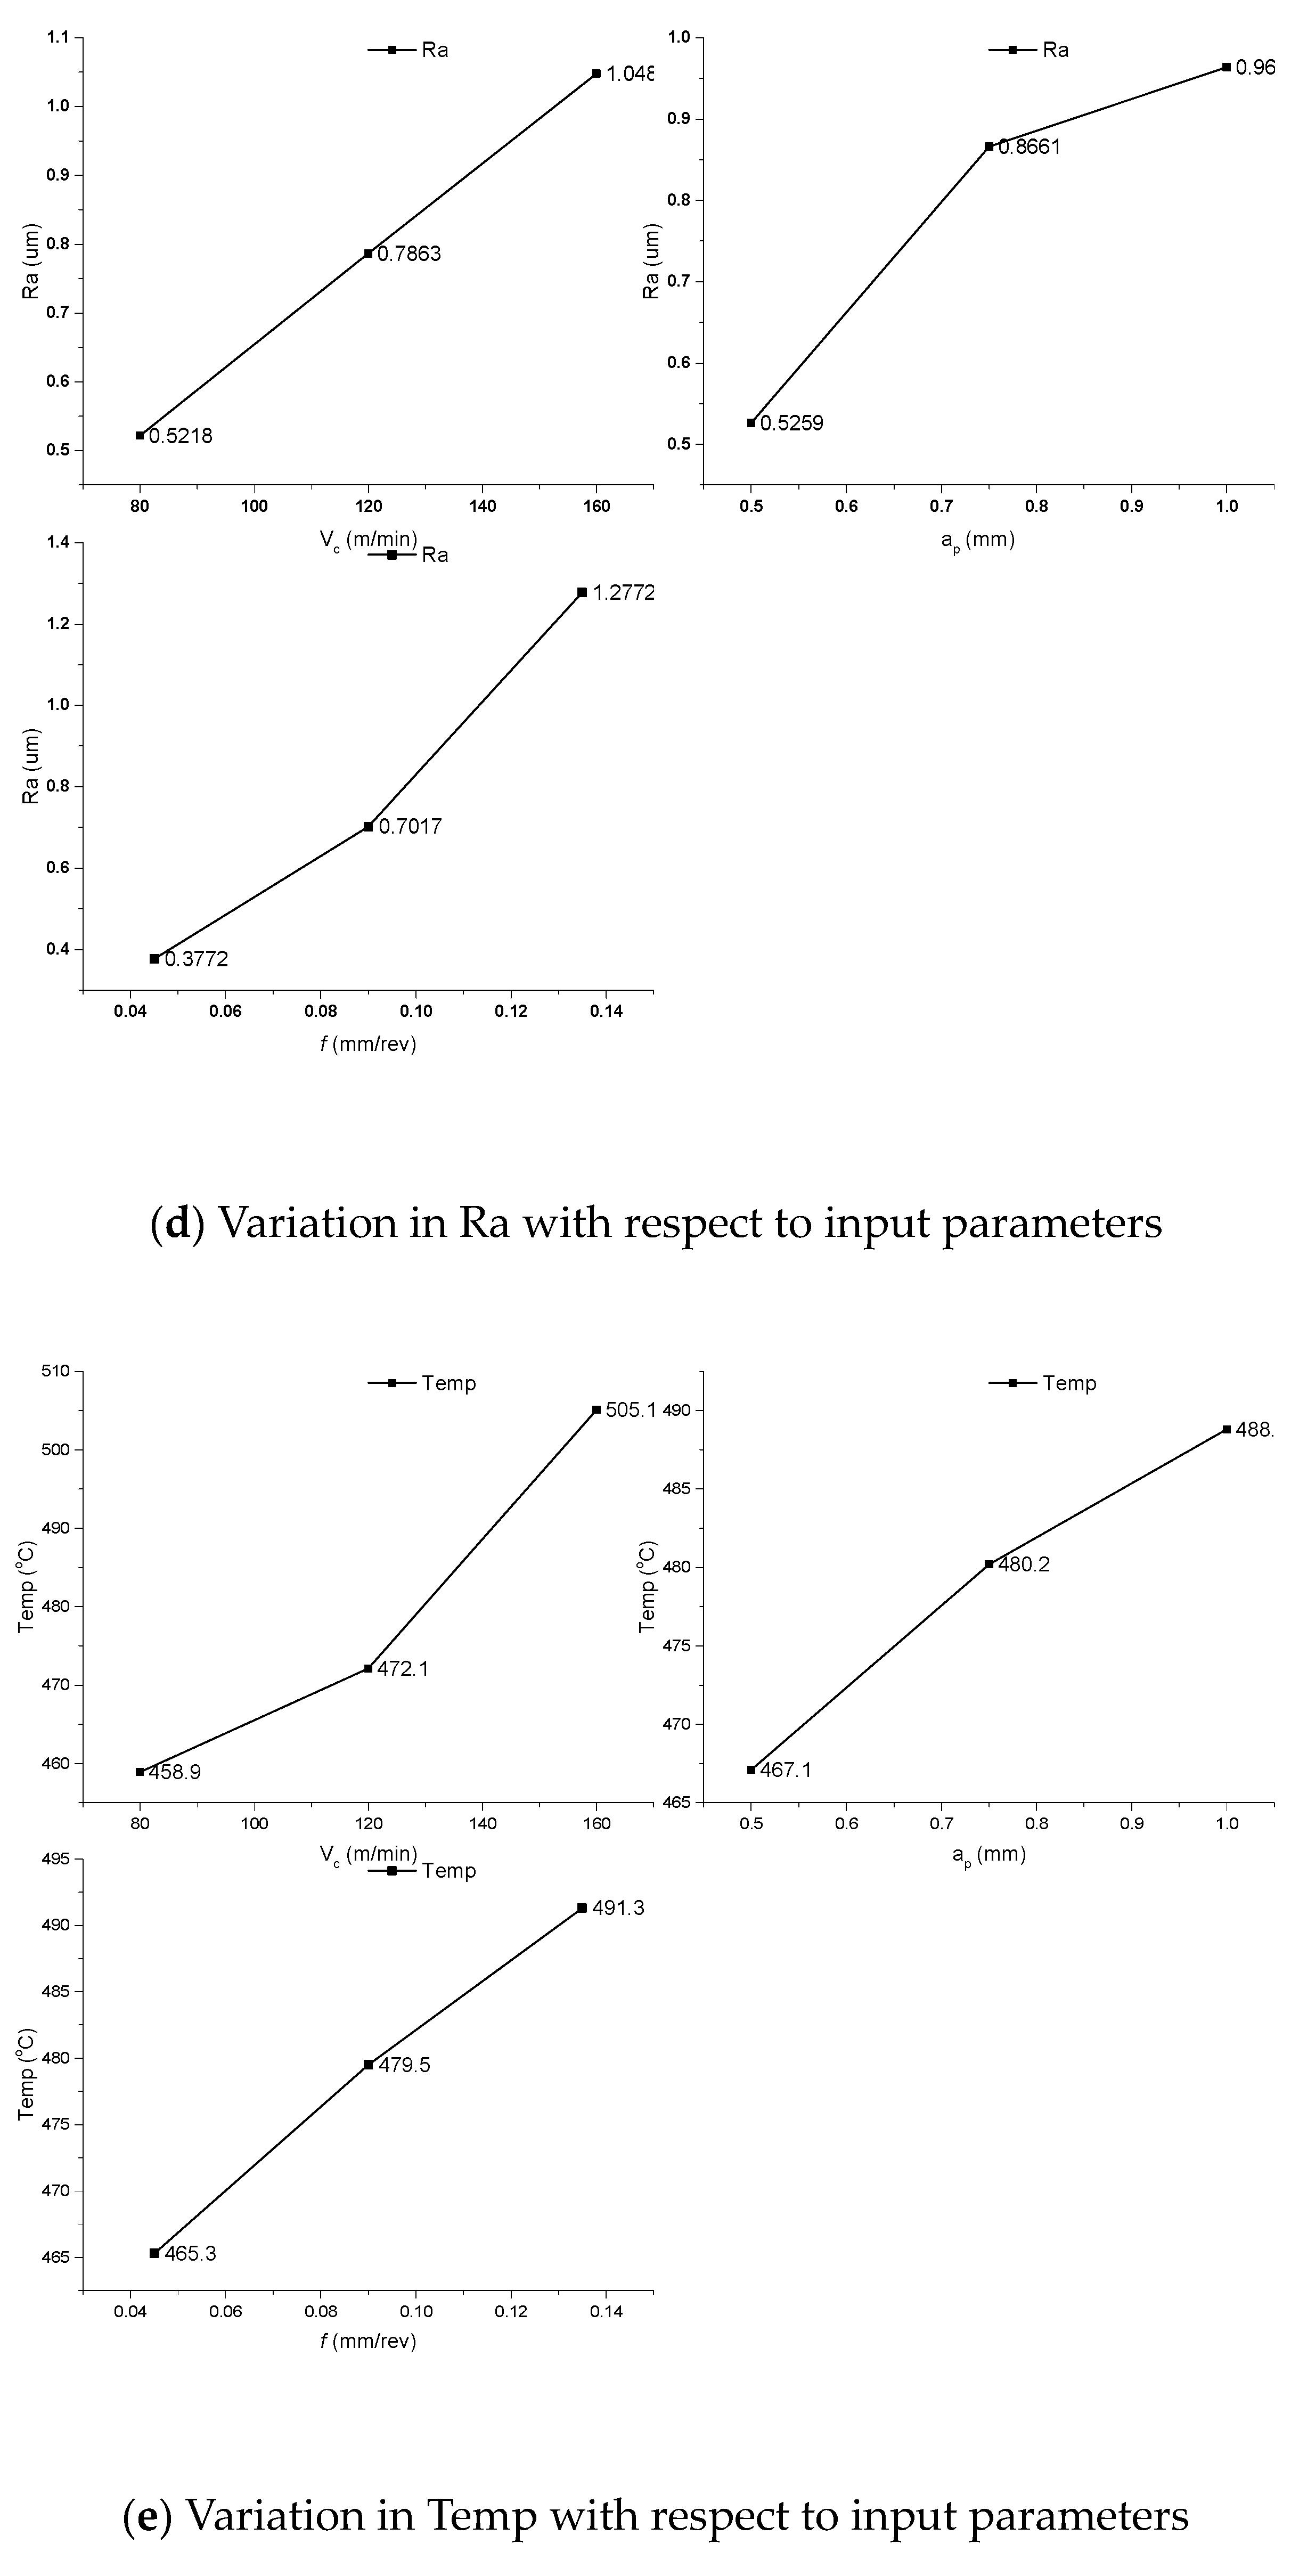
3.2. Variation in Response Variables with Respect to Machining Variables

The variation in the performance measures with respect to the input process variable is discussed in this section.
It is evident from Figure 5a that with the amplification in the Vc value, the value of the force (Fr, Ff, Fc and R) decreased. This was due to the fact that with the increase in the Vc value from 80 m/min to 160 m/min, the thermal softening of AISI 1045 steel increased due to the value of the force, which decreased gradually. The main fact of this decrement in the Fc with the increase in Vc was the reduction in shear strength as the temperature increased with speed [42]. Another reason for the decrease in Fc might be the tool–chip interface contact area. The contact area was controlled up to a certain length; thus, real contact became smaller than natural contact, and hence Fc was found to be decreased [43]. Figure 5b depicts the variation in the force with respect to ap, which clarifies that, with the amplification in ap values, the value of the force was also amplified. This was due to the fact that, with a high value of ap, more material had to be removed in a single cut at the same Vc and f. Therefore, the chances of build-up edges were increased, with the need for large forces to overcome them. Figure 5c represents the variation in the forces with respect to the feed value, and it is clear from Figure 5c that with the increase in the feed value, the value of the force was found to be increased. The probable reason for these enhancements might be that with the increase in the feed value, more material was removed per unit of time. When f increased, the relative motion between the workpiece and the tool became faster, leading to higher friction forces. These increased the feed forces and put additional stress on the cutting tool, machine components, and fixtures.
Figure 5d depicts the variation in Ra with the input parameters while machining AISI 1045 steel. The value of Ra was enhanced from 0.5218 µm to 1.048 µm with the increase in the Vc value from 80 to 160 m/min. The value of Ra increased from 0.5218 µm to 0.7663 µm after varying the Vc value from 80 m/min to 120 m/min. The value of Ra was further enhanced from 0.7663 µm to 1.048 µm with an increase in Vc from 120 to 160 m/min. The main reason for this increment was the material characteristics, which were reactive with the carbide tool inserts [44]. During the machining process, the material was removed in the form of chips. These chips were stuck with the cutting tool and made the surface quality poor. With the increase in Vc, more chips were exposed to the surface, and surface roughness increased. It was found that the value of Ra ameliorated from 0.525 µm to 0.964 µm with an increase in the ap value from 0.5 mm to 1 mm. The main reason for the increase in the Ra value with ap was the increase in the depth of the tool. Due to this, more material was plowed from the workpiece in the form of craters that increased the Ra. It was found that the value of Ra increased from 0.3773 µm to 0.7017 µm with the amplification in the f value from 0.045 mm/rev to 0.09 mm/rev. Further, an increase in the f value from 0.09 mm/rev to 0.135 mm/rev, and the value of Ra was enhanced from 0.701 µm to 1.277 µm. This enhancement in roughness value was due to more material being extracted from the workpiece with each revolution. Thus, large craters were removed, which made the surface poorer.
Figure 5e presents the variation in temperature with the change in machining variables. It is clear from Figure that with the increase in Vc, f and ap, the temperature also increased. Machining takes place due to plastic deformation, and during deformation, most of the energy is converted into heat. With the increase in ap and Vc, larger amounts of heat were generated, which increased the temperature. The increase in the feed value increased the friction between the tool and chip and increased the cutting temperature. Figure 5f depicts the variation in MRR with the input parameters. Figure 5a shows that with the increase in Vc from 80 m/min to 160 m/min, the MRR increased from 5400 mm3/min to 10,800 mm3/min. The increase in MRR was due to more material coming into contact with the tool at the same time as an increase in Vc. The value of MRR increased from 5400 mm3/min to 8100 mm3/min with the amelioration of ap from 0.5 mm to 0.75 mm. A further increase in the ap value took place from 0.75 mm to 1 mm, and MRR was observed to increase from 8100 mm3/min to 10,800 mm3/min. The increase in MRR was due to an increase in more material depth with the increase in the ap value. With the increase in the f value, the chip load per revolution was enhanced, and MRR was found to be increased. Due to the increase in the chip load per revolution, the MRR value increased from 4050 mm3/min to 12,150 mm3/min with the increase in f from 0.045 mm/rev to 0.135 mm/rev.

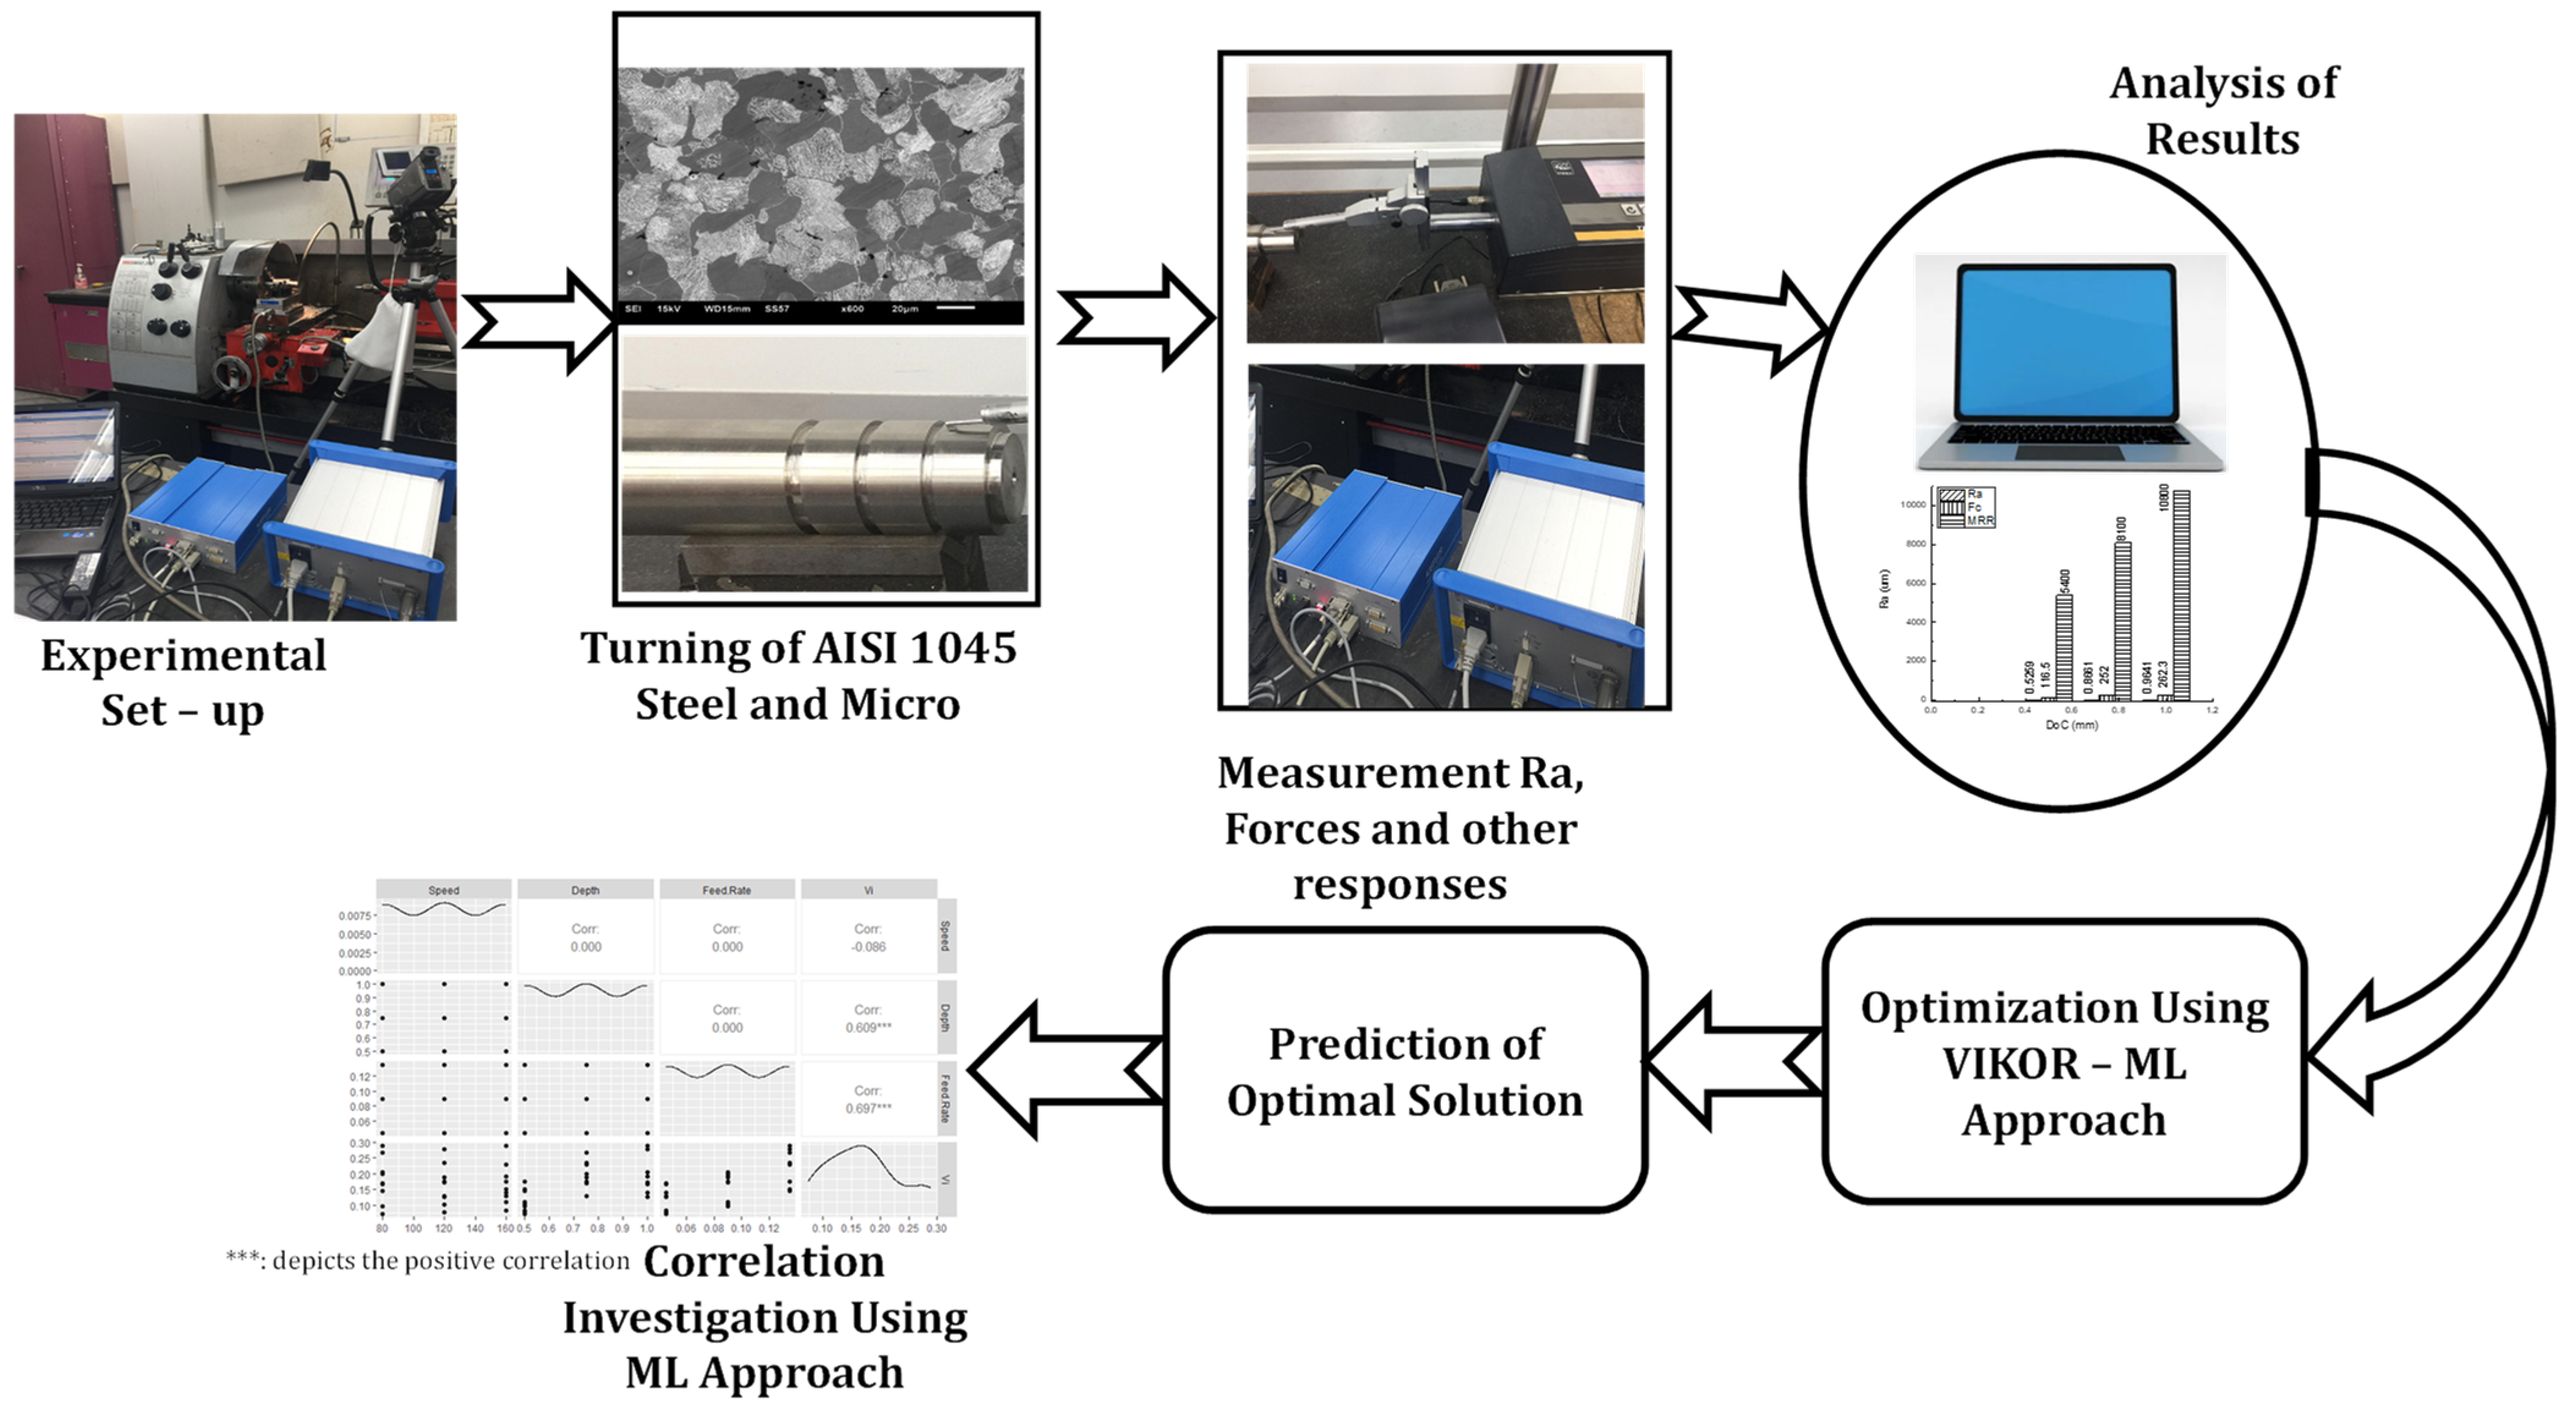
4. Implementation of VIKOR-ML Approach

4.1. VIKOR Approach

The VIKOR method is a statistical method that can solve the problems associated with multiple responses having conflicting natures (like the combination of the smaller the better and higher the best type quality attributes for a single problem). A Serbian researcher Sarafim Opricoveic developed this method in 1979 to solve MCDM problems, and in 1980, the researcher applied it for the first time. In 1990, it was named VIKOR, which is extracted from a Serbian word [45], which means Multi-Criteria Optimization and Compromised Solutions. This method was effectively used to find out the best solution where the process involved either two or more than two response variables. In the present research, seven output responses (i.e., Ra, Ff, Fr, Fc, R, Temp and MRR) were involved, in which two responses (Ra, Ff, Fr, Fc, R and Temp) were of the lower the better type while MRR had a higher the better type quality attribute, which made it a combination of both types of responses (those are conflicting in nature) [46].
Few responses have values in thousands, while others have values in hundreds or in decimals. Thus, it became essential to normalize all the responses and categorize all the response variables between zero and one. The standard process was adopted for the normalization [47]. The decision matrix was formed according to Equation (2).
H = H 11 H 12 . . H 1 n H 21 H 22 . . H 2 n . . . . . . . . . . H m 1 H m 2 . . H m n
Here, n are the responses and i = 1, 2, ……, m are the input variables.
Once the decision matrix was formed, the normalization of the data was processed as per Equation (2). The response variables had different units and different orders; thus, after the normalization all the responses were transformed into a dimensionless number between 0 and 1. The normalized values of all the performance measures were evaluated and are depicted in Table 3. All the normalized values were summed up, and the performance index was calculated and described here as the VIKOR index (Vi). A large value of Vi depicted the best optimal setting for the compromised results, where all three-response variables could be compromised.
H ¯ i j = H i j i = 1 n H i j 2
Table 3 presents the Vi values and the maximum value of Vi (0.2883) was found corresponding to experimental run number 27. Corresponding to experiment number 27 the values of Ra, Fr, Ff, Fc, R, temp and MRR were 2.111 µm, 43.85 N, 159.33 N, 288.13 N, 332,16 N, 554.4 °C and 21,600 mm3/min, respectively.

4.2. Machine Learning Approach

The optimization was conducted using the empirical modeling and machine learning approach. The objectives in the present work were larger the better the type (MRR) and lower the better (Ra, Fr, Ff, Fc, R and temp) [48,49]. ‘Vi’ is the objective function in the current work. Vi was the combined effect of Ra, Fr, Ff, Fc, R, temp and MRR; therefore, it became larger the better type of quality characteristic. The larger the value of Vi, the better the compromised result of Ra, Fr, Ff, Fc, R, temp and MRR corresponding to the parametric setting. To optimize the value of Vi, the machine learning approach was implemented. In this approach, the first step included the extraction of data in the Excel format and then provided the local namespace. In the second step, Pandas and NumPy were used for the analysis of data. The prerequisite for Pandas was already explained in the previous research [49,50,51,52], which included the data frame and series. Further, the correlation was investigated between the input variables (Vc, f and ap) and the collective output parameter (Vi).
This correlation was set up by the visualization and evaluation of datasets. The data in Vi Table (Table 3) were divided into two portions: one portion was used for the training purpose (80% data), and the other portion was used for testing (20% data). Figure 6 shows the correlation mapping of the process parameters with respect to Vi. It is clear from Figure 6 that there was a correlation between Vi and Vc and Vi and ap, Vi and f. From the color mapping, the darkest color was observed in the case of Vi and f, while it faded away in the case of Vi and ap. The values of correlation between the process parameters and Vi can be observed in Figure 7. The maximum value of the correlation was 0.697 (in the case of Vi and f). Further, its value decreased to 0.609 (Vi and ap) and −0.086 (Vi and Vc). Therefore, the correlation mapping and correlation plot verified the results.

5. Conclusions

In the current work, a previously reported experimental investigation into the machining responses of AISI 1045 steel using wiper geometry tool inserts on a tuning operation was further extended. The performance of the process was evaluated in terms of Ra, Fr, Ff, Fc, R, temperature and MRR while varying Vc, ap and f. The collective output of the process was investigated using the integrated VIKOR Machine Learning Approach. The outcomes from the present work are as follows:
  • Feed (f) had the maximum influence (56.84%) on Ra while turning AISI 1045 steel, followed by Vc (18.94%) and ap (14.47%). The interactions of Vc and ap, Vc and f and ap and f had a significant influence on the investigation of Ra due to a p-value less than 0.05.
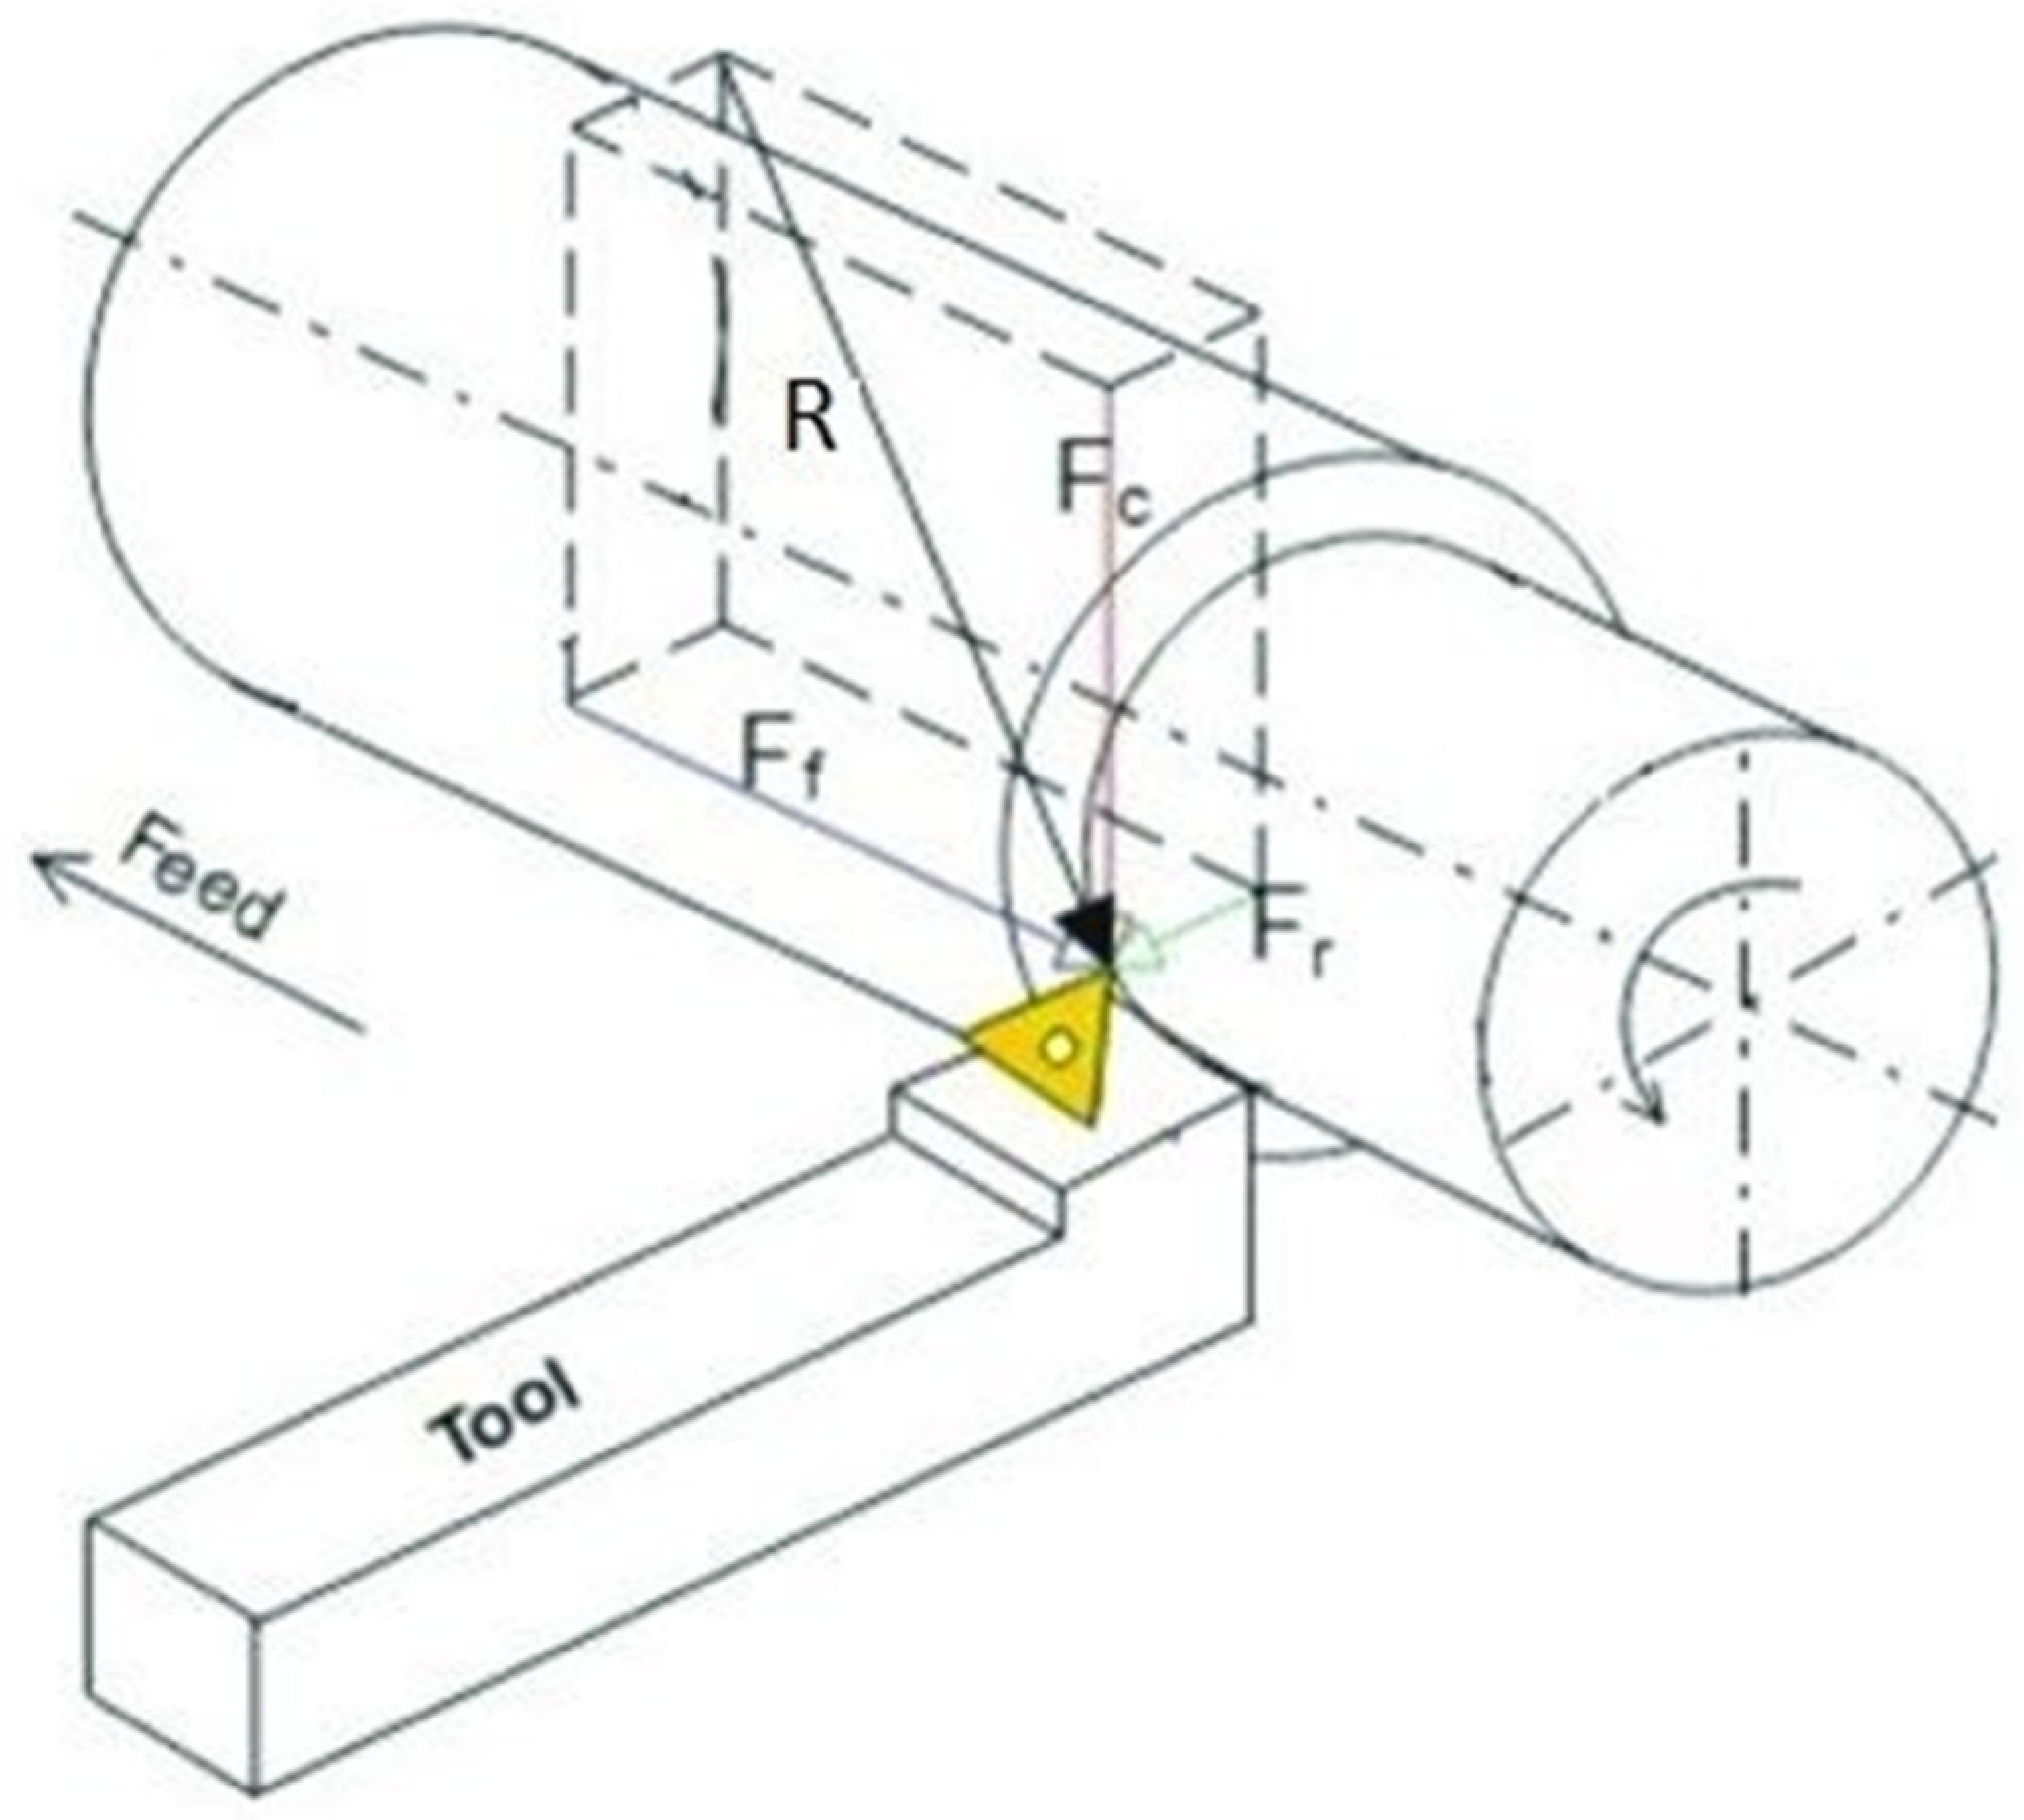
  • For the investigation of Fr, ap had the maximum influence (45.7%), followed by f (21%) and Vc (20.4%). However, in the investigation of Ff, f played a pivotal role (38.3%), preceded by ap (35.7%) and Vc (15.3%). In the calculation of Fc, the ap contribution was 44.57%, followed by f (25.60%) and Vc (18.37%). Due to a p-value less than 0.05 for the interactions of Vc and ap and f and ap, a major contribution to the calculation of Fc was observed during the turning of AISI 1045 steel by the carbide tool (wiper edge geometry). However, in the investigation of Ff, f played a pivotal role. As ‘R’ was the combination of all the forces; thus, all the input parameters and their interactions had an influential effect on the investigation of the reaction (R).
  • For the investigation of MRR, f had the major role (48.18%), followed by ap and Vc with 21.41% each. All the interactions (Vc and ap; Vc and f; ap and f) also had a major contribution to MRR. The values of R2 and Adj-R2 for all the performance measures were greater than 95%, which signified the outperformance of the present work for future outcomes.
  • The VIKOR-based performance index (Vi) suggests the best optimal setting, which was Vc: 160 m/min; ap: 1 mm; f: 0.135 mm/rev. Corresponding to this optimal setting, the Vi value was maximum (0.2883). The value of performance measured Ra, Fr, Ff, Fc, R, temperature and MRR, which were 2.111 µm, 43.85 N, 159.33 N, 288.13 N, 332,16 N, 554.4 °C and 21,600 mm3/min, respectively, corresponding to this setting.
  • The ML approach investigated the correlation between the input process variables and Vi, by which a strong correlation could be observed between Vi and f (0.697), followed by Vi and ap (0.609) and Vi and Vc (−0.086). The proposed approach of Vi-ML could be effectively used for the investigation of parametric optimization and correlation mapping.
In the near future, the proposed approach could be used for the investigation of other responses like other roughness parameters, surface integrity, etc. The other processes, like milling, drilling, welding and other non-traditional processes, could be analyzed using the Vi-ML approach.

Author Contributions

A.T.A., N.S. and A.E.: investigation, conceptualization, methodology, data curation, validation, visualization; M.S.S., M.M.E.R. and R.C.S.: investigation, writing—original draft, writing, conceptualization, supervision, project administration: Review and editing; A.T.A.: funding acquisition. All authors have read and agreed to the published version of the manuscript.

Funding

Grant Number (IFKSUOR3-040-2).

Data Availability Statement

Not applicable.

Acknowledgments

The authors extend their appreciation to the Deputyship for Research and Innovation, Ministry of Education in Saudi Arabia for funding this research work through the project no. (IFKSUOR3–040-2).

Conflicts of Interest

The authors declare that they have no known competing financial interests or personal relationships that could have appeared to influence the work reported in this paper.

References

  1. Ruibin, X.; Wu, H. Study on Cutting Mechanism of Ti6Al4V in Ultra-Precision Machining. Int. J. Adv. Manuf. Technol. 2016, 86, 1311–1317. [Google Scholar] [CrossRef]
  2. Selvam, M.D.; Senthil, P. Investigation on the Effect of Turning Operation on Surface Roughness of Hardened C45 Carbon Steel. Aust. J. Mech. Eng. 2016, 14, 131–137. [Google Scholar] [CrossRef]
  3. Sharma, A.K.; Tiwari, A.K.; Dixit, A.R. Effects of Minimum Quantity Lubrication (MQL) in Machining Processes Using Conventional and Nanofluid Based Cutting Fluids: A Comprehensive Review. J. Clean. Prod. 2016, 127, 1–18. [Google Scholar] [CrossRef]
  4. Leppert, T. Effect of Cooling and Lubrication Conditions on Surface Topography and Turning Process of C45 Steel. Int. J. Mach. Tools Manuf. 2011, 51, 120–126. [Google Scholar] [CrossRef]
  5. Walker, T. The MQL Handbook, A Guide to Machining with Minimum Quantity Lubrication; V1.0.7; 2015; Unist, Inc.: Grand Rapids, MI, USA, 2015. [Google Scholar]
  6. Le Coz, G.; Marinescu, M.; Devillez, A.; Dudzinski, D.; Velnom, L. Measuring Temperature of Rotating Cutting Tools: Application to MQL Drilling and Dry Milling of Aerospace Alloys. Appl. Therm. Eng. 2012, 36, 434–441. [Google Scholar] [CrossRef]
  7. Hamdan, A.; Sarhan, A.; Hamdi, M. An Optimization Method of the Machining Parameters in High-Speed Machining of Stainless Steel Using Coated Carbide Tool for Best Surface Finish. Int. J. Adv. Manuf. Technol. 2012, 58, 81–91. [Google Scholar] [CrossRef]
  8. Kurgin, S.; Dasch, J.M.; Simon, D.L.; Barber, G.C.; Zou, Q. Evaluation of the Convective Heat Transfer Coefficient for Minimum Quantity Lubrication (MQL). Ind. Lubr. Tribol. 2012, 64, 376–386. [Google Scholar] [CrossRef]
  9. Elmunafi, M.H.S.; Kurniawan, D.; Noordin, M.Y. Use of Castor Oil as Cutting Fluid in Machining of Hardened Stainless Steel with Minimum Quantity of Lubricant. Procedia Cirp 2015, 26, 408–411. [Google Scholar] [CrossRef] [Green Version]
  10. Debnath, S.; Reddy, M.M.; Yi, Q.S. Environmental Friendly Cutting Fluids and Cooling Techniques in Machining: A Review. J. Clean. Prod. 2014, 83, 33–47. [Google Scholar] [CrossRef]
  11. Rahim, E.A.; Sasahara, H. An Analysis of Surface Integrity When Drilling Inconel 718 Using Palm Oil and Synthetic Ester under MQL Condition. Mach. Sci. Technol. 2011, 15, 76–90. [Google Scholar] [CrossRef]
  12. Lawal, S.A.; Choudhury, I.A.; Nukman, Y. A Critical Assessment of Lubrication Techniques in Machining Processes: A Case for Minimum Quantity Lubrication Using Vegetable Oil-Based Lubricant. J. Clean. Prod. 2013, 41, 210–221. [Google Scholar] [CrossRef]
  13. Schwarz, M.; Dado, M.; Hnilica, R.; Veverková, D. Environmental and Health Aspects of Metalworking Fluid Use. Polish J. Environ. Stud. 2015, 24, 37–45. [Google Scholar]
  14. Islam, M.N.; Anggono, J.M.; Pramanik, A.; Boswell, B. Effect of Cooling Methods on Dimensional Accuracy and Surface Finish of a Turned Titanium Part. Int. J. Adv. Manuf. Technol. 2013, 69, 2711–2722. [Google Scholar] [CrossRef] [Green Version]
  15. Raynor, P.C.; Kim, S.W.; Bhattacharya, M. Mist Generation from Metalworking Fluids Formulated Using Vegetable Oils. Ann. Occup. Hyg. 2005, 49, 283–293. [Google Scholar]
  16. Davim, J.P. Green Manufacturing Processes and Systems; Springer: Berlin/Heidelberg, Germany, 2013; ISBN 3642337929. [Google Scholar]
  17. Boubekri, N.; Shaikh, V.; Foster, P.R. A Technology Enabler for Green Machining: Minimum Quantity Lubrication (MQL). J. Manuf. Technol. Manag. 2010, 21, 556–566. [Google Scholar] [CrossRef]
  18. Astakhov, V. Ecological Machining: Near-dry Machining. In Machining; Springer: London, UK, 2008. [Google Scholar] [CrossRef]
  19. Selvam, M.D.; Sivaram, N. The Effectiveness of Various Cutting Fluids on the Surface Roughness of AISI 1045 Steel during Turning Operation Using Minimum Quantity Lubrication System. J. Futur. Eng. Technol. 2017, 13, 36–43. [Google Scholar]
  20. Krishnaraj, V.; Krishna, B.H.; Sheikh-Ahmad, J.Y. An Experimental Study on End Milling of Titanium Alloy (Ti-6Al-4V) under Dry and Minimum Quantity Lubrication Conditions. Int. J. Mach. Mach. Mater. 2017, 19, 325–342. [Google Scholar] [CrossRef]
  21. Babu, M.N.; Manimaran, G.; Muthukrishnan, N. Experimental Estimation of Minimum Quantity Lubrication in Turning on AISI 410 Stainless Steel. Int. J. Mach. Mach. Mater. 2017, 19, 522–537. [Google Scholar] [CrossRef]
  22. Chinchanikar, S.; Choudhury, S.K. Comparative Evaluations of Nose Wear Progression and Failure Modes during Hard Turning under Dry and Near-Dry Cutting Conditions. Int. J. Mach. Mach. Mater. 2016, 18, 466–482. [Google Scholar] [CrossRef]
  23. Boswell, B.; Islam, M.N. The Challenge of Adopting Minimal Quantities of Lubrication for End Milling Aluminium. In Proceedings of the IAENG Transactions on Engineering Technologies: Special Volume of the World Congress on Engineering, London, UK, 4–6 July 2012; Springer: Berlin/Heidelberg, Germany, 2013; pp. 713–724. [Google Scholar]
  24. Singh, T.; Singh, P.; Dureja, J.S.; Dogra, M.; Singh, H.; Bhatti, M.S. A Review of near Dry Machining/Minimum Quantity Lubrication Machining of Difficult to Machine Alloys. Int. J. Mach. Mach. Mater. 2016, 18, 213–251. [Google Scholar] [CrossRef]
  25. Nicolo, B. Quality by Design: Taguchi Techniques for Industrial Experimentation; Prentice Hall: Hoboken, NJ, USA, 1995; ISBN 0-13-186362-2. [Google Scholar]
  26. Sivaiah, P.; Chakradhar, D. Performance Improvement of Cryogenic Turning Process during Machining of 17-4 PH Stainless Steel Using Multi Objective Optimization Techniques. Meas. J. Int. Meas. Confed. 2019, 136, 326–336. [Google Scholar] [CrossRef]
  27. Manikandan, N.; Kumanan, S.; Sathiyanarayanan, C. Optimisation of Electrochemical Drilling Process Using Taguchi Method and Regression Analysis. Int. J. Mach. Mach. Mater. 2017, 19, 136–159. [Google Scholar] [CrossRef]
  28. Goel, B.; Singh, S.; Sarepaka, R.G. V Optimisation of Machining Parameters for Single Point Diamond Turning of Chromium Zirconium Copper Alloy C18150 Using Taguchi and Grey Relational Analysis. Int. J. Mach. Mach. Mater. 2017, 19, 95–109. [Google Scholar] [CrossRef]
  29. Bajić, D.; Lela, B.; Živković, D. Modeling of Machined Surface Roughness and Optimization of Cutting Parameters in Face Milling. Metalurgija 2008, 47, 331–334. [Google Scholar]
  30. Yang, J.L.; Chen, J.C. A Systematic Approach for Identifying Optimum Surface Roughness Performance in End-Milling Operations. J. Ind. Technol. 2001, 17, 1–8. [Google Scholar]
  31. Caldeirani Filho, J.; Diniz, A.E. Influence of Cutting Conditions on Tool Life, Tool Wear and Surface Finish in the Face Milling Process. J. Brazilian Soc. Mech. Sci. 2002, 24, 10–14. [Google Scholar] [CrossRef]
  32. Tsao, C.C. Grey–Taguchi Method to Optimize the Milling Parameters of Aluminum Alloy. Int. J. Adv. Manuf. Technol. 2009, 40, 41–48. [Google Scholar] [CrossRef]
  33. Abbas, A.T.; Gupta, M.K.; Soliman, M.S.; Mia, M.; Hegab, H.; Luqman, M.; Pimenov, D.Y. Sustainability Assessment Associated with Surface Roughness and Power Consumption Characteristics in Nanofluid MQL-Assisted Turning of AISI 1045 Steel. Int. J. Adv. Manuf. Technol. 2019, 105, 1311–1327. [Google Scholar] [CrossRef]
  34. Abbas, A.T.; Al-Abduljabbar, A.A.; Alnaser, I.A.; Aly, M.F.; Abdelgaliel, I.H.; Elkaseer, A. A Closer Look at Precision Hard Turning of AISI4340: Multi-Objective Optimization for Simultaneous Low Surface Roughness and High Productivity. Materials 2022, 15, 2106. [Google Scholar] [CrossRef]
  35. Abbas, A.T.; Al-Abduljabbar, A.A.; El Rayes, M.M.; Benyahia, F.; Abdelgaliel, I.H.; Elkaseer, A. Multi-Objective Optimization of Performance Indicators in Turning of AISI 1045 under Dry Cutting Conditions. Metals 2023, 13, 96. [Google Scholar] [CrossRef]
  36. Abbas, A.T.; El Rayes, M.M.; Al-Abduljabbar, A.A.; Ragab, A.E.; Benyahia, F.; Elkaseer, A. Effects of Tool Edge Geometry and Cutting Conditions on the Performance Indicators in Dry Turning AISI 1045 Steel. Machines 2023, 11, 397. [Google Scholar] [CrossRef]
  37. Szwajka, K.; Trzepiecinski, T. On the Machinability of Medium Density Fiberboard by Drilling. BioResources 2018, 13, 8263–8278. [Google Scholar] [CrossRef]
  38. Nur, R.; Yusof, N.M.; Sudin, I.; Nor, F.M.; Kurniawan, D. Determination of Energy Consumption during Turning of Hardened Stainless Steel Using Resultant Cutting Force. Metals 2021, 11, 565. [Google Scholar] [CrossRef]
  39. Szwajka, K.; Zielińska-Szwajka, J.; Trzepiecinski, T. Experimental Study on Drilling MDF with Tools Coated with TiAlN and ZrN. Materials 2019, 12, 386. [Google Scholar] [CrossRef] [Green Version]
  40. Sharma, N.; Gupta, R.D.; Khanna, R.; Sharma, R.C.; Sharma, Y.K. Machining of Ti-6Al-4V Biomedical Alloy by WEDM: Investigation and Optimization of MRR and Rz Using Grey-Harmony Search. World J. Eng. 2021, 20, 221–234. [Google Scholar] [CrossRef]
  41. Abbas, A.T.; Sharma, N.; Alsuhaibani, Z.A.; Sharma, V.S.; Soliman, M.S.; Sharma, R.C. Processing of Al/SiC/Gr Hybrid Composite on EDM by Different Electrode Materials Using RSM-COPRAS Approach. Metals 2023, 13, 1125. [Google Scholar] [CrossRef]
  42. Demir, H.; Gündüz, S. The Effects of Aging on Machinability of 6061 Aluminium Alloy. Mater. Des. 2009, 30, 1480–1483. [Google Scholar] [CrossRef]
  43. Shaw, M.C.; Cookson, J.O. Metal Cutting Principles; Oxford University Press: New York, NY, USA, 2005; Volume 2. [Google Scholar]
  44. Hosseini, A.; Kishawy, H.A. Cutting Tool Materials and Tool Wear. In Machining of Titanium Alloys; Springer: Berlin/Heidelberg, Germany, 2014; pp. 31–56. [Google Scholar] [CrossRef]
  45. Opricovic, S.; Tzeng, G.-H. Compromise Solution by MCDM Methods: A Comparative Analysis of VIKOR and TOPSIS. Eur. J. Oper. Res. 2004, 156, 445–455. [Google Scholar] [CrossRef]
  46. Gul, M.; Celik, E.; Aydin, N.; Gumus, A.T.; Guneri, A.F. A State of the Art Literature Review of VIKOR and Its Fuzzy Extensions on Applications. Appl. Soft Comput. 2016, 46, 60–89. [Google Scholar] [CrossRef]
  47. Khan, A.; Maity, K.P. A novel MCDM approach for simultaneous optimization of some correlated machining parameters in turning of CP-titanium grade 2. Int. J. Eng. Res. Africa 2016, 22, 94–111. [Google Scholar] [CrossRef]
  48. Sharma, N.; Ahuja, N.; Goyal, R.; Rohilla, V. Parametric optimization of EDD using RSM-Grey-TLBO-based MCDM approach for commercially pure titanium. Grey Sys.: Theory Appl. 2020, 10, 231–245. [Google Scholar] [CrossRef]
  49. Shahali, H.; Yazdi, M.R.S.; Mohammadi, A.; Iimanian, E. Optimization of Surface Roughness and Thickness of White Layer in Wire Electrical Discharge Machining of DIN 1.4542 Stainless Steel Using Micro-Genetic Algorithm and Signal to Noise Ratio Techniques. Proc. Inst. Mech. Eng. Part B J. Eng. Manuf. 2012, 226, 803–812. [Google Scholar] [CrossRef]
  50. Vendan, S.A.; Kamal, R.; Karan, A.; Gao, L.; Niu, X.; Garg, A. Welding and Cutting Case Studies with Supervised Machine Learning; Springer: Berlin/Heidelberg, Germany, 2020; Volume 1, ISBN 9811393818. [Google Scholar]
  51. Bisaria, H.; Shandilya, P. Wire Electric Discharge Machining Induced Surface Integrity for Ni55. 95Ti44. 05 Shape Memory Alloy. Proc. Inst. Mech. Eng. Part E J. Process Mech. Eng. 2021, 235, 178–185. [Google Scholar] [CrossRef]
  52. Kumar, A.; Sharma, R.; Gupta, A.K. Experimental Investigation of WEDM Process through Integrated Desirability and Machine Learning Technique on Implant Material. J. Mech. Behav. Mater. 2021, 30, 38–48. [Google Scholar] [CrossRef]
Figure 1. (a) Microstructure of AISI 1045 steel; Microscopic image of (b) Normal (c) Wiper geometry Carbide Tool inserts [36].
Machines 11 00719 g001
Figure 3. Process flow in the current research.
Machines 11 00719 g003
Figure 4. Experimental results of 27 experimental tests for (a) Ra (b) Fr, Ff, Fc and R (c) Temp (d) MRR.
Machines 11 00719 g004
Figure 5. Variation in performance measures with respect to process parameters (a) Forces versus Vc (b) Forces versus ap (c) Forces versus f (d) Variation in Ra with respect to input parameters (e) Variation in temperature with respect to input parameters (f) Variation in MRR with respect to input parameters.
Machines 11 00719 g005aMachines 11 00719 g005bMachines 11 00719 g005c
Figure 6. Correlation mapping between process parameters and Vi.
Machines 11 00719 g006
Figure 7. Correlation plot between process parameters and Vi.
Machines 11 00719 g007
Table 1. Compositions (Chemical) and mechanical characteristics for AISI 1045 [35].
Element SPMnCFe
Percentage %0.040.030.650.45Balance
CharacteristicsValue
Hardness, Vickers170
Young’s Elasticity200 GPa
Reduction in Area40%
Tensile Strength, Yield310 MPa
Tensile Strength, Ultimate565 MPa
Elongation at Break (in 50 mm)16%
Table 2. Statistical analysis and ANOVA for various responses.
SourceDFRaFrFfFc
pcp *F *p *pcpFppcpFppcpFp
Vc218.983.39020.455.96015.397.48018.38107.70
ap214.463.72045.7125.15035.7226.92044.58261.30
f256.8250.202157.53038.3243.12025.6150.10
Vc * ap43.337.320.0098.0911.080.0025.9418.8406.8820.170
Vc * f42.86.160.0141.21.630.2571.625.140.0241.143.330.069
ap * f42.715.960.0162.122.90.0932.357.460.0082.748.040.007
Residual Error80.91R2 = 99.09R2 (adj) = 97.051.46R2 = 98.54R2 (adj) = 95.250.63R2 = 99.37R2 (adj) = 99.950.68R2 = 99.32R2 (adj) = 97.78
Total26100100100 100
SourceDFRTempMRR
pcpFppcpFppcpFp
Vc217.9133.9053.242.85021.43240
ap242.7320.1011.29.070.00921.43240
f228.1210.8015.912.850.00348.17290
Vc * ap46.7525.25011.74.710.031.58120.002
Vc * f41.24.510.0342.811.130.4073.56270
ap * f42.639.850.0040.110.050.9953.56270
Residual Error80.54R2 = 99.47R2 (adj) = 98.264.96R2 = 95.03R2 (adj) = 83.860.26R2 = 99.74R2 (adj) = 99.14
Total26100100100
* pcp: Percentage Contribution; * F: F-value; * p: p-value.
Table 3. Weighted normalization of responses and the calculation of Vi.
Test No. W Normalized MRRW Normalized RaNormalized FcNormalized FrNormalized FfNormalized RNormalized TempPi
10.00520.00590.00970.00690.01200.01030.02360.0735
20.01030.00970.01220.01130.01520.01290.02500.0967
30.01550.01980.02050.01860.02400.02130.02530.1450
40.00770.00730.03320.03420.03020.03250.02570.1709
50.01550.01220.03680.03950.03350.03610.02590.1996
60.02320.02790.04760.05030.04560.04720.02690.2687
70.01030.00850.03080.03180.03000.03060.02640.1685
80.02060.01460.03700.03830.03240.03600.02660.2055
90.03100.03040.05040.05130.04950.05020.02670.2896
100.00770.00720.00960.00570.01230.01030.02600.0789
110.01550.01290.01210.00990.01400.01260.02660.1035
120.02320.02700.02310.02490.02580.02380.02700.1747
130.01160.01040.02170.01910.01920.02110.02600.1290
140.02320.02640.02700.02860.02840.02740.02740.1884
150.03480.04050.03290.03000.03680.03380.02720.2362
160.01550.01320.01720.01930.01760.01730.02590.1260
170.03100.02460.02230.02500.02220.02230.02600.1734
180.04640.04340.04230.03960.03920.04150.02680.2792
190.01030.00830.00880.00800.01130.00940.02690.0831
200.02060.01490.01100.00900.01460.01190.02720.1094
210.03100.03190.01430.01130.01950.01560.02870.1523
220.01550.01380.01810.01590.01990.01850.02730.1290
230.03100.03610.01890.02120.02160.01960.02770.1761
240.04640.05170.02640.02230.02770.02660.02880.2300
250.02060.02400.01780.01460.01680.01750.02760.1391
260.04130.03190.02230.02200.02230.02230.03000.1922
270.06190.06130.03340.03370.03350.03340.03120.2883
Disclaimer/Publisher’s Note: The statements, opinions and data contained in all publications are solely those of the individual author(s) and contributor(s) and not of MDPI and/or the editor(s). MDPI and/or the editor(s) disclaim responsibility for any injury to people or property resulting from any ideas, methods, instructions or products referred to in the content.

