Review

Intelligent Approaches for Anomaly Detection in Compressed Air Systems: A Systematic Review

1
Department of Industrial and Manufacturing Engineering, Faculty of Engineering, University of Malta, MSD 2080 Msida, Malta
2
Department of Computer Information Systems, Faculty of Information and Communication Technology University of Malta, MSD 2080 Msida, Malta
*
Author to whom correspondence should be addressed.
Machines 2023, 11(7), 750; https://doi.org/10.3390/machines11070750
Submission received: 30 May 2023 / Revised: 7 July 2023 / Accepted: 11 July 2023 / Published: 18 July 2023
(This article belongs to the Special Issue Assessing New Trends in Sustainable and Smart Manufacturing)

Abstract

:
Inefficiencies within compressed air systems (CASs) call for the integration of Industry 4.0 technologies for financially viable and sustainable operations. A systematic literature review of intelligent approaches within CASs was carried out, in which the research methodology was based on the PRISMA guidelines. The search was carried out on 1 November 2022 within two databases: Scopus and Web of Science. The research methodology resulted in 37 papers eligible for a qualitative and bibliometric analysis based on a set of research questions. These aimed to identify specific characteristics of the selected publications. Thus, the review performed a comprehensive analysis on mathematical approaches, multiple machine learning (ML) methods, the implementation of neural networks (NNs), the development of time-series techniques, comparative analysis, and hybrid techniques. This systematic literature review allowed the comparison of these approaches, while widening the perspective on how such methods can be implemented within CASs for a more intelligent approach. Any limitations or challenges faced were mitigated through an unbiased procedure of involving multiple databases, search terms, and researchers. Therefore, this systematic review resulted in discussions and implications for the definition of future implementations of intelligent approaches that could result in sustainable CASs.

1. Introduction

In the past decade, significant advancements were predominant as a result of the advances brought about by Industry 4.0. This is relevant for a broad range of applications in multiple industries. One of the main drivers of these changes is the increasing need to be continuously aware of the behaviour of complex systems, to detect anomalies in real time, and if possible, to predict evolving phenomena. In this specific context, an anomaly is understood as a deviation from a standard process or operation, which could result in unnecessary faults, outputs, and negative consequences on different aspects of a system [1]. By gaining knowledge about system anomalies, one can responsibly plan and amend faults to minimise breakdowns and stoppages, in turn avoiding a negative impact on financial and environmental resources and hence minimising unsustainable practices [2].
Compressed air (CA) is frequently considered the fourth industrial utility, following water, electric energy, and natural gas, and hence requires a high percentage of the world’s industrial energy consumption [3]. These systems are characterised by significant faults and anomalies and are known to be very expensive and inefficient to operate [4]. Apart from inefficiencies depending on component selection and design issues, such as oversizing a compressor, a CAS generation plant can only convert 10% to 15% of input energy to productive use. Simultaneously, anomalies within the demand side are prevalent. This results in only 50% of the supplied energy being converted to actual work [3]. Anomalies and losses could possibly result from loose fittings and leaks, inappropriate use of pneumatic components, and damages that result in artificial demand, among many other possible reasons. From the possible CA inefficiencies, leaks are the main issue, as these could result in up to 25% to 40% losses from the available supply [4].
The need for investigating intelligent approaches for CASs is therefore growing. One manner through which this can be achieved is with the implementation of artificial intelligence (AI) and machine learning (ML) techniques for continuous monitoring of anomalies in such systems. This can result in downtime being minimised and an increased production output due to better cycle time management. In general, enhancing such systems can result in better financial and sustainable outcomes [5,6].

1.1. Systematic Reviews on the Use of AI and ML in Engineering

Within the field of engineering, other review papers have attempted to address the use of AI, ML, and deep learning (DL) methods for automated product or process quality, mechanical system diagnosis and prognosis, and the robustness and capabilities of the developed models. In Jieyang et al.’s [7] review, it was discussed how the main focus for AI-based fault diagnosis is on mechanical and rotary components, primarily bearings and gearboxes, along with additive manufacturing systems, such as 3D printing. It is argued that the main sensory equipment used is vibration-based, which is then fed to DL techniques such as a convolutional neural network (CNN), auto encoder (AE) and recurrent neural network (RNN) [7]. Similarly, Kim et al. [8] carried out a survey of DL for a selected range of manufacturing sectors, which included sensor fusion techniques for environmental perception and localisation.
Additionally, Nti et al.’s [9] review presents a more generalised overview of how AI is being applied to engineering and manufacturing, mainly within processes, and not complex systems. Similarly to [7], Fernandes et al. [10] focused on fault diagnosis and prognosis of mechanical components for real industrial manufacturing equipment, but in this case concentrated on supervised and unsupervised ML techniques. The concept of resource efficiency in manufacturing reviewed by Waltersmann et al. [11] complements the previous studies, as well as the review performed by Angelopoulos et al. [12]. These demonstrate the research efforts to find AI and ML solutions within manufacturing processes, products, and systems [11,12]. Similarly, Cinar et al. [13] focused on ML techniques developed for smart manufacturing as a solution for enhancing sustainability within smart manufacturing systems.
Another intelligent approach being investigated is the concept of AI anomaly detection techniques for a health management system based on diagnostics and prognosis. Such an approach defines the current status of a system or component from its original operation conditions, as was observed in the reviews by Shin et al. [14] and Khan et al. [15]. Yu et al. [16] and Liu et al. [17] reviewed the implementation of DL and data-driven approaches for complex systems. Yu et al. [16] presented a timeline of how AI and ML progressed to DL techniques due to increasing complexity. Similarly to [18], Liu et al. [17] investigated intelligent approaches for multi-station assembly systems in manufacturing to detect and diagnose faults for variation reduction, which could result in process and product quality improvement. These studies show that AI and ML approaches are well investigated in the engineering and manufacturing research field.

1.2. Research Motivation

This preliminary analysis shows how a systematic review of the use of intelligent techniques for anomaly detection in CASs is missing, where such systems are not mentioned within the scope of the selected review papers. Thus, this systematic review is called for, as it focuses on intelligent methods, mainly AI and ML approaches, for the detection of anomalies within CASs. A CAS contributes to a large percentage of a manufacturing organisation’s financial and resource requirements [3]. This further justifies the need for this systematic literature review paper. Additionally, only [11,13] have identified the beneficial effect of anomaly detection techniques on sustainability. However, these focused on resource efficiency within production systems and machinery, and not specifically on CASs. This is of particular interest, especially considering the research direction towards smart and sustainable production, the Sustainable Development Goals (SDGs) and the green transition as part of the Industry 5.0 approach [19].
Therefore, this review paper presents the current state of the art for the detection of anomalies based on intelligent approaches within CASs, as implemented in a number of industries. A comprehensive overview of the available literature from 2012 to 2022 is carried out through a systematic literature review process based on the Preferred Reporting Items for Systematic Reviews and Meta-Analyses (PRISMA) protocol [20]. A set of relevant publications was selected, and the main criteria, based on four research questions (RQs), were extracted from each to show how the AI and ML techniques were adopted within the chosen focus subject. Hence, this paper aims to investigate ‘the where’ and ‘the how’ of the main approaches adopted for the selected intelligent approach developments within the CA case studies. Additionally, this systematic review recognises opportunities for the development of an intelligent approach by identifying the previous challenges and the resulting research gap from the selected group of publications.
The outline of this paper is as follows. Section 2 presents a brief description of CA theory, Internet of Things (IoT) approaches and big-data analysis, along with a discussion on conventional methods and AI and ML techniques. Section 3 provides a detailed description of the formulated research questions, along with the methodology adopted for the systematic literature review based on the PRISMA protocol, followed by the selection of the necessary publications. Section 4 comprises a critical review of the selected publications based on the formulated RQs, while Section 5 presents the study outcomes through a bibliometric analysis. Finally, Section 6 concludes with a summary of the findings and limitations faced, while providing possible future developments based on the resulting research gap.

2. Background Theory

2.1. CASs

A CAS consists of two subsystems, which are the supply side and the demand side. The former includes the compressor and the required air treatment components, while the latter is the distribution of the produced CA, storage elements such as pressure vessels, and the end-use equipment. CASs can range from just a small compressor to supply a couple of end-use equipment, such as air guns, to large systems in industrial plants. Typically, in manufacturing environments, compressors are rated at a maximum pressure of 10 bar, operating at 6 to 8 bar taking into consideration the pressure drops and possible faults within the distribution network. Hence, it can be deduced that to produce and supply CA, a significant amount of electricity is consumed. A well-managed CAS will result in a clean, dry and stable CA supply delivered at the required pressure, resulting in a cost-effective and sustainable operation [3].

2.2. The Industry 4.0 Approach

The fourth industrial revolution is bringing forward great advancements in how businesses operate through the continuous collection of data from the automation of processes and manufacturing. The use of the term ‘smart’ systems was made possible due to the integration of sensors and embedded software for data acquisition, monitoring, and control. IoT protocols for data transfer and communication, along with edge and cloud computing, enhanced any business environment to higher levels of operation [5,21,22].
As discussed by Vaidya et al. [23], big data and analytics constitute the main pillars of Industry 4.0. Sensor integration within any system results in the acquisition of large amounts of data, which can be continuously monitored and analysed in real time, making it possible for further decision-making. Thus, analysis of historical big data enhances knowledge on threats of the system that occurred previously and can provide further guidance for future challenges while aiding in predicting possible issues [5,22,23]. Such an approach was investigated in [24], where an architecture was designed for secure production machinery monitoring. Additionally, Vaidya et al. [23] mentioned the Industrial Internet of Things (IIOT) as another pillar of Industry 4.0. The IIoT consists of the implementation of a network of interconnected elements that communicate via a selected standard protocol(s) [5].
Therefore, Industry 4.0 is driving business in implementing increased autonomous operations through the use of technology such as IIoT devices that shape smart environments, while replacing user inspections through a manual procedure with AI techniques. Ultimately, intelligent approaches save time and money while detecting deviations, or in this context, anomalies of large and complex systems, which in return reduce repair expenses and maintenance downtime [21,25,26].

2.3. The Solution—AI

Efficient data monitoring and analysis in real time can be achieved with the development of AI and ML techniques [2,25,27]. Nti et al. [9] provides an in-depth taxonomy of the most widely used algorithms found in the literature for AI implementations in engineering and manufacturing. The main categories for ML are supervised, unsupervised, and semi-supervised approaches, along with reinforcement learning. The main difference between supervised and unsupervised approaches is in the dataset being analysed, where for a supervised learning algorithm, the dataset is labelled [9]. On the other hand, reinforcement learning is one of the emerging subfields of ML [28], as it investigates any system that can be represented by an agent that interacts with a dynamic environment by taking different actions to maximise a cumulative award.
Replacing model-based techniques and conventional methods, which are characterised by mathematical equations and their respective assumptions, with intelligent approaches by means of various AI and ML algorithms makes it possible not only to understand system behaviour but also predict future outcomes [2,26]. Thus, integrating such an approach with a CAS makes it easier to monitor system behaviour in real time while successfully detecting anomalies with the acquisition of the correct data and fault detection system, which can be based on AI and ML. This will result in effective management of the CAS as a whole by repairing any detected anomalies without the need for sizeable interventions, long downtime, and high maintenance costs.

3. Systematic Literature Review Methodology

This systematic literature review was conducted according to the PRISMA statement and protocol. Although this protocol was originally developed and is used within healthcare publications, the use of it within the engineering and data science research areas is increasing, as seen in [10,11,13,29,30,31,32]. This protocol was chosen as it provides guidance in determining the relevant publications within the determined research area. As discussed in previous sections, this review paper is required, as currently there is no systematic literature review and analysis that specifically clarifies the available state of the art regarding anomaly detection techniques based on intelligent approaches that use AI techniques for CASs. The following sections describe the process involved in determining a suitable set of RQs, defining a search strategy based on the chosen search terms and information sources, the definition of the inclusion and exclusion criteria, and the setting up of a data extraction strategy.

3.1. The Research Questions

The formulation of the RQs, presented in Table 1, defined the boundaries for this systematic literature review. The first RQ defines the environments/industries in which an intelligent approach for anomaly detection in CAS have been implemented. Answering this question will lead towards identifying if the application is within the manufacturing industry or not, and if in the affirmative, to identify the specific sector. This will also highlight how diverse CA installations are across a broad range of applications. Furthermore, any applications within specific systems and machines will feature in the PRISMA-based selected publications. The second RQ aims at understanding how the CAS anomaly is being detected. Specifically, it will support the identification of the type of data being collected and if it is based on energy consumption or parameter-based data from various sensor types deployed within the CAS.
The third and fourth RQs were set to define the procedure and type of AI and ML techniques implemented. The third RQ aims at identifying the type of data preprocessing implemented, how and from where the dataset was generated, and includes any additional intelligent methods implemented for data storage and communication. Finally, the last RQ deals with determining the AI approach(es) selected or developed for the anomaly detection technique of a CAS within the chosen application and respective industry. Thus, this question will show the aspects of AI that have been implemented within the scope of this systematic literature review, whether hybrid approaches are being explored, and whether there are any knowledge-based implementations being investigated.

3.2. Search Strategy

The following two sections present the devised search strategy to select the most relevant published literature within the scope of this systematic literature review.

3.2.1. Information Sources

Two of the main academic databases were selected as sources of information, being Web of Science and Scopus. This selection was intended to combine the benefits of both databases, and was based on other publications that implement a similar selection within engineering research groups [9,11,29,30,31,32]. Apart from Scopus being owned by Elsevier and Web of Science by Clarivate, these databases offer a broad range of research publications.

3.2.2. Search String

The formulated search string included the Boolean operators ‘AND’ and ‘OR’ and consisted of four main elements. Only the content within the title, abstract and keywords were to be searched when initiating the generated search string. In this case, the search needed to be specific to CA applications, and hence it was mandatory that the terms ‘compressed air’ or ‘pneumatic’ feature in the mentioned elements. Another important aspect was the anomaly type, and hence the second part of the search string includes the possible aspects of anomalies within the CA applications. Thus, both ‘leak’ and ‘fault’ were included, along with the choice of having ‘energy consumption’ and ‘abnormal’.
The third and fourth parts of the search string aim for various anomaly detection techniques. The former specifies the type of anomaly detection effort, such as classification, identification and diagnosis. The latter comprises the possible approaches for anomaly detection being implemented. Therefore, it includes possible AI and ML keywords, such as NNs and different learning types, along with time series terms as well as conventional mathematical techniques. For clarity, Figure 1 shows the four main elements of the generated search term.

3.2.3. Eligibility Criteria

Typically, systematic literature reviews have both inclusive and exclusive criteria. For this review, it was important to include all publications that feature an anomaly detection technique, preferably with an intelligent approach within the CA industry. On the other hand, Table 2 shows a set of exclusion criteria for this systematic literature review. These were selected to filter directly irrelevant and unwanted publications. This process included the selection of publications from 2012 to the present day. This research period was selected based on the increasing trend from 2017 onwards, especially the number of publications within the selected research area that used intelligent techniques. This was followed by the removal of any duplicate publications found in both information sources and those not written in English. Any publication that could not be accessed online and was neither a book chapter, conference paper, nor journal article was eliminated.

4. Results and Critical Review of the PRISMA-Included Publications

4.1. The PRISMA Outcome Results

The PRISMA protocol, as shown by the flowchart in Figure 2, resulted in a sample of 37 papers for the analysis of anomaly detection techniques using intelligent approaches within CASs. The search was carried out on 1 November 2022. Initially, the search string resulted in 556 publications as a total of Web of Science and Scopus results. Before screening, EC1 was applied and 149 duplicates were removed from the samples. The identification stage resulted in 407 publications ready for the screening process. Any publication that fell within EC2, EC3, and EC5 was removed, resulting in 120 publications. The title, abstract, keywords, and publication details were reviewed to select which would be subjected to a full-text read and analysis, resulting in 66 papers. A total of 29 papers were removed as per EC4. A full-text read was carried out by two researchers to eliminate bias, and resulted in 37 papers being selected to for this systematic literature review, as they were in line with all the inclusion and exclusion criteria.

4.2. Study Characteristics and Discussion

In this section, a discussion on general results is provided, along with an in-depth description and categorisation for the formulated RQ results. Such a categorisation makes it easier to analyse the included studies and obtain a clear systematic literature review. Results are summarised in tables and through visualisation techniques for better clarification regarding study statistics.

4.2.1. A General Overview of the PRISMA-Included Publications

Of the 37 publications, 10 are conference papers, 9 part of conference proceedings, and the other 18 journal articles. Another point to consider is the annual scientific production within this research area, plotted with the ‘bibliometrix’ R-tool [33], as seen in Figure 3, where 2019 was the most productive year. Along the years, there is an upward trend that shows that studies within this research area increased. This demonstrates that the chosen range of publications is appropriate to show the trend of emerging technology and developments for CAS anomaly detection techniques.
Another significant element in showing the appropriate selection of publications through the PRISMA protocol is the result of the most relevant keywords plot, as shown in Figure 4. This was also extracted by the bibliometrix R-package tool [33]. In this case, the most relevant one is ‘fault detection’, followed by ‘energy efficiency’, ‘machine learning’, ‘compressed air systems’ and ‘fault diagnosis’. This proves that the resulting set of publications are within the scope of the systematic literature review and can be used to identify specific research trends within the scope of these keywords.

4.2.2. RQ1—Area of Application

The included publications within this systematic literature review comprised three main research areas of application. These were the aeronautical, the locomotive and the manufacturing industries, as can be seen in Figure 5 and Table 3.
The two publications within the aeronautical research area focus their investigation at the component level, where Assis Silva et al. [34] choose to focus on the estimation of degradation level for a pneumatic system valve, known as a pressure-regulating and shutoff valve (PRSOV). On the other hand, Graves et al. [35] implement a spectral analysis for aircraft pneumatic actuator failures. Locomotive vehicles are equipped with a CAS to actuate system components, such as the braking system and the pneumatically operated doors [36]. In this case, both Wang et al. [37] and Liu et al. [38] carried out an investigation for anomaly detection of the air brakes subsystem. Similarly, Sun et al. [39] implemented an anomaly detection technique based on intelligent approaches; however, this research focused on actual air leakage detection for the pneumatically actuated train doors. It is also interesting to note that the automotive industry was not mentioned in any of these studies. This is somewhat surprising, since commercial vehicles such as trucks and buses make use of compressed air to actuate various systems, such as brakes, doors, and active suspension.
It is also clear that the majority of the PRISMA-included publications are within the manufacturing industry. This research shows the vast applications of CA within such an industry, along with the need for anomaly detection techniques for such complex systems. This helps the manufacturing stakeholders in maintaining operational costs while minimising unsustainable consequences. The included publications range from the component level, to a machine level and with significant efforts directed at the system level, as seen in Figure 6, since nearly half (47%) of the publications deal with this area.
For component-level research, the main areas were pneumatic control valves and pneumatic actuators, along with the Development and Application of Methods for Actuator Diagnosis in Industrial Control Systems (DAMADICS) applications. DAMADICS is a benchmark developed by multiple universities for evaluation, contrast, and comparison regarding standard performance criteria based on industry requirements for an industrial pneumatic actuator within a Polish manufacturing site producing sugar [40]. Anomaly detection techniques based on the behaviour of a pneumatic control valve were investigated by Venkata et al. [41], Yerra et al. [42], and Subbaraj and Kannapiran [43], where although these research teams chose the DAMADICS component, they implemented a different anomaly detection approach. Additionally, Kovács et al. [44,45] implemented a monitoring system for a pneumatic actuator and subsequently applied an ML technique. Additionally, DAMADICS applications were explored by Andrade et al. [46], Han et al. [47], Mahalingam et al. [48], Elakkiya et al. [49], and Korablev et al. [50], where they focused on a simulation monitoring process and analysis for an industrial control system, in this case being a pneumatic actuator.
Table 3. RQ1 results—areas of application.
Area of ApplicationResearch FocusStudies
AeronauticalPRSOV[34]
Pneumatic Actuator[35]
LocomotiveBraking System[37,38]
Door System[39]
ManufacturingComponent LevelPneumatic Control Valves[41,42,43]
Pneumatic Actuators[44,45]
DAMADICS[46,47,48,49,50]
Machine LevelProduction Machines[51,52,53,54,55,56,57]
System LevelSupply Side[58,59,60,61,62,63,64,65,66]
Demand-Side[67,68,69,70]
As One System[71,72]
As for machine-level research, the included publications focused on a production machine that has multiple pneumatically actuated components. Both Dobossy et al. [51] and Rajashekarappa et al. [52] focused on fault detection for a typical manufacturing production machine. Similarly, Cupek et al. [53,54] and Demetgul et al. [55,56,57] investigated anomaly detection techniques on mass-customised production systems involving material handling and sequential operations. As already mentioned, the main research focus within the manufacturing environment is on the CAS itself, where this comprises both supply and demand sides.
This was also prevalent in the included publications, where the majority focused on the supply side, as can be seen in Table 3. This means that the research carried out by [58,59,60,61,62,63,64,65,66] focused on supply-side behaviour, any faults that can occur, and how to detect them through an anomaly detection approach based on AI or ML. For the demand side, Desmet et al. [67], Cupek et al. [68], Liao et al. [69], and Santos et al. [70] implemented an approach to detect anomalies in the CA distribution system, such as pipelines and end-point devices. Moreover, both Thabet et al. [71] and Liu et al. [72] implemented an anomaly detection approach that considered the CAS as a whole, rather than two separable elements.

4.2.3. RQ2—Anomaly Detection Concept

The second RQ aims at identifying the underlying anomaly detection approach being adopted, which in this case identifies whether it is based on parametric data behaviour, such as system pressure and reed switch signal recording, or derived from the system’s energy consumption values. These are fundamentally different approaches, both in terms of the data being collected as well as how these data are analysed. Figure 7 shows a pie chart of the results obtained, while Table 4 shows the included studies divided within the two mentioned sections.
As for the parametric-based research, various types of sensors are used as the main data sources. These included airflow and pressure sensors [52,65], reed switch signals for cycle time manipulation [53], and accelerometers for vibration analysis [41,58], among others. On the other hand, the study performed by Cupek et al. [68] focuses on the energy consumption of one endpoint device. However, Cupek et al. [53,54] published another two research studies focusing on energy consumption profiles for a mass-customised manufacturing CA system. It can be deduced that [68] was carried out as preliminary research for the following two, which involved both an energy consumption-based and parametric-based data collection. Additionally, the research team of Bonfa, Benedetti, and Santolamazza et al. [61,62,63,64] focused on the energy consumption of a multiple compressor system to detect anomaly patterns in its operational behaviour. Similarly, Thabet et al. [71] detected anomalies by correlating sensor values with energy consumption behaviour for the chosen CAS.

4.2.4. RQ3—CAS Dataset Generation and Preparation

The third RQ aims to identify how the data in the various literature sources being reviewed are generated and processed for the subsequent anomaly detection techniques based on intelligent approaches. A common trait across the included publications is the involvement of both a normal fault-free operation and a single or multiple faulty condition operation. This is required for the training, testing and validation of the developed anomaly detection model. Not all the reviewed studies performed the data preparation step, and those that did based their application on the selected anomaly detection technique. Therefore, this section will discuss the dataset generation and the consequent data processing implemented.

Dataset Generation

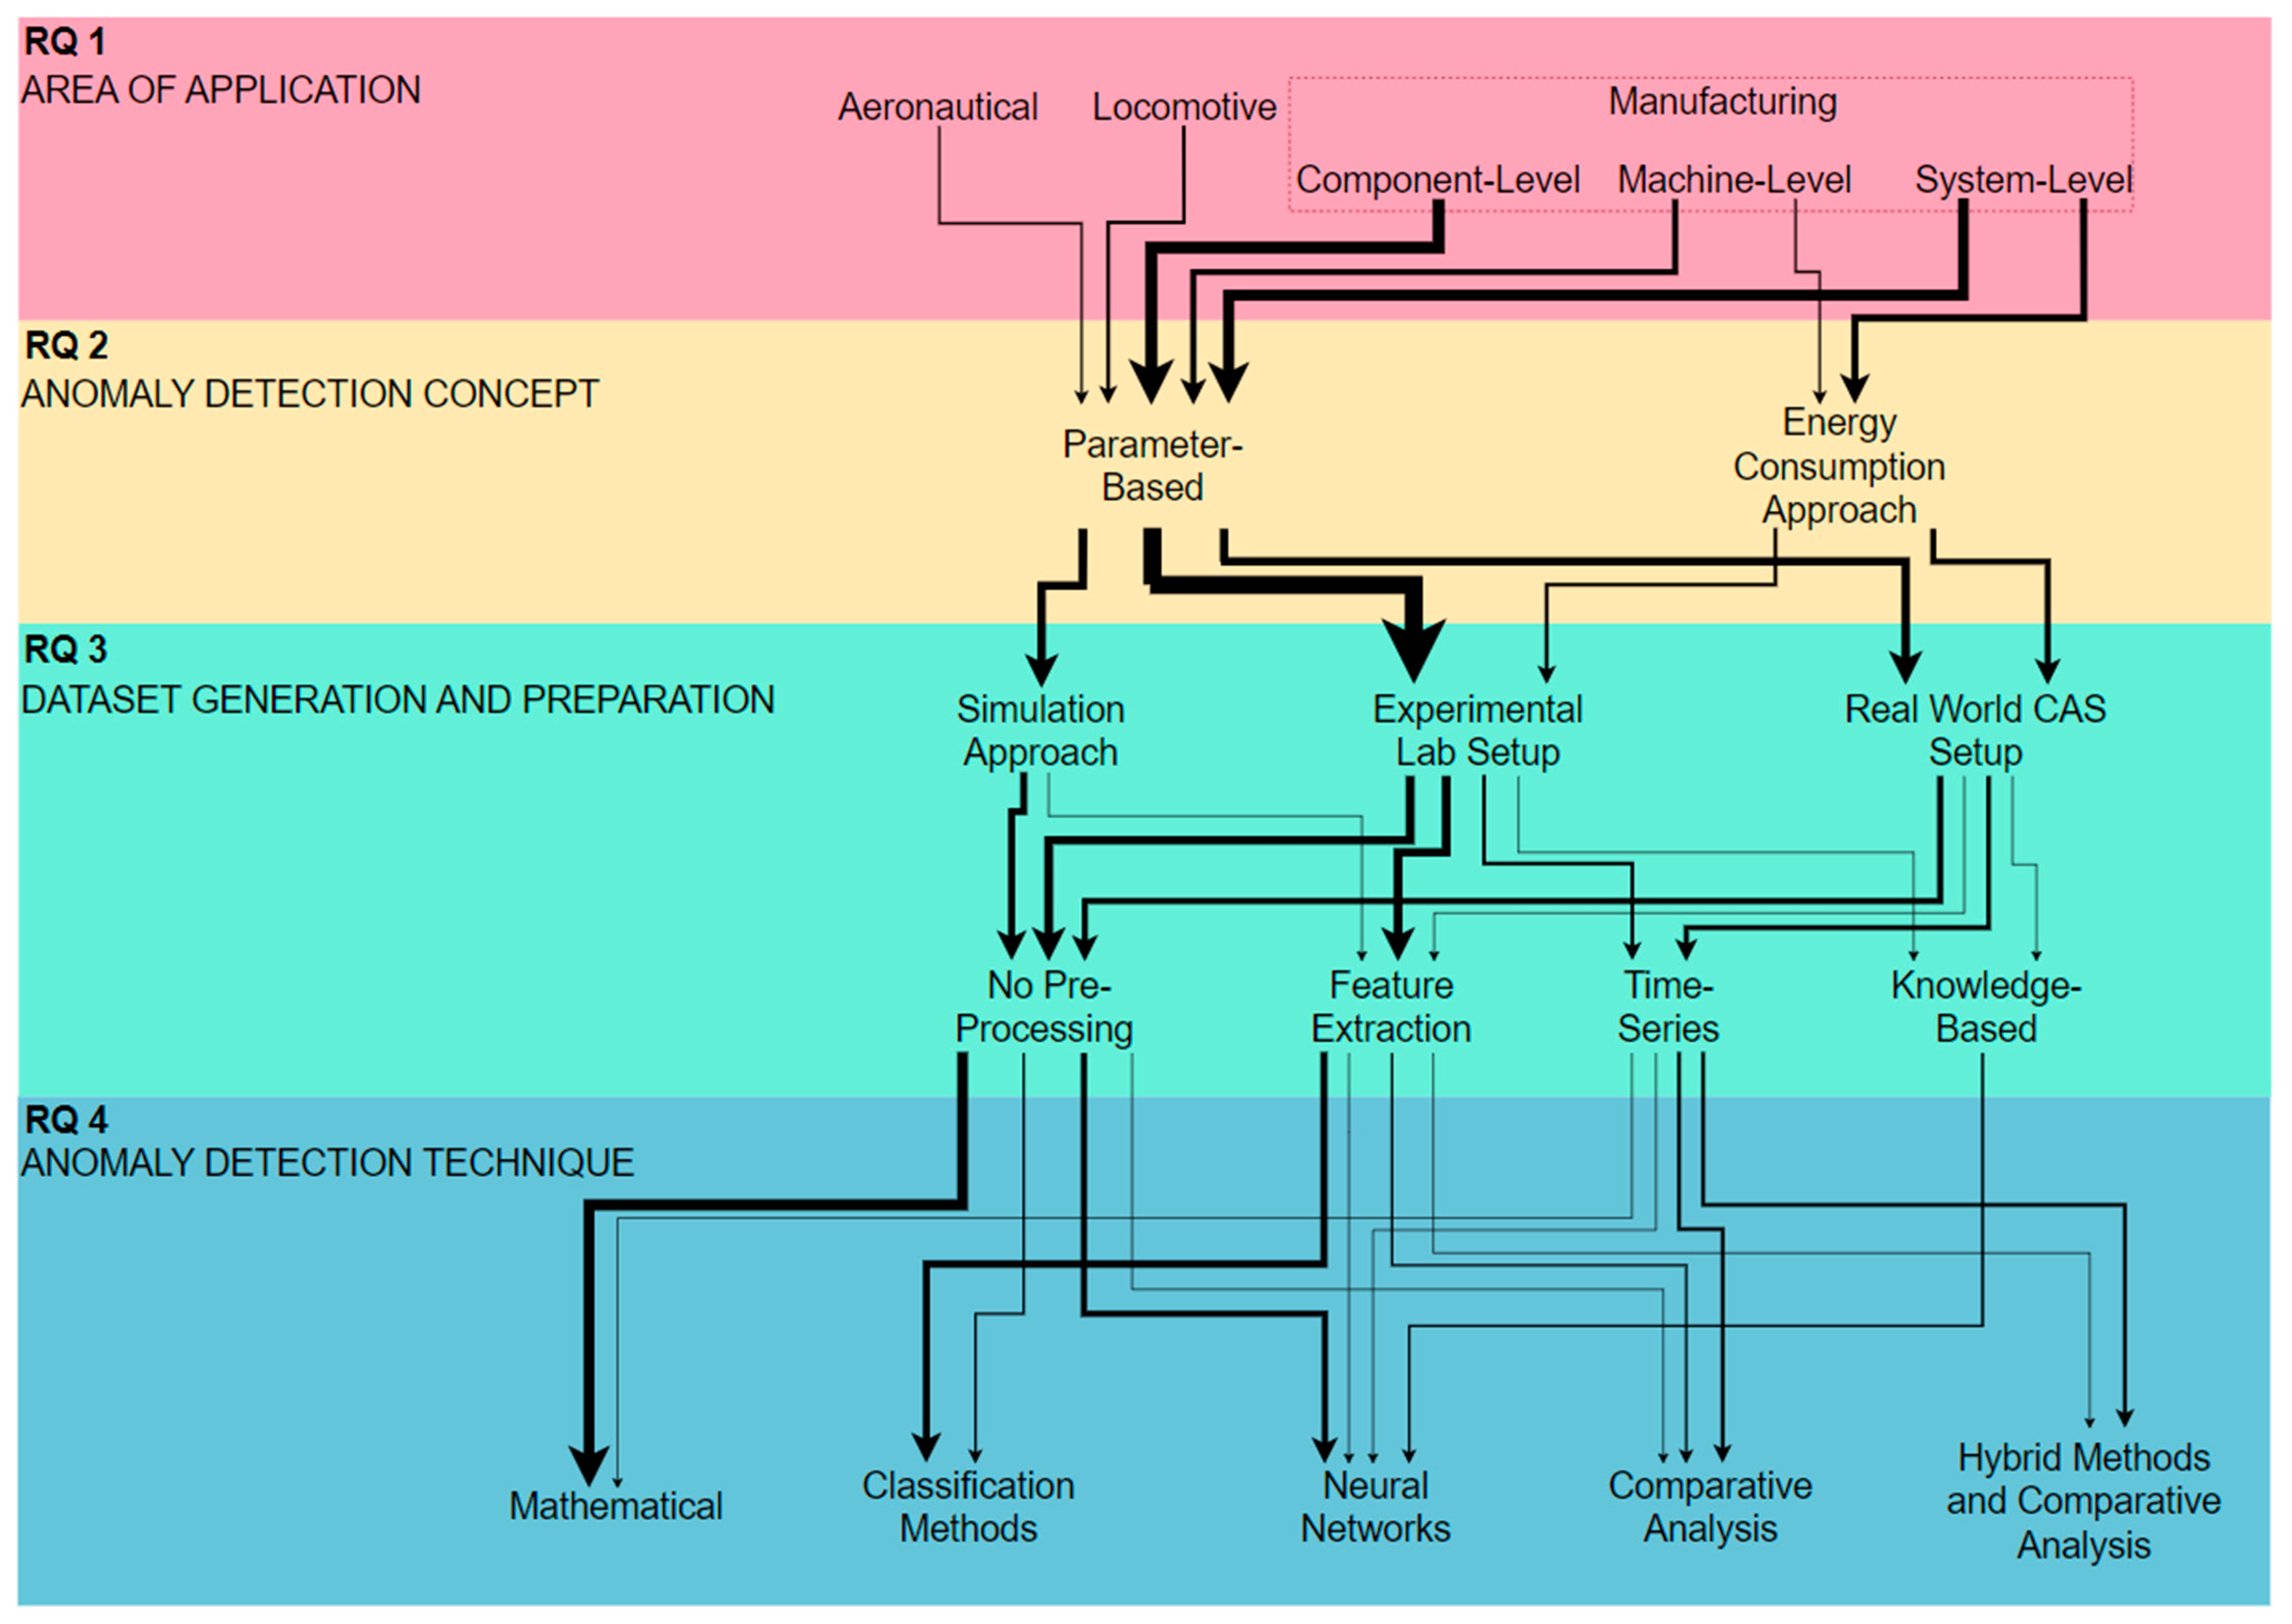
From the included publications, the main three groups of dataset generation are simulation approaches, experimental setup approaches within a lab-based environment, and real-world CAS installation in a typical industry setup. The obtained results are shown in Figure 8, and the categorisation can be seen in Table 5.
  • Simulation Approaches
The simulation approach was mainly characterised by DAMADICS implementation, where only two from seven publications of this subgroup focused on other CAS elements. Assis Silva et al. [34] generated a dataset from a validated non-linear model of a PRSOV with pneumatic feedback, resulting in 40,000 simulated samples for each of the required excitation profiles. In this study, three failure modes were simulated by modifying the chosen degradation factors. This study went a step further in considering sensors’ uncertainties within the dataset generation, and hence typical random values were included for the manifold pressure, valve angle, and engine pressure in each time step, after the simulation process [34]. Similarly, the research conducted by Graves et al. [35] involved dataset generation through the simulation of a validated non-linear model for a pneumatic actuator. It is worth noting that both studies are within the aeronautical industry, as identified by the first RQ. On the other hand, the research carried out by [46,47,48,49,50] involved the use of the DAMADICS benchmark for the simulation of pneumatic control valve behaviour while generating a dataset involving a normal operation profile, with the possibility of 19 faulty operation ones.
Conversely, the investigation carried out by Han et al. [47] validated the simulation approach by comparing the generated dataset with a real-world dataset. In this case, data were collected for 17 minutes from an installed pneumatic control valve, which included a fault-free operation and a single-fault operation by inducing one artificially generated fault within the installation [47]. The studies performed by Mahalingam et al. [48], Elakkiya et al. [49], and Korablev et al. [50] involved the same simulation procedure of Andrade et al. [46], where these used the DAMADICS benchmark.
  • Experimental Setup Approach in a Lab-Based Environment
Experimental lab-based case studies comprised 49% of the papers. Two of the locomotive publications involved this approach, such as Wang et al. [37] collected data from a three-cab in-lab experimental platform, while Sun et al. [39] generated a dataset from a jig that replicated the actual pneumatic train door subsystem. Wang et al.’s [37] work involved the use of 15 pressure sensors strategically placed within the CA brake system. Thus, the experimental platform was capable of simulating different operational conditions while inducing typical brake faults, such as brake pipe leakage [37]. The study performed by Sun et al. [39] involved the generation of a dataset from a pressure transducer wired to an embedded controller. In this case, four levels of leakage were artificially induced, along with a normal operation condition, during dataset generation [39].
The study carried out by Dobossy et al. [51] involved the use of a testbench, where twenty production process cycles were collected using a number of sensors, which were an accelerometer, airflow rate, pressure, and proximity sensors, a load cell, a microphone and a thermocouple. Data were collected for three reference processes in a separate manner. These were a drilling operation, an assembly of press-fitting parts, and the transfer of components for an assembly operation. The dataset generation and collection were handled and managed on individual NI-cDAQ modules and controlled by the NI-cDAQ 9172 chassis [51]. Similarly, Kostkurkov et al. [65] generated and collected two hundred operating cycles of data from an experimental setup. These data comprised a continuous measurement of airflow values for three levels of CA pressure. Additionally, discrete actuator signals were collected from the PLC module to correlate the CA flow and pressure measurements with the production system operations. In this case, leaks were artificially induced during the data collection process [65].
In the case of both Demetgul et al. [55,56,57] and Liu et al. [72], their investigations involved a machine-level experimental setup. In [55,57], a servo-pneumatic positioning experimental setup built by FESTO Didactic was used for the generation of the required dataset. Experimental data were collected by using an NI-cDAQ system and control modules. The data included measurements from four analogue transducers measuring the pressures of the entire system. The airflow was controlled via a proportional directional control valve, while position measuring was performed with the use of linear potentiometers and a contactless absolute magnetostrictive linear displacement sensor. The gripper was equipped with two proximity sensors to detect whether it was in the closed or open position. The dataset was generated by operating the system with the mentioned sensors for a period of 27 seconds and for three times at each experimental condition. Thus, eleven different conditions were generated, one of which was considered the normal fault-free condition [55,57]. In the case of [56], the dataset generation represented a bottle filling plant; however, the same approach was implemented for data management. The study performed by Liu et al. [72] involved an experimental setup representing a complex CAS. This setup simulated the process of soft-landing systems within a roll grinder, which is supported and cushioned by two synchronous pistons. Faults were simulated by the manipulation of pressure variabilities [72].
The studies performed by Cabrera et al. [58] and Prashanth et al. [66] involved a compressor-based experimental setup. In Cabrera et al. [58], an accelerometer was vertically placed on a two-stage compressor for data collection purposes. The analogue signal was transferred by wire to a National Instrument compact data-acquisition card (NI9234 cDAQ) specifically designed for vibration measurements. The card performed the analogue-to-digital conversion at the desired sampling frequency. The cDAQ was attached to the NI9188 chassis to stream the digital signal to a laptop through an Ethernet link. During the data collection process, four anomalies were artificially induced, along with a healthy condition situation, in which a total of seventeen operational conditions were generated [58]. Similarly, Prashanth et al. [66] vertically mounted a triaxial piezoelectric accelerometer on the compressor’s cylinder head. Additionally, four types of faults were included by selectively assembling them within the experimental setup. The same approach for data collection was performed by interfacing the accelerometer with an NI-9174 data acquisition unit for data storage on a laptop [66].
Conversely, the studies performed by Venkata et al. [41], Yerra et al. [42], and Subbaraj and Kannapiran [43] focused on one pneumatic component, rather than the compressor system. Apart from this, all three publications featured a different approach on which data were collected. Similarly to [58,66], Venkata et al. [41] generated a vibrational dataset from an accelerometer during real-time operation of a pneumatic control valve within a water system. Data acquisition was performed via an NI sound-and-vibration input module in conjunction with a wireless and Ethernet carrier. Two faults were considered, which were an insufficient supply pressure and an inflow fault, and data were binarily categorised, i.e., normal or faulty. NIMAX, which is an acquisition setup by MATLAB, was used for data processing [41]. In contrast, the research performed by Subbaraj and Kannapiran [43], could be considered similar to the DAMADICS-based research [46,47,48,49,50]; however, data were collected from a test bed that involved a pneumatic servo-actuated industrial control valve. Both fault-free and faulty data were collected to generate a dataset that represented a complete range of operating conditions. For simplification purposes, this study only introduced one fault at a time, where the chosen fault conditions belonged to the same fault types of the DAMADICS benchmark. Data collection was carried out directly from the real-time system interfaced with a personal computer and a c-DAQ card [43]. An interesting approach was used by Yerra et al. [42], as the dataset comprised measurements from piezofilm sensors for the acquisition of valve acoustic signals through an unintrusive method. This differs from any other included publication. Two sensor positions were investigated to select the optimal data acquisition position for data analysis. A signal conditioning circuit with a preamplifier was connected to these sensors for the removal and minimisation of unwanted noise and disturbance. Additionally, the three pneumatic valves within the experimental setup were controlled by a PLC program. The investigation was based on one of these valves only, which was a pneumatically operated Burkert 2/2-way valve (Type 2100) of angle-seat type [42].
Liao et al. [69], Cupek et al. [53,54,68], and Santos et al. [70] all focused on demand-side anomaly detection implementations. Liao et al. [69] generated a dataset from ultrasonic sensor readings of an experimental setup, including a man-made pinhole within a CA tube piping. An Advantech data acquisition card was used to collect and feed data into an analogue-to-digital converter, which was then stored on a computer for data processing [69]. In Cupek et al.’s [53,54,68] research, a laboratory test stand that comprised typical pneumatic components by FESTO, was used for data generation. The data collected were made up of four series of fifteen cycles each, and included both cumulative air consumption from an airflow meter and component output signals from a Siemens PLC [68]. The dataset generation procedure presented in [53,54] went a step further than the simple dataset generation in [68]. A framework was set up for a mass-customised production process that consisted of a number of functional blocks to standardise dataset generation, preparation and consequent analysis. Cupek et al. [53,54] developed a monitoring block that directly uses the output control signals of the actuators in the Siemens PLC memory and communication co-processor that supports industrial Ethernet. The dataset included energy consumption measurements derived from the station’s CA supply input. Additionally, the system tracks the time during which pneumatic devices are supplied with air by monitoring the opening and closing time of the valves located on the pneumatic terminals from PLC signal recording. The data collected were divided into three different groups with different energy consumption profiles over time [53,54]. Finally, the study performed by Santos et al. [70] involved a laboratory-based setup consisting of a galvanised iron pipeline of sixty metres length, along with a domestic-type LPG vessel used as a pressure vessel for experimentational purposes. Faults were manually triggered by the opening and closing of a quick valve installed within the CA pipeline distribution system. Similarly to [69], data were collected from a microphone, amplified, converted by an analogue-to-digital converter, and stored on a microcomputer [70].
  • Real-World CAS Installation in Industry
The 32% of the publications discussed in this subsection collected a dataset from a real-world CAS installation. A real-world dataset was used in [38], which was not generated by the research team, but obtained from the ECP braking system of a DK-2 locomotive from Shouhuang Railway. Within the manufacturing research field, Rajashekarappa et al. [52] presented a real-world implementation, as opposed to the investigations carried out by [41,42,43,51,65]. Rajashekarappa et al. [52] generated their dataset comprising airflow, temperature, and pressure sensors from a real-world pneumatic production system. Data collection was carried out during two periods: initially during a planned shutdown and then during normal production hours. Artificial anomalies were induced in the cell of a packaging process by drilling a hole in an external plug connected to a pneumatic tee tube-to-tube adapter. During planned shutdown, a 1 mm leak was used, while during normal production hours, a 0.8 mm leak was set up. The generated dataset was collected in the form of a ‘CSV’ file and then extracted on a ‘Grafana’ visual interface [52]. In contrast to [41,42,43], Kovács et al. [44,45] generated a real-world dataset collected from a Hungarian multinational manufacturer of electrical components between May 2018 and February 2019. A 0–20 mV signal from a pneumatic actuator was collected and recorded as a CSV file, similarly to [52], where it runs in a sequence of six to eight cycles under normal operating conditions.
The publications by [59,60,67] generated a dataset from a supply-side system, either from a compressor or an accumulator. In the case of Cui et al. [59], the dataset was generated from a 22 kW compressor. This dataset was collected from the compressor’s condition monitoring system (CMS), where thirteen different variables, including inlet and outlet pressure temperature and vibrational values, are measured and appended every five minutes. Thus, the process of data collection was very easy and flexible, since a direct download from the CMS was available. The dataset included 1380 groups of historical fault-free data and was divided in three groups. The first dataset was used to construct the historic memory matrix of the model, the second to verify model accuracy while determining the fault warning threshold, and the third to test the effect of the fault measure and early warning system. No faults were purposely induced during dataset generation, as a typical air compressor fault occurred during the data collection window [59]. On the other hand, the study performed by Holstein et al. [60] involved a different approach from [59], but similar to those performed by [51,70]. This is because the dataset was generated by measurements collected from the structure-borne sound probe T10 from SONOTEC and a microphone MK301 from Microtech Gefell. Due to the nature of the data, a 24-bit c-DAQ card was required, in this case DT 9847-2-2, to be able to measure low frequencies [60]. The research of Desmet et al. [67] involved the generation of two datasets. The purpose of the first dataset was to be fault-free to discover the sawtooth patterns for accumulator charging and discharging and the activation of air-actuated components. The other dataset was generated to detect the anomalies from the presented algorithm, which will be identified by the fourth RQ. Fault simulation was performed by inducing a moderately leaking nozzle, where the air consumption rate increased by 25% from normal condition operations [67].
The remaining publications within this subsection are associated with the investigations performed by the research team of F. Bonfa, M. Benedetti, and A. Santolamazza et al. [61,62,63,64]. The dataset generation for these studies stemmed from the measurement of potential parameters collected from five compressors within an Italian pharmaceutical manufacturing company. One of the compressors served as the master, and hence this was working continuously, while the other four compressors served as slaves to top up when the manufacturing demand increased. The energy and CA production data were collected at an interval of 15 min, and included pressure, temperature and external air humidity. The number of running hours for each compressor was available weekly in a cumulative format [61,62]. In addition to this, Santolamazza et al. [63,64] chose particular energy drivers for analysis, which were low-pressure flow rate of 3 bar, medium-pressure flow rate of 8 bar, the external air temperature from which the external air humidity could be derived from, and the binary state of the single compressors. This meant that the state is ‘0′ when energy consumption of the associated compressor is less than 1 kWh/15 min, while if the compressor’s energy consumption is more than 1 kWh/15 min, the state is equal to ‘1′ [63,64].

Dataset Preparation

In addition to dataset generation, RQ3 seeks to understand the data processing techniques, if any are performed. It can be deduced that preprocessing was not performed for almost half of the reviewed studies, where 46% of the selected publications did not manipulate the data prior to analysis. Figure 9 provides a visual representation of the results obtained for the analysis of dataset preparation techniques identified in response to RQ3. Table 6 shows the categorisation of studies based on the selected dataset preprocessing technique.
  • No Preprocessing
The first category groups included publications that did not involve any specific preprocessing technique on the generated dataset. For this group of publications, the anomaly detection development is directly based on the dataset collected, where no specific relationships are required beforehand. It was noticed that only one of the publications that adopted a simulation-based approach [34] performed a preprocessing technique. The other publications did not. including the studies using the DAMADICS benchmark [46,47,48,49,50] and one of the aeronautical applications [35]. A different approach was implemented by Kostkurkov et al. [65]. This was purely a time-series one, as the research team decided to implement a direct analysis of CA supply flow rate with time-series diagrams. This was then developed for the anomaly detection process, which is discussed when answering RQ4. The studies performed by Bonfa et al. [61], Benedetti et al. [62], and Santolamazza et al. [63,64] did not involve any particular data preprocessing techniques either. However, it was still ensured that high-quality data were obtained through a manual or automated data handling process, depending on the dataset size and complexity. Measurement data inaccuracies were also considered and checked for [61,62,63,64]. Additionally, in [64], data cleaning of unwanted data was performed due to the nature of the selected anomaly detection methodology. Similarly, Demetgul et al. [56] did not perform any data processing, which was also observed in the mathematical-based research studies by [55,57,68,69,70].
  • Feature Extraction Techniques
Feature extraction is a process of reducing data dimensionality through methods that combine variables into features while still accurately representing the original dataset. This process helps in reducing computational time due to the reduction in dataset complexity, though without losing any relevant information within the dataset [73,74]. Assis Silva et al. [34], defined a set of hysteresis envelopes to obtain a range of degradation factors. Thus, features were obtained by the generation of predetermined behaviour of the pneumatic valve, along with consequent analysis of the collected dataset [34]. It is important to consider that this is a specific area of research, and such implementation cannot be adapted to a manufacturing CAS implementation. The studies carried out by Cui et al. [59] and Venkata et al. [41] involved a window approach to preprocess their datasets. Both data filtering and preprocessing were involved in the investigation by Cui et al. [59], with the aim of creating a high-quality dataset that consequently aids in obtaining better model accuracy and reliability for anomaly detection. The procedure included the separation of abnormal data vectors in two, where dynamic operating points, such as the sudden opening of a valve or during an abrupt decrease in load, and outliers were identified. For the former, steady operating vectors were required and obtained with the implementation of a sliding window method to select such steady-state vectors. In this case, these were chosen as the motor current and motor power. On the other hand, the outliers, which were characterised as abnormal samples caused by electromagnetic interferences and sensor failures, were eliminated by implementing a k-means algorithm for classification purposes [59]. On the other hand, Venkata et al. [41] implemented the NIMAX approach, which processed the vibrational data as sine waves, and hence kept them in the frequency domain. This was performed as it was more complex to obtain the time-domain features due to the requirement of sinusoidal waveform summation. Since digital inputs were used, a discrete Fourier transform was implemented, along with power spectrum density analysis. The latter produced better results, as the acquired vibrational data were random and had no prior knowledge of the vibration mode. To minimise the effect of having data discontinuity, a window function was adopted, which is similar to the approach implemented by Cui et al. [59]. The ‘Hanning’ window concept was selected, and resulted in better division of the raw dataset frequency. This was performed for both the Fourier transform and the power spectrum density function [41].
In the research of Cupek et al. [53,54], pre-analysis of the data identified a number of observations. These included: (i) the speed of data collection, where the actual production stand was replaced by an experimental one to minimise the number of controlled components; (ii) the parallelism of processes, where analysis was conducted on sequential states; and (iii) the consideration of how to distinguish energy consumed according to the setup activity, which means to filter out passive energy consumption components that are uncommon for pneumatic systems. Then, dimensionality reduction for the generated dataset was carried out by using diffusion maps (DMs), local linear embedding (LLE) and AE methods. DMs use eigenfunctions of Markov matrices to consider effective representation of data geometry descriptions of the original dataset to obtain coordinates. On the other hand, the LLE technique is purely for dimensionality reduction, similar to an ‘Isomap’, as it constructs a graph representation of the datapoints. In this research, the data were embedded in five dimensions [53,54]. A similar approach was adopted by Demetgul et al. [57], where an intelligent approach was used for data reduction. Similarly, the dataset was subjected to three different methods, being DMs, LLE, and AE. These were purposely selected and implemented to reduce the dimensionality of the data, while obtaining useful properties for the consequent anomaly detection techniques [55]. Prashanth et al. [66] performed feature extraction and dimensionality reduction to save computational time. The extracted features were statistical and subjected to the J48 algorithm based on decision trees (DTs). Such a method prioritised the extracted statistical features most relevant to the generated dataset [66]. Wang et al. [37] performed feature extraction and dimensionality reduction through an AI process. Phase partitioning and classification was carried out, identifying the braking operations of a pneumatic air brake system for locomotive application. In this case, a modified reinforcement learning-based algorithm was adopted to execute feature selection, and this approach was selected to minimise overfitting and computational complexity. Due to the nature of the implementation, it was possible to extract features that could be further divided into statistical and time-domain spaces. Contrast features were also derived from the generated dataset to provide complementary information for fault diagnosis simplification. Both the divided and contrast features were grouped together to produce integrated features for the classification of faulty component types within the abnormal conditions of the locomotive application [37].
Both Dobossy et al. [51] and Rajashekarappa et al. [52] implemented feature selection by extracting the required condition indicators. In the case of Dobossy et al. [51], a condition indicator extraction was performed to extract and select signal-based condition indicators. Such feature extraction was performed in both the time and frequency domains, and included mean, standard deviation, RMS, and shape factor, amongst others, for the time-domain dataset, along with peak amplitude, peak frequency and band power for the frequency-domain dataset. This was followed by the integration of the relief-F algorithm for the required feature selection to reduce data dimensionality, as it tends to improve the quality of the selected classification model for anomaly detection. This algorithm was chosen after comparing a number of feature selection techniques on synthetic data, as it produced the best results [51]. Therefore, Dobossy et al. [51] removed any correlated and redundant features, while minimising non-linearity and feature noise. In the case of Rajashekarappa et al. [52], the required data cleaning and dataset preparation was initially performed, which involved outlier removal with the use of a box plot for airflow, along with idle time removal. Then, data points corresponding to normal and abnormal conditions were extracted separately, followed by binary data labelling. Before implementing feature extraction, the new set of data was regrouped based on a newly defined time dimension, known as ‘processing time’. This represented the time in which the machine was in its working status. Thus, feature extraction was then performed with the same tool used by [51]. In this case, only the time-domain features were extracted for the dataset variables, including pressure, temperature and airflow. Additionally, a Kruskal–Wallis test was performed, since an assumption of normal distribution could not be made for the generated dataset [52].
  • Time-Series Approach
Time-series data include a lot of information regarding system behaviour; however, it is tedious to extract certain details without the required preprocessing. The study performed by Cabrera et al. [58] involved the manipulation of time-domain raw vibration signal data. A set of condition indicators were computed through time, followed by mathematical scaling. Thus, the resulting dataset included scaled condition indicators which are adapted into subsignals for anomaly detection implementation [58].
Wavelet transformation, as part of a time-series analysis, was carried out by both Desmet et al. [67] and Liu et al. [38]. Desmet et al. [67] filtered and cleansed their datasets from any unnecessary noise that could make it difficult to visualise the accumulator’s behaviour. Preprocessing involved feature derivation, where the raw time-series pressure signal was transformed to form a set of inputs. This was followed by the implementation of the wavelet transform, in which case the Morlet wavelet was selected [67]. This decision was based on literature, as Desmet et al. [67] found several applications of it for anomaly detection purposes. Similarly, Liu et al. [38] filtered out useless information from the acquired dataset and performed a correlation analysis to identify the most significant relationships between the measured variables. Liu et al. [38] made sure that all values within the dataset were positive integers, while the time values were uniformly converted into a standard time-stamp conversion. This was followed by feature extraction of the time and frequency domains, extraction of correlation features, and wavelet packet decomposition. Thus, this research implemented more than one feature selection process for a multidimensional approach [38]. Another time-series preprocessing implementation was carried out by Holstein et al. [60]. Calculation of the statistical values of RMS, crest, and kurtosis values for the collected acoustical data, including ultrasound ones, was combined with both spectral and filter operations. The former can be described by means of Fourier forward transform (FFT) spectra, or derived time-domain filtered presentations [60].
In their investigation, Kovács et al. [44,45] prepared a high-quality and balanced dataset where any unnecessary data were removed. This was followed by down-sampling through interpolation for the required pneumatic actuator’s signal preprocessing. The preprocessing was initiated by data format conversion from ‘.csv’ to ‘xts’ time-series objects so that time-series functions and analysis could be carried out within the R environment. Additionally, each datapoint was assigned a time stamp, while removing any duplicate or erratic data. The inclusion of a threshold indicator based on the average of the rolling standard deviation was also performed. Sequences were then split into individual signals for each reciprocating cycle of the actuator [44,45]. For Kovács et al. [44,45], the signal shape was important, as it is capable of carrying and identifying specific conditions of the pneumatic actuator. A peak detection method was also implemented to identify the beginning of a signal, which finds the earliest local maximum above a set threshold. Cycle time issues were managed by a cut-off point set at a constant time period less than the average cycle time. The split and processed signals were stored in a ‘csv’ file once again, along with developing ‘png’ files to continuously observe the cycle pattern [44,45].
In Sun et al.’s [39] research, the collected pressure data were transformed into a 2D dimension space. Thus, after mean filtering and normalisation, the CA pressure data were segmented, where for each segment, they are divided into equal parts that contain a number of sampling points. Then, these parts were taken as a line of the 2D image [39]. Finally, the research by Yerra et al. [42] involved acoustic signals similar to [60]. Signals were first normalised to compensate possible gains that could have been introduced by the analogue signals conditioning circuits, used to assist sensors. The resulting dataset was then subjected to a computation of short-term energy profiles and a moving average calculation, which acted as a low-pass filter to reduce any random data fluctuations. It was ensured that during the latter preprocessing implementation, no profile features were lost. Quantisation was performed by predefining six different levels with a minimum and maximum value. This made it easier for consequent pattern categorisation during anomaly detection implementation [42].
  • Knowledge-Based Method
The studies performed by Thabet et al. [71] and Subbaraj and Kannapiran [43] involved a knowledge-based approach, which will be delved into when answering the final RQ. These differ from the other studies, as the implemented data preprocessing is specific to the approach selected for anomaly detection. Thabet et al. [71] specified that data processing will be an intelligent one, i.e., with the use of ML methods, where an AI model based on knowledge management will then be able to act on it. On the other hand, Subbaraj and Kannapiran [43] normalised the data collected for the required knowledge-based anomaly detection implementation. This means that all the input variable data were compressed in the range between ‘0’ and ‘1’ [43].

4.2.5. RQ4—The Anomaly Detection Technique

The final RQ aims to identify the anomaly detection techniques implemented within a CAS application. Hence, it will identify the AI and ML methods that were employed either as stand-alone solutions or in combination for successful identification of anomalies. A number of studies based on mathematical approaches were still included within the scope of this RQ, to show how research has been developing from conventional methods to intelligent ones. Figure 10 shows the results for the anomaly detection techniques identified by this RQ, whilst Table 7 shows a detailed summary of such findings.

Mathematical Approaches

Mathematical approaches could help in understanding the theory and concepts behind certain anomaly detection techniques. That said, these approaches have certain limitations due to the difficulty of representing complex systems, such as CA implementations. Liao et al. [69] developed a theoretical model based on time-delay estimations to detect CA leaks by means of a portable multi-sensor ultrasonic detector. Additionally, Cupek et al. [68] developed a reverse-engineering algorithm with analytical methods representing the energy consumption of a blowing device, which is a CA end-point component. Santos et al. [70] performed spectral analysis to detect leaks within a CA distribution pipeline. This involved the implementation of the FFT on measured microphone values, which generates a frequency response known as a spectrum that provides information on each operating condition characteristic. Such an approach was also used in the study performed by Graves et al. [35]. In this case, a theoretical model was derived for an aircraft pneumatic actuator, which additionally included aging effects and excitation design for health monitoring purposes.
Both Han et al. [47] and Liu et al. [72] implemented a canonical-based approach for anomaly detection within pneumatic control valves and complex CASs, respectively. The investigation carried out by Han et al. [47] included the calculation of both a p-window and an f-window to mathematically analyse the effectiveness of the developed canonical variate analysis. To improve the fault detection method, a detection indicator based on the residual’s square calculation of the Mahalanobis distance was combined with canonical variate analysis computation [47]. In the case of Liu et al. [72], a generalised linear model (GLM) with an improved canonical correlation analysis (CCA), known as the GLCCA approach, was developed. This could extract both linear and nonlinear behaviour of the CA system to efficiently detect any present anomalies [72].
Anomaly detection for pneumatic systems was performed through a time-series mathematical approach by Kosturkov et al. [65]. Fault detection was based on mathematical metrics with the use of time-series charts. A quantitative analysis was performed through feature fusion based on distance in metric space techniques by implementing the Minkowski and Canberra distances and with correlation techniques, in this case being Pearson’s cross-correlation and angular separation correlation coefficient. Since the correlation coefficients separately did not allow accurate classification of the leakages, the Pearson correlation and Canberra distance were combined. This method made it possible to detect leaks on the supply line and after the distributor [65]. Another analytical approach was carried out by Yerra et al. [42], where a sequential-state logic (SSL) algorithm was developed to detect signatures based on the derivation of the short-time energy content of a normal valve operation. Thus, anomaly detection would result from abnormal events due to the faults present in the system, which would result in a different valve condition signature [42].
For a more quality-control-based analysis, both Bonfá et al. [61] and Benedetti et al. [62] developed an anomaly detection technique derived from energy consumption control charts. Data representing a seven-month period of operations were plotted on both a control chart and a CuSum chart, in which four distinct energy behaviours were highlighted. Two of these were maintenance-related, while the other two were categorised as activation sequence behaviours. From such knowledge, an optimal activation sequence was uploaded into the CAS central control system. The developed control charts were provided to the maintenance team for continuous monitoring and control. It was calculated that this quality-control method produced an energy saving of 10% from the annual energy consumption of air compressors within the selected manufacturing company [61,62].

Classification-Based Method

In this subsection, the three main methods identified from the included studies are k-means, decision trees (DTs), and support vector machines (SVMs). The studies performed by Cupek et al. [53,54] and Demetgul et al. [57] involved a k-means implementation. Cupek et al. [53] performed clustering of multidimensional data to identify production types from both the switch-on times of the devices and the total energy consumed during the production cycle. The time-series data were transformed into a machine cycle vector, where they acted as inputs to the clustering algorithm. The AI approach involved two elements. First, a k-means classification algorithm was implemented to detect the different production variants within the data. Then, eight new production scenarios were prepared to verify the anomalies caused by artificial leaks, which could be either an anomaly within a device that results in an increase in total time of device movement or a typical leakage in the system, which would increase the cycle’s energy consumption. The k-means algorithm was implemented once again to classify such anomalies and provide alerts with the use of a human–machine interface (HMI). It was possible to assign the detected anomalies to the closest production variant by calculating the minimum distance between all features and the variants’ centroid. Leak location was also possible within these studies [53,54]. The approach executed by Demetgul et al. [57] was different from those adopted by Cupek et al. [53,54]. Data classification within the new feature space was carried out using the Gustafson–Kessel (GK) and k-medoids algorithms. The former is a standard clustering algorithm in which a continuously updated rule moves the cluster centre to the nearest data point within the cluster. The latter provides a degree of membership for each datapoint to a particular cluster by creating a fuzzy partition. The classification performance values for the developed algorithms were obtained by comparing the classification accuracy with the actual algorithm values. The best results were obtained by the LLE method implemented for data compressibility and then classified by the GK algorithm. The LLE data reduction technique combined with the k-medoids algorithm also produced the highest performance accuracy within the k-medoids applications [57].
Venkata et al.’s [41] and Demetgul et al.’s [55] investigations involved the use of SVM for an effective CA-related anomaly detection technique. Classification by features was possible for the investigation carried out by Venkata et al. [41], since data were treated as patterns rather than independent data points. The SVM classifier model was trained by both the Gaussian kernel and radial basis function (RBF), the former obtaining better results. A confusion matrix was generated to compare the predicted class labels and the test data class labels. Testing for the developed AI classification system was performed in real time by the manipulation of input control signals while inducing artificial leaks. Performance metrics were also computed, including the model’s accuracy, error rate, sensitivity, specificity, and precision. Apart from these metrics, the SVM model was also compared to the performance of models implemented in related pre-existing work [41]. Conversely, Demetgul et al. [55] not only implemented an SVM classifier for anomaly detection but also a DT-based solution. Demetgul et al. [55,57] investigated k-means from the available classification methods, while also implementing SVM and DT for anomaly detection within CASs. Thus, in [55], typical fault cases within the modular production system (MPS) were classified by implementing separating planes recognising a set number of samples. For the SVM implementation, the RBF, sigmoid, linear and polynomial kernels were used for the selection of the best SVM model. On the other hand, the DT implementation involved the development of the QUEST, CandRT, C5.0 and CHAID methods. Demetgul et al. [55] noticed that the input variables should be given utmost importance, as these easily determine the classification process output. From the developed SVM models, the ones with RBF, polynomial and linear kernels showed a prediction accuracy of 100%. Similarly, the models developed using DT with QUEST, CandRT, and C5.0 identified all samples correctly, obtaining 100% accuracy. In this paper, Demetgul et al. [55] showed that both the SVM-based and the DT-based fault monitoring and detection algorithms are suitable for industrial production systems that use CA elements. However, these results could suggest overfitting issues. Additionally, it was shown that the SVM algorithm has a better learning speed than the implemented DTs [55].
The investigations performed by Rajashekarapp et al. [52], Mahalingam et al. [48], and Prashanth et al. [66] also involved the use of DTs. Rajashekarapp et al. [52] split the generated dataset in two. Thus, the training data were subjected to the ‘classification learner’ app in MATLAB, with the response value set to the labels in the dataset. Good performance and minimal overfitting were avoided by iteratively selecting different features during model training. The optimal ML method was RUSBoosted bagged trees, which is a hybrid combination of data sampling and boosting algorithms, i.e., random undersampling combined with AdaBoost. A confusion matrix was generated, as the study involved an imbalanced dataset. Thus, a number of mathematical metrics were calculated, which include accuracy, precision, recall, and F1 calculations. Validation was performed during a 5½-h test in which data were collected from another cylinder of the same packaging machine setup with a 0.8 mm leakage. All performance metrics resulted in values higher than 98% [52]. In the study performed by Mahalingam et al. [48], a classification and regression tree (CART) based on a DT model was built using the ‘gini’ index as the impurity metric. The issue of overfitting in a non-parametric and imbalanced dataset that includes both binary data and multi-class conditions is discussed. Thus, the resampling technique was implemented as it is a non-parametrical statistical method to draw data in particular traces covering almost all instances by using stratified k-fold cross-validation. The DT depth was found through an iterative process until accuracy showed overfitting, i.e., when accuracy was 100% [48]. Another DT approach was investigated by Prashanth et al. [66], since signal plots of amplitude (y-axis) vs. time did not provide sufficient information. The structure of the DT was constructed by setting the first node as the feature that had the most information, followed by others containing less information in order of importance. To compare the J48-based DT model, the random forest (RF) and reduced error pruning tree (REPT) algorithms were implemented. The RF obtained better accuracy results and computational time than the J48 DT. On the other hand, the best computation time was achieved by the REPT model, at the cost of obtaining the lowest accuracy. Thus, this research concluded that in such cases, the RF would be the most suitable to detect anomalies for the reciprocating compressor. The authors suggested that such implementation can be embedded on a hardware device to be mounted on such compressor, where error indications can be shown via an LED light [66].

Neural Networks (NNs)

This subsection reviews the publications that made use of various types of NNs for CA-related anomaly detection. A non-linear autoregressive neural network model with exogenous inputs (NARX) network was used for the DAMADICS benchmark [46,49]. In Andrade et al.’s [46] research, the anomaly detection methodology was incorporated by a NARX network, which diagnoses the behavioural prediction of the measured signals based on the generated residual values. Such residuals are labelled ‘−1’, ‘1’, and ‘0’, so can indicate the logical situation of the NARX network with the actual process output. Performance tests for the NN involved analysis of the delays in the feedback output, the setting of different numbers of neurons in the single hidden layer, and the definition of the input–output pattern. This methodology proved to be efficient in achieving a simplified way to detect possible anomalies; however, with the limitation that such a test can only be conducted in an offline mode [46]. A similar approach was adopted by Elakkiya et al. [49], in which the NARX network generated residuals for the detection of anomalies within the pneumatic actuator. In this case, four NARX networks were developed: NNARX, NNARMAX, NNRARX, and feed-forward NN (FFNN). All NNs were represented as a multi-input–single output (MISO) for the pneumatic actuator, in which the best architecture was chosen based on the calculation of the sum of squared error. This analysis resulted in the NNARX being the best NN architecture [49].
From the included publications, ANNS was another NN architecture implemented within CA anomaly detection techniques. Santolamazza et al. [63] constructed an MFFNN with one hidden layer. The input layer was set to the number of the selected energy drivers, and the output layer as one node. In this case, the output layer represented the system’s global energy consumption. The number of neurons within the hidden layer was set to thirty after performing random data sampling and calculation of the mean square error (MSE). Additionally, the Levenberg–Marquardt back-propagation method was included for model training. Comparison with a statistical linear regression model was carried out, where three performance indices—MSE, mean absolute percentage error (MAPE) and R2—were calculated. These showed that the ANN model performs better, which made sense, since the control limits were set more narrowly than those of the statistical regression model. After carefully analysing both residual control charts, implemented in [61,62], while discussing the results with maintenance operators, a series of different patterns have been associated with respective anomalous occurrences [63]. Cui et al. [59], included the use of an ANN for anomaly detection measuring of an air compressor. The proposed model involved the use of principal component analysis (PCA), BP and an MSET approach. The PCA method was implemented for data complexity reduction. This made possible the construction of a BPNN, which was constructed with a single hidden layer with thirty input nodes, eight hidden nodes, and one output node. The ‘lr-gradient’ method was used to train the model. The MSET was then developed to build the fault measure and early warning system through the calculation of a Euclidean distance (ED) deviation function and a fault warning threshold. The MAPE, RMSE, MAD were calculated to evaluate the prediction accuracy of the PCA-BP-MSET model. The ANN architecture was compared to a PCA-ED model. The proposed PCA-PB-MSET model obtained the lowest average MAPE, RMSE, and MAD values, thus obtaining the desired results. Moreover, the model’s system computational time was less than the compressor’s CMS sampling interval time, making it an even more desirable solution for anomaly detection [59].
A similar approach was investigated by Demetgul et al. [56] for a bottle filling plant that uses a CAS. Both the LVQ and RBN inputs were set as the input variables corresponding to the sensor values. For the LVQ network, the hidden layer consisted of ten Kohonen neurons, which was determined by a trial-and-error process depending on the algorithm performance. Additionally, the output layer included two nodes corresponding to the normal and faulty states. On the contrary, the RBN’s hidden layer involved fifty neurons, which represented a single radial basis function. In this case, the output layer included a semi-faulty condition as well, apart from the normal and faulty ones. The LVQ network obtained a better performance; however, this could be due to the RBN having an additional output condition for anomaly detection purposes. It was shown that both networks could detect and identify the CA-related anomalies within the system when occurring as a standalone fault [56]. A very contrasting approach from the mentioned ANN-based applications is the research carried out by Sun et al. [39]. To minimise the issue of misclassification, a DL technique was adopted, where the concept of open set recognition (OSR) was introduced with a lightweight CNN. This approach was implemented for a range of CA leakages within the train doors subsystem. In this case, the VGG-7 version was used for the CNN, including the SGD optimiser during training to obtain better results. F-scores were calculated to obtain the model’s performance. The proposed OSR-CNN solution was compared to other OSR solutions, such as ‘SoftMax’ and ‘OpenMax’, amongst others. It was shown that the proposed anomaly detection implementation produced the best result, resulting in a desirable solution for leakage detection within train doors [39].
On the other hand, the studies performed by Subbaraj and Kannapiran [43] and Korablev et al. [50] developed a knowledge-management system based on a NN. Both studies investigated an anomaly detection technique for a pneumatic valve based on an ANFIS network. As described in [43], an ANFIS network encodes the fuzzy if-then rules into a NN structure, which then uses the required learning algorithms for output error minimisation based on the training and testing datasets. In the case of. Korablev et al. [50], the presented approach involves the development of an ANFIS networks to generate reference models for a fault-free industrial pneumatic actuator. Anomaly detection and fault diagnosis were performed through the setting up of Boolean logic rules that considered the received residual information generated by the ANFIS network. This implementation was tested on a valve model via Simulink. Each of the induced faults was detected and identified unambiguously [50]. Additionally, in [43], an MFFNN was developed for performance comparison with the ANFIS solution. It was found that the proposed solution obtained a lower MSE value for both training and testing, while producing better classification for anomaly detection accuracy [43].

Comparative Analysis Approach

The studies discussed within this subsection include a comparative analysis approach for the implementation of the ideal AI anomaly detection technique. These studies were published between 2017 and 2022, showing that the concept of exploiting multiple AI methods to develop combined approaches has been increasing during the past few years. This suggests again that research effort is being invested in representing complex systems with intelligent methods rather than conventional ones.
For example, Silva et al. [34] utilised multiple ML regression methods for the investigation on the degradation severity of the aeronautical PRSOV. The ML methods included three interpretable ones—ordinary least squares (OLS), k-nearest neighbour (kNN), and DT—along with two complex black-box models, in this case, the RF and XGBoost (XGB) algorithms. Hyperparameters were set as default for all algorithms due to computational cost issues, with a 10-fold cross-validation process. For both the OLS and kNN algorithms, the derived features were standardised to minimise any issues with feature scale differences. From the results obtained, it was shown that the XGB algorithm provided the best results, while the RF algorithm presented the lowest R2 and the highest standard deviation values. This could have happened because the RF suffers from high variance when there is no tree pruning, as could happen when developing with its default hyperparameters [34]. Dobossy et al. [51] implemented a verification process for the extrapolated features and the quality of the selected sensors’ anomaly detection process through a multiple ML algorithm process. Similarly to [34], Dobossy et al. [51] developed multiple types of DT, kNN, SVM, and discriminant analysis (DA), and in some cases both a multi-class classifier and a binary-class classifier were analysed. These were then tested by a cross-validation algorithm. The more complex the problem became, the more the ML classifiers had to work in a complex manner, which resulted in decreased performance for all sensor types. Therefore, this study showed that signal-based conditioning indicators are a viable approach to monitor health conditions and to identify and detect anomalies within pneumatic-actuator based machines [51].
Conversely, the studies performed by Kovács et al. [44,45], Santolamazza et al. [64], and Desmet et al. [67] differ from the previous two publications, as these explored both a classification or a clustering method with an NN application. Kovács et al. [44,45] explored the implementation of both a high-clustering method with the use of dendrograms, along with the application of Kohonen self-organising maps (KSOMs). Both intelligent methods resulted in classifying the generated dataset of features into four different clusters. The KSOMs obtained a faster computational analysis, though handling a larger dataset. The studies by [44,45] concluded that the hierarchal clustering presented a better visualisation process for clustering than KSOMs, in which the number of clusters was not predetermined. Santolamazza et al. [64] took a step further from the research of [61,62,63]. Apart from a statistical linear regression, an SVM and an MFFNN were developed to detect irregular compressor behaviours. For the MFFNN implementation, random sampling was performed to determine the quantity of neurons within the hidden layer. The SVM was developed with different kernel functions, where the linear kernel was chosen for obtaining the best results. To compare the three models’ performance, Santolamazza et al. [64] calculated the R2, MSE, and MAPE values. Both the SVM and the MFFNN algorithms had similar performance values; however, the latter produced better results. Similarly to these, Desmet et al. [67] implemented a multiple ML approach by developing three algorithms: RF, AE, and local outlier factor (LOF). In this case, the RF algorithm was implemented to select the most relevant feature scales, while the other two algorithms were used for CA anomaly detection purposes [67]. Similarly to Mahalingam et al. [48], the RF was subjected to a ‘gini’ index to select the required wavelet scales based on importance. The clustering technique developed by the LOF algorithm required more data to run smoothly and present successful results. Thus, a different approach was observed in this study, as two hundred data instances were synthesised for such a purpose. Additionally, the LOF’s performance was enhanced by introducing a k-distance parameter that controlled the neighbourhood size while running the algorithm one test sample at a time. On the other hand, the AE was trained only once on an anomaly-free dataset, and hence a ‘normality’ model was generated. A grid search was carried out and a 95-20-95 structure was found to have the best discriminative performance for the NN approach. These two algorithms were compared by the RMS calculation. Although the AE is faster and allows all 95 wavelet scales to be used, a receiver-operating curve (ROC) assessment showed that the LOF had better performance due to a larger area under the curve (AUC). It was deduced that this could be due to the LOF monitoring the amplitude of each feature one by one, while the AE looks at the overall pattern at once [67].
As previously mentioned, the study by Thabet et al. [71] presented no specific AI or ML approaches; however, the authors provided a general overview of the framework. The research aimed to produce an improvement in energy management by continuously monitoring and assessing energy performance through AI means while applying a knowledge-management system within an HMI. Thus, the proposed concept combines sensing with multiple AI methods to improve real-time energy consumption efficiency by developing recurrent NNs with DL. The knowledge-management system would be characterised by a rule-based concept by a fuzzy-logic system, a decision-making system that filters suggestions, along with a case-based reasoning system that delivers confidence-weights for the AI outputs [71].

Hybrid Methods with a Comparative Approach

Another trend within recent publications is the combination of time-series analysis with multiple AI approaches for the required anomaly detection technique. Wang et al. [37] developed an anomaly detection system for freight train air brakes based on a one-dimensional convolutional NN (1DCNN) and an RF algorithm. The 1DCNN model suffered from poor performance when calculating the accuracy from the resulting confusion matrix, as this could have occurred due to the noise within the air pressure signal time-series dataset. On the other hand, the RF produced accurate results in identifying the anomalous behaviour [37]. The other locomotive application by Liu et al. [38] combined a gradient-boosting DT (GBDT) with time-series analysis for anomaly detection in train air brakes, similar to [37]. The anomaly detection model based on GBDT was trained by a DT-based learner while optimising it with a gradient boosting strategy through a step-by-step process of repairing an iterative residual. This was followed by the brakes’ multivariate time-series modelling, so that anomalous behaviour was identified from abnormal data segments within the generated model. Until it had achieved high accuracy, the model was assessed through the calculation of the macro-averaging criterion [38].
The studies carried out by [58,60] differ from [37,38]. These focused on developing an anomaly detection model for a compressor, and hence a different AI approach was implemented. In [58], the processed time-series dataset was fed into an LSTM-based classifier combined with a Bayesian optimisation (BO) algorithm for the selection of optimal hyperparameters. Instead of the traditional feature extraction and grid selection, a set of condition indicators were analytically extracted to reduce computation complexity. The performance of the optimised B-LSTM model was evaluated through a confusion matrix and its derived metrics, including accuracy, recall, precision, and f-score. Additionally, this AI model was compared to other classical and DL approaches: RF, CART, kNN, LSTM, G-LSTM, denoising AE, and sparse AE algorithms. The BO-LSTM outperformed all other algorithms; however, it required the longest computational time. Such performance results were enhanced by the use of high-level features from a time-series representation, where the algorithm was able to capture the temporal patterns based on the average and standard deviation calculations [58].
On the other hand, the investigation carried out by Holstein et al. [60] was based on spectral features that were derived from both the frequency and time domains, such that the dataset was split into low- and high-frequency datasets. As for the ML approach, the research team implemented a DL approach by developing the Gaussian mixture and hidden Markov DNNs, along with an SVM algorithm. This was carried out for anomaly monitoring purposes as an extension of the existing technologies for compressor maintenance. No specific details were provided in the research paper regarding the algorithms’ characteristics. However, the authors commented on how the developed ML strategy with time-series analysis could provide sufficient information to optimise sensor data processing for the anomaly detection technique [60].

4.2.6. RQ Correlation Analysis

The correlation of the four developed RQs was deemed necessary to show the main contributions and relationships between the identified characteristics. A visual representation of this can be seen in Figure 11. The line weighting represents the quantity of studies undertaking a particular approach. It can be observed that primarily, the selected studies are within the manufacturing sector and utilise parameter-based data. On the other hand, measurement of energy consumption was mainly utilised when analysing at the machine or system level. The majority of studies also made use of experimental laboratory setups. It was also observed that performing any data preprocessing was not favoured from all the identified data gathering scenarios, which meant using raw data as an input for the anomaly detection techniques. With respect to data preprocessing, feature extraction was the preferred method, especially for data collected from an experimental lab setup. Mathematical approaches for anomaly detection opted for a no-preprocessing approach. Additionally, it can be observed that the selected publications that implemented NNs explored all of the identified data preprocessing techniques. It was observed that the time-series preprocessing approach was mostly adopted for comparative analysis studies and hybrid models’ solutions.

5. Bibliometric Analysis

As part of this systematic literature review, a bibliometric analysis is included to further analyse the results obtained by the PRISMA-included publications. A bibliometric analysis explores a dataset of publications for possible relationships between similar features, and was carried out using the bibliometrix tool in R [33]. Thus, four plots are presented below, representing a bibliometric overview of characteristics and correlations from the selected publications.

5.1. Author Productivity over Time

The graph seen in Figure 12 shows the top ten authors’ productivity over a set timeline, in this case, ranging from 2012 to 2022. This productivity over time is calculated in terms of the number of publications, along with the total citations per year [33]. It can be observed that R. Cupek is at the top of the list, followed by M. Demetgul, along with A. Santolamazza, M. Benedetti, F. Bonfa, and V. Cesarotti. The highest total citations in a year, along with the most citations per year, was achieved by M. Benedetti and F. Bonfa. These were followed by the already mentioned authors, R. Cupek and M. Demetgul, for their research on CA-related anomaly detection techniques. It can be observed that R. Cupek’s research ranges between 2013 to 2018, M. Demetgul’s research is within a two-year period between 2013 and 2014, while the Italian research team mainly published between 2018 and 2019. In addition to this, T. Kovács and A. Ko published their research in more recent years, from 2019 onwards.

5.2. Keyword Co-Occurrence Network

A keyword co-occurrence network was also plotted, as seen in Figure 13. The network plot shows three main node categories, which are coloured in red, blue, and green. The red nodes display the concepts of CA and learning systems for anomaly detection within this systematic review, as answered in RQ2. Additionally, this correlates with the blue group, where the four nodes show keywords for fault detection and pneumatic equipment. This correlation confirms that the selection of papers using the PRISMA protocol focused on CA-related applications that included anomaly detection techniques and involving an AI implementation. Overall, both the red and blue nodes hold a relationship with the green nodes, where this category shows the publications’ area of research and the main research efforts of anomaly detection techniques, as answered by both RQs 3 and 4. This category includes the terms ‘failure analysis’, ‘models’, ‘health management systems’, and ‘differential equations’. Hence, it further confirms how the included publications focus on anomaly detection techniques using AI for CA applications.

5.3. Three-Field Plot Analysis

The development of a three-field plot analysed correlations among the authors, author keywords, and source of publication, which were visualised using a Sankey diagram (Figure 14). Such a plot was deemed necessary as it points out the main keywords used, and by whom these were used, as well as where these were included. It can be easily observed that the three most common keywords with the strongest relationships with both the authors and the publication sources are ‘energy efficiency’, ‘compressed air’, and ‘machine learning’. This shows how the included publications’ aim is to implement anomaly detection techniques based on intelligent approaches, in this case, mainly using ML methods, in which the systems’ energy efficiency is enhanced as a positive effect. Once again, A. Santolamazza, M. Benedetti, and F. Bonfa, along with R. Cupek and M. Demetgul are shown in the first column of this plot. These have multiple correlations with the presented authors’ keywords. On the other hand, publication sources range within multiple research areas, mainly being energy- and intelligence-based conferences and articles.

5.4. Thematic Map

Another analysis implemented within this bibliometric discussion was the plotting of a thematic map, as seen in Figure 15. Thematic maps cluster keywords as part of a co-word analysis within the included publications. These are then represented in a two-dimensional diagram based on density, which is plotted on the y-axis, and the centrality plotted on the x-axis. Four main quadrants are introduced to represent the four main themes of this co-word analysis. These include niche, motor, emerging or declining, and basic themes. The different colours represent different clusters, the size of which show the quantity of the included terms or keywords [33].
The first quadrant shows all motor themes, which have both high centrality and density. These are the most relevant keywords within the research field of this systematic literature review [75]. This quadrant includes the term ‘artificial neural networks’, which nine publications used for CA-related anomaly detection [39,43,44,45,56,59,63,64,67,71]. Additionally, the terms ‘diagnosis strategy’ and ‘fault diagnosis’, along with ‘compressed air’, ‘compressed air systems’, and ‘decision trees’ are featured within this quadrant and were observed in [34,48,51,52,55,58,66]. The second quadrant shows the niche theme, which represents those terms or keywords that are highly developed and associated with isolated themes, since centrality is low, but density is high [75]. In this case, the terms ‘big data’, ‘rotating machinery’, ‘model’, and ‘classification’ are found within this quadrant. This means that within the included publications, these terms were not featured with others, but as isolated topics, though still being highly developed compared with NNs in general.
The third quadrant shows the emerging and declining themes, characterised by both low density and centrality. The term ‘neural network’ and ‘maintenance’ are part of this quadrant. From the results and critical review performed in Section 4, it can be deduced that manual maintenance interventions are on a declining trend as part of the introduction of intelligent approaches for anomaly detection. On the other hand, fault diagnosis strategies and the implementation of NNs for anomaly detection are increasing, as seen in Table 7. The fourth and last quadrant shows basic and transversal themes that have high centrality, but low density. This quadrant shows keywords that are relevant to the research field and still developing [75]. It makes sense that basic themes include the terms ‘fault detection’ and ‘pneumatics’, as these were included in the search string. Additionally, these two terms are the basis of what this systematic literature is about, i.e., anomaly detection techniques, represented by fault detection, for CA or pneumatic systems. Moreover, the term ‘learning systems’ appears within this quadrant, showing that the included publications are mainly based on intelligent approaches, which are still developing within the included studies of this review.

6. Conclusions

This study presented a systematic literature review for anomaly detection techniques based on intelligent approaches for CASs, subsystems, and components. This review followed the PRISMA protocol. After applying all exclusion criteria and removing any duplicates, 66 papers were selected, which were then subjected to a full-text eligibility assessment. This resulted in a total of 37 studies, which were either articles or conference papers. Although this systematic literature review followed a defined protocol and methodology with the use of the PRISMA guidelines, a number of limitations still exist. The number of included publications may be considered low compared to other similar review publications, but this means that research within this area is still developing, and gaps are still identified. Since this could also have been affected by the choice of keywords and databases, multiple elements were included within the formulated search string, while two databases were chosen. Simultaneously, to reduce any bias within this review, a number of CA and anomaly detection technique experts took part in drawing conclusions from the studies. All in all, generalisability issues were mitigated through the formulation of RQs and a bibliometric analysis, which allowed a critical analysis to be carried out.
Four RQs were presented within this systematic literature review to characterise the included publications. RQ1 aimed to identify the industry areas in which anomaly detection techniques are being studied. This resulted in three main areas—the aeronautical, locomotive, and manufacturing industries—with a major focus on the latter. RQ2 focused on the anomaly detection data type. The majority of publications involved parametric data collected from sensors that monitor the behaviour of the system or component, such as pressure, acceleration, vibration, and airflow sensors. This was followed by two more comprehensive RQs. The third aimed to identify how datasets were generated, from where, and what type of preprocessing was performed. It was shown that in general, all the generated datasets involved both normal and faulty conditions, so its use within the anomaly detection technique can be trained, tested, and validated. A number of different preprocessing techniques were observed, mainly depending on the type of application and the dataset generated. The final RQ then focused on the type of anomaly detection approaches within CA applications. It was shown that a trend exists from early publications in 2012 and 2013, where the majority applied a mathematical-based approach, to more intelligence-based approaches presented in the last few years, especially during 2019. The intelligent approaches were categorised within three main sections, including classification methods, NNs, and hybrid solutions, which involved both ML methods and time-series analysis. This was then followed by a bibliometric analysis for the PRISMA-included publications, as it was deemed necessary to analyse research characteristics, themes, and correlations in a quantitative and visualised manner. The bibliometrix tool within the R software environment was used and four types of plots were developed, including author productivity over time, a keyword co-occurrence network, a thematic map, and a three-field plot. Such visualisation methods clearly showed that the main focus of this systematic literature review is intelligent methods for anomaly detection of CASs.
This systematic literature review contributes a comprehensive overview of the work published in the last ten years. The analysis shows the relationships between industries and application areas (RQ1), and how anomaly detection actually takes place (RQ2–4). A few trends seem to emerge, particularly the focus of developing such techniques within the manufacturing sector, the prevalence of using parameter-based data, and the wide range of techniques used for detecting faults. By identifying the main characteristics and trends, there still exists a research gap that could be tackled as part of future work. There is still the need to perform a holistic approach while implementing intelligent technologies for an automated real-time process to detect, identify, and classify anomalies. Such a holistic approach would allow for the detection of anomalies within CASs, which if addressed in real time would result in result in reduced CA consumption and hence sustainable practices. This development was not observed within the included publications, where the implementation of the proposed methods was not taken a step further to be integrated within real-world operations. Principally, the included publications focused on how CA anomalies are to be extracted and detected from the generated datasets, being part of a prototyping phase.
This systematic literature review serves as a benchmark of the state-of-the-art research within this subject, where more academic effort is required to develop a CA anomaly detection technique based on an intelligent approach that operates in real time within a real-world case study. Future work of this research team will therefore focus on developing intelligent approaches for monitoring and improvement of CASs.

Author Contributions

Conceptualisation, J.M., E.F., P.X. and P.R.; methodology, J.M. and E.F.; validation, E.F., P.X. and P.R.; formal analysis, J.M.; investigation J.M., E.F., P.X. and P.R.; data curation, J.M.; writing—original draft preparation, J.M.; writing—review and editing, E.F., P.X. and P.R.; visualisation, J.M.; supervision, E.F., P.X. and P.R.; project administration, E.F. and P.R.; funding acquisition, E.F. and P.R. All authors have read and agreed to the published version of the manuscript.

Funding

This study was funded by the project Development and Analysis of an IndustRy 4.0 System to Autonomously ImproVE the Sustainability of Pneumatics—AIR SAVE (R&I-2020-008T), which is financed by the Fusion Technology Development Programme (TDP) of the Malta Council for Science and Technology (MCST). The project consortium comprises the University of Malta and the industrial partner, AIM Enterprises Ltd.

Data Availability Statement

No new data were created or analysed in this study. Data sharing is not applicable to this article.

Acknowledgments

The authors would like to thank AIM Enterprises Ltd. for their technical contribution and support.

Conflicts of Interest

The authors declare no conflict of interest.

References

  1. Oxford English Dictionary (OED). Anomaly, Noun: Oxford English Dictionary. 2023. Available online: https://www.oed.com/view/Entry/8043?redirectedFrom=anomaly+#eid (accessed on 9 January 2023).
  2. Ustundag, A.; Cevikcan, E. Industry 4.0: Managing the Digital Transformation, 1st ed.; Springer: Cham, Switzerland, 2018. [Google Scholar] [CrossRef]
  3. Mckane, A.T. Improving Compressed Air System Performance—A Sourcebook for Industry; U.S. Department of Energy: Washington, DC, USA, 2003. [Google Scholar]
  4. Elliott, B.S. Compressed Air Operations Manual; McGraw Hill: New York, NY, USA, 2006. [Google Scholar]
  5. Galar Pascual, D.; Daponte, P.; Kumar, U. Handbook of Industry 4.0 and SMART Systems, 1st ed.; CRC Press: Boca Raton, FL, USA, 2019. [Google Scholar] [CrossRef]
  6. Kusiak, A. Editorial: Intelligent manufacturing: Bridging two centuries. J. Intell. Manuf. 2019, 30, 1–2. [Google Scholar] [CrossRef] [Green Version]
  7. Jieyang, P.; Kimmig, A.; Dongkun, W.; Niu, Z.; Zhi, F.; Jiahai, W.; Liu, X.; Ovtcharova, J. A systematic review of data-driven approaches to fault diagnosis and early warning. J. Intell. Manuf. 2022, 33, 1–28. [Google Scholar] [CrossRef]
  8. Kim, S.W.; Kong, J.H.; Lee, S.W.; Lee, S. Recent Advances of Artificial Intelligence in Manufacturing Industrial Sectors: A Review. Int. J. Precis. Eng. Manuf. 2022, 23, 111–129. [Google Scholar] [CrossRef]
  9. Nti, I.K.; Adekoya, A.F.; Weyori, B.A.; Nyarko-Boateng, O. Applications of artificial intelligence in engineering and manufacturing: A systematic review. J. Intell. Manuf. 2022, 33, 1581–1601. [Google Scholar] [CrossRef]
  10. Fernandes, M.; Corchado, J.M.; Marreiros, G. Machine learning techniques applied to mechanical fault diagnosis and fault prognosis in the context of real industrial manufacturing use-cases: A systematic literature review. Appl. Intell. 2022, 52, 14246–14280. [Google Scholar] [CrossRef]
  11. Waltersmann, L.; Kiemel, S.; Stuhlsatz, J.; Sauer, A.; Miehe, R. Artificial intelligence applications for increasing resource efficiency in manufacturing companies—A comprehensive review. Sustainability 2021, 13, 6689. [Google Scholar] [CrossRef]
  12. Angelopoulos, A.; Michailidis, E.T.; Nomikos, N.; Trakadas, P.; Hatziefremidis, A.; Voliotis, S.; Zahariadis, T. Tackling Faults in the Industry 4.0 Era—A Survey of Machine-Learning Solutions and Key Aspects. Sensors 2020, 20, 109. [Google Scholar] [CrossRef] [Green Version]
  13. Çinar, Z.M.; Nuhu, A.A.; Zeeshan, Q.; Korhan, O.; Asmael, M.; Safaei, B. Machine learning in predictive maintenance towards sustainable smart manufacturing in industry 4.0. Sustainability 2020, 12, 8211. [Google Scholar] [CrossRef]
  14. Shin, I.; Lee, J.; Lee, J.Y.; Jung, K.; Kwon, D.; Youn, B.D.; Jang, H.S.; Choi, J.-H. A Framework for Prognostics and Health Management Applications toward Smart Manufacturing Systems. Int. J. Precis. Eng. Manuf. Technol. 2018, 5, 535–554. [Google Scholar] [CrossRef]
  15. Khan, S.; Tsutsumi, S.; Yairi, T.; Nakasuka, S. Robustness of AI-based prognostic and systems health management. Annu. Rev. Control. 2021, 51, 130–152. [Google Scholar] [CrossRef]
  16. Yu, J.; Zhang, Y. Challenges and opportunities of deep learning-based process fault detection and diagnosis: A review. Neural Comput. Appl. 2022, 35, 211–252. [Google Scholar] [CrossRef]
  17. Liu, Y.; Sun, R.; Jin, S. A survey on data-driven process monitoring and diagnostic methods for variation reduction in multi-station assembly systems. Assem. Autom. 2019, 39, 727–739. [Google Scholar] [CrossRef]
  18. Tercan, H.; Meisen, T. Machine learning and deep learning based predictive quality in manufacturing: A systematic review. J. Intell. Manuf. 2022, 33, 1879–1905. [Google Scholar] [CrossRef]
  19. European Commission; Directorate-General for Research and Innovation; Breque, M.; de Nul, L.; Petridis, A. Industry 5.0: Towards a Sustainable, Human-Centric and Resilient European Industry; Publications Office of the European Union: Luxembourg, 2021. [CrossRef]
  20. Page, M.J.; McKenzie, J.E.; Bossuyt, P.M.; Boutron, I.; Hoffmann, T.C.; Mulrow, C.D.; Shamseer, L.; Tetzlaff, J.M.; Akl, E.A.; Brennan, S.E.; et al. The PRISMA 2020 statement: An updated guideline for reporting systematic reviews. Syst. Rev. 2021, 10, 89. [Google Scholar] [CrossRef] [PubMed]
  21. IBM. What Is Industry 4.0 and How Does It Work? 2022. Available online: https://www.ibm.com/topics/industry-4-0 (accessed on 23 December 2022).
  22. Kusiak, A. Smart manufacturing. Int. J. Prod. Res. 2018, 56, 508–517. [Google Scholar] [CrossRef]
  23. Vaidya, S.; Ambad, P.; Bhosle, S. Industry 4.0—A Glimpse. Procedia Manuf. 2018, 20, 233–238. [Google Scholar] [CrossRef]
  24. Tedeschi, S.; Emmanouilidis, C.; Mehnen, J.; Roy, R. A design approach to IoT endpoint security for production machinery monitoring. Sensors 2019, 19, 2355. [Google Scholar] [CrossRef] [Green Version]
  25. Gilchrist, A. Industry 4.0—The Industrial Internet of Things; Apress: Berkeley, CA, USA, 2016. [Google Scholar] [CrossRef]
  26. Wan, J.; Li, X.; Dai, H.N.; Kusiak, A.; Martinez-Garcia, M.; Li, D. Artificial-Intelligence-Driven Customized Manufacturing Factory: Key Technologies, Applications, and Challenges. Proc. IEEE 2021, 109, 377–398. [Google Scholar] [CrossRef]
  27. Zdravković, M.; Panetto, H.; Weichhart, G. AI-enabled Enterprise Information Systems for Manufacturing. Enterp. Inf. Syst. 2022, 16, 668–720. [Google Scholar] [CrossRef]
  28. Alharin, A.; Doan, T.N.; Sartipi, M. Reinforcement learning interpretation methods: A survey. IEEE Access 2020, 8, 171058–171077. [Google Scholar] [CrossRef]
  29. Sanchez-Londono, D.; Barbieri, G.; Fumagalli, L. Smart retrofitting in maintenance: A systematic literature review. J. Intell. Manuf. 2022, 34, 1–19. [Google Scholar] [CrossRef]
  30. Wan, P.K.; Leirmo, T.L. Human-centric zero-defect manufacturing: State-of-the-art review, perspectives, and challenges. Comput. Ind. 2023, 144, 103792. [Google Scholar] [CrossRef]
  31. Jaskó, S.; Skrop, A.; Holczinger, T.; Chován, T.; Abonyi, J. Development of manufacturing execution systems in accordance with Industry 4.0 requirements: A review of standard- and ontology-based methodologies and tools. Comput. Ind. 2020, 123, 103300. [Google Scholar] [CrossRef]
  32. Ghasemi, Y.; Jeong, H.; Choi, S.H.; Park, K.B.; Lee, J.Y. Deep learning-based object detection in augmented reality: A systematic review. Comput. Ind. 2022, 139, 103661. [Google Scholar] [CrossRef]
  33. Aria, M.; Cuccurullo, C. bibliometrix: An R-tool for comprehensive science mapping analysis. J. Informetr. 2017, 11, 959–975. [Google Scholar] [CrossRef]
  34. De Assis Silva, L.; Sano, H.H.; Junior, C.L.N. Degradation Estimation Analysis of an Aeronautical Pneumatic Valve Using Machine Learning. In Proceedings of the SysCon 2022—16th Annual IEEE International Systems Conference, Montreal, QC, Canada, 25–28 April 2022; Institute of Electrical and Electronics Engineers Inc.: Piscataway, NJ, USA, 2022. [Google Scholar] [CrossRef]
  35. Graves, J.C.; Turcio, W.H.L.; Alvarez, J.; Yoneyama, T. Spectral Signatures of Pneumatic Actuator Failures: Closed-Loop Approach. IEEE/ASME Trans. Mechatron. 2018, 23, 2218–2228. [Google Scholar] [CrossRef]
  36. Parker. Clean and Dry Compressed Air for the Railway Industry. Charlotte, NC, USA, 2009. Available online: https://www.parker.com/literature (accessed on 9 January 2023).
  37. Wang, Q.; Gao, T.; Tang, H.; Wang, Y.; Chen, Z.; Wang, J.; Wang, P.; He, Q. A feature engineering framework for online fault diagnosis of freight train air brakes. Measurement 2021, 182, 109672. [Google Scholar] [CrossRef]
  38. Liu, Z.; Zhang, M.; Liu, F.; Zhang, B. Multidimensional Feature Fusion and Ensemble Learning-Based Fault Diagnosis for the Braking System of Heavy-Haul Train. IEEE Trans. Ind. Inform. 2021, 17, 41–51. [Google Scholar] [CrossRef]
  39. Sun, X.; Ling, K.V.; Sin, K.K.; Liu, Y. Air Leakage Detection of Pneumatic Train Door Subsystems Using Open Set Recognition. IEEE Trans. Instrum. Meas. 2021, 70, 3522009. [Google Scholar] [CrossRef]
  40. Bartyś, M.; Patton, R.; Syfert, M.; de las Heras, S.; Quevedo, J. Introduction to the DAMADICS actuator FDI benchmark study. Control. Eng. Pract. 2006, 14, 577–596. [Google Scholar] [CrossRef]
  41. Venkata, S.K.; Rao, S. Fault detection of a flow control valve using vibration analysis and support vector machine. Electronics 2019, 8, 1062. [Google Scholar] [CrossRef] [Green Version]
  42. Yerra, M.; Nasipuri, A.; Duemmler, H. Sequential state logic for pneumatic valve monitoring using piezo film sensors. In Proceedings of the IEEE SOUTHEASTCON, Concord, NC, USA, 30 March–2 April 2017; Institute of Electrical and Electronics Engineers Inc.: Piscataway, NJ, USA, 2017. [Google Scholar] [CrossRef]
  43. Subbaraj, P.; Kannapiran, B. Fault detection and diagnosis of pneumatic valve using Adaptive Neuro-Fuzzy Inference System approach. Appl. Soft Comput. 2014, 19, 362–371. [Google Scholar] [CrossRef]
  44. Kovács, T.; Kő, A. Monitoring Pneumatic Actuators’ Behavior Using Real-World Data Set. SN Comput. Sci. 2020, 1, 196. [Google Scholar] [CrossRef]
  45. Kovács, T.; Kő, A. Machine learning based monitoring of the pneumatic actuators’ behaviour through signal processing using real-world data set. In Future Data and Security Engineering; Dang, T.K., Kung, J., Takizawa, M., Bui, S.H., Eds.; Springer: Cham, Switzerland, 2019; pp. 33–44. [Google Scholar] [CrossRef]
  46. Andrade, A.; Lopes, K.; Lima, B.; Maitelli, A. Development of a methodology using artificial neural network in the detection and diagnosis of faults for pneumatic control valves. Sensors 2021, 21, 853. [Google Scholar] [CrossRef]
  47. Han, X.; Jiang, J.; Xu, A.; Huang, X.; Pei, C.; Sun, Y. Fault Detection of Pneumatic Control Valves Based on Canonical Variate Analysis. IEEE Sens. J. 2021, 21, 13603–13615. [Google Scholar] [CrossRef]
  48. Mahalingam, P.; Kalpana, D.; Thyagarajan, T. Overfit analysis on decision tree classifier for fault classification in DAMADICS. In Proceedings of the IEEE Madras Section International Conference (MASCON 2021), Chennai, India, 27–28 August 2021; Institute of Electrical and Electronics Engineers Inc.: Piscataway, NJ, USA, 2021. [Google Scholar] [CrossRef]
  49. Elakkiya, V.; Ram Kumar, K.; Gomathi, V.; Rakesh Kumar, S. Investigation of fault detection techniques for an industrial pneumatic actuator using neural network: DAMADICS case study. In Advances in Intelligent Systems and Computing; Springer: Cham, Switzerland, 2015; pp. 237–246. [Google Scholar] [CrossRef]
  50. Korablev, Y.A.; Logutova, N.A.; Shestopalov, M.Y. Neural network application to diagnostics of pneumatic servo-motor actuated control valve. In Proceedings of the International Conference on Soft Computing and Measurements (SCM 2015), Saint Petersburg, Russia, 19–21 May 2015; Institute of Electrical and Electronics Engineers Inc.: Piscataway, NJ, USA, 2015; pp. 42–46. [Google Scholar] [CrossRef]
  51. Dobossy, B.; Formanek, M.; Stastny, P.; Spacil, T. Fault detection and identification on pneumatic production machine. In Proceedings of the Modelling and Simulation for Autonomous Systems: 8th International Conference (MESAS 2021), Online, 13–14 October 2021; Mazal, J., Fagiolini, A., Vasik, P., Turi, M., Bruzzone, A., Pickl, S., Neumann, V., Stodola, P., Eds.; Lecture Notes in Computer Science; Springer International Publishing: Cham, Switzerland, 2022; Volume 13207, pp. 39–61. [Google Scholar] [CrossRef]
  52. Rajashekarappa, M.; Lene, J.; Bekar, E.T.; Skoogh, A.; Karlsson, A. A data-driven approach to air leakage detection in pneumatic systems. In Proceedings of the Global Reliability and Prognostics and Health Management (PHM-Nanjing 2021), Nanjing, China, 15–17 October 2021; Institute of Electrical and Electronics Engineers Inc.: Piscataway, NJ, USA, 2021. [Google Scholar] [CrossRef]
  53. Cupek, R.; Ziebinski, A.; Zonenberg, D.; Drewniak, M. Determination of the machine energy consumption profiles in the mass-customised manufacturing. Int. J. Comput. Integr. Manuf. 2018, 31, 537–561. [Google Scholar] [CrossRef]
  54. Cupek, R.; Ziebinski, A.; Drewniak, M.; Fojcik, M. Estimation of the number of energy consumption profiles in the case of discreet multi-variant production. In Intelligent Information and Database Systems Part II; Nguyen, N.T., Duong, H.H., Hong, T.-P., Pham, H., Trawinski, B., Eds.; Springer: Cham, Switzerland, 2018. [Google Scholar] [CrossRef]
  55. Demetgul, M. Fault diagnosis on production systems with support vector machine and decision trees algorithms. Int. J. Adv. Manuf. Technol. 2013, 67, 2183–2194. [Google Scholar] [CrossRef]
  56. Demetgul, M.; Yazicioglu, O.; Kentli, A. Radial Basis and LVQ Neural Network Algorithm For Real Time Fault Diagnosis of Bottle Filling Plant. Teh. Vjesn.-Tech. Gaz. 2014, 21, 689–695. [Google Scholar]
  57. Demetgul, M.; Yildiz, K.; Taskin, S.; Tansel, I.N.; Yazicioglu, O. Fault diagnosis on material handling system using feature selection and data mining techniques. Measurement 2014, 55, 15–24. [Google Scholar] [CrossRef]
  58. Cabrera, D.; Guamán, A.; Zhang, S.; Cerrada, M.; Sánchez, R.-V.; Cevallos, J.; Long, J.; Li, C. Bayesian approach and time series dimensionality reduction to LSTM-based model-building for fault diagnosis of a reciprocating compressor. Neurocomputing 2020, 380, 51–66. [Google Scholar] [CrossRef]
  59. Cui, C.; Lin, W.; Yang, Y.; Kuang, X.; Xiao, Y. A novel fault measure and early warning system for air compressor. Measurement 2019, 135, 593–605. [Google Scholar] [CrossRef]
  60. Holstein, P.; Moeck, S.; Tschöpe, C.; Duckhorn, F.; Kolbe, P.; Hennecke, M. Monitoring of compressor operations—A machine learning approach. In Proceedings of the 26th International Congress on Sound and Vibration, Montreal, QC, Canada, 7–11 July 2019. [Google Scholar]
  61. Bonfá, F.; Benedetti, M.; Ubertini, S.; Introna, V.; Santolamazza, A. New efficiency opportunities arising from intelligent real time control tools applications: The case of compressed air systems’ energy efficiency in production and Useenergy. Procedia 2019, 158, 4198–4203. [Google Scholar] [CrossRef]
  62. Benedetti, M.; Bonfà, F.; Introna, V.; Santolamazza, A.; Ubertini, S. Real time energy performance control for industrial compressed air systems: Methodology and applications. Energies 2019, 12, 3935. [Google Scholar] [CrossRef] [Green Version]
  63. Santolamazza, A.; Cesarotti, V.; Introna, V. Anomaly detection in energy consumption for Condition-Based maintenance of Compressed Air Generation systems: An approach based on artificial neural networks. IFAC-Pap. 2018, 51, 1131–1136. [Google Scholar] [CrossRef]
  64. Santolamazza, A.; Cesarotti, V.; Introna, V. Evaluation of machine learning techniques to enact energy consumption control of compressed air generation in production plants. In Proceedings of the XXIII Summer School “Francesco Turco”—Industrial Systems Engineering, Palermo, Italy, 12–14 September 2018. [Google Scholar]
  65. Kosturkov, R.; Nachev, V.; Titova, T. Diagnosis of Pneumatic Systems on Basis of Time Series and Generalized Feature for Comparison with Standards for Normal Working Condition. TEM J. 2021, 10, 183–191. [Google Scholar] [CrossRef]
  66. Prashanth, K.; Elangovan, M. Vibration Based Fault Monitoring of a Compressor using Tree-based Algorithms. IOP Conf. Ser. Mater. Sci. Eng. 2019, 577, 012116. [Google Scholar] [CrossRef]
  67. Desmet, A.; Delore, M. Leak detection in compressed air systems using unsupervised anomaly detection techniques. In Proceedings of the Annual Conference of the PHM Society, St. Petersburg, FL, USA, 2–5 October 2017; Volume 9. [Google Scholar] [CrossRef]
  68. Cupek, R.; Folkert, K.; Huczala, L.; Zonenberg, D.; Tomczyk, J. End-point device compressed air consumption analysis by reverse engineering algorithm. In Proceedings of the Industrial Electronics Conference (IECON), Vienna, Austria, 10–13 November 2013; pp. 7519–7524. [Google Scholar] [CrossRef]
  69. Liao, P.; Cai, M.; Shi, Y.; Fan, Z. Compressed air leak detection based on time delay estimation using a portable multi-sensor ultrasonic detector. Meas. Sci. Technol. 2013, 24, 055102. [Google Scholar] [CrossRef]
  70. Santos, R.B.; de Almeida, W.S.; da Silva, F.V.; da Cruz, S.L.; Fileti, A.M.F. Spectral Analysis for Detection of Leaks in Pipes Carrying Compressed Air. Chem. Eng. Trans. 2013, 32, 1363–1368. [Google Scholar] [CrossRef]
  71. Thabet, M.; Sanders, D.; Becerra, V.; Tewkesbury, G.; Haddad, M.; Barker, T. Intelligent Energy Management of Compressed Air Systems. In Proceedings of the IEEE 10th International Conference on Intelligent Systems (IS), Varna, Bulgaria, 28–30 August 2020; pp. 153–158. [Google Scholar] [CrossRef]
  72. Liu, D.; Jiang, D.; Chen, X.; Luo, A.; Xu, G. Research on fault identification for complex system based on generalized linear canonical correlation analysis. In Proceedings of the IEEE International Conference on Automation Science and Engineering, Seoul, Republic of Korea, 20–24 August 2012; pp. 474–478. [Google Scholar] [CrossRef]
  73. ScienceDirect Topics. Feature Extraction—An Overview. 2022. Available online: https://www.sciencedirect.com/topics/engineering/feature-extraction (accessed on 6 February 2023).
  74. Deep, A. Feature Extraction Definition. 2022. Available online: https://deepai.org/machine-learning-glossary-and-terms/feature-extraction (accessed on 6 February 2023).
  75. Herrera-Viedma, E.; López-Robles, J.R.; Guallar, J.; Cobo, M.J. Global trends in coronavirus research at the time of COVID-19: A general bibliometric approach and content analysis using SciMAT. Prof. Inf. 2020, 29, 1–20. [Google Scholar] [CrossRef]
Figure 1. Search term elements.
Machines 11 00750 g001
Figure 2. PRISMA flow diagram for this systematic literature review paper.
Machines 11 00750 g002
Figure 3. Annual scientific production plot with bibliometrix.
Machines 11 00750 g003
Figure 4. Most relevant keywords plot from 2012 to 2022 with bibliometrix.
Machines 11 00750 g004
Figure 5. Pie chart for RQ1 showing the main research area applications.
Machines 11 00750 g005
Figure 6. Pie chart for RQ1 showing the main research trends for the manufacturing industry.
Machines 11 00750 g006
Figure 7. Pie chart for RQ2 showing the two main concepts for anomaly detection data types.
Machines 11 00750 g007
Figure 8. Pie chart for RQ3 showing the three categories of dataset generation types.
Machines 11 00750 g008
Figure 9. Pie chart for RQ3 showing the three categories of dataset preparation types.
Machines 11 00750 g009
Figure 10. Pie chart for RQ4 showing the different types of anomaly detection techniques.
Machines 11 00750 g010
Figure 11. RQ correlation diagram.
Machines 11 00750 g011
Figure 12. Top authors’ production over time plot with ‘bibliometrix’.
Machines 11 00750 g012
Figure 13. Keyword co-occurrence plot with ‘bibliometrix’.
Machines 11 00750 g013
Figure 14. Three-field plot with ‘bibliometrix’.
Machines 11 00750 g014
Figure 15. Thematic map with ‘bibliometrix’.
Machines 11 00750 g015
Table 1. RQ identification.
IDRQ
RQ1In which industry and at which system level has the application of anomaly detection in CAS using intelligent approaches been researched?
RQ2Which type of CAS data have been extracted for the development of the anomaly detection technique?
RQ3How is the dataset generated and prepared for the implementation of the CAS anomaly detection technique?
RQ4What type of intelligent approach-based CAS anomaly detection technique was implemented and why?
Table 2. Exclusion criteria.
IDExclusion Criteria Description
EC1Publication duplicates.
EC2Studies published before 2012.
EC3Studies not in the English language.
EC4Publications not available as a full-length article.
EC5A publication that is not a book chapter, article, conference proceedings.
EC6Publications not within the engineering, data science and energy research fields.
Table 4. RQ2 results—anomaly detection concept.
Anomaly Detection ConceptStudies
Parameter-Based Approach[34,35,37,38,39,41,42,43,44,45,46,47,48,49,50,51,52,55,56,57,58,59,60,65,66,67,69,70,72]
Energy Consumption Approach[53,54,61,62,63,64,68,71]
Table 5. RQ3 part 1 results—dataset generation.
Dataset Generation TechniqueStudies
Simulation Approach[34,35,46,47,48,49,50]
Experimental Lab-Based Setups[37,39,41,42,43,51,53,54,55,56,57,58,65,66,68,69,70,72]
Real-World CAS Installation in Industry[38,44,45,47,52,59,60,61,62,63,64,67]
Table 6. RQ3 part 2 results—dataset preparation.
Dataset Preparation TechniqueStudies
No Preprocessing[35,46,47,48,49,50,55,56,61,62,63,64,65,68,69,70,72]
PreprocessingFeature ExtractionHysteresis Envelopes[34]
Window Approach[41,59]
Dimensionality Reduction with an AI Method[37,53,54,57,66]
Condition Indicator Extraction[51,52]
Time SeriesTime-Domain Condition Indicator Extraction[58]
Wavelet Transform[38,67]
Fourier Transform [60]
Time-Series Dimensionality Reduction[39,42,44,45]
Knowledge-Based Method[43,71]
Table 7. RQ4—anomaly detection techniques.
Anomaly Detection TechniqueStudies
Mathematical ApproachesGeneralTime-Delay Estimation[69]
Reverse Engineering[68]
Spectral Analysis[35,70]
Canonical Approach[47,72]
Quality-Control-Based SolutionControl and CuSum Plots[61,62]
Time-Series ApproachMathematical Indicators[65]
SSL[42]
Classification MethodsK-Means[53,54]
[57]
Decision TreesRUSBoosted[52]
CART[48]
J48, RF, REPT[66]
QUEST, CandRT, C5.0, CHAID[55]
SVM[41,55]
Neural NetworksANNCNN[39]
BP, MSET[59]
MFFNN[43,63]
RB, LVQ[56]
NARX[46,49]
ANFIS[43,50]
Comparative AnalysisMultiple ML Methods Based on Different ModelsOLS, kNN, DT, RF, XGB[34]
kNN, DT, SVM, DA[51]
ML, ANNs, Fuzzy Systems[71]
Clustering Method, ANN[44,45]
SVM, ANN[64]
RF, LOF, AE[67]
Hybrid Methods and Comparative Analysis Time-Series Approach with AI Methods + Intelligent Methods Comparison1DCNN, RF[37]
Gradient-Boosting RF and Time-Series Analysis[38]
RF, CART, kNN, LSTM, AE[58]
DNNs, SVM[60]
Disclaimer/Publisher’s Note: The statements, opinions and data contained in all publications are solely those of the individual author(s) and contributor(s) and not of MDPI and/or the editor(s). MDPI and/or the editor(s) disclaim responsibility for any injury to people or property resulting from any ideas, methods, instructions or products referred to in the content.

