Abstract
This paper aims to apply the novel integrated Value Engineering and Risk Assessment (VENRA) framework for measuring shipyard performance based on the combination of fuzzy Decision Making Trial and Evaluation Laboratory (DEMATEL) and Analytic Hierarchy Process (AHP) tools. These are used to assess the criteria cause-effect and weight ranking analysis, considering the causal and affected groups while prioritising the criteria and sub-criteria ranking. A shipyard case study was used to apply the proposed framework, showing that the shipyard with a high personnel’s safety group is majorly more important than the environmental impact. The combination of hybrid MCDM tools has enhanced the process of determining the criteria analysis. Waste management has become the most impacting attribute amongst the criteria group, while the HSE department is the most critical criterion. However, the green energy used is still a minor factor as it is still not fully exploited within the existing shipyard and has not been fully supported by existing regulations yet.
1. Introduction
Ship manufacturing, which includes new shipbuilding, ship repair and maintenance, and ship conversion, is a complex industry, having to build, repair or convert a complex asset, such as a ship. Shipbuilding and ship repair acquire specific knowledge of managerial, financial, contractual, and other aspects within the marine industry, which differs from the general manufacturing sector. As this requires a unique ability to consider (among others, the shipyard has a slow-yielding business, and the payback period is relatively long [1] could be more than 15 years), the parameters used to measure the shipyard’s performance require a different set of criteria to be developed.
The challenge of a future greener shipyard needs a new performance measurement as the current studies show that the focus is more on technological, business, and supply chain aspects, and these are fragmented. Integrating these aspects, including personnel safety and environmental impact on shipyard performance, is urgently required. Furthermore, the shipyard industry has not been governed yet by International Maritime Organization (IMO) as part of Greenhouse gas (GHG) emission contributors. In a reference study by Chatzinikolaou and Ventikos [2], shipyards contribute about 2% and 1% to shipbuilding and ship repair in GHG emissions impacts in the marine sector, which needs to be considered
Performance measuring tools can determine the element of “what industry performance should be based on a number of attributes”. This tool is critical to developing a competitive company to enhance value, quality, resilience, and manufacturing cost. The appropriate critical screening of components also involves choosing what aspects of corporate achievement should be examined since they determine how the assessment is undertaken, influencing the process of decision-making [3]. Concerning this condition, selecting appropriate parameters for performance measurement remains essential in shipyards as it impacts the results and further strategic steps to improve the existing gaps for future challenges.
This study aims to develop a novel performance assessment for the ship-manufacturing industry through the concept of integrated Value Engineering and Risk assessment. The framework incorporates the five criteria groups: Technical, Business, External, Personnel’s Safety and Environment groups. The combination of Value Engineering and Risk Assessment provides a systematic methodology for enhancing value (quality, cost and delivery) while reducing the risk in terms of safety and environment, which is the potential to be implemented for shipyard performance measurement. Specifically, this research demonstrates the Personnel’s Safety and Environment group as part of all VENRA criteria and is applied in a shipyard case study. In addition, since it uses MCDM tools to assess the criteria analysis, it proposes a new methodology of fuzzy DEMATEL-AHP to gain improved results in assessing the criteria cause-effect and weight analysis.
The following are the remaining sections: The second section explores the literature and critically examines performance measurement in ship manufacturing models, Value Engineering and Risk Assessment concept, and fuzzy Multi-Criteria Decision Making (MCDM). Section 3 presents the detailed VENRA framework, followed by the application in a shipyard case study and findings in Section 4. Section 5 contains the paper’s discussion and is closed with conclusions and future works.
2. Literature and Critical Review
This section has three main parts. The review process is conducted by investigating the existing literature through Scopus, ScienceDirect and Emerald journal articles databases along with the Google Scholars database using specific keywords, such as performance measurement in shipyards, shipbuilding, ship repair and maintenance, Value Engineering and Risk Assessment in construction projects and marine sector (ship design, ship construction, ship production), and fuzzy DEMATEL and AHP tools used in the marine sector. A number of noteworthy articles were identified for use in this paper. However, for consistency and space requirements, the most relevant papers are included in the literature and critical review section.
2.1. The Models in Ship-Manufacturing Performance Assessment
In the first instance, the ship-manufacturing or called as shipyard’s performance is measured based on productivity as person-hour/Compensated Gross Tonnage (CGT), which is used for shipbuilding and has been revised and updated with the latest one in 2007 by OECD [4]. Currently, person-hour/CGT is still applicable and used as a measurement, such as a study by Roque and Gordo [5], who proposed a holistic method to measure shipbuilding productivity by cost centre. However, this productivity model cannot accommodate another influencing factor as it only measures the man-hour recorded, the type of the ship, such as general cargo or passenger ships and CGT measurement, which considers the ship size and the work content.
The Data Envelopment Analysis (DEA) tool is proposed for assessing shipyard performance since it provides a comprehensive approach by considering various influencing factors. This model incorporates both quantitative metrics and qualitative attributes through an input-output framework. Several studies, such as Chao and Yeh [6], Pires et al. [7], and Rabar et al. [8], have utilised DEA to compare shipyard competitiveness, benchmark shipbuilding performance, and analyse dry-docking performance, respectively. DEA enhances the inclusion of influencing factors and can be integrated with other tools and methodologies. However, DEA’s limitations include the requirement of sufficient data, which requires the ratio of Decision Making Units (DMUs) to analysed factors to be at least twice the combined inputs and outputs attributes [9,10], or it needs a minimum of three DMUs per the number of input and output parameters count [11]. The other limitation is that the DEA approach is a non-parametric method and is unable to determine the attribute’s rank.
The enhanced model for shipyard performance utilises multi-criteria decision-making (MCDM), as demonstrated in studies, such as Gavalas et al. [12] on assessing shipbuilding performance indicators and Sahin et al. [13] on selecting the best shipyard. It has also been employed to analyse the shipbuilding sector’s barrier factors in achieving net-zero emissions [14]. The MCDM approach improves the assessment process by considering multiple factors, determining the criteria ranking, and comprehensively assessing shipyard performance. However, there is limited literature on the application of the MCDM model specifically for shipyard performance. Baihaqi et al. [15] proposed developing a multi-transdisciplinary framework, suggesting a number of criteria and applied to the shipyard performance measurement with the case study in the technical aspect through a hybrid MCDM approach.
Since the MCDM models have advantages, the next issue in shipyard performance is which criteria should be included in the measurement. The productivity model only includes the person-hour and CGT, presenting the ship type complexity and size. In DEA models, a number of criteria can be included, such as technology and industrial environment [16]. The MCDM model also can include various factors and dimensions, such as a study by Kafali et al. [17], who evaluated the shipbuilding cutting technologies for piping through criteria involving cost, risk, and performance, which break down into several sub-criteria, showing that worker safety is more important than environmental impact. Another study [14] analysed the barrier factors in applying the green energy used for shipyards which dominate with cost factors. However, no framework integrates multi-dimension criteria for shipyard manufacturing performance measurement.
2.2. Integrated Value Engineering and Risk Assessment
Since the influencing criteria included in shipyard performance are scattered, and there is no guidance in determining the selected criteria, a framework is required to develop this and assess the measuring process. A balanced scorecard framework from Kaplan and Norton can include four dimensions: customer, financial, internal and innovation and learning dimensions [18], and this approach has also been applied in shipbuilding to assess shipbuilding indicators [12]. The other potential framework is Tree Bottom Line (TBL), which incorporates three dimensions: people, the economy and the environment. This TBL approach has also been applied to investigate the risk analysis models for the ship recycling sector [19]. However, both models only accommodate non-flexible and limited dimensions. The balanced scorecard model integrates the parameters which focus on the financial or business and has no basic guidelines for selecting performance measures as well as has complex feedback from the financial perspective to the customer and process perspectives [20]. On the other hand, the TBL model is limited to the three dimensions mentioned above and cannot accommodate the criteria’s flexible dimensions.
Value Engineering (VE), introduced by Laurence D. Miles in the late 1940s, has a systematic process that aims to improve the value and quality of a product or service while simultaneously reducing costs [21,22]. This approach involves multidisciplinary experts from various fields throughout the steps called the VE-jobs plans. This approach can be effectively combined with many tools, such as the combination with gray multi-criteria approach for decision-making [23], Quality Function Deployment (QFD) [24], sustainability considerations in construction projects [25], and concept of design for assembly for project development in products [26]. Furthermore, this concept can also be incorporated with risk assessment practices and applied in the automotive industry through the Function Analysis System Technique (FAST) and Failure Mode and Effect Analysis (FMEA) as proposed by Anđelić et al. [27] and in the domain of construction project management as discussed by Masengesho et al. [28]. Nevertheless, it is worth noting that according to Baihaqi et al. [29], the integrated VENRA concept has primarily been analysed theoretically and qualitatively, with limited practical application within the marine sector.
Drawing upon the systematic concept of integrated VENRA, this framework can be employed to incorporate more flexible criteria proposed for ship-manufacturing performance assessment. Moreover, as previously elucidated, the utilisation of multidimensional experts in VE eliminates the limitations typically associated with individual experts in each specific dimension and facilitates comprehensive improvement across multiple dimensions.
2.3. Fuzzy DEMATEL and AHP
DEMATEL is a tool that can provide a cause-effect analysis and support the weighting process of criteria used, which on the other hand, is very limited within the MCDM-relevant research field. This tool can deal with a number of complex attributes in the decision-making process and simultaneously determines the causal and affected criteria group and provides the criteria ranking [30,31]. This MCDM tool can be combined with Fuzzy Set Theory (FST), as introduced by Zadeh [32], and incorporated into fuzzy DEMATEL, removing the numerical way and subjectivity in the assessment process and using a linguistic approach, which is more natural for experts.
The fuzzy DEMATEL tool has been applied in marine sectors, especially in assessing the causal factors, such as the study by Kuzu [33] in analysing the causal factors affecting the accident of break-in two of ship hull construction and the research by Soner [34] in analysing the causal factors affecting the accidents/incidents in confined space on shipboard. It also has been applied in ship recycling safety management [19], port performance measurement [35] and also in assessing shipbuilding indicators [12]. However, limited studies use fuzzy DEMATEL to assess the criteria weight in marine shipyard performance, and the results for criteria weighting are relatively not too strong [36]. Combining this fuzzy DEMATEL with other tools can enhance the weighting analysis methodology.
There are many criteria weighting methods used in MCDM tools, such as Simple Additive Weighting, Weighted Evaluation Technique (WET), and Analytical Neural Process (ANP). However, the tool that is well-applied and considers a consistency ratio index is Analytical Hierarchy Process (AHP), which was introduced by Saaty [37]. A review of new weighting methods in MCDM tools also shows that AHP provides a thorough and robust approach for weighting analysis applicable in many sectors [38]. The AHP tool has been widely applied in the marine sector as well, such as for selecting the best shipyard integrated with FST tool [13] and analysing the barrier factors in implementing green energy in shipbuilding [14]. However, to the best of the authors’ knowledge, there is no study in the present literature combining fuzzy DEMATEL and AHP in assessing a number of criteria in the marine sector, especially those associated with shipyard performance measurement.
This paper has two contributions. First, it presents the development of a novel integrated VENRA framework as a new performance assessment for the ship manufacturing industry. Second, it suggests a new hybrid approach, proposing the combined fuzzy DEMATEL and AHP methodology to analyse the attribute cause-effect and ranking.
3. The VENRA Framework
Figure 1 presents the novel VENRA framework for the ship-manufacturing performance measurement. It consists of three main parts: Developing the VENRA criteria model, the criteria assessment process through MCDM tools and the shipyard assessment through the collected shipyard’s case study data. After the shipyard’s performance is measured, suggestions or recommendations are provided for future enhancement, filling the existing gaps to improve or maintain the shipyard’s condition.
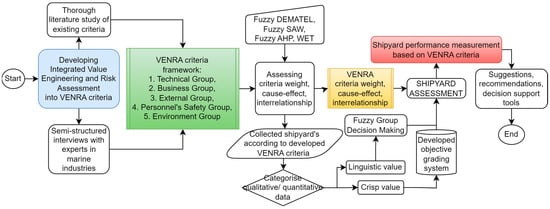
Figure 1.
The novel VENRA performance measurement framework for ship-manufacturing.
The development of criteria models for shipyard performance entails integrating knowledge from integrated Value Engineering and Risk Assessment. This is achieved through a combination of existing literature and expert interviews. The collected criteria are then evaluated using MCDM tools, such as fuzzy DEMATEL, fuzzy SAW, fuzzy AHP, or WET, which aim to determine weight rankings, interrelationships, and cause-effect analyses. Simultaneously, the shipyard’s data, aligned with the established criteria, is assessed using a combination of qualitative and quantitative approaches, such as an objective grading system or fuzzy group decision-making. The scores obtained from assessing the attributes and the shipyard’s data are incorporated to measure overall shipyard performance. The resulting measured results can serve as valuable support for stakeholders’ future strategic decision-making processes. The following sub-section introduces the VENRA criteria framework and elements in more detail.
3.1. VENRA Criteria Framework
As shown in Figure 1, the developed framework includes five criteria groups called the VENRA criteria framework. Since it consists of several criteria, the VENRA criteria are explained further in more detail in Figure 2. The Technical Group comprises six criteria, the Business Group encompasses eight criteria, and the External Group includes three criteria. The Personnel’s Safety has six criteria while the Environment Groups include five criteria. These criteria are specifically formulated based on the principles of VENRA, aiming to optimise value (cost, quality, time) while concurrently minimising risk.

Figure 2.
The development of VENRA criteria for ship-manufacturing performance.
The incorporated five groups and criteria are suggested as ship-manufacturing’s new performance measurement attributes. The first three groups have several sub-criteria, which are very extensive and detailed. Since the number of criteria and detailed explanation of criteria and sub-criteria are extensive and considering the typical space requirement in this paper, the Personnel’s Safety and Environment groups are presented and explained in more detail, as shown in Table 1. The subsequent articles will include comprehensive descriptions of the remaining categories.

Table 1.
VENRA framework personnel’s safety and environment criteria.
S1 attribute refers to the role of the HSE department in managing shipyard safety, specifically for workers, such as providing the Standard safety operating procedures, controlling the execution and providing a mitigating action to prevent or minimise the risk to personnel’s safety. S2 criterion includes the establishment of shipyard’s policy to enhance the shipyard’s personnel safety which is beyond the minimum safety standard. The S3 criterion describes the availability and expiration date of the shipyard’s safety certification, such as ISO or OHSAS. The S4 criterion refers to the recorded periodic safety training conducted by the shipyard and how the training is delivered (in person or online) for office and production line workers. S5 and S6 refer to the minor and major recorded incidents/accidents within a specific time, such as annually, five years or ten years and the type of incidents/accidents that occurred (skin burn, head hit, fall, leg broken, death).
On the other hand, En1 refers to standard operating procedures to handle waste management, either dangerous or non-dangerous and how it is implemented in the shipyard. En2 and En3 include the storage availability of dangerous and non-dangerous goods and how the shipyard handles them if the storage is unavailable. En4 refers to the availability and condition of covered sandblasting workshops for raw materials and assembly parts of ship construction, including the sand type used (is it environmentally friendly or not), the type of blasting techniques (wet or dry), and equipment condition. En5 includes the shipyard’s stage to implement green energy use (plan, partially implemented, majorly implemented), including the use of low-energy-efficient machinery and lighting, the use of environmentally friendly energy resources (either external or internal), and the effort to reduce energy consumption.
3.2. Methodology
The flowchart of the methodology combining fuzzy DEMATEL and AHP is presented in Figure 3. A detailed explanation of each methodology is presented in the next sub-subsection.
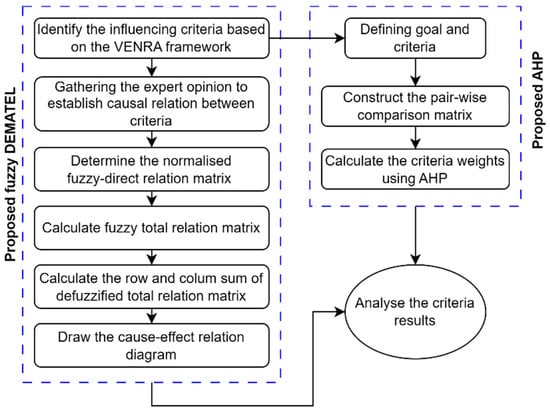
Figure 3.
Fuzzy DEMATEL and AHP methodology for criteria assessment (weight and cause-effect).
3.2.1. Fuzzy DEMATEL
The typical scale used in fuzzy DEMATEL is from 0 to 4, which is relatively conventional but too narrow to handle the wider scale required for expert opinion. Fuzzy DEMATEL uses a modified version of the scale created by Chen and Hwang [39], as indicated in Table 2.
Table 2.
Fuzzy DEMATEL scale linguistic and abbreviation used for evaluation.
Step 1 to step 7, in the following paragraph, presents the fuzzy DEMATEL methodology, starting from obtaining the fuzzy direct-relation matrix to constructing the cause-effect diagram.
Step 1. Experts’ pairwise comparisons of the criteria are used in step 1 to construct a × fuzzy direct-relation matrix . The criterion which is affected by the criterion is presented by its components as presented in . Table 3 details the grading and weighting used to determine the expers degree of level based on their formal degree education background, experience in the industry, and experience in academic working.
Table 3.
Scoring model for grading the experts level.
Let’s suppose that the weight of expert’s opinion ( = 1, 2,…, ) is , which each expert’s relative importance is calculated. It starts with gathering the experts’ profile data which is scored according to the expert’s scoring model in Table 3, and then calculating each score as . Eventually, it defines the expert’s importance degree, , as follows:
As a result, the acquired aggregated experts in the form of a × fuzzy direct-relation matrix become:
Step 2. Using Equation (3), get the normalised fuzzy direct-relation matrix
where .
Step 3. Classify the three crisp matrices (low, middle, upper) based on , where .
Step 4. Use Equations (4)–(7) to derive the fuzzy total-relation matrix .
Matrices with ones on the main diagonal and zeros everywhere else are called identity matrices, abbreviated as I.
Step 5. Matrix defuzzification to find the best non-fuzzy performance (BNP) of matrices using centre of area (COA) method (Equation (8)) and calculate the sum influence matrix for each group of attributes.
Step 6. Calculate and determine the causal and affected criteria group as well as the ranking of criteria. It starts with summing up the row sum () and column sum () in the total influence matrix. The score of () determine the causal or impacted factors, in which the positive one means the attribute is classified as the causal factor, whereas if it is negative, the factor is classified as the affected group. The () scores provide importance score or weight or criteria, where the higher has more important level.
Step 7. Based on the score of () and (), the cause-effect relation graph is created where () score refers to the axis and and () score refers to the ordinate.
3.2.2. Analytic Hierarchy Process (AHP)
The fuzzy DEMATEL is combined with AHP in this research to strengthen the weight determination of criteria. First, the pairwise evaluation matrix of all the criteria is constructed and then is scored using the AHP scale in Table 4 to the pairwise comparisons by expert judgementa as to the following matrix .
Table 4.
Pairwise comparison scale for the AHP method.
The next step is to calculate the standardised matrix by dividing each matrix by the sum of each column. The weight is gained by averaging each attribute’s row matrix and converting it into percentages.
The next step is calculating the consistency ratio (). First, the standardised matrix in each column is divided by the weight in each row. These results are then summed in each row and divided by the corresponding weight in each row. The average of the sum of the column divided by the corresponding weight results, the . Consistency Index () can be calculated according to Equation (9), where n is the number of criteria. Equation (10) determines the values of , where values are determined considering the matrix size, as shown in Table 5. It is suggested that the result of is 0.1 or less.
Table 5.
Random Index () based on matrix’s size [35].
In the following section, the explained concept of the VENRA framework for ship-manufacturing performance is demonstrated in a shipyard application case study located in Indonesia to illustrate its applicability and efficacy.
4. Case Study and Results
4.1. Shipyard Case Study and Data Analysis
The subject of the case study is a shipyard in Indonesia specialising in constructing steel and aluminium vessels. Throughout its operational history, this small shipyard has primarily concentrated on producing distinctive offshore support vessels and fast patrol boats made from aluminium. Furthermore, the shipyard possesses the capacity to construct general cargo and passenger ships up to 2000 GT. It has also gained valuable experience through engagements with the Indonesian government’s Sea-Toll-Ship program and general cargo shipbuilding projects both domestically and internationally.
Multiple methodologies were employed to collect data for this study, encompassing direct surveys and semi-structured interviews conducted with representatives of the shipyard, alongside the utilisation of online resources, reports, and publications. The data collection process can be categorised into three distinct groups within this paper. First, information was obtained from the shipyard’s website, company profile, and internal technical reports. The second resource is from the expert opinions and informed judgments procured from analogous shipyards, and the last resource is based on assumptions derived from observed conditions and benchmarking processes. Subsequently, the collected data were summarised and evaluated based on their qualitative and quantitative values validated by shipyard experts, enabling the acquisition of requisite results necessary for measuring the shipyard’s performance.
The summarised shipyard data pertaining to personnel safety and environmental considerations, adhering to the criteria outlined by the VENRA framework, is presented in Table 6. These data points have been scored employing the developed grading system.
Table 6.
The shipyard’s case study data.
4.2. Criteria Cause-Effect and Ranking Analysis
This research involved the participation of five experts who provided expert judgment in evaluating the criteria by applying fuzzy DEMATEL and AHP approaches. The selection of experts was carefully considered, taking into account their experience, academic background, and practical expertise. The detailed profiles of the experts are presented in Table 7. Expert 1 holds a shipyard’s senior technical and development director position, boasting extensive practical experience in similar projects. Additionally, this expert possesses academic experience as a researcher in the field. Expert 2 is a senior lecturer with a strong educational foundation in shipbuilding engineering. Furthermore, this expert has served as an owner surveyor for docking and ship repair for a duration of eight years, thereby bringing valuable practical knowledge to the study. Experts 3, 4, and 5 are members of the lecturer staff, each with a background in shipyard operations. They possess experience in shipyard assessment and have acquired practical expertise in evaluating shipyards. These experts were selected based on their qualifications and competence, ensuring diverse perspectives and insights relevant to the study.
Table 7.
Experts list backgrounds and profiles.
The detailed steps of calculating fuzzy DEMATEL results are presented in Appendix A, while the AHP are presented in Appendix B. The results of both approaches are summarised in Table 8, presenting the VENRA group weight and criteria in percentage, the criteria ranking, and the cause-effect attributes as the result of fuzzy DEMATEL. Additionally, as part of fuzzy DEMATEL results, the cause-effect graph is presented in Figure 4. The shipyard’s data assessment and the criteria ranking of both approaches results are presented in Figure 5.
Table 8.
The summary of fuzzy DEMATEL and AHP results.

Figure 4.
Diagram of cause–effect based on fuzzy DEMATEL calculation.
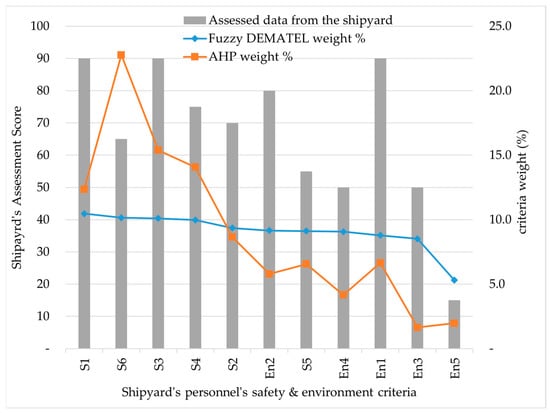
Figure 5.
Shipyard score (bar chart) and criteria weight (line chart) of fuzzy DEMATEL & AHP.
Table 8 presents slight conformity ranking results between both methods, presenting that the top five most important factors in both groups are in the same group ranking, although in different sequence rankings. The results in fuzzy DEMATEL shows that S1 > S6 > S3 > S4 > S2 while the result in AHP (global ranking) are S6 > S3 > S4 > S1 > S2. On the other hand, the six least factors according to fuzzy DEMATEL are En5 < En3 < En1 < En4 < S5 < En2, while in AHP results are En3 < En5 < En4 < En2 < S5 < En1. The least six factors ranking on both methods have different ranking results, although some of them are still very close, such as the En5 criterion, which are in the two least ranking. Furthermore, fuzzy DEMATEL weight percentage has a similar weight score amongst criteria, whereas AHP significantly has different gap values. It can be seen that the slope line graph, Figure 4, presents a light slope for fuzzy DEMATEL weighting results, whereas, in AHP, there is a steep slope in the line graph.
Figure 4 illustrates a cause-and-effect diagram resulting from fuzzy DEMATEL analysis. The diagram is constructed using () and () values as the axes and ordinates, respectively, and was created through Microsoft Excel. It presents six criteria for Personnel Safety and five criteria for the Environment group of VENRA, which each criterion identified by its name and code. In this diagram, higher values of () signify the greater level of importance for the respective criteria, while positive () values indicate that these criteria serve as causal factors. The magnitude of the positive () score reflects the extent of their impact on other criteria. Conversely, negative () values indicate that the criteria are influenced by other causal factors, with the magnitude of the negative score representing the influence exerted by the causal criteria.
Fuzzy DEMATEL produces two data results: The cause-effect and criteria weight. According to criteria cause-effect analysis, based on Figure 4, ‘waste management procedure’ (En1) is the most impacting factor, while ‘HSE department role’ (S1), ‘major accidents/incidents; (S6) and ‘shipyard’s safety certification’ (S3) are the top three of the most important criteria. ‘Green energy application’ (En5) ranks the minor factors for shipyard performance related to safety and the environment. At the same time, the ‘minor accidents/incidents’ (S5) criterion is the most affected factor in the total-influence matrix diagram.
‘HSE department role’ (S1) and ‘major accidents/incidents’ (S6) become the most critical factors at 10.47% and 10.15%, respectively, followed by ‘shipyard safety certification’ (S3) at 10.1%. At the same time, ‘safety policy’ (S4) and ‘safety training’ (S2) rank fourth and fifth at 9.98% and 9.35%, respectively. At the same time, according to the AHP result, the ‘major accidents/incidents’ (S6) criterion is the most critical, scoring at 22.7%, followed by ‘shipyard safety certification’ (S3), ‘safety policy’ (S4), ‘HSE department role’ (S1), subsequently, with the score around 12–15%. ‘Safety training’ (S2) is placed in the fifth rank, same with fuzzy DEMATEL results, scoring at 8.66%.
Furthermore, according to fuzzy DEMATEL, ‘storage for dangerous goods/waste’ (En2), ‘minor accidents/incidents’ (S5), and ‘covered sandblasting workshop’ (En4) criteria rank at 6th, 7th and 8th, having similar weights just above 9%, followed by ‘waste management procedure’ (En1) and ‘storage for non-dangerous goods/waste’ (En3), scored at about 8%., the minor factor is ‘green energy application’ (En5) scored at 5.3%. On the other hand, based on AHP results, the ‘waste management procedure’ (En1), ‘minor accidents/incidents’ (S5) and ‘storage for dangerous goods/waste’ (En2) rank 6th, 7th and 8th with weight score around 5.7–6.6%, followed by ‘covered sandblasting workshop’ (En4) at 4.16%. The minor factors group are occupied by ‘green energy application’ (En5) and ‘storage for non-dangerous goods/waste’ (En3), with scores of 1.97% and 1.64%, respectively.
Considering the shipyard case study assessed score, based on Figure 5, the ‘HSE department role’ (S1), ‘shipyard safety certification’ (S3) and ‘waste management procedure’ (En1) have excellent scores at 90%, followed by ‘storage for dangerous goods/waste’ (En2) by 80%. The lowest score in the shipyard is in ‘green energy application’ (En5), which scored 15%. The other criteria have medium-good scores, ranging between 50% and 75%.
5. Discussion
According to the cause-effect diagram in fuzzy DEMATEL, focusing on causal factors is suggested as it could impact the other criteria. In addition, the most important criteria, based on fuzzy DEMATEL-AHP, can also directly influence the ship-manufacturing performance in terms of personnel safety and environment. With this concern, focusing on causal factors and the most critical group of criteria is suggested for shipyard performance improvement. In addition, the focus also considers the shipyard’s score assessment results which need improvements.
5.1. The Causal Factors
As stated before, the causal factor is measured based on the positive score of () (shown in Figure 4 and Table A6 in Appendix A). The higher the score, the higher the impact on other criteria. The first most causal factor is the ‘waste management procedure’ (En1), followed by ‘storage for dangerous goods/waste’ (En2), ‘safety training’ (S4) and ‘covered sandblasting workshop’ (En4). The following causal factors are ‘green energy application’ (En5), ‘HSE department role’ (S1) and ‘shipyard safety certification’ (S3).
‘Waste management procedure’ (En1) can be the most influential factor since it impacts the environment and the personnel’s safety in executing the process, according to the expert’s preferences. It impacts how to treat dangerous and non-dangerous goods, including handling them safely without impacting the environment in or outside the shipyard. Similarly, ‘storage for dangerous goods/waste’ (En2) which also needs extra safety for personnel, can also impact radiation and pollution, which dangerously impacts human safety and the environment.
The regular-continue ‘safety training’ (S4) conducted is also a causal factor since it can impact the personnel’s familiarisation in safely handling the shipyard’s manufacturing process or any activity conducted there. The ‘covered sandblasting workshop’ (En4) is also critical in the shipyard to prevent the safety of personnel and the environmental impact. The ‘HSE department role’ (S1) factor is the following causal factors since they have a role in planning, executing and managing the safety and environmental impact in the shipyard through their planning, control and mitigating the risk that occurred. It also impacts how the activity in the shipyard is conducted, including in the manufacturing process or the office since it is placed in the shipyard. More concern is also performed when handling dangerous goods, working in height or confined spaces and hot working.
‘Green energy application’ (En5) may also impact the personnel’s safety and environment since using this relatively new energy may change manufacturing processes. For example, using gas energy in operating the machinery may have another risk level in managing the new fuel. Conversely, low-emission or zero energy can positively reduce GHG emissions and pollution in the shipyard. ‘Shipyard safety certification’ (S3) factor may also become the causal factor since it is the basic standard to comply with international safety regulations. This certificate impacts the basic safety standard in the shipyard operation.
5.2. The Causal & Most Important Factors Group Based on Fuzzy DEMATEL & AHP
The causal factor can impact other criteria and indirectly impact the shipyard’s performance in terms of safety and environment. However, focusing on the most critical and included causal factors may improve the shipyard’s performance more effectively. In Figure 4, the cause-effect diagram shows that the most crucial factor included in causal factors are the ‘HSE department role’ (S1), ‘safety training’ (S4) and ‘shipyard safety certification’ (S3).
Concerning the weighting results using both methods, it shows conformity between fuzzy DEMATEL and AHP results, showing that the top 5 factors are the same group as shown in Table 8, which are HSE department role (S1), safety training (S2), shipyard safety certification (S3), safety policy (S5) and major accidents/incidents (S6). The most crucial factors affecting the shipyard performance are prioritised in these criteria.
In the group weighting results, the AHP results show that the comparison of personnel’s safety group with the environment is 79.80%, and 20.20% means that in the preference of experts, the personnel’s safety is essential rather than the environmental impact aspect. Compared with fuzzy DEMATEL results, it shows the personnel’s safety and environmental impact as 58.17% and 40.83%, which still shows that it is more critical in personnel’s safety. Overall, the personnel’s safety group is considered more important from the experts’ perspective than environmental impact. The reason is that it directly impacts the workers’ health, life and risk. It is also supported by the study by Kafali et al. [17], who analysed the risk factors in evaluating the cutting technologies in shipbuilding for piping, presenting that the risk for worker safety criteria accounted for 62%, whereas the environmental effect is 38%. In addition, there is currently no rule for managing the GhG emission impact in shipyards, as the study by Pulli et al. [40]. Nevertheless, the shipyard (shipbuilding and ship repair) contributes about 2% and 1% to emission impact in the maritime sector [2], but it has not been considered yet.
5.3. Shipyard’s Improvement Strategy
Based on the analysis above, focusing on the most causal-important factors group is suggested. Concerning the shipyard’s case study, the ‘HSE department role’ (S1) and ‘shipyard safety certification’ (S3) criteria of the shipyard have an excellent score for having a responsive personnel role in the HSE department and having ISO 45001:2018 for the HSE management system. However, the regular safety training is not recorded well since it is assumed that it may conduct regular safety training for the shipyard’s personnel. It also indicates that the recorded number of minor accidents in the shipyard accounted for four in the last six months, as might result from non-regular safety training.
The least score in the shipyard assessment is concerned with the ‘green energy application’ (En5), ‘covered sandblasting workshop’ (En4) and ‘storage for non-dangerous goods/waste’ (En3). The (En5) criterion is classified as the minor factor group according to fuzzy DEMATEL-AHP, which has not been considered yet according to expert preference. Until now, there is still no government regulation managing GHG emission control in shipyards. However, the shipyard sector contributes the GHG emission of 2% to shipbuilding and 1% in ship repair and maintenance [2].
On the other hand, the (En4) and (En3) criteria scored at 50%, which (En4) is more critical than (En3). This low-medium score is due to the partial blasting workshop available in the shipyard. The shipyard has a covered sandblasting workshop but can only accommodate small parts, such as plates or profiles. The workshop size may be small and cannot accommodate enormous structures, such as assembly blocks. With this concern, the blasting process for more enormous structures is conducted outdoors without being covered and uncontrolled by the shipyard. At the same time, the (En3) criterion concerns storage for non-dangerous goods/wastes that the shipyard has with limited capacity. This limited capacity makes it possible to dispose of these non-dangerous goods improperly, such as disposal to seawater. Although not dangerous, it can pollute seawater and adversely impact the environment.
The minor-major accidents/incidents (S5, S6) should be recorded to show the safety performance in the shipyard. The shipyard recorded four minor incidents/accidents within the last six months. It is good to have this record, but the frequency should be reduced by mitigating the cause of the risk. Since the detailed event is not explicitly mentioned, it is also better to identify the specific incidents/accidents for proper and more appropriate mitigation. However, the major incidents/accidents are not recorded yet. Since no exact data is available (it may be confidential), it is assumed that this shipyard has some incidents/accidents within a year. The major incidents/accidents should be concern more and studied as they can be mitigated to avoid or reduce the impact or frequency of the risk. According to the weighting analysis, it is also vital since it ranks in the top five most important factors.
6. Conclusions
VENRA framework has been proposed and applied to personnel’s safety and environment group in a shipyard case study, presenting the groups, attributes and sub-attributes contributing to the ship-manufacturing performance. The assessment methodology used Fuzzy DEMATEL-AHP to assess the criteria, presenting cause-effect relationships and weighting results comparing approaches in the VENRA framework. The case study application results show that from the perspective of experts, Personnel’s Safety criteria are more critical than environmental impact ones. With enhanced hybrid methodology, the framework can analyse the most impacting and influencing factors in the shipyard assessment.
The next phase in the study process involves presenting VENRA’s remaining two groups of criteria and sub-criteria (Business and External, as the Technical Group has been demonstrated [15]) and applying the above in the case of the same or other shipyards. The procedure of comparing the outcomes to the performance of another shipyard in Indonesia and Europe/the UK can be approached in an analogous manner. In addition, the procedure for evaluating criteria can be improved by using an additional MCDM approach, such as TOPSIS or simple additive weighting (SAW) method.
Author Contributions
Conceptualisation, Methodology, Validation: I.B. and I.L.; investigation, writing-original draft: I.B., supervision: I.L., writing-Review & Editing: I.L. and H.S. All authors have read and agreed to the published version of the manuscript.
Funding
This research received no external funding.
Data Availability Statement
Due to the nature of this research, participants of this study did not agree for their data to be shared publicly, so supporting data is not available.
Acknowledgments
The author expresses profound gratitude to the Directorate General of Resources for Science, Technology, and Higher Education, BPPLN (‘Beasiswa Pendidikan Pascasarjana Luar Negeri’), for their generous funding support towards the author’s doctoral research program at the esteemed University of Strathclyde in Glasgow, Scotland, UK. Additionally, the author acknowledges with deep appreciation anonymous experts affiliated with the shipyard’s representative, whose invaluable data and validation contribution significantly enhanced the quality of this work.
Conflicts of Interest
The authors declare no conflict of interest.
Appendix A
The first step in fuzzy DEMATEL which presents the linguistic fuzzy direct relation matrix of Expert 1, as an example, is shown in Table A1.
Table A1.
The example of fuzzy direct-relation matrix of Expert 1.
Table A1.
The example of fuzzy direct-relation matrix of Expert 1.
| Criteria Code | S1 | S2 | S3 | S4 | S5 | S6 | En1 | En2 | En3 | En4 | En5 |
|---|---|---|---|---|---|---|---|---|---|---|---|
| S1 | N | FG | G | G | FG | FG | VG | VG | VG | VG | MG |
| S2 | FG | N | FG | L | MG | MG | MG | FG | FG | FG | FG |
| S3 | E | VG | N | FG | FG | FG | FG | VG | VG | VG | MG |
| S4 | FG | ML | VG | N | FG | FG | VG | VG | VG | VG | L |
| S5 | FG | G | G | FG | N | FG | L | MG | MG | VG | L |
| S6 | E | VG | VG | VG | VG | N | L | MG | MG | VG | L |
| En1 | E | G | VG | G | G | G | N | FG | G | G | FL |
| En2 | VG | VG | VG | VG | VG | VG | G | N | FL | VL | VL |
| En3 | G | G | G | G | G | VG | G | VL | N | VL | VL |
| En4 | E | G | E | G | VG | E | FG | ML | VL | N | VL |
| En5 | MG | VL | VL | M | M | M | FG | M | ML | VL | N |
The fuzzy aggregation of the direct relation matrix from five experts, which calculates experts degree level based on Equation (2), are presented in Table A2.
Table A2.
Aggregated fuzzy direct-relation matrix from five experts.
Table A2.
Aggregated fuzzy direct-relation matrix from five experts.
| S1 | S2 | S3 | S4 | S5 | S6 | |||||||||||||
|---|---|---|---|---|---|---|---|---|---|---|---|---|---|---|---|---|---|---|
| l | m | u | l | m | u | l | m | u | l | m | u | l | m | u | l | m | u | |
| S1 | 0.00 | 0.00 | 0.10 | 0.57 | 0.70 | 0.80 | 0.54 | 0.70 | 0.84 | 0.54 | 0.70 | 0.84 | 0.74 | 0.84 | 0.88 | 0.74 | 0.84 | 0.88 |
| S2 | 0.65 | 0.77 | 0.86 | 0.00 | 0.00 | 0.10 | 0.56 | 0.68 | 0.77 | 0.30 | 0.42 | 0.54 | 0.65 | 0.75 | 0.82 | 0.74 | 0.82 | 0.84 |
| S3 | 0.64 | 0.76 | 0.83 | 0.77 | 0.87 | 0.93 | 0.00 | 0.00 | 0.10 | 0.57 | 0.67 | 0.76 | 0.65 | 0.77 | 0.86 | 0.65 | 0.77 | 0.86 |
| S4 | 0.48 | 0.60 | 0.71 | 0.54 | 0.62 | 0.68 | 0.72 | 0.82 | 0.88 | 0.12 | 0.14 | 0.24 | 0.74 | 0.84 | 0.88 | 0.74 | 0.84 | 0.88 |
| S5 | 0.50 | 0.60 | 0.68 | 0.57 | 0.74 | 0.88 | 0.48 | 0.64 | 0.79 | 0.62 | 0.74 | 0.85 | 0.00 | 0.00 | 0.10 | 0.53 | 0.63 | 0.73 |
| S6 | 0.71 | 0.84 | 0.88 | 0.84 | 0.94 | 1.00 | 0.77 | 0.89 | 0.98 | 0.84 | 0.94 | 1.00 | 0.58 | 0.70 | 0.83 | 0.00 | 0.00 | 0.10 |
| En1 | 0.75 | 0.89 | 0.96 | 0.50 | 0.64 | 0.79 | 0.61 | 0.75 | 0.89 | 0.43 | 0.63 | 0.83 | 0.50 | 0.64 | 0.79 | 0.50 | 0.64 | 0.79 |
| En2 | 0.84 | 0.94 | 1.00 | 0.69 | 0.83 | 0.96 | 0.69 | 0.83 | 0.96 | 0.61 | 0.75 | 0.89 | 0.69 | 0.77 | 0.85 | 0.80 | 0.90 | 1.00 |
| En3 | 0.50 | 0.64 | 0.79 | 0.50 | 0.64 | 0.79 | 0.50 | 0.64 | 0.79 | 0.43 | 0.63 | 0.83 | 0.43 | 0.63 | 0.83 | 0.69 | 0.83 | 0.96 |
| En4 | 0.90 | 1.00 | 1.00 | 0.50 | 0.70 | 0.90 | 0.90 | 1.00 | 1.00 | 0.50 | 0.70 | 0.90 | 0.69 | 0.77 | 0.85 | 0.90 | 1.00 | 1.00 |
| En5 | 0.43 | 0.53 | 0.64 | 0.00 | 0.10 | 0.20 | 0.00 | 0.10 | 0.20 | 0.23 | 0.41 | 0.58 | 0.19 | 0.35 | 0.51 | 0.19 | 0.35 | 0.51 |
| En1 | En2 | En3 | En4 | En5 | ||||||||||||||
| l | m | u | l | m | u | l | m | u | l | m | u | l | m | u | ||||
| S1 | 0.69 | 0.77 | 0.85 | 0.69 | 0.83 | 0.96 | 0.69 | 0.83 | 0.96 | 0.80 | 0.90 | 1.00 | 0.50 | 0.55 | 0.60 | |||
| S2 | 0.46 | 0.51 | 0.56 | 0.50 | 0.60 | 0.70 | 0.50 | 0.60 | 0.70 | 0.50 | 0.60 | 0.70 | 0.50 | 0.60 | 0.70 | |||
| S3 | 0.50 | 0.58 | 0.66 | 0.69 | 0.77 | 0.85 | 0.69 | 0.77 | 0.85 | 0.69 | 0.83 | 0.96 | 0.50 | 0.55 | 0.60 | |||
| S4 | 0.69 | 0.83 | 0.96 | 0.61 | 0.75 | 0.89 | 0.61 | 0.75 | 0.89 | 0.61 | 0.75 | 0.89 | 0.10 | 0.30 | 0.50 | |||
| S5 | 0.06 | 0.19 | 0.35 | 0.43 | 0.53 | 0.64 | 0.50 | 0.55 | 0.60 | 0.69 | 0.77 | 0.85 | 0.06 | 0.19 | 0.35 | |||
| S6 | 0.06 | 0.19 | 0.35 | 0.50 | 0.61 | 0.71 | 0.50 | 0.61 | 0.71 | 0.84 | 0.94 | 1.00 | 0.06 | 0.19 | 0.35 | |||
| En1 | 0.00 | 0.00 | 0.10 | 0.65 | 0.77 | 0.86 | 0.65 | 0.81 | 0.94 | 0.41 | 0.59 | 0.77 | 0.30 | 0.40 | 0.50 | |||
| En2 | 0.57 | 0.74 | 0.88 | 0.00 | 0.00 | 0.10 | 0.38 | 0.51 | 0.63 | 0.08 | 0.20 | 0.33 | 0.00 | 0.10 | 0.20 | |||
| En3 | 0.41 | 0.59 | 0.77 | 0.27 | 0.39 | 0.51 | 0.00 | 0.00 | 0.10 | 0.17 | 0.27 | 0.37 | 0.00 | 0.10 | 0.20 | |||
| En4 | 0.32 | 0.42 | 0.51 | 0.23 | 0.31 | 0.40 | 0.18 | 0.28 | 0.38 | 0.00 | 0.00 | 0.10 | 0.22 | 0.30 | 0.38 | |||
| En5 | 0.51 | 0.59 | 0.67 | 0.41 | 0.51 | 0.60 | 0.42 | 0.47 | 0.52 | 0.00 | 0.10 | 0.20 | 0.00 | 0.00 | 0.10 | |||
The normalised fuzzy direct relation matrix as the results of Equation (3), is presented in Table A3, splitting the matrices into three elements: low (l), medium (m) and upper (u) scores.
Table A3.
Normalised fuzzy direct-relation matrix in three crips matrices.
Table A3.
Normalised fuzzy direct-relation matrix in three crips matrices.
| S1 | S2 | S3 | S4 | S5 | S6 | |||||||||||||
|---|---|---|---|---|---|---|---|---|---|---|---|---|---|---|---|---|---|---|
| l | m | u | l | m | u | l | m | u | l | m | u | l | m | u | l | m | u | |
| S1 | 0.00 | 0.00 | 0.01 | 0.07 | 0.08 | 0.09 | 0.06 | 0.08 | 0.10 | 0.06 | 0.08 | 0.10 | 0.09 | 0.10 | 0.10 | 0.09 | 0.10 | 0.10 |
| S2 | 0.07 | 0.09 | 0.10 | 0.00 | 0.00 | 0.01 | 0.06 | 0.08 | 0.09 | 0.03 | 0.05 | 0.06 | 0.07 | 0.09 | 0.09 | 0.09 | 0.09 | 0.10 |
| S3 | 0.07 | 0.09 | 0.09 | 0.09 | 0.10 | 0.11 | 0.00 | 0.00 | 0.01 | 0.07 | 0.08 | 0.09 | 0.07 | 0.09 | 0.10 | 0.07 | 0.09 | 0.10 |
| S4 | 0.06 | 0.07 | 0.08 | 0.06 | 0.07 | 0.08 | 0.08 | 0.09 | 0.10 | 0.01 | 0.02 | 0.03 | 0.09 | 0.10 | 0.10 | 0.09 | 0.10 | 0.10 |
| S5 | 0.06 | 0.07 | 0.08 | 0.07 | 0.08 | 0.10 | 0.06 | 0.07 | 0.09 | 0.07 | 0.08 | 0.10 | 0.00 | 0.00 | 0.01 | 0.06 | 0.07 | 0.08 |
| S6 | 0.08 | 0.10 | 0.10 | 0.10 | 0.11 | 0.11 | 0.09 | 0.10 | 0.11 | 0.10 | 0.11 | 0.11 | 0.07 | 0.08 | 0.09 | 0.00 | 0.00 | 0.01 |
| En1 | 0.09 | 0.10 | 0.11 | 0.06 | 0.07 | 0.09 | 0.07 | 0.09 | 0.10 | 0.05 | 0.07 | 0.09 | 0.06 | 0.07 | 0.09 | 0.06 | 0.07 | 0.09 |
| En2 | 0.10 | 0.11 | 0.11 | 0.08 | 0.09 | 0.11 | 0.08 | 0.09 | 0.11 | 0.07 | 0.09 | 0.10 | 0.08 | 0.09 | 0.10 | 0.09 | 0.10 | 0.11 |
| En3 | 0.06 | 0.07 | 0.09 | 0.06 | 0.07 | 0.09 | 0.06 | 0.07 | 0.09 | 0.05 | 0.07 | 0.09 | 0.05 | 0.07 | 0.09 | 0.08 | 0.09 | 0.11 |
| En4 | 0.10 | 0.11 | 0.11 | 0.06 | 0.08 | 0.10 | 0.10 | 0.11 | 0.11 | 0.06 | 0.08 | 0.10 | 0.08 | 0.09 | 0.10 | 0.10 | 0.11 | 0.11 |
| En5 | 0.05 | 0.06 | 0.07 | 0.00 | 0.01 | 0.02 | 0.00 | 0.01 | 0.02 | 0.03 | 0.05 | 0.07 | 0.02 | 0.04 | 0.06 | 0.02 | 0.04 | 0.06 |
| En1 | En2 | En3 | En4 | En5 | ||||||||||||||
| l | m | u | l | m | u | l | m | u | l | m | u | l | m | u | ||||
| S1 | 0.08 | 0.09 | 0.10 | 0.08 | 0.09 | 0.11 | 0.08 | 0.09 | 0.11 | 0.09 | 0.10 | 0.11 | 0.06 | 0.06 | 0.07 | |||
| S2 | 0.05 | 0.06 | 0.06 | 0.06 | 0.07 | 0.08 | 0.06 | 0.07 | 0.08 | 0.06 | 0.07 | 0.08 | 0.06 | 0.07 | 0.08 | |||
| S3 | 0.06 | 0.07 | 0.08 | 0.08 | 0.09 | 0.10 | 0.08 | 0.09 | 0.10 | 0.08 | 0.09 | 0.11 | 0.06 | 0.06 | 0.07 | |||
| S4 | 0.08 | 0.09 | 0.11 | 0.07 | 0.09 | 0.10 | 0.07 | 0.09 | 0.10 | 0.07 | 0.09 | 0.10 | 0.01 | 0.03 | 0.06 | |||
| S5 | 0.01 | 0.02 | 0.04 | 0.05 | 0.06 | 0.07 | 0.06 | 0.06 | 0.07 | 0.08 | 0.09 | 0.10 | 0.01 | 0.02 | 0.04 | |||
| S6 | 0.01 | 0.02 | 0.04 | 0.06 | 0.07 | 0.08 | 0.06 | 0.07 | 0.08 | 0.10 | 0.11 | 0.11 | 0.01 | 0.02 | 0.04 | |||
| En1 | 0.00 | 0.00 | 0.01 | 0.07 | 0.09 | 0.10 | 0.07 | 0.09 | 0.11 | 0.05 | 0.07 | 0.09 | 0.03 | 0.05 | 0.06 | |||
| En2 | 0.07 | 0.08 | 0.10 | 0.00 | 0.00 | 0.01 | 0.04 | 0.06 | 0.07 | 0.01 | 0.02 | 0.04 | 0.00 | 0.01 | 0.02 | |||
| En3 | 0.05 | 0.07 | 0.09 | 0.03 | 0.04 | 0.06 | 0.00 | 0.00 | 0.01 | 0.02 | 0.03 | 0.04 | 0.00 | 0.01 | 0.02 | |||
| En4 | 0.04 | 0.05 | 0.06 | 0.03 | 0.04 | 0.05 | 0.02 | 0.03 | 0.04 | 0.00 | 0.00 | 0.01 | 0.03 | 0.03 | 0.04 | |||
| En5 | 0.06 | 0.07 | 0.08 | 0.05 | 0.06 | 0.07 | 0.05 | 0.05 | 0.06 | 0.00 | 0.01 | 0.02 | 0.00 | 0.00 | 0.01 | |||
Table A4 presents the fuzzy total relation matrix, calculated based on Equation (4) for all elements and split into low, middle, and upper score based on Equations (5)–(7).
Table A4.
The results of fuzzy total relation matrix .
Table A4.
The results of fuzzy total relation matrix .
| Low Score | |||||||||||
|---|---|---|---|---|---|---|---|---|---|---|---|
| S1 | S2 | S3 | S4 | S5 | S6 | En1 | En2 | En3 | En4 | En5 | |
| S1 | 0.128 | 0.177 | 0.178 | 0.165 | 0.198 | 0.211 | 0.157 | 0.173 | 0.176 | 0.187 | 0.100 |
| S2 | 0.176 | 0.096 | 0.159 | 0.124 | 0.169 | 0.188 | 0.120 | 0.138 | 0.141 | 0.141 | 0.094 |
| S3 | 0.193 | 0.194 | 0.117 | 0.166 | 0.187 | 0.199 | 0.137 | 0.171 | 0.174 | 0.174 | 0.100 |
| S4 | 0.174 | 0.169 | 0.192 | 0.115 | 0.194 | 0.205 | 0.152 | 0.161 | 0.164 | 0.166 | 0.056 |
| S5 | 0.147 | 0.147 | 0.141 | 0.145 | 0.089 | 0.156 | 0.070 | 0.118 | 0.128 | 0.151 | 0.042 |
| S6 | 0.193 | 0.197 | 0.194 | 0.188 | 0.176 | 0.125 | 0.088 | 0.146 | 0.149 | 0.188 | 0.053 |
| En1 | 0.186 | 0.151 | 0.165 | 0.136 | 0.155 | 0.165 | 0.072 | 0.154 | 0.157 | 0.131 | 0.073 |
| En2 | 0.199 | 0.177 | 0.179 | 0.161 | 0.180 | 0.200 | 0.135 | 0.090 | 0.135 | 0.106 | 0.044 |
| En3 | 0.135 | 0.130 | 0.132 | 0.117 | 0.124 | 0.158 | 0.098 | 0.095 | 0.068 | 0.090 | 0.032 |
| En4 | 0.205 | 0.157 | 0.199 | 0.149 | 0.179 | 0.209 | 0.108 | 0.115 | 0.113 | 0.096 | 0.068 |
| En5 | 0.094 | 0.044 | 0.045 | 0.066 | 0.066 | 0.070 | 0.088 | 0.084 | 0.086 | 0.038 | 0.016 |
| Middle score | |||||||||||
| S1 | S2 | S3 | S4 | S5 | S6 | En1 | En2 | En3 | En4 | En5 | |
| S1 | 0.269 | 0.324 | 0.333 | 0.318 | 0.344 | 0.362 | 0.272 | 0.305 | 0.309 | 0.318 | 0.180 |
| S2 | 0.306 | 0.209 | 0.287 | 0.250 | 0.293 | 0.315 | 0.215 | 0.247 | 0.251 | 0.253 | 0.166 |
| S3 | 0.339 | 0.331 | 0.248 | 0.305 | 0.328 | 0.345 | 0.246 | 0.291 | 0.295 | 0.302 | 0.176 |
| S4 | 0.324 | 0.308 | 0.336 | 0.249 | 0.335 | 0.353 | 0.270 | 0.290 | 0.294 | 0.297 | 0.150 |
| S5 | 0.268 | 0.269 | 0.267 | 0.264 | 0.196 | 0.278 | 0.168 | 0.223 | 0.228 | 0.254 | 0.115 |
| S6 | 0.335 | 0.330 | 0.333 | 0.322 | 0.313 | 0.255 | 0.200 | 0.266 | 0.270 | 0.308 | 0.135 |
| En1 | 0.334 | 0.294 | 0.312 | 0.286 | 0.299 | 0.316 | 0.174 | 0.279 | 0.287 | 0.265 | 0.153 |
| En2 | 0.337 | 0.313 | 0.318 | 0.298 | 0.311 | 0.339 | 0.249 | 0.198 | 0.257 | 0.230 | 0.123 |
| En3 | 0.265 | 0.255 | 0.260 | 0.247 | 0.256 | 0.288 | 0.203 | 0.205 | 0.166 | 0.200 | 0.103 |
| En4 | 0.340 | 0.296 | 0.332 | 0.290 | 0.308 | 0.345 | 0.213 | 0.230 | 0.230 | 0.204 | 0.143 |
| En5 | 0.184 | 0.131 | 0.135 | 0.161 | 0.160 | 0.168 | 0.156 | 0.160 | 0.159 | 0.118 | 0.057 |
| Upper score | |||||||||||
| S1 | S2 | S3 | S4 | S5 | S6 | En1 | En2 | En3 | En4 | En5 | |
| S1 | 0.694 | 0.754 | 0.769 | 0.762 | 0.764 | 0.791 | 0.633 | 0.694 | 0.7 | 0.712 | 0.44 |
| S2 | 0.663 | 0.570 | 0.650 | 0.622 | 0.649 | 0.673 | 0.515 | 0.573 | 0.577 | 0.584 | 0.391 |
| S3 | 0.735 | 0.731 | 0.654 | 0.717 | 0.726 | 0.751 | 0.585 | 0.652 | 0.657 | 0.676 | 0.421 |
| S4 | 0.739 | 0.721 | 0.753 | 0.677 | 0.744 | 0.770 | 0.628 | 0.67 | 0.676 | 0.683 | 0.419 |
| S5 | 0.619 | 0.628 | 0.628 | 0.627 | 0.548 | 0.636 | 0.473 | 0.543 | 0.544 | 0.578 | 0.341 |
| S6 | 0.722 | 0.721 | 0.729 | 0.724 | 0.707 | 0.654 | 0.54 | 0.623 | 0.628 | 0.667 | 0.387 |
| En1 | 0.750 | 0.718 | 0.739 | 0.726 | 0.722 | 0.746 | 0.527 | 0.655 | 0.669 | 0.659 | 0.412 |
| En2 | 0.734 | 0.718 | 0.728 | 0.713 | 0.709 | 0.747 | 0.593 | 0.561 | 0.624 | 0.601 | 0.372 |
| En3 | 0.644 | 0.633 | 0.643 | 0.639 | 0.639 | 0.673 | 0.527 | 0.545 | 0.505 | 0.545 | 0.333 |
| En4 | 0.699 | 0.678 | 0.697 | 0.680 | 0.675 | 0.712 | 0.527 | 0.564 | 0.567 | 0.546 | 0.373 |
| En5 | 0.452 | 0.398 | 0.405 | 0.442 | 0.433 | 0.447 | 0.379 | 0.4 | 0.395 | 0.364 | 0.221 |
Table A5 shows the crisp value of the matrix which is de-fuzzified based on Equation (8).
Table A5.
Defuzzification results values of the total-influence matrix .
Table A5.
Defuzzification results values of the total-influence matrix .
| S1 | S2 | S3 | S4 | S5 | S6 | En1 | En2 | En3 | En4 | En5 | |
|---|---|---|---|---|---|---|---|---|---|---|---|
| S1 | 0.358 | 0.398 | 0.420 | 0.412 | 0.429 | 0.448 | 0.349 | 0.385 | 0.390 | 0.400 | 0.237 |
| S2 | 0.400 | 0.311 | 0.415 | 0.388 | 0.412 | 0.430 | 0.340 | 0.363 | 0.367 | 0.371 | 0.202 |
| S3 | 0.414 | 0.371 | 0.331 | 0.411 | 0.405 | 0.423 | 0.316 | 0.364 | 0.368 | 0.377 | 0.228 |
| S4 | 0.380 | 0.327 | 0.363 | 0.290 | 0.369 | 0.390 | 0.282 | 0.318 | 0.321 | 0.324 | 0.216 |
| S5 | 0.334 | 0.311 | 0.333 | 0.337 | 0.266 | 0.344 | 0.227 | 0.284 | 0.289 | 0.317 | 0.160 |
| S6 | 0.410 | 0.389 | 0.411 | 0.409 | 0.391 | 0.337 | 0.269 | 0.339 | 0.342 | 0.381 | 0.188 |
| En1 | 0.418 | 0.367 | 0.400 | 0.383 | 0.386 | 0.403 | 0.253 | 0.358 | 0.366 | 0.347 | 0.210 |
| En2 | 0.417 | 0.374 | 0.402 | 0.397 | 0.394 | 0.422 | 0.321 | 0.278 | 0.333 | 0.307 | 0.176 |
| En3 | 0.343 | 0.320 | 0.339 | 0.335 | 0.335 | 0.368 | 0.271 | 0.277 | 0.242 | 0.274 | 0.153 |
| En4 | 0.409 | 0.357 | 0.404 | 0.371 | 0.382 | 0.416 | 0.278 | 0.298 | 0.298 | 0.277 | 0.192 |
| En5 | 0.245 | 0.228 | 0.197 | 0.192 | 0.221 | 0.230 | 0.209 | 0.216 | 0.215 | 0.174 | 0.099 |
The summary results of step 6 in fuzzy DEMATEL, showing the , the weight ranking and cause-effect group are tabulated in Table A6.
Table A6.
Summary of fuzzy DEMATEL results.
Table A6.
Summary of fuzzy DEMATEL results.
| Criteria | Normalised Weight | Cause/Effect | Weight Rank | ||||
|---|---|---|---|---|---|---|---|
| S1 | 4.299 | 4.194 | 8.493 | 0.105 | 0.105 | Cause | 1 |
| S2 | 3.601 | 3.990 | 7.590 | −0.389 | 0.094 | Effect | 5 |
| S3 | 4.108 | 4.085 | 8.194 | 0.023 | 0.101 | Cause | 3 |
| S4 | 4.145 | 3.950 | 8.095 | 0.195 | 0.100 | Cause | 4 |
| S5 | 3.342 | 4.059 | 7.401 | −0.717 | 0.091 | Effect | 7 |
| S6 | 3.955 | 4.283 | 8.238 | −0.328 | 0.102 | Effect | 2 |
| En1 | 3.956 | 3.172 | 7.128 | 0.784 | 0.088 | Cause | 9 |
| En2 | 3.892 | 3.540 | 7.433 | 0.352 | 0.092 | Cause | 6 |
| En3 | 3.318 | 3.592 | 6.910 | −0.275 | 0.085 | Effect | 10 |
| En4 | 3.749 | 3.611 | 7.359 | 0.138 | 0.091 | Cause | 8 |
| En5 | 2.207 | 2.095 | 4.302 | 0.111 | 0.053 | Cause | 11 |
Appendix B
The AHP methodology first assesses the weight of group dimensions between personnel’s safety and environment, and then it assesses the criteria in both groups with the same steps. The same five experts are employed to fill in the questionnaire in AHP without considering their expert-level degrees. The results of the AHP for group dimensions are presented in Table A7, showing the pairwise comparison, the standardised matrix and the attribute weight ranking. According to AHP, the consistency index is needed for the size matrix starting from 3 above. With this concern, the calculation of the consistency index is inapplicable as the matrix size is only 2 × 2.
Table A7.
AHP aggregated pairwise comparison, calculation, and results for group dimensions.
Table A7.
AHP aggregated pairwise comparison, calculation, and results for group dimensions.
| Group in VENRA | PS | Env | Standardised Matrix (Sum of Columns) | Criteria Weight (Average of Row) | |
|---|---|---|---|---|---|
| Personnel’s Safety (PS) | 1 | 4.2 | 0.788 | 0.808 | 79.80% |
| Environment (Env) | 0.269 | 1 | 0.212 | 0.192 | 20.20% |
| Sum of Columns= | 1.269 | 5.2 | 100% | ||
Table A8 demonstrates the aggregate of pairwise comparison of personnel’s safety attributes in AHP calculations, while Table A9 presents the standardised matrix, showing the weight of each criterion. The calculation result of the consistency ratio (CR) is presented in Table A10, showing the CR for personnel safety criteria is 0.792.
Table A8.
Aggregate pairwise comparison of personnel’s safety criteria in AHP calculations.
Table A8.
Aggregate pairwise comparison of personnel’s safety criteria in AHP calculations.
| Personnel’s Safety Criteria | S1 | S2 | S3 | S4 | S5 | S6 |
|---|---|---|---|---|---|---|
| * HSE department role (S1) | 1 | 4.067 | 1.080 | 2.680 | 3.800 | 0.491 |
| Safety policy (S2) | 0.897 | 1 | 1.335 | 1.362 | 3.133 | 0.502 |
| Shipyards Safety certification (S3) | 2.467 | 3.240 | 1 | 4.029 | 4.467 | 0.707 |
| Safety training (S4) | 2.269 | 2.733 | 1.575 | 1 | 3.733 | 1.175 |
| Minor accidents/incidents (S5) | 1.844 | 1.335 | 0.764 | 1.307 | 1 | 0.168 |
| Major accidents/incidents (S6) | 4.600 | 4.200 | 2.200 | 4.040 | 7.000 | 1 |
| Sum of columns= | 13.077 | 14.467 | 7.954 | 16.526 | 23.133 | 4.043 |
* HSE = Health, Safety and Environment.
Table A9.
Aggregate standardised matrix of personnel’s safety criteria in AHP.
Table A9.
Aggregate standardised matrix of personnel’s safety criteria in AHP.
| Criteria Code | S1 | S2 | S3 | S4 | S5 | S6 | Weight | Criteria Rank |
|---|---|---|---|---|---|---|---|---|
| (S1) | 0.076 | 0.245 | 0.136 | 0.186 | 0.164 | 0.121 | 15.5% | 4 |
| (S2) | 0.069 | 0.060 | 0.168 | 0.094 | 0.135 | 0.124 | 10.8% | 5 |
| (S3) | 0.189 | 0.195 | 0.126 | 0.279 | 0.193 | 0.175 | 19.3% | 2 |
| (S4) | 0.173 | 0.165 | 0.198 | 0.069 | 0.161 | 0.291 | 17.6% | 3 |
| (S5) | 0.141 | 0.081 | 0.096 | 0.091 | 0.043 | 0.042 | 8.2% | 6 |
| (S6) | 0.352 | 0.253 | 0.277 | 0.280 | 0.303 | 0.247 | 28.5% | 1 |
Table A10.
Consistency Index and Consistency Ratio calculation and results for personnel’s safety criteria.
Table A10.
Consistency Index and Consistency Ratio calculation and results for personnel’s safety criteria.
| Criteria Code | S1 | S2 | S3 | S4 | S5 | S6 | Sum of Row | Sum of Row/ Weight |
|---|---|---|---|---|---|---|---|---|
| (S1) | 0.155 | 0.441 | 0.208 | 0.473 | 0.312 | 0.140 | 1.729 | 11.166 |
| (S2) | 0.139 | 0.108 | 0.258 | 0.240 | 0.258 | 0.143 | 1.146 | 10.562 |
| (S3) | 0.382 | 0.351 | 0.193 | 0.710 | 0.367 | 0.202 | 2.205 | 11.435 |
| (S4) | 0.351 | 0.297 | 0.304 | 0.176 | 0.307 | 0.335 | 1.770 | 10.040 |
| (S5) | 0.286 | 0.145 | 0.147 | 0.230 | 0.082 | 0.048 | 0.938 | 11.418 |
| (S6) | 0.712 | 0.456 | 0.424 | 0.712 | 0.575 | 0.285 | 3.165 | 11.094 |
| lambda max | 10.953 | |||||||
| CI | 0.991 | |||||||
| CR | 0.792 | |||||||
Similarly, environment criteria calculation in AHP is presented in Table A11, Table A12 and Table A13, demonstrating the results of the aggregated pairwise comparison, the aggregated standardised matrix and the consistency ratio index calculation. The consistency index ratio for environment criteria is slightly better than personnel safety but still above 0.1, accounting for 0.608, as presented in Table A13.
Table A11.
Aggregate pairwise comparison of environment criteria in AHP calculations.
Table A11.
Aggregate pairwise comparison of environment criteria in AHP calculations.
| Environment Criteria | En1 | En2 | En3 | En4 | En5 |
|---|---|---|---|---|---|
| Waste management procedure (En1) | 1 | 3.667 | 5.400 | 2.040 | 3.640 |
| Storage for dangerous goods/waste (En2) | 0.924 | 1 | 6.600 | 2.867 | 4.600 |
| Storage for non-dangerous goods/waste (En3) | 0.224 | 0.159 | 1 | 0.947 | 2.240 |
| Covered sandblasting workshop (En4) | 1.507 | 0.947 | 2.867 | 1 | 4.000 |
| Green Energy used (En5) | 1.202 | 0.242 | 1.383 | 0.395 | 1 |
| Sum of column= | 4.857 | 6.015 | 17.250 | 7.249 | 15.480 |
Table A12.
Aggregate standardised matrix of environmental criteria in AHP.
Table A12.
Aggregate standardised matrix of environmental criteria in AHP.
| Criteria Code | En1 | En2 | En3 | En4 | En5 | Weight | Criteria Rank |
|---|---|---|---|---|---|---|---|
| (En1) | 0.206 | 0.610 | 0.313 | 0.281 | 0.235 | 32.9% | 1 |
| (En2) | 0.190 | 0.166 | 0.383 | 0.395 | 0.297 | 28.6% | 2 |
| (En3) | 0.046 | 0.026 | 0.058 | 0.131 | 0.145 | 8.1% | 5 |
| (En4) | 0.310 | 0.157 | 0.166 | 0.138 | 0.258 | 20.6% | 3 |
| (En5) | 0.247 | 0.040 | 0.080 | 0.055 | 0.065 | 9.7% | 4 |
Table A13.
Consistency Index and Consistency Ratio calculation and results for environment criteria.
Table A13.
Consistency Index and Consistency Ratio calculation and results for environment criteria.
| Criteria Code | En1 | En2 | En3 | En4 | En5 | Sum of Row | Sum of Row/ Weight |
|---|---|---|---|---|---|---|---|
| (En1) | 0.32903 | 1.04993 | 0.43839 | 0.42031 | 0.35455 | 2.5922 | 7.878 |
| (En2) | 0.30396 | 0.28635 | 0.53582 | 0.59063 | 0.44806 | 2.1648 | 7.56 |
| (En3) | 0.07374 | 0.04563 | 0.08118 | 0.19505 | 0.21819 | 0.6138 | 7.561 |
| (En4) | 0.49574 | 0.27107 | 0.23273 | 0.20603 | 0.38962 | 1.5952 | 7.742 |
| (En5) | 0.39546 | 0.06927 | 0.1123 | 0.08143 | 0.0974 | 0.7559 | 7.76 |
| lambda max | 7.7 | ||||||
| CI | 0.675 | ||||||
| CR | 0.608 | ||||||
References
- Bruce, G.; Garrard, I. The Business of Shipbuilding; Informa Law from Routledge: London, UK, 2013; ISBN 1315778572. [Google Scholar]
- Chatzinikolaou, S.D.; Ventikos, N.P. Applications of Life Cycle Assessment in Shipping. In Proceedings of the 2nd International Symposium on Naval Architecture and Maritime, Istanbul, Turkey, 23–24 October 2014. [Google Scholar]
- Harbour, J.L. The Basics of Performance Measurement; Productivity Press: Cambridge, MA, USA, 1999; Volume 21, ISBN 9781439802502. [Google Scholar]
- OECD Compensated Gross Ton (CGT) System; OECD: Paris, France, 2007.
- Roque, P.Z.; Gordo, J.M. A Measurement of Shipbuilding Productivity. In Maritime Technology and Engineering 5 Volume 1; CRC Press: Boca Raton, FL, USA, 2021; pp. 801–809. [Google Scholar] [CrossRef]
- Chao, S.L.; Yeh, Y.H. Comparing the Productivity of Major Shipyards in China, South Korea, and Japan—An Application of a Metafrontier Framework. Marit. Bus. Rev. 2020, 5, 193–210. [Google Scholar] [CrossRef]
- Pires, J.F.; Lamb, T.; Souza, C. Shipbuilding Performance Benchmarking. Int. J. Bus. Perform. Manag. 2009, 11, 216–235. [Google Scholar]
- Rabar, D.; Pavletić, D.; Doboviček, S.; Vlatković, M. Dry-Docking Performance Measurement Model–Multi Criteria Non Parametric Approach. Ships Offshore Struct. 2022, 17, 1286–1293. [Google Scholar] [CrossRef]
- Cook, W.D.; Tone, K.; Zhu, J. Data Envelopment Analysis: Prior to Choosing a Model. Omega 2014, 44, 1–4. [Google Scholar] [CrossRef]
- Golany, B.; Roll, Y. An Application Procedure for DEA. Omega 1989, 17, 237–250. [Google Scholar] [CrossRef]
- Banker, R.D.; Cooper, W.W.; Swarts, J.; Thomas, D. An Introduction to Data Envelopment Analysis with Some of Its Models and Their Uses. Res. Gov. Nonprofit Account. 1989, 5, 125–163. [Google Scholar]
- Gavalas, D.; Syriopoulos, T.; Tsatsaronis, M. Assessing Key Performance Indicators in the Shipbuilding Industry; an MCDM Approach. Marit. Policy Manag. 2022, 49, 463–491. [Google Scholar] [CrossRef]
- Sahin, B.; Yazir, D.; Soylu, A.; Yip, T.L. Improved Fuzzy AHP Based Game-Theoretic Model for Shipyard Selection. Ocean Eng. 2021, 233, 109060. [Google Scholar] [CrossRef]
- Vakili, S.V.; Ölçer, A.I.; Schönborn, A. Identification of Shipyard Priorities in a Multi-Criteria Decision-Making Environment through a Transdisciplinary Energy Management Framework: A Real Case Study for a Turkish Shipyard. J. Mar. Sci. Eng. 2021, 9, 1132. [Google Scholar] [CrossRef]
- Baihaqi, I.; Lazakis, I.; Kurt, R.E. Development of a Novel Integrated Value Engineering and Risk Assessment (VENRA) Framework for Shipyard Performance Measurement: A Case Study for an Indonesian Shipyard. Ships Offshore Struct. 2023, 1–16. [Google Scholar] [CrossRef]
- Pires, F.C.M.; Lamb, T. Establishing Performance Targets for Shipbuilding Policies. Marit. Policy Manag. 2008, 35, 491–502. [Google Scholar] [CrossRef]
- Kafali, M.; Ozkok, M.; Cebi, S. Evaluation of Pipe Cutting Technologies in Shipbuilding. Teor. I Praksa Brodogr. I Pomor. Teh. 2014, 65, 33–48. [Google Scholar]
- Kaplan, R.S.; Norton, D.P. The Balanced Scorecard: Measures That Drive Performance. Harv. Bus. Rev. 1992, 83, 71–79. [Google Scholar]
- Ozturkoglu, Y.; Kazancoglu, Y.; Ozkan-Ozen, Y.D. A Sustainable and Preventative Risk Management Model for Ship Recycling Industry. J. Clean. Prod. 2019, 238, 117907. [Google Scholar] [CrossRef]
- Dror, S. The Balanced Scorecard versus Quality Award Models as Strategic Frameworks. Total Qual. Manag. Bus. Excell. 2008, 19, 583–593. [Google Scholar] [CrossRef]
- Dell’Isola, A. Value Engineering: Practical Applications for Design, Construction, Maintenance & Operation; R.S. Means Company, Inc.: Kingston, NJ, USA, 1997; ISBN 0876294638. [Google Scholar]
- SAVE International Value Standard and Body of Knowledge; Mount Royal: New Jersey, USA, 2007.
- Dahooie, J.H.; Dehshiri, S.J.H.; Banaitis, A.; Binkytė-Vėlienė, A. Identifying and Prioritizing Cost Reduction Solutions in the Supply Chain by Integrating Value Engineering and Gray Multi-Criteria Decision-Making. Technol. Econ. Dev. Econ. 2020, 26, 1311–1338. [Google Scholar] [CrossRef]
- Ishak, A.; Ginting, R.; Malik, A.F. Integration of Quality Function Deployment (QFD) and Value Engineering in Improving the Quality of Product: A Literature Review. In Proceedings of the AIP Conference Proceedings; AIP Publishing LLC: Melville, NY, USA, 2020; Volume 2217, p. 30158. [Google Scholar]
- Gunarathne, A.S.; Zainudeen, N.; Perera, C.S.R.; Perera, B.A.K.S. A Framework of an Integrated Sustainability and Value Engineering Concepts for Construction Projects. Int. J. Constr. Manag. 2020, 22, 2178–2190. [Google Scholar] [CrossRef]
- Setti, P.H.P.; Canciglieri Junior, O.; Estorilio, C.C.A. Integrated Product Development Method Based on Value Engineering and Design for Assembly Concepts. J. Ind. Inf. Integr. 2021, 21, 100199. [Google Scholar] [CrossRef]
- Anđelić, O.R.; Rakićević, Z.M.; Nikolić, V.N. Integral Approach to Risk Analysis and Value Engineering. Tehnika 2020, 75, 94–100. [Google Scholar] [CrossRef]
- Masengesho, E.; Wei, J.; Umubyeyi, N.; Niyirora, R. A Review on the Role of Risk Management (RM) and Value Engineering (VE) Tools for Project Successful Delivery. World J. Eng. Technol. 2020, 9, 109–127. [Google Scholar] [CrossRef]
- Baihaqi, I.; Lazakis, I.; Kurt, R.E. Developing a Hybrid Value Engineering and Risk Assessment (VENRA) Framework for Shipbuilding and Ship Repair Industry Performance Measurement. In Proceedings of the International Conference of Ship and Offshore Technology, Surabaya, Indonesia, 19–20 November 2021; pp. 1–10. [Google Scholar]
- Fontela, E.; Gabus, A. The DEMATEL Observer, DEMATEL 1976 Report; Battelle Geneva Research Center: Geneva, Switzerland, 1976. [Google Scholar]
- Gabus, A.; Fontela, E. Perceptions of the World Problematique: Communication Procedure, Communicating with Those Bearing Collective Responsibility; DEMATEL Report No, vol 1; Battelle Geneva Research Centre: Geneva, Switzerland, 1973. [Google Scholar]
- Zadeh, L.A. Fuzzy Sets. Inf. Control 1965, 8, 338–353. [Google Scholar] [CrossRef]
- Kuzu, A.C. Risk Analysis of Break-in-Two Accident of Ships Using Fuzzy DEMATEL Method. Ocean Eng. 2021, 235, 109410. [Google Scholar] [CrossRef]
- Soner, O. Application of Fuzzy DEMATEL Method for Analysing of Accidents in Enclosed Spaces Onboard Ships. Ocean Eng. 2021, 220, 108507. [Google Scholar] [CrossRef]
- Gayathri, C.; Kamala, V.; Gajanand, M.S.; Yamini, S. Analysis of Operational and Financial Performance of Ports: An Integrated Fuzzy DEMATEL-TOPSIS Approach. Benchmarking Int. J. 2022, 29, 1046–1066. [Google Scholar] [CrossRef]
- Thakkar, J.J. Multi-Criteria Decision Making; Kacprzyk, J., Ed.; Springer Nature Singapore Pte Ltd.: Singapore, 2021; ISBN 9789813347441. [Google Scholar]
- Saaty, T.L. The Analytic Hierarchy Process: Planning, Priority Setting, Resource Allocation; Advanced Book Program; McGraw-Hill International Book Company: New York, NY, USA, 1980; ISBN 9780070543713. [Google Scholar]
- Ayan, B.; Abacıoğlu, S.; Basilio, M.P. A Comprehensive Review of the Novel Weighting Methods for Multi-Criteria Decision-Making. Information 2023, 14, 285. [Google Scholar] [CrossRef]
- Chen, S.-J.; Hwang, C.-L. Fuzzy Multiple Attribute Decision Making Methods. In Fuzzy Multiple Attribute Decision Making: Methods and Applications; Springer: Berlin/Heidelberg, Germany, 1992; pp. 289–486. ISBN 978-3-642-46768-4. [Google Scholar]
- Pulli, J.; Heikkilä, J.; Kosomaa, L. Designing an Environmental Performance Indicator for Shipbuilding and Ship Dismantling. Rep. Turku Univ. Appl. Sci. Project ECO-EFFI Final Rep. 2013, 185, 1–54. [Google Scholar]


Disclaimer/Publisher’s Note: The statements, opinions and data contained in all publications are solely those of the individual author(s) and contributor(s) and not of MDPI and/or the editor(s). MDPI and/or the editor(s) disclaim responsibility for any injury to people or property resulting from any ideas, methods, instructions or products referred to in the content. |
© 2023 by the authors. Licensee MDPI, Basel, Switzerland. This article is an open access article distributed under the terms and conditions of the Creative Commons Attribution (CC BY) license (https://creativecommons.org/licenses/by/4.0/).