Article

Welding Penetration Monitoring for Ship Robotic GMAW Using Arc Sound Sensing Based on Improved Wavelet Denoising

1
School of Mechanical and Electrical Engineering, Guilin University of Electronic Technology, Guilin 541004, China
2
Guangxi Engineering Technology Research Center of Ship Digital Design and Advanced Manufacturing, Beibu Gulf University, Qinzhou 535011, China
3
Intelligentized Robotic Welding Technology Laboratory, Shanghai Jiao Tong University, Shanghai 200240, China
4
Faculty of Education, Saitama University, Saitama City 338-8570, Japan
*
Author to whom correspondence should be addressed.
Machines 2023, 11(9), 911; https://doi.org/10.3390/machines11090911
Submission received: 15 August 2023 / Revised: 7 September 2023 / Accepted: 14 September 2023 / Published: 16 September 2023
(This article belongs to the Special Issue Recent Applications in Non-destructive Testing (NDT))

Abstract

:
The arc sound signal is one of the most important aspects of information related to pattern identification regarding the penetration state of ship robotic GMAW; however, arc sound is inevitably affected by noise interference during the signal acquisition process. In this paper, an improved wavelet threshold denoising method is proposed to eliminate interference and purify the arc sound signal. The non-stationary random distribution characteristics of GMAW noise interference are also estimated by using the high-frequency detail coefficients in different domains after wavelet transformation, and a mode of measuring scale that is logarithmically negatively correlated with the wavelet decomposition scale is created to update the threshold. The gradient convergent threshold function is established using the natural logarithmic function structure and concave–convex gradient to enable the nonlinear adjustment of the asymptotic rate. Further, some property theorems related to the optimized threshold function are proposed and theoretically proven, and the effectiveness and adaptability of the improved method are verified via the denoising simulation of speech synthesis signals. The four traditional denoising methods and our improved version are applied in the pretreatment of the GMAW arc sound signal, respectively. Statistical analysis and short-time Fourier transform are used to extract eight-dimensional time and frequency domain feature parameters from the denoised signals with randomly time-varying characteristics, and the extracted joint feature parameters are used to establish a nonlinear mapping model of penetration state identification for ship robotic GMAW using the pattern classifiers of RBFNN, PNN and PSO-SVM. The simulation results yielded by visual penetration classification and the multi-dimensional evaluation index of the confusion matrix indicate that the improved denoising method proposed in this paper achieves a higher accuracy in the extraction of penetration state features and greater precision in the identification of pattern classification.

1. Introduction

During ship robotic gas metal arc welding (GMAW), the penetration state of welded joints is the most intuitive standard that can be used to evaluate the welding quality, and the quality requirement of the welding specification states that one must obtain flat and fully penetrated welded joints. However, due to various factors, such as the welding process, weldment materials, etc., defects of partial penetration and excessive penetration are easily generated in the actual production site, which means watertight integrity and the overall structural strength of ships cannot be guaranteed, thus further leading to hull leakage, structural fractures, and even sinking accidents during ship navigation [1,2]. Hence, the monitoring of the GMAW penetration state is particularly important in order to ensure the reliability of ship welding. However, traditional monitoring methods employed at shipyards include ultrasonic and X-ray testing, which encounter problems such as high labor costs, low detection accuracy, and poor real-time performance. With the development of large-scale ships, the welding process and workpiece shaping of ship structures have become more complex, particularly in the harsh welding environment that pertains during ship repair and construction. Consequently, there is a pressing requirement for simple and effective means of information collection via sensing that adhere to the aforementioned welding advancement conditions. As it employs a non-contact microphone, arc sound sensing has loose placement environment requirements, employing simple and lightweight equipment that is not affected by the shape of the workpiece. The arc sound signal can be equated to the welder’s sensory function, mimicking their knowledge, skill, and decision-making behavior models. All of this demonstrates the potential application of arc sound sensing in ship robotic GMAW.
However, traditional monitoring approaches encounter the problems of high labor costs, low detection accuracy, poor real-time performance, etc. However, intelligent welding with integrated multi-sensors [3] can acquire and analyze information during welding, identify the penetration state online, and provide real-time control feedback, thus effectively improving welding quality and production efficiency, and greatly reducing construction cost. Realizing intellectualization in ship robotic GMAW will allow us to obtain welding information that effectively represents the penetration state. Currently, the most widely employed techniques for penetration detection include the use of vision, arc voltage, and weld pool oscillation. Gao et al. [4] designed a biprism passive stereo visual system that utilizes a single camera to obtain three-dimensional images of the weld pool, and relied on a deep learning stereo matching network to achieve penetration classification. Zhang et al. [5] proposed that the fluctuation amplitude of arc voltage during the peak duration (Delta U-k) indicates the weld penetration state in a single-weld location. Ebrahimi et al. [6,7] analyzed the impacts of process parameters on the oscillation behavior of the weld pool, and developed a high-fidelity 3D model through numerical simulation to predict the frequency and amplitude of weld pool oscillation, which allows the identification of the penetration state. Compared to the methods mentioned above, arc sound information [8], as a non-contact vibration source signal, has the advantages of minimal placement requirements, convenient information collection, a high degree of freedom of use, etc., and has always been regarded as a very applicable and valuable form of feature information that can be derived in real time during online welding quality monitoring in the welding industry. Gao et al. [9] employed short-term Fourier transform to obtain time–frequency spectral images of arc sound signal, which were then fused with a convolutional neural network to enable the identification of the weld penetration state. Wu et al. [10] presented a novel method for identifying penetration based on time and spectrum images of arc sound using deep learning for DC GTAW. Ren et al. [11] proposed the log–spectral interpretation of raw arc sound data in order to develop an optimized convolutional neural network (CNN) model that could be used for the classification of penetration state. The outcomes of these investigations suggest that it is feasible to identify the weld penetration state using arc sound signals.
The excitation source of arc sound is the change in arc energy and the oscillation of the weld pool, and the arc sound signal acquired in a non-closed field not only yields the process information of the whole ship robotic GMAW process, but is also easily interfered with by various highly nonlinear noise sources [12,13,14]. These noises are mainly divided into sensor noise [15], impulse noise [16] and environmental noise [17,18]. Among these, sensor noise is mainly produced by the drift noise generated by DC components, including sound sensors. This noise causes the arc sound signal to deviate from the zero-base line. Usually, methods of de-averaging, DC negative feedback intervention and differential amplifier circuit can be adopted to suppress this interference. Impulse noise is a noisy signal generated by the periodic characteristics of the working current of a welding machine; it is closely related to the formation process of quality welding, and the information it contains includes the partial change laws of the penetration state. Environmental noise is mainly composed of two random signals, i.e., the movement of mechanical equipment and the voices of operators. This part of the noise is integrated into the data set of arc sound that represents the characteristics of weld formation, which undoubtedly increases the difficulty of determining the penetration state. Therefore, the development of a denoising method to be applied to environmental noise in sound sensing is one of the most essential research objectives in solving the problem of penetration state identification for ship robotic GMAW.
Particle filters [19,20], ICA blind signal separation [21,22,23] and band-pass filters [24,25] are commonly used for denoising at present, but have limitations when applied to ship arc information interpretation. Particle filters must establish a state space model of the prior characteristics of unknown noise in the process of denoising. ICA blind signal separation [26,27] requires that the components of the signal source be statistically uncorrelated, and the band-pass filter significantly weakens the useful information present in the cutoff frequency, resulting in the serious distortion of the arc sound signal. However, the noise interference that arises during ship robotic GMAW is unknown, shows multiple types of coupling, is highly nonlinear, and is widely distributed across the whole frequency band, which means the above traditional denoising methods cannot be effectively applied. The wavelet threshold denoising [28,29,30] method has good local time–frequency characteristics, and has obvious advantages in the denoising of the arc sound signal with random and non-stationary characteristics. Given its own multi-scale wavelet decomposition characteristics, the low-frequency and high-frequency parts of a noisy signal are analyzed bidirectionally, and the signal energy contained in the wavelet coefficients at each decomposition scale is used as the weight to quantitatively measure useful signal and noise signal. Ma [31], Liu [32], Huang [33] and Wu [34] each applied wavelet threshold denoising to an arc sound signal interfered with by external noise under different welding modes, such as carbon dioxide arc welding, MIG, MAG and aluminum alloy VPPAW. The results indicate that the signal “glitch” was filtered out, the waveform distortion was small, and the signal-to-noise ratio was improved; Yu [35] took the splash noise in the MIG welding arc sound as the object of denoising, and designed examples of the application of different types of wavelet basis functions. By comparison, it was concluded that the signal-to-noise ratio of Daubechies series wavelet processing was notably higher than that of Symlets; Shi and Bi et al. [36,37] denoised the arc sound at different stages of droplet transfer. The denoised signals can be used to separate the abrupt parts of useful signals and noise information, and identify the power spectral density distribution at different stages. Therefore, it was concluded that the wavelet threshold denoising method is effective in arc sound signal preprocessing for GMAW. However, the algorithm itself displays the shortcomings of being a singular estimation method and yielding fixed corresponding values of different decomposition layers, which cannot be effectively used to identify the boundary threshold of the GMAW penetration state information and noise interference signals at different decomposition scales; further, when simultaneously adding the inherent defects, such as discontinuity and constant deviation, of the hard and soft threshold functions, the distribution law of the wavelet energy of noise interference at the decomposition scale cannot be met. As a result, the effects of denoising the arc sound signal are greatly reduced, and as such, effective arc sound information for the feature extraction and classification identification of the penetration state for ship robotic GMAW cannot be derived.
To resolve the application limitations of the wavelet threshold denoising method, an improved method of adaptive threshold estimation and threshold function optimization is proposed, which considers the highly nonlinear characteristics of arc sound noisy signals in ship robotic GMAW as well as the inherent defects of threshold estimation and hard and soft threshold functions. A measure of scale that is logarithmically negatively correlated with the decomposition scale is introduced to update the adaptive threshold boundary between the useful signal and noise interference in different wavelet domains. The natural logarithmic function structure with concave–convex gradient adjustment is selected to optimize the threshold function, allowing it to conform with the changes in the laws of the wavelet energy distribution of noise interference with decomposition scale. At the same time, a related property theorem of the improved threshold function is proposed and proven, and the effectiveness and adaptability of the improved denoising method are verified via the simulation of specific speech synthesis signals. This improved method and four traditional denoising methods are applied in the arc sound preprocessing of ship robotic GMAW. Statistical analysis and Fourier transform are used to extract the time and frequency domain feature parameters of the denoised signals, and their combined feature parameters are input into the identification models of three penetration state classifiers, i.e., RBFNN, PNN and PSO-SVM. The multidimensional evaluation index of visual penetration classification and the confusion matrix indicates that the improved denoising method achieves better accuracy in feature extraction and penetration identification, showing that the improved method is obviously superior in the denoising of random non-stationary signals.
In this paper, a novel methodology for weld penetration monitoring is proposed based on arc sound sensing via wavelet denoising in ship robotic GMAW. The remainder of this paper is structured as follows. Section 2 discusses the background theory of wavelet-based threshold denoising. Section 3 proposes an improved denoising method and proves the relevant theorems. Section 4 presents the GMAW monitoring platform and experimental design. Section 5 demonstrates different wavelet denoising methods with applicability in penetration state identification for ship GMAW. Finally, Section 6 summarizes the main conclusions.

2. Denoising Principle Based on Wavelet Threshold

The wavelet threshold denoising method has the advantages of a simple algorithm structure, low calculation costs and remarkable denoising effects, and is widely used for processing various random non-stationary signals. The noisy signal is decomposed by wavelet transform to obtain low-frequency approximation and high-frequency detail coefficients. In accordance with the propagation characteristics of different types of signal coefficients in the decomposition scale domain, the high-frequency detail coefficients are quantified by estimating thresholds based on noise distribution characteristics and selecting reasonable threshold functions, while the low-frequency approximation coefficients and quantified high-frequency detail coefficients are reconstructed by inverse wavelet transformation to obtain the denoised signal [38,39].
The mathematical model of a one-dimensional noisy signal f n is:
f n = s n + σ e n ,   n = 1 ,   2 , , N
where s n is a useful signal, e n is a noise signal with standard deviation σ , n is the time series, and N is the total number of sampling points.
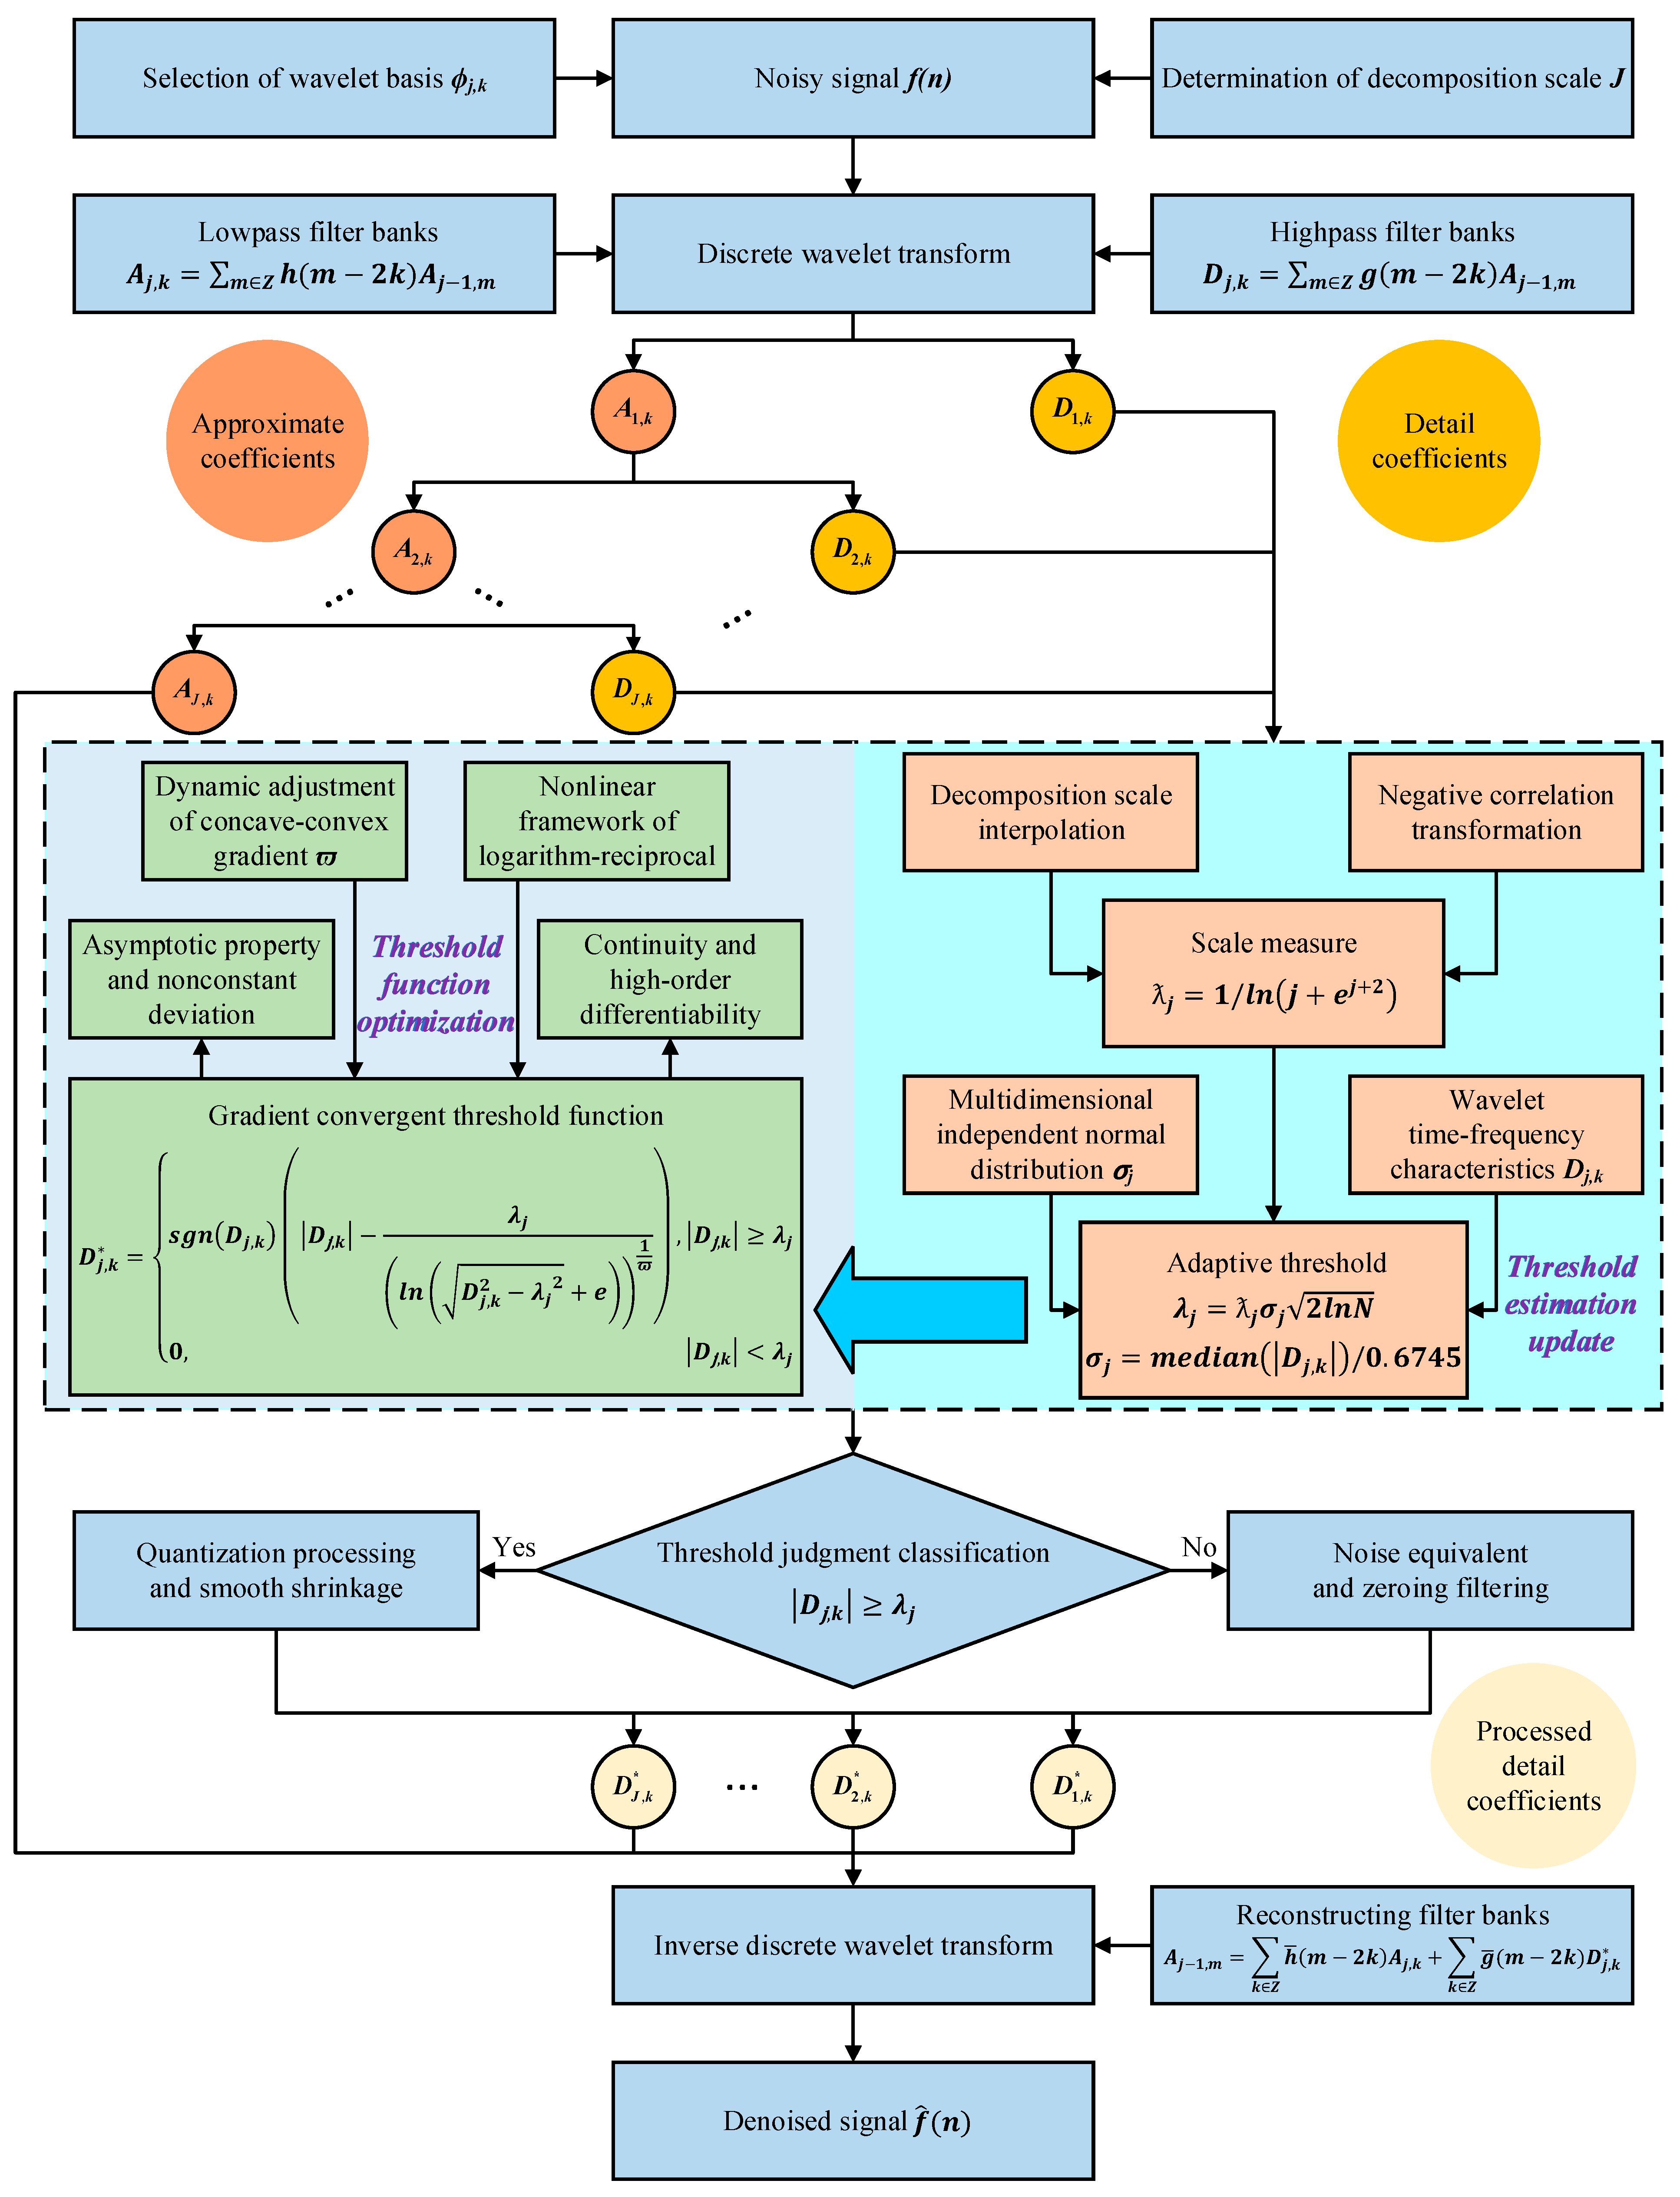
The process of denoising the noisy signal f n using the wavelet threshold denoising method involves filtering out the noise component e n contained in the signal to the greatest extent, so as to obtain a denoised signal f ^ n that is indistinguishable from s n . The process of the wavelet threshold denoising method is shown in Figure 1, and the specific steps of its implementation can be expressed as follows:
  • Wavelet decomposition. An appropriate wavelet basis function ϕ j , k and the maximum decomposition scale J are selected. The discrete wavelet transformation is performed on the noisy signal f n via the Mallat algorithm [40] to sequentially obtain the low-frequency approximation coefficients A j , k and the high-frequency detail coefficients D j , k of layers 1 to J through low-pass and high-pass filtering:
A j , k = m Z h ( m 2 k ) A j 1 , m  
D j , k = m Z g ( m 2 k ) A j 1 , m
where h and g are low-pass and high-pass filters, respectively, k is the serial number of the wavelet coefficients, m is the wavelet length, j = 1 ,   2 , ,   J , and Z is an integer set;
  • Threshold processing. The approximation coefficients A J , k of the decomposition scale layer J are retained. On the premise of keeping the tree structure of the wavelet decomposition coefficients unchanged in accordance with the distribution characteristics of the noise wavelet coefficients in the wavelet domain, through threshold λ and a comparison with the high-frequency detail coefficients D j , k , an appropriate threshold function is selected to quantify the classification coefficients. Accordingly, the updated and corrected detail coefficients D j , k * are obtained;
  • Signal reconstruction. The modified detail coefficients D j , k * and the approximation coefficients A J , k of layer J are subjected to inverse discrete wavelet transformation through the reconstruction filter bank, and the denoised signal f ^ n is obtained,
A j 1 , m = k Z h ¯ m 2 k A j , k + k Z g ¯ ( m 2 k ) D j , k *
where h ¯ and g ¯ are the conjugate operations of h and g , respectively.
Through the analysis of wavelet threshold denoising, it can be concluded that the selection of threshold estimation methods and the structures of threshold functions are the two key factors that determine the denoising effects. Accordingly, if the threshold is too large, some useful signals will be filtered out, resulting in useful signal loss and deviation; if the threshold is too small, the wavelet coefficients of some noise signals will be preserved, resulting in incomplete denoising [41]. The selection of the most commonly used threshold formulae can be performed via
λ = σ 2 l n N
where the estimated value of standard noise deviation σ = m e d i a n D 1 , k / 0.6745 , and m e d i a n D 1 , k is the median of the set of detail coefficients with decomposition scale j = 1 .
Threshold functions are primarily hard and soft, as proposed by Donoho et al. [42,43]. The hard threshold function (HTF) equates all the detail coefficients below the threshold with noise and returns them to zero, while all the detail coefficients beyond the threshold remain unchanged. The soft threshold function (STF) is the same as the HTF, except that the wavelet coefficients greater than or equal to the threshold are uniformly reduced, in accordance with the fixed threshold λ .
The HTF is defined as:
D j , k * = D j , k ,     D j , k λ 0 ,     D j , k < λ
The formula of STF is:
D j , k * = s g n ( D j , k ) D j , k λ , D j , k λ   0 ,                D j , k < λ
where s g n ( ) is the sign function.

3. Improvement Analysis for Wavelet Threshold Denoising

The wavelet threshold denoising method shows some limitation in threshold estimation and determining the threshold function structure, which directly affects the denoising effect. By introducing the measure of scale to update the threshold formula and establish an optimized threshold function, the denoising effect is improved, and the relevant characteristics of the improved threshold function are theoretically proven. At the same time, a simulated denoising experiment can be undertaken using speech synthesis signals with different noise intensities to verify the effectiveness and adaptability of the improved method.

3.1. Estimation Update and Function Optimization of Threshold

In accordance with the theory of wavelet analysis [44,45,46], after the wavelet decomposition of a noisy signal, the wavelet coefficients of the useful signal and noise signal will show different distribution characteristics in the wavelet domain at different decomposition scales. Wavelet coefficients can be used to infer the time–frequency characteristics of the extracted signal, in which the wavelet coefficients of the useful signal are large and mainly concentrated in the large-scale wavelet space, while the wavelet coefficients of the noise signal are small, and are distributed in the whole wavelet domain but mainly concentrated in the small-scale wavelet space; they will also gradually decrease with the increase in decomposition scale. However, the estimated value of the traditional threshold at each decomposition scale remains unchanged, and denoising failures will occur during quantization, such as incomplete noise filtering caused by the small decomposition scale and excessive losses of useful signal caused by the large decomposition scale.
To reduce the defects of the wavelet threshold denoising method related to the single threshold estimation method used and the fixed value [47], in this paper, an adaptive threshold estimation method is proposed. Giving full play to the advantages of traditional threshold estimation by using multi-dimensional independent normal joint distribution, the differences in the distribution characteristics of the corresponding wavelet coefficients of different signals in the decomposition scale domain can be scientifically identified, and traditional threshold estimation is thus updated by introducing a measure of scale ƛ j with a logarithmic negative correlation with the decomposition scale j , such that the threshold λ j decreases with the increase in the decomposition scale j . The adaptive ability of threshold estimation is in this way greatly increased, while fully conforming to the law of variation of the noise signal as the decomposition scale j changes, which reduces the threshold deviation and improves the denoising effect. The formula for estimating the adaptive threshold is as follows:
λ j = ƛ j σ j 2 l n N
where the measure of scale ƛ j = 1 / l n j + e j + 2 , noise variance σ j = m e d i a n D j , k / 0.6745 , D j , k is the decomposition scale, and j is the median of the high-frequency detail coefficient set.
The selection of threshold functions is essential in ensuring the denoising effect. HTF has the advantage of preserving the local characteristics of the signal edges, but because of the existence of a discontinuity point of the first kind at the threshold ± λ , the reconstructed signal manifests a pseudo-Gibbs phenomenon [48], causing additional oscillation in the reconstructed sequence, as a result of which the signal’s smoothness is greatly reduced. The consistent continuity of STF can make up for some of the defects of HTF, and the overall trend of the denoised signal is relatively smooth. However, continuous processing causes constant systematic deviations of the quantization results [49], resulting in the loss of too much high-frequency information, which directly affects the degree of approximation between the reconstructed signal and the real signal.
By analyzing this principle, the advantages and disadvantages of hard and soft threshold denoising methods can be inferred, and they can be optimized to improve the denoising effect. In addressing the inherent defects of HTF and STF, following the basic principle that the threshold function is continuous and high-order-derivable in a specific wavelet space domain, this paper designs a gradient convergent threshold function (GCTF) with asymptotic, continuous, non-constant deviation and high-order differentiability, as shown in Formula (9). Taking into account the advantages of the integrity and smoothness of HTF and STF signal extraction, it should be considered that the asymptotic property overcomes the defect of the over-smoothing and blurring of the signal edge in STF, and continuously solves the problem of the poor denoising effect related to the pseudo-Gibbs phenomenon caused by the local intermittent oscillation of HTF. At the same time, the concave–convex gradient introduced to characterize the change trend and asymptotic rate of the GCTF is used to adjust the approximation degree, so as to achieve the goal of eliminating constant deviation, and comprehensively improving the self-adaptability and signal fidelity of GCTF.
D j , k * = s g n D j , k D j , k λ j l n D j , k 2 λ j 2 + e 1 ϖ , D j , k λ j 0 ,                                                                                                                                 D j , k < λ j
where the concave–convex gradient ϖ > 0 .
Based on the above analysis, threshold estimation can be updated and improved to ensure the adaptability of the threshold to different decomposition scales, and the structure of the threshold function can be optimized to avoid the phenomena of oscillation and distortion in the reconstructed signal. Via the above two improvements, the effectiveness of the wavelet threshold denoising method can be comprehensively improved. The improvement measures and denoising process are shown in Figure 2.

3.2. Theoretical Proof of the GCTF

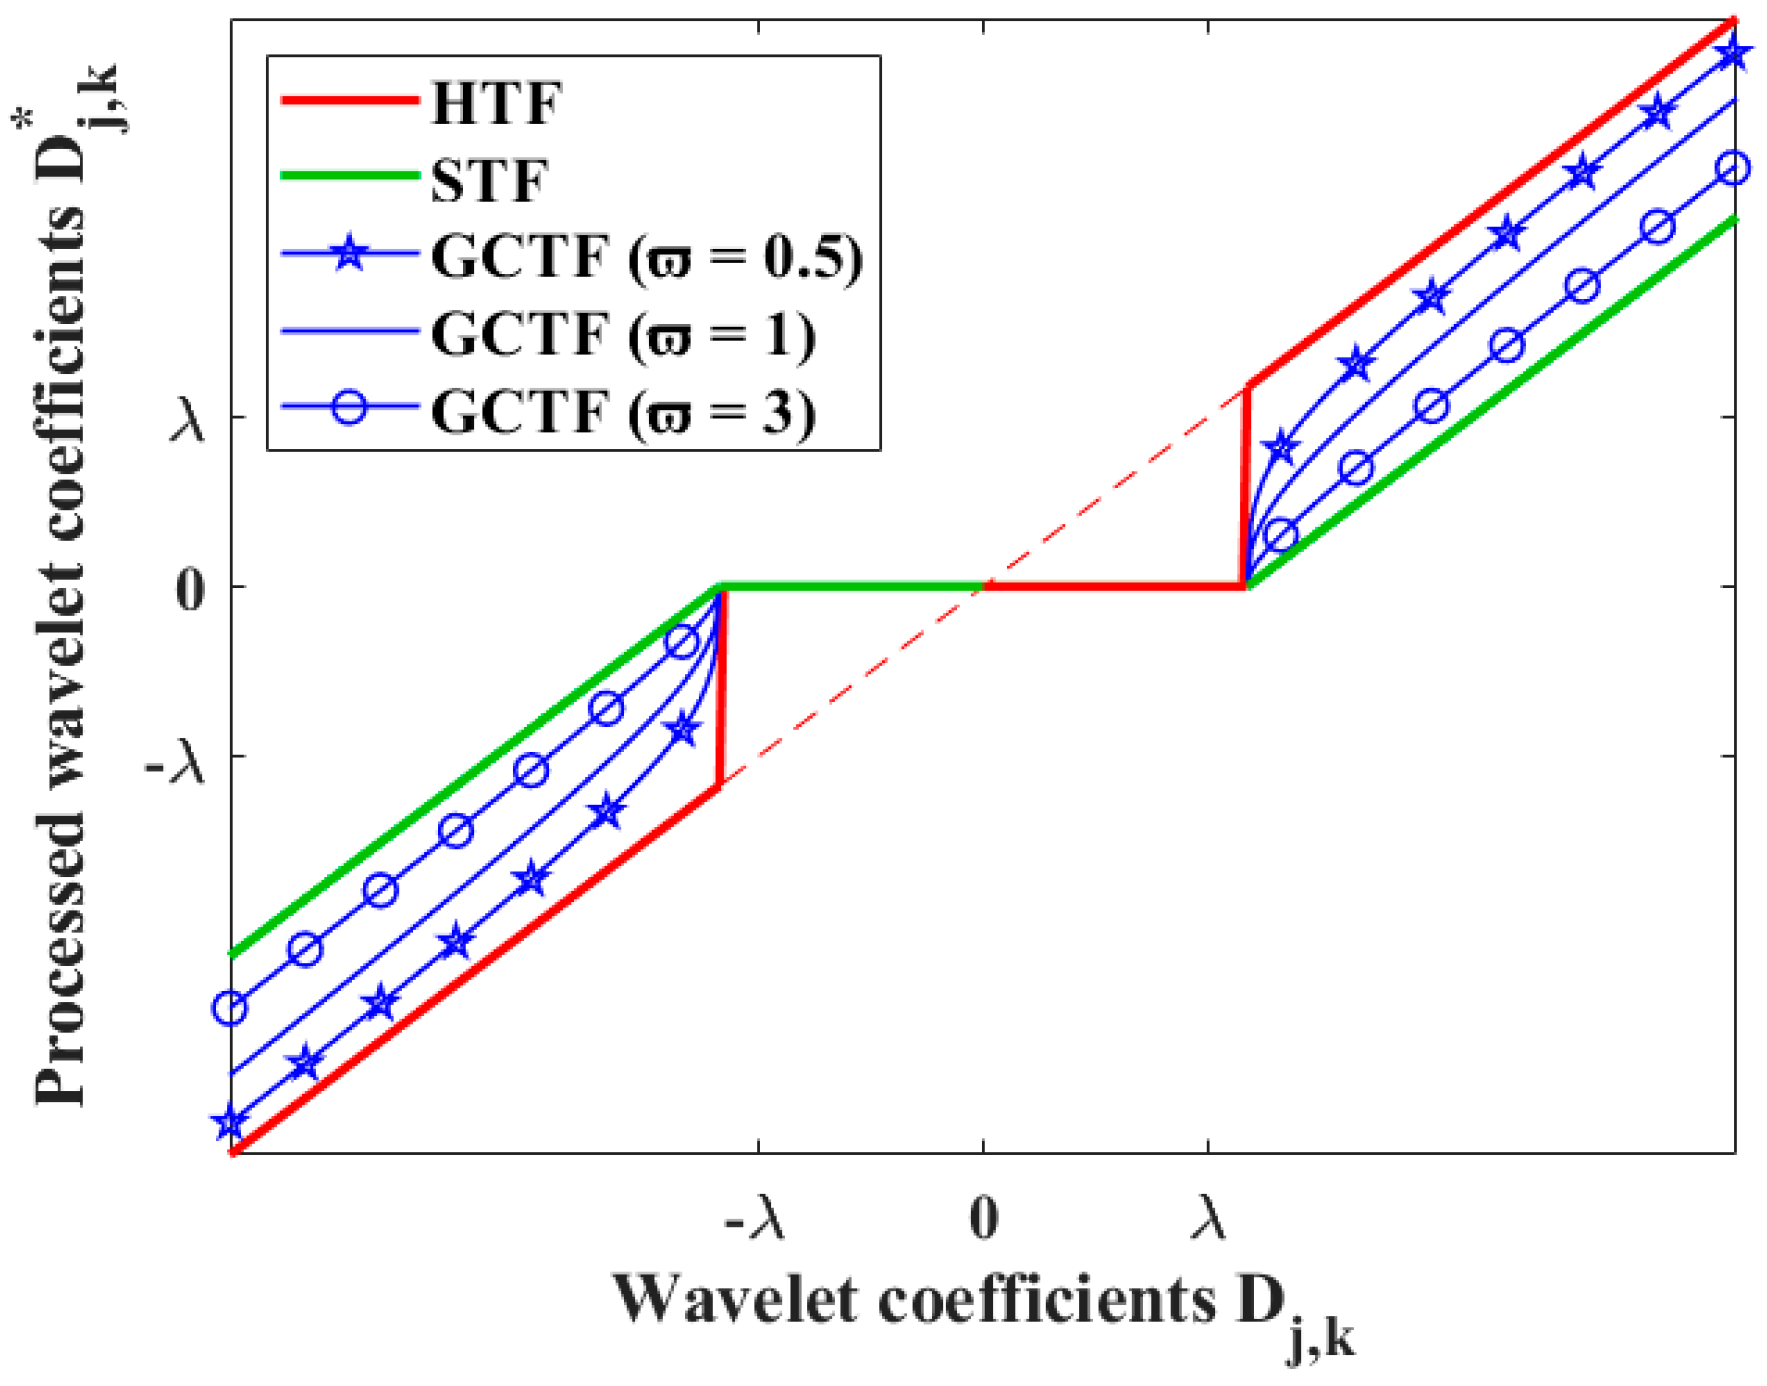
After the threshold for the determination of noise in the wavelet domain is assigned, the threshold function is selected to respectively filter and retain the equivalent noise and the useful signal. In giving play to the advantages of HTF and STF, the optimized threshold function constructs a GCTF while satisfying the threshold characteristics, such as being asymptomatic, continuous, etc., and introduces a concave–convex gradient ϖ to characterize the rate at which HTF is approached so as to adjust the changing trend, as shown in Figure 3, which reduces the influence of constant deviation on the denoising effect.
The GCTF is between HTF and STF, as shown in Figure 3. When the amplitudes of the wavelet coefficients are not less than the threshold λ j , it is determined that they are mainly generated by a useful signal, and the function amplitude is subjected to reserved shrinkage processing on the original coefficients. The degree of shrinkage decreases with the increase in wavelet coefficients and the decrease in concave–convex gradient ϖ , and when ϖ 0 / + , the GCTF is equivalent to HTF/STF. When the amplitude of the wavelet coefficients is less than the threshold λ j , all the wavelet coefficients are reset to zero, thus realizing the separation of useful and noise signals in the wavelet transform domain. At the same time, the theoretical proof of the related properties of the GCTF can be given as:
Definition 1. 
Referring to Formula (9) of the GCTF, we suppose that  Ψ  is a wavelet domain space and  R +  represents a set of positive real numbers. The low-frequency approximation coefficient set  A  and high-frequency detail coefficient set  D  are obtained after the wavelet transformation of the noisy signal  f n , while  A , D = Γ Ψ ,  D j , k  is the  k t h  wavelet coefficient of the decomposition scale  j , and   D j , k D .  D j , k *  is the quantized wavelet coefficient, and   λ j  is the adaptive threshold that varies with the decomposition scale  j , ϖ  is a concave–convex gradient, and  ϖ ,   λ j R + .
Proof of Lemma 1 Continuity. 
When the high-frequency detail wavelet coefficient D j , k approaches the adaptive threshold λ j + to an infinite dgree, the limit on the left and the limit on the right can be obtained, respectively. When D j , k λ j + ,
l i m D j , k λ j + D j , k * = l i m D j , k λ j + D j , k λ j l n D j , k 2 λ j 2 + e 1 ϖ = 0
Similarly, when D j , k λ j ,
l i m D j , k λ j D j , k * = 0
and compared with the function value,
l i m D j , k λ j + D j , k * = l i m D j , k λ j D j , k * = D j , k * | D j , k = λ j = 0
That is, the D j , k * of the GCTF is continuous at D j , k = λ j . Similarly, D j , k * is continuous at D j , k = λ j . It is concluded that D j , k * is continuous in the whole wavelet domain of D j , k D .
Proof of Lemma 2 Asymptotic Property. 
When the high-frequency detail wavelet coefficient D j , k is infinitely close to + , the asymptote is found:
l i m D j , k + D j , k * D j , k = l i m D j , k + 1 λ j D j , k l n D j , k 2 λ j 2 + e 1 ϖ = 1
Similarly, when D j , k ,
l i m D j , k D j , k * D j , k = 1
it can be concluded that
l i m D j , k D j , k * = D j , k
When the oblique asymptote of GCTF is D j , k * = D j , k , it converges to HTF.
Proof of Lemma 3 Non-constant Deviation. 
We assume that the deviation between GCTF and HTF is Δ = D j , k D j , k * . When D j , k [ λ j , + ) in the wavelet domain, it can be inferred that
= λ j l n D j , k 2 λ j 2 + e 1 ϖ
On the premise that threshold λ j and the concave–convex gradient ϖ are known and determined, ( D j , k ) shows the characteristics of a decreasing function.
When D j , k λ j ,
l i m D j , k λ j = lim D j , k λ j λ j l n D j , k 2 λ j 2 + e 1 ϖ = λ j
When D j , k + ,
l i m D j , k + = lim D j , k + λ j l n D j , k 2 λ j 2 + e 1 ϖ = 0
It can be concluded that the deviation Δ between the GCTF and HTF is reduced with the increase in wavelet coefficient D j , k until it tends to 0, and the deviation fluctuation range is ( 0 , λ j ] . Similarly, when D j , k ( , λ j ] is in the wavelet domain, the above conclusion is also satisfied.
Proof of Lemma 4 Approximation Rate of Concave–Convex Gradient. 
We assume that the GCTF D j , k * ( D j , k , ϖ ) is a binary function related to the wavelet coefficients D j , k and concave–convex gradient ϖ . When D j , k [ λ j , + ) is in the wavelet domain, the first-order partial derivative is as follows:
D j , k * D j , k = 1 + λ j l n D j , k 2 λ j 2 + e 1 ϖ 1 ϖ D j , k 2 λ j 2 D j , k 2 λ j 2 + e > 1
Similarly, by calculating the second-order partial derivative 2 D j , k * D j , k 2 < 0 , it can be inferred that D j , k * ( D j , k , ϖ ) is a monotone increasing function and convex function related to D j , k .
When ϖ R + is within this domain,
D j , k * ϖ = λ j l n l n D j , k 2 λ j 2 + e ϖ 2 l n D j , k 2 λ j 2 + e 1 ϖ < 0
It can be concluded that D j , k * ( D j , k , ϖ ) is a monotonic decreasing function related to ϖ ; that is, the smaller ϖ is, the faster the GCTF approaches HTF. Similarly, when D j , k [ λ j , ) is in the wavelet domain, the above conclusions are also satisfied. Obviously, the concave–convex gradient ϖ does not affect the threshold characteristics of the GCTF, such as monotonicity, concavity–convexity, continuity, etc. However, the approximation degree can be changed by adjusting the size of the value, so as to improve the denoising effect.

3.3. Verification of Speech Signal Denoising

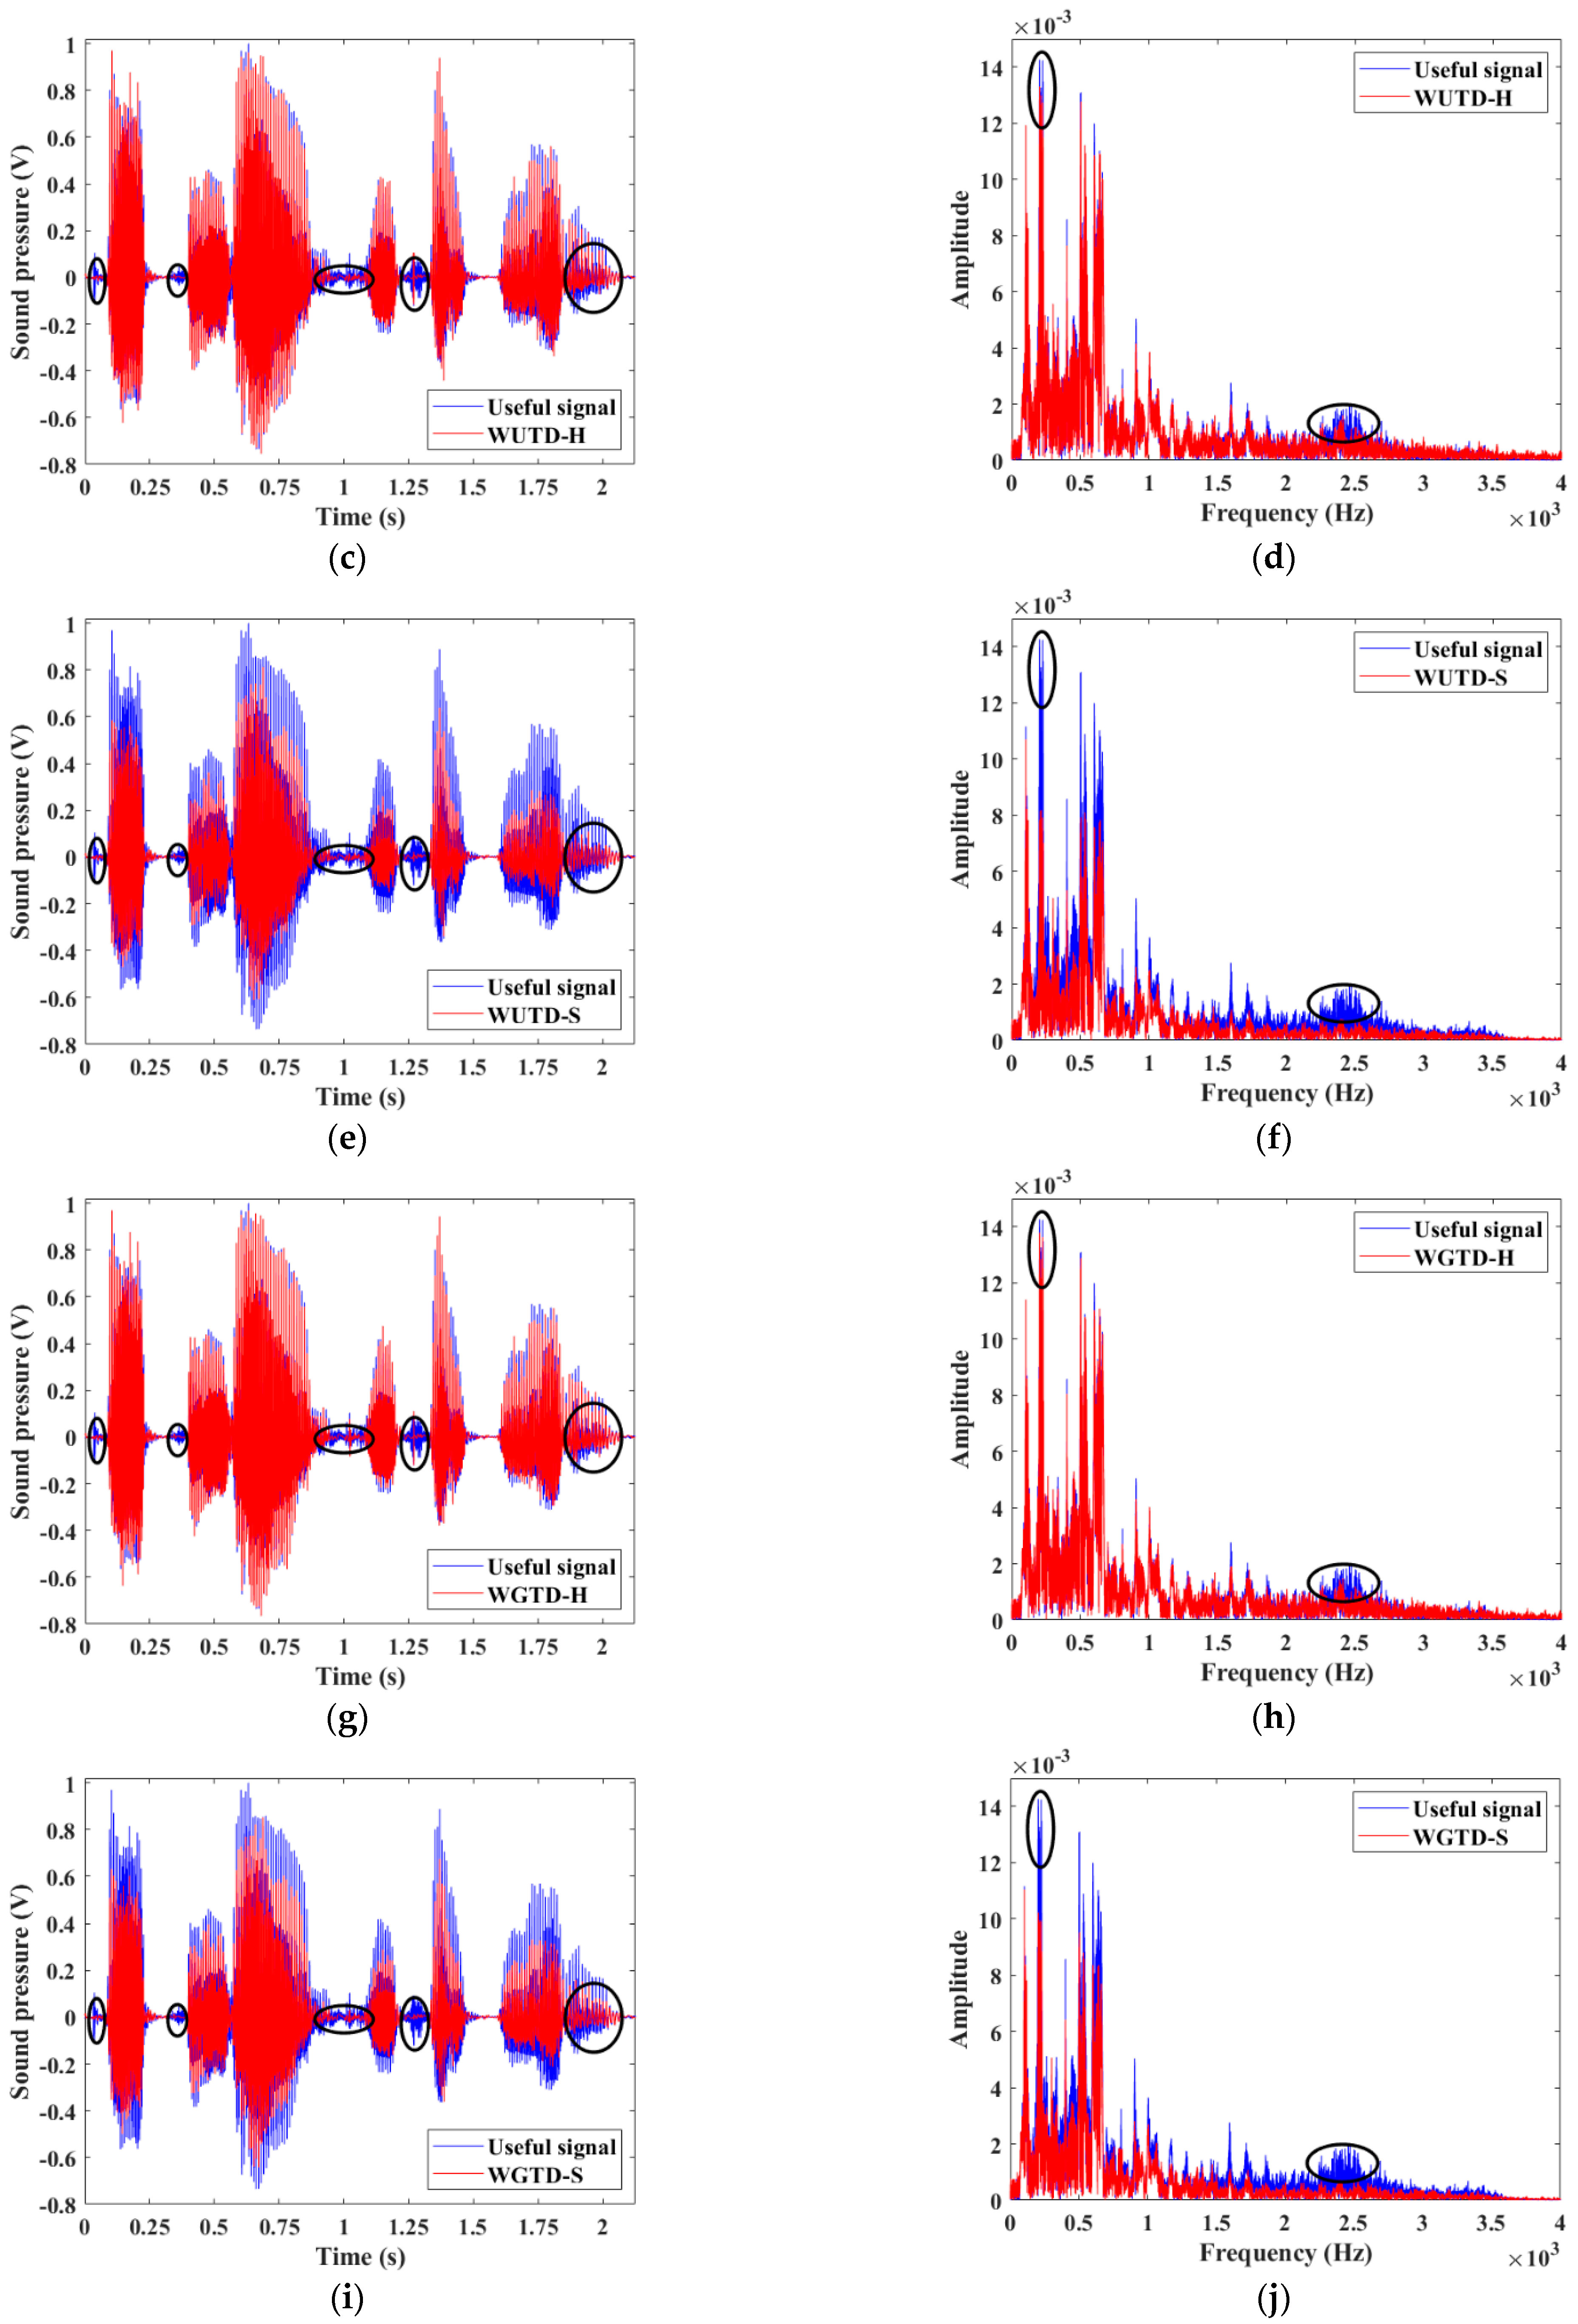
To verify the denoising effect of the improved method proposed in this paper, a speech signal with sampling frequency of f s = 8   k H z and signal length N = 17,000 is selected as the research object. At the same time, it is assumed that the signal is interfered with by Gaussian white noise at different degrees, and it is synthesized into a noisy signal in the MATLAB environment for denoising. During wavelet decomposition, db4 is selected as the basis function, the decomposition scale is set to J = 5 , and Gaussian white noise with an input SNR of 14 dB is added. Between Figure 4a,b, the time and frequency domains of the noisy signal are compared. Employing the same parameter settings, but with the selection of different global/universal thresholds [50,51] and HTF/STF, five methods (soft threshold function-based wavelet global threshold denoising (WGTD-S), hard threshold function-based wavelet global threshold denoising (WGTD-H), soft threshold function-based wavelet universal threshold denoising (WUTD-S), hard threshold function-based wavelet universal threshold denoising (WUTD-H) and gradient convergence threshold function-based wavelet adaptive threshold denoising (WATD-GC) (as proposed in this paper)) are applied in the simulated test to achieve information comparisons between the time and frequency domains in the process of obtaining denoised signals, as shown in Figure 4.
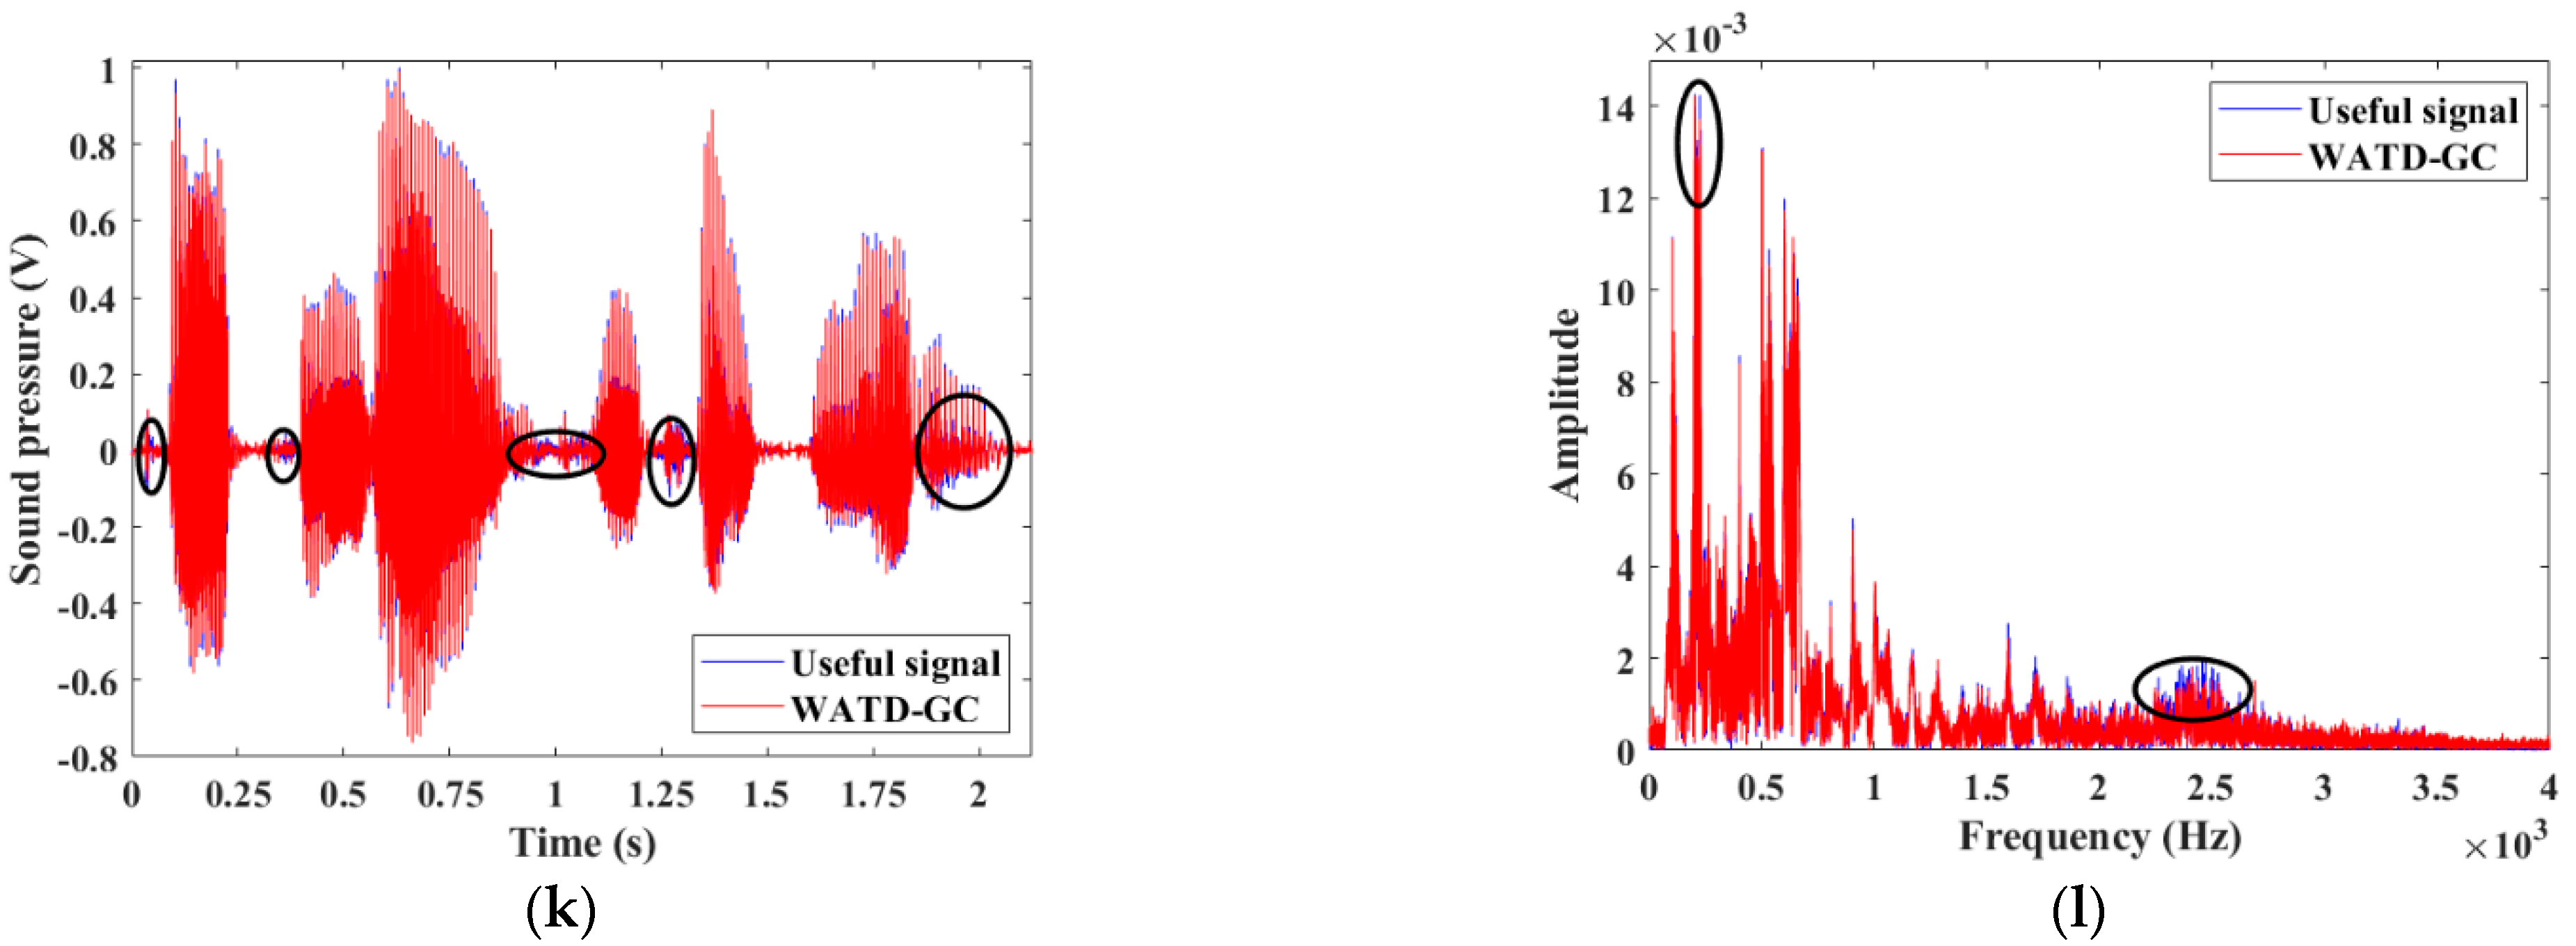
Compared to the useful signal, the time domain information of denoised signals can be used to intuitively judge the denoising effects of different methods, while the frequency domain information can be used to evaluate the reliability of the denoising methods. From the results regarding the influence of noise on the useful signal in the time and frequency domains shown in Figure 4a,b, it can be concluded that the noise is distributed in the whole time domain, and the frequency spectrum curve waveform of the noisy signal is changed, while the amplitude is slightly reduced compared with the useful signal. Figure 4c–l show comparisons of five types of denoised signals with useful signals, in terms of both time and frequency domain information. Compared with other methods, the WATD-GC method basically retains the same trend as the denoised signal and useful signal waveforms in the time domain, and reduces the level of “glitch” without distortion; the range of energy regions corresponding to peaks and valleys in the frequency domain is not changed, while the high-frequency band containing concentrated noise shows obvious denoising and little difference in amplitude, and the main frequency characteristics of useful information are kept relatively intact.
In this paper, signal-to-noise ratio (SNR), root mean square error (RMSE), smoothness [52] and normalized cross-correlation (NCC) [53] are introduced as the indexes to evaluate the denoising effects of the five methods. Accordingly, SNR can be used to represent the power proportional relationship between useful signal and noise signal, while RMSE reflects the reconstruction error of the signal after denoising, smoothness is the ratio of the difference between the squares of the denoised signal f ^ ( n ) and the useful signal s n (representing the local mutation degree of the signal after denoising), and NCC refers to the similarity between the denoised signal f ^ ( n ) and the useful signal s n . The larger the SNR is, the smaller the RMSE is, and the closer the smoothness and NCC are to 1, indicating that the denoised signal is less distorted and closer to the useful signal. Table 1 shows the expressions of four evaluation indexes, and comparisons of the indexes after denoising using different methods when the input SNR of the noisy signal is 14 dB.
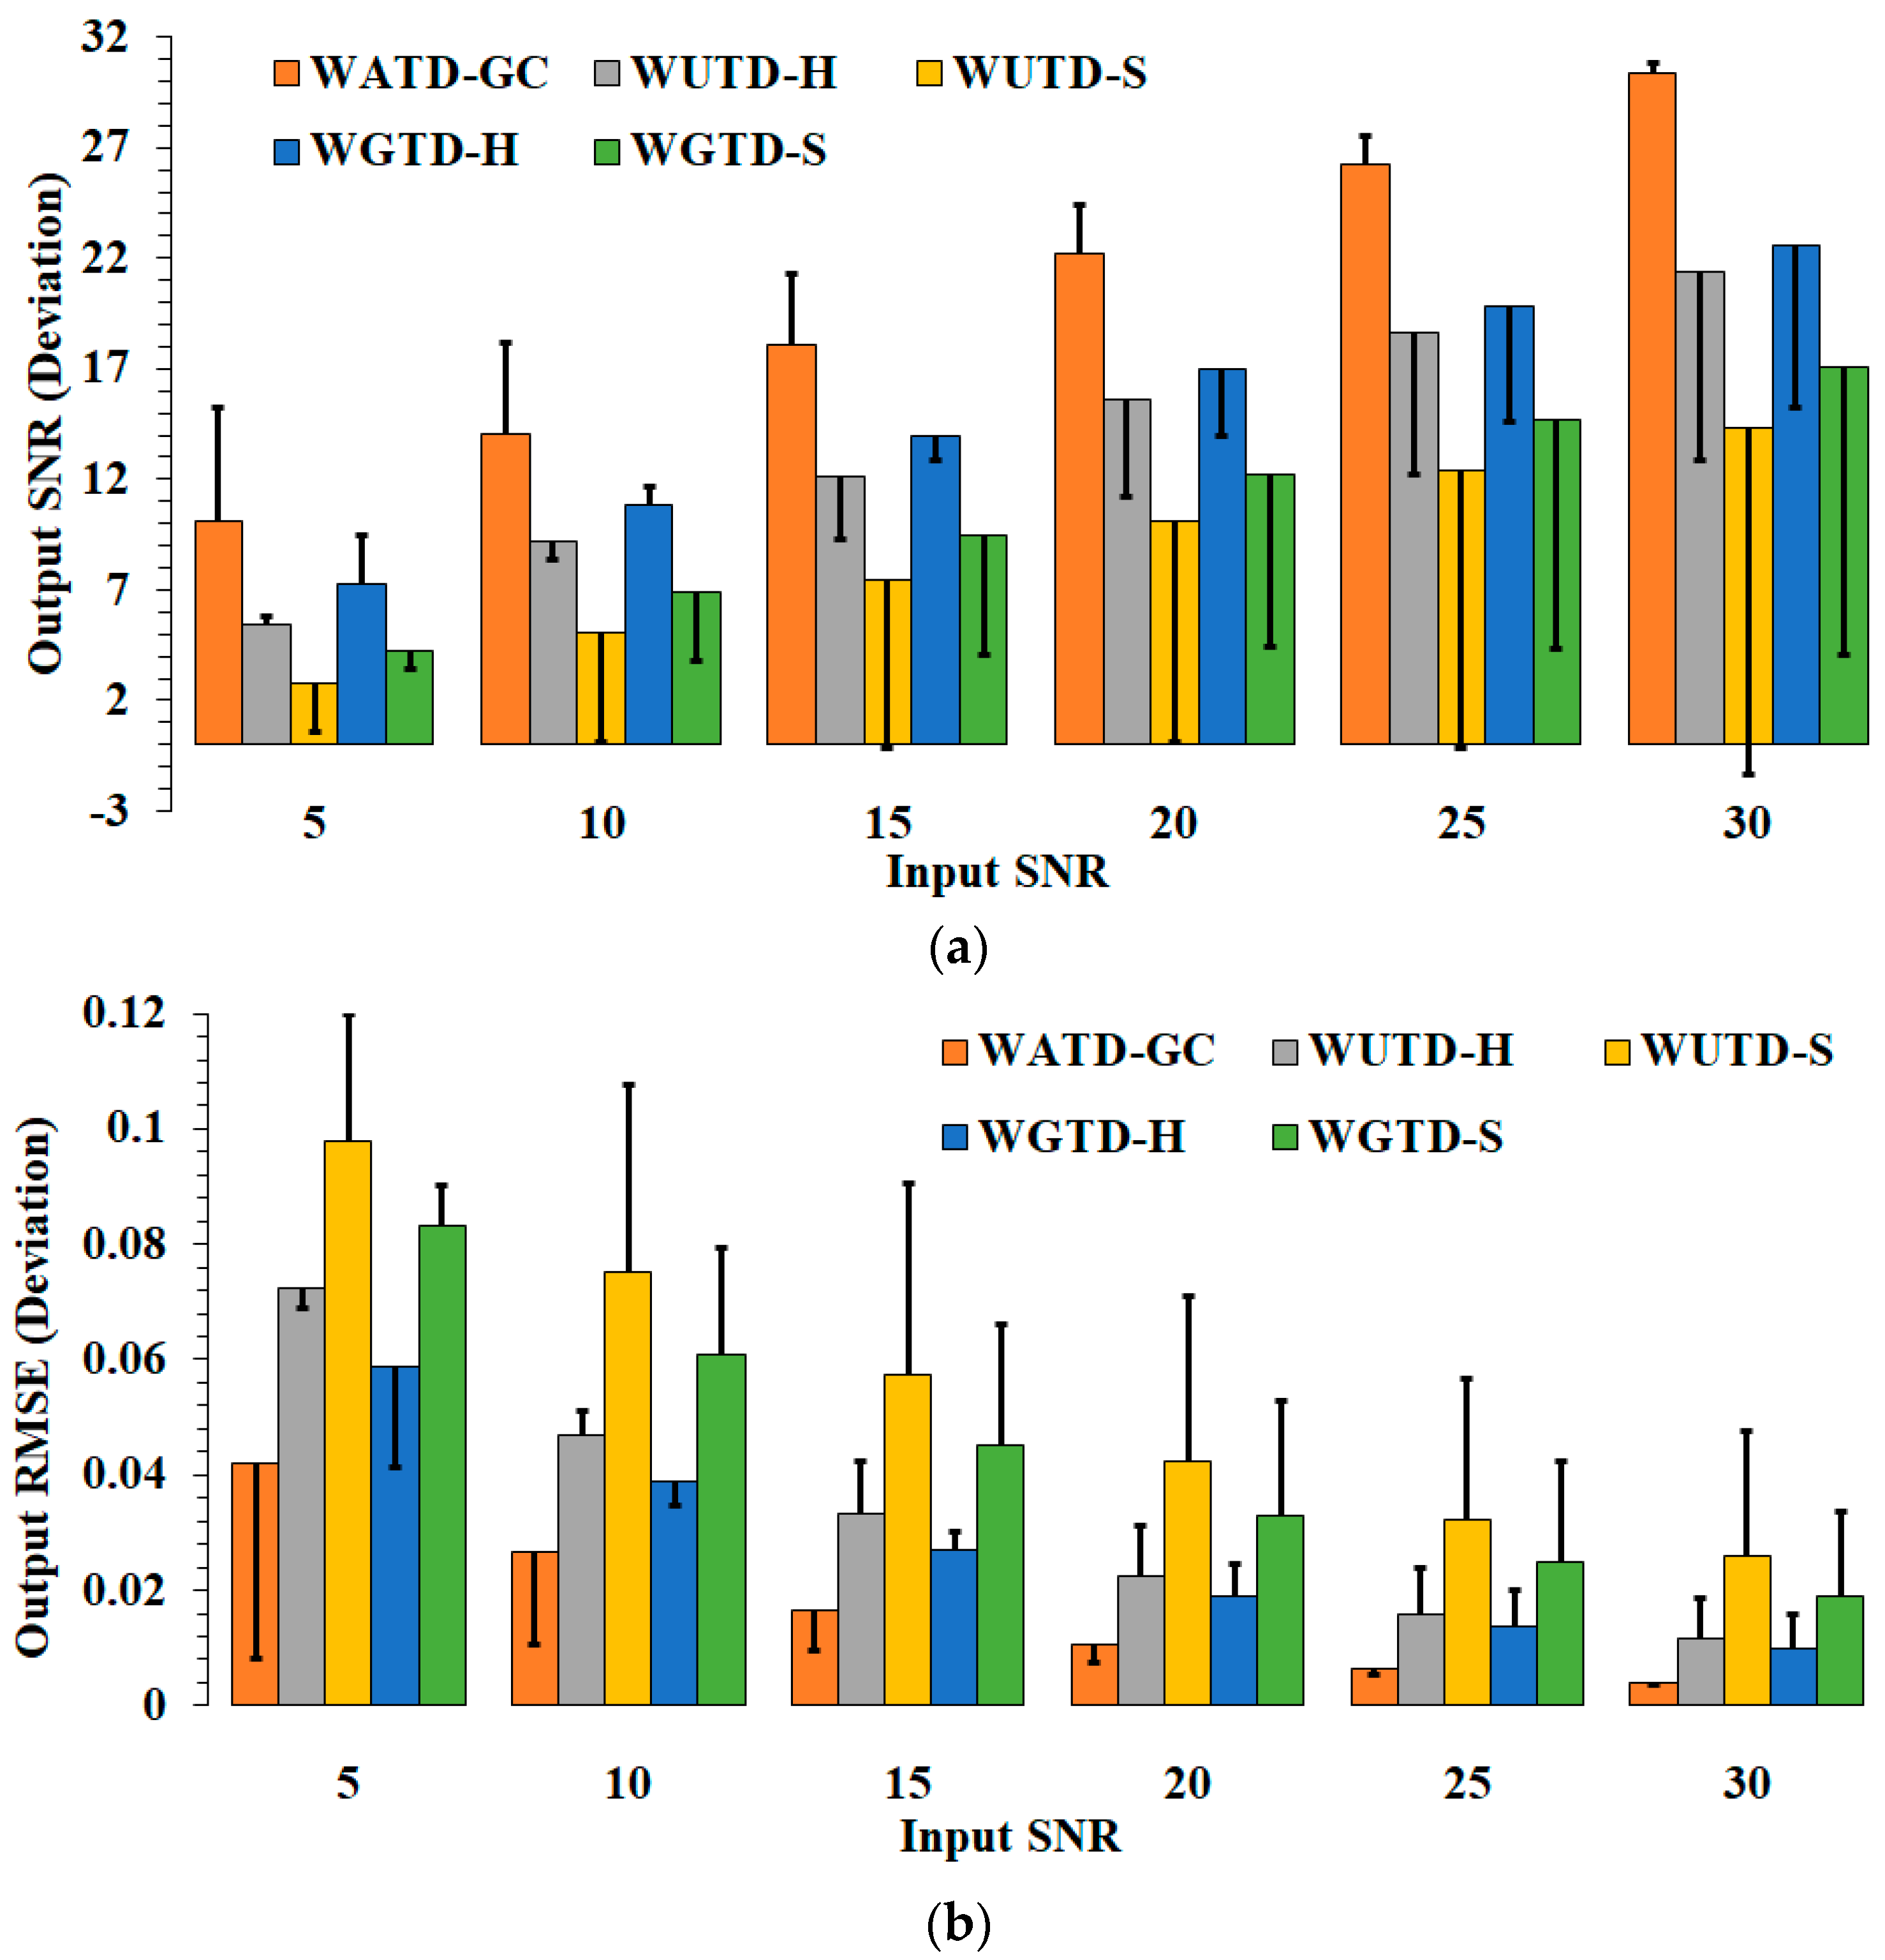
By addressing Table 1, it can be seen that the WATD-GC method has the highest SNR and the lowest RMSE after denoising. Compared with the other methods, the SNR is increased by 30–150%, and the RMSE is decreased by 37–70%. The smoothness and NCC are closer to 1, indicating that the WATD-GC method yields the fewest noise components in the denoised signal, the smallest signal reconstruction error, the lowest degree of local mutation, and the highest similarity with the useful signal, while retaining much of the disturbance characteristics. At the same time, to further verify the denoising effect of the WATD-GC method with different input SNRs, five different denoising methods are assessed via simulation by adding Gaussian white noise (with an input SNR of 5–30 dB) to the speech signal when the wavelet decomposition scale is 5. The results of the comparison of the output SNR and RMSE after denoising are shown in Figure 5.
Figure 5 shows that the output SNR (RMSE) and the corresponding deviation of the five methods increase (decrease) with the increase in the input SNR, and the overall denoising effect of the soft threshold method is poor, while the hard threshold method has a certain denoising effect within a limited range. Compared with other methods, the WATD-GC method has a denoising effect in the SNR range employed in the example; further, the output SNR and corresponding positive deviation are here the largest under different input SNR conditions. The SNR is increased by 3–16 dB, the positive deviation is increased by 1–12 times, the output RMSE and the corresponding negative deviation are the smallest, the output RMSE is reduced by 0.006–0.056, and the negative deviation is reduced by 1–9 times, indicating that the WATD-GC method has a clear denoising effect with different input SNR signals.

4. GMAW Monitoring Platform and Experiment Design

A penetration monitoring platform for ship robotic GMAW is the foundation of the hardware required for welding process tests, arc sound information acquisition and penetration features analysis. In this paper, an arc sound sensing system is built and integrated into the experimental platform of a welding intelligent robot in order to acquire information during welding, and assist the welding seam tracking system in completing the established test tasks. At the same time, based on the mechanism of arc sound analysis using an arc sensing system, the welding penetration state is classified and defined, and samples are selected, windowed and framed, so as to make technical preparations for the subsequent denoising of the arc sound signal.

4.1. Arc Sound Sensing for Ship Robotic Welding

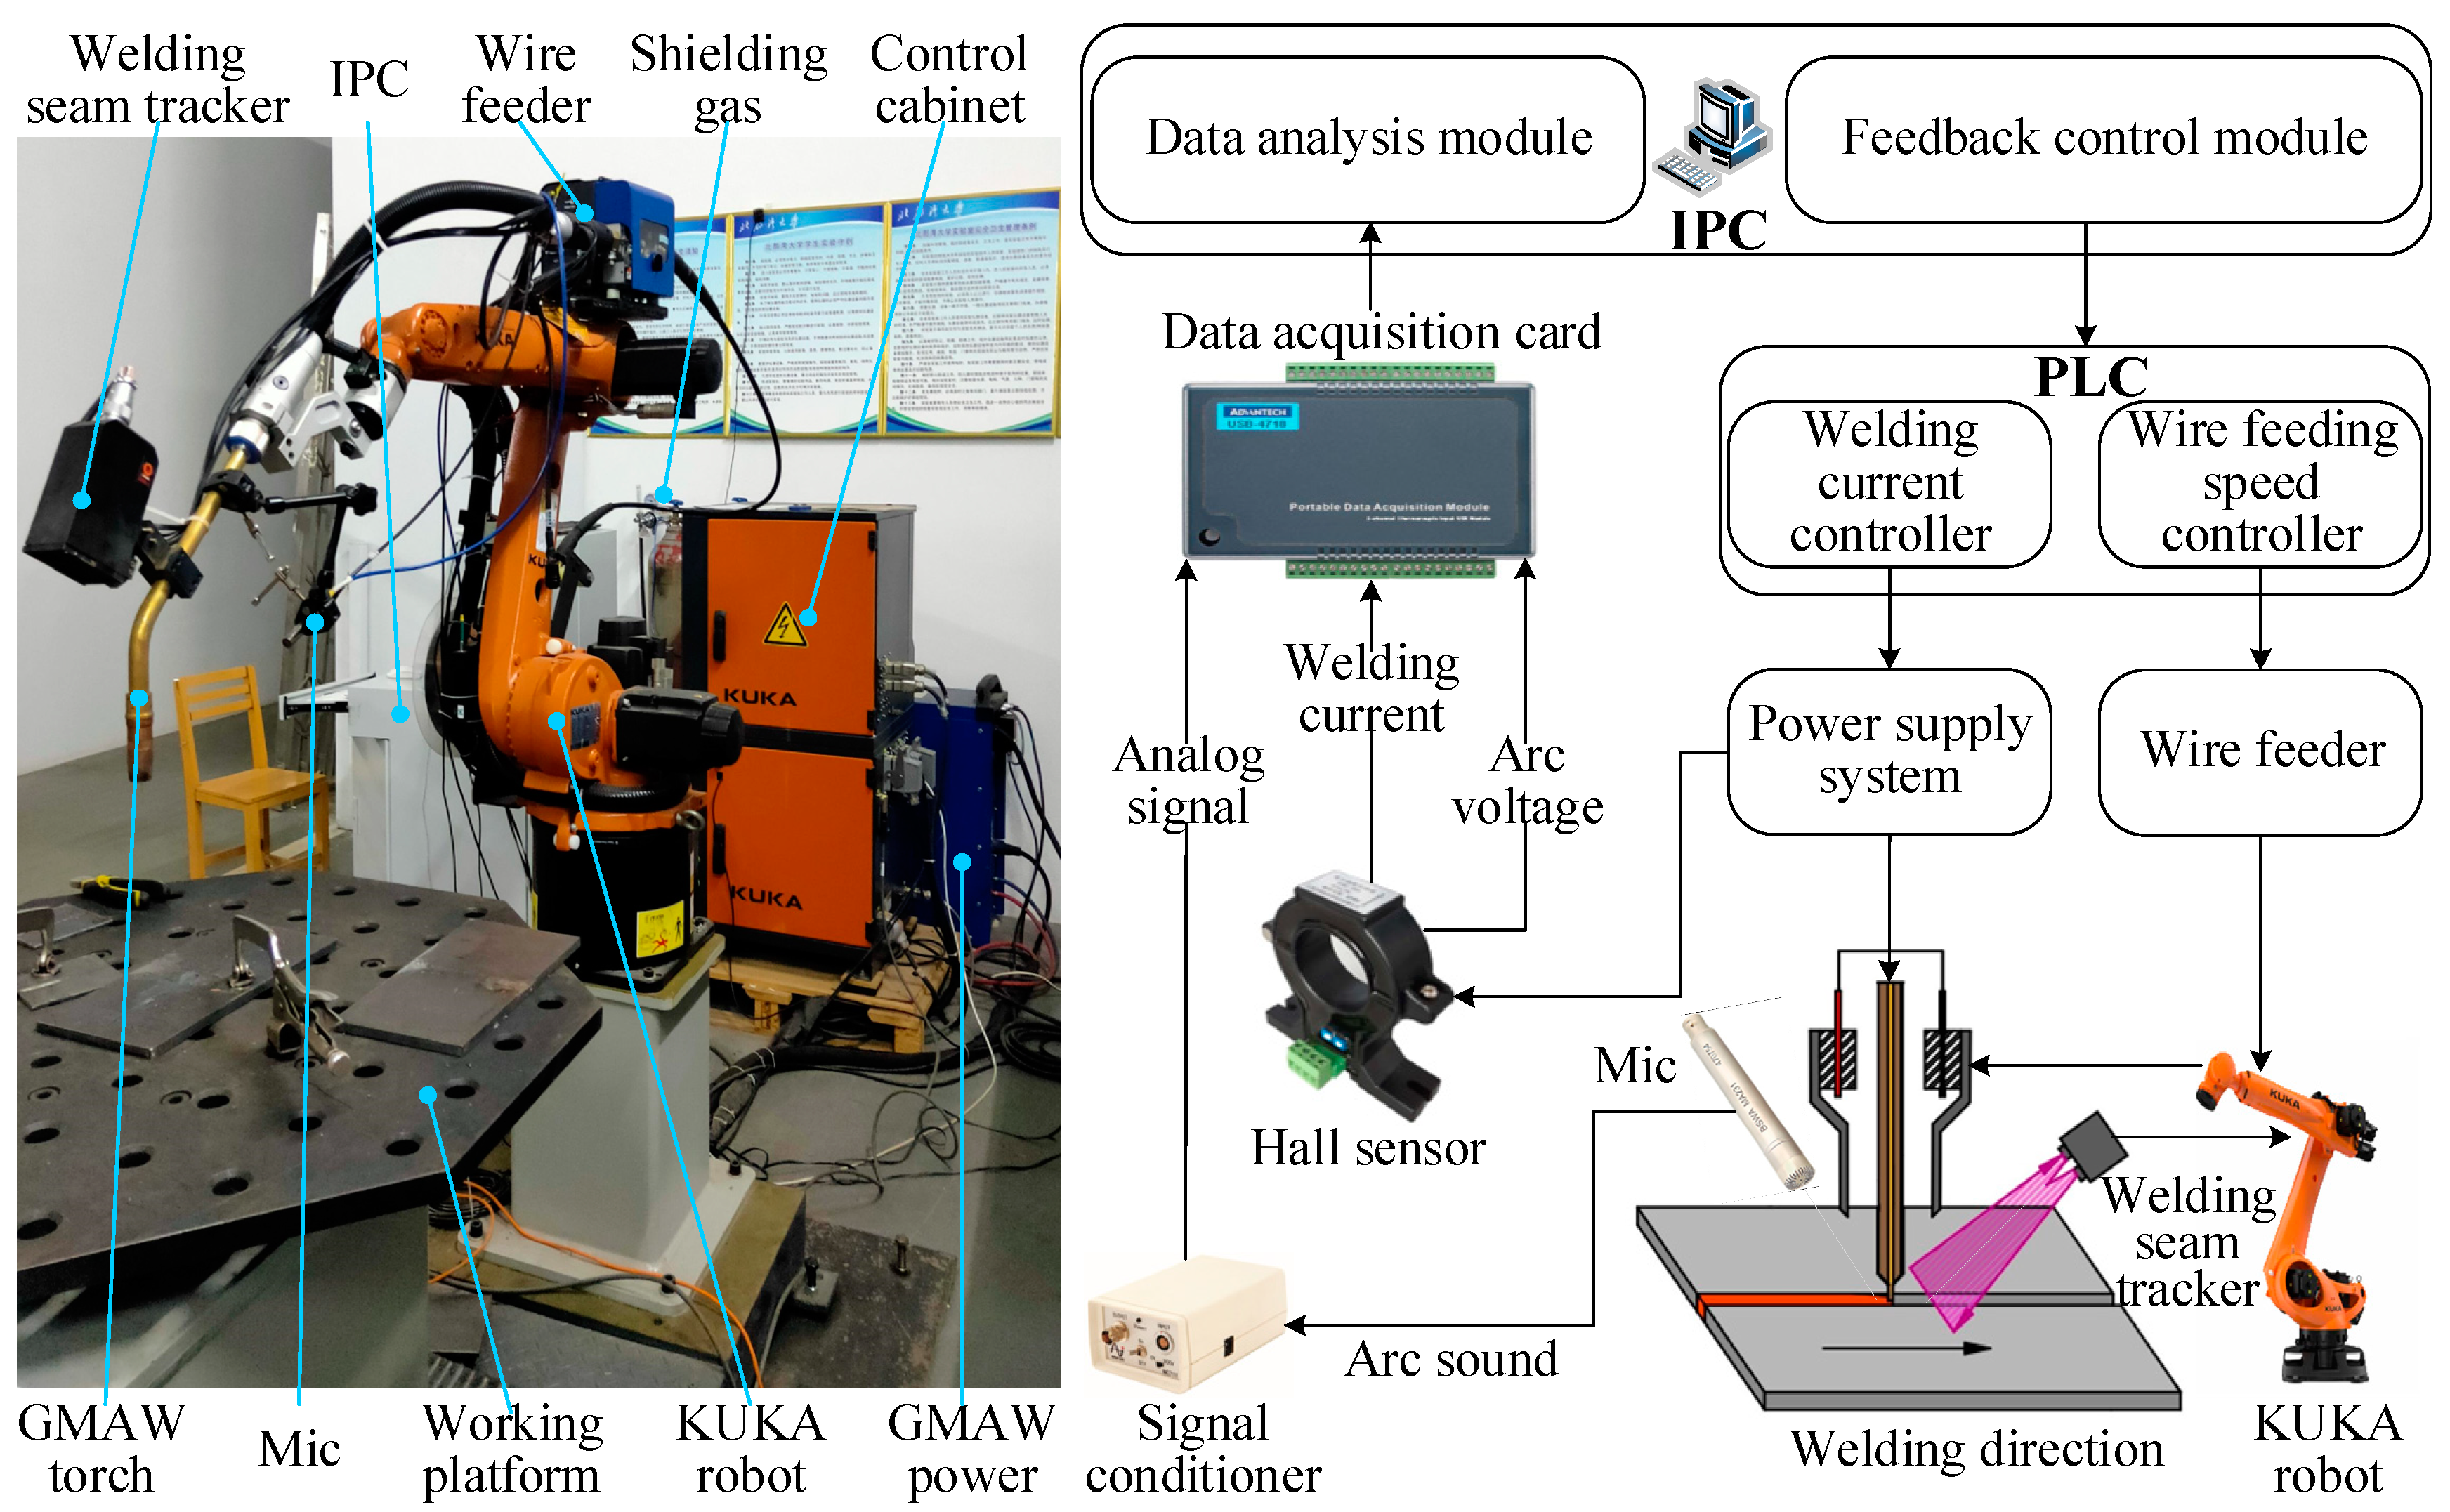
The arc sound sensing system is integrated into the automatic welding platform of ship robotic GMAW. By adjusting and calibrating the position, pointing angle and acquisition mode of the microphone, the sound signal can be acquired, converted and processed. The main components are the Kuka Arc5 robot, the pulsed GMAW power supply system, the arc sound sensor, the wire feeder, the Hall sensor, the laser seam tracker and the industrial personal computer (IPC), as shown in Figure 6. Among these, the welding seam tracker scans and identifies the weld trajectory via a laser, and guides the robot to adjust the position and posture of the welding gun in real time and to move autonomously, so as to ensure accurate and efficient welding. The Hall sensor monitors the welding current and arc voltage in real time monitor the steady process of welding short-circuit transition. The arc sound sensor consists of a microphone, preamplifier and signal conditioner, and can be used for the acquisition, amplification, filtering and multi-channel transmission of the arc sound signal. The sampling frequency of the data acquisition card is set to 40 kHz, such that the acquired analog sound signal can be converted into a digital signal and sent to the data analysis module of the IPC to establish knowledge modeling, which enables penetration state identification in the ship robotic GMAW and provides technical support for future quality monitoring research.
The arc sound signal is caused by the vibration of the plasma current generated by the strong electric field between the anode and cathode, and it is transmitted to the microphone through the medium of air. The film is compressed and converts the vibration into an electrical signal, which is amplified and filtered by the amplifier and regulator, then transmitted to the data acquisition card for A/D conversion, and finally sent to the IPC to provide the data input for welding detection. The spatial propagation of the pulsed GMAW arc sound signal during welding conforms to the distribution of a double dipole sound source model [54], and the direction of sound signal radiation can be made equivalent to that of the cosine waveform of the dipole model. By adjusting and fixing the universal clamp, the acquisition angle and position distance of the microphone can be tested and calibrated. Under the same welding process conditions, when the included angle between the microphone and the working platform is 75° and the distance is kept at 20 cm, the acquired value of the arc sound pressure is the largest, and the information is the most abundant. In this case, the experimental arc sound sensor employed is an MP251 1/2-inch pre-polarized pressure field microphone (including MA231 Preamplifier) and an MC102 signal conditioner produced by Beijing Shengwang ACOUSTIC-ELECTRIC Technology Co., Ltd., Beijing, China. (BSWA Technology Co., Ltd.), along with the improved denoising processing module (refer to Table 2 for specific parameters).

4.2. Welding Process Information Acquisition and Preprocessing

GMAW is a process in which the welding wire and the solid metal of the workpiece are melted and condensed by the heat generated by arc discharge. The weld pool is formed via four stages of heating, melting, cooling, and solidification, ultimately resulting in a weld. However, in actual welding, both the welder and the machine are unable to perceive in real time the internal situation of the welded joint. Therefore, the penetration state is widely used as the most intuitive and effective characteristic for judging the surface quality. In accordance with the morphological characteristics of weld formation, the most common penetration states can be classified as partial penetration (partial forming), full penetration (standard forming), and excessive penetration (defect or non-forming). The penetration state varies during the welding process as the properties of the materials and the welding parameters change. The physical properties of the base metal and the welding material, such as chemical compositions and mechanical properties (see Table A1 in the Appendix A), influence the welding process. Orthogonal tests can be optimized to yield the most suitable welding parameters, as specified in Table 3, thus ensuring the stability of the weld quality. Therefore, welding production simulation tests were conducted on typical hull structures to establish a comprehensive database related to welding materials and process management, which can provide input parameters for penetration state identification, thereby enhancing the adaptability of methods of quality monitoring for ship robotic GMAW.
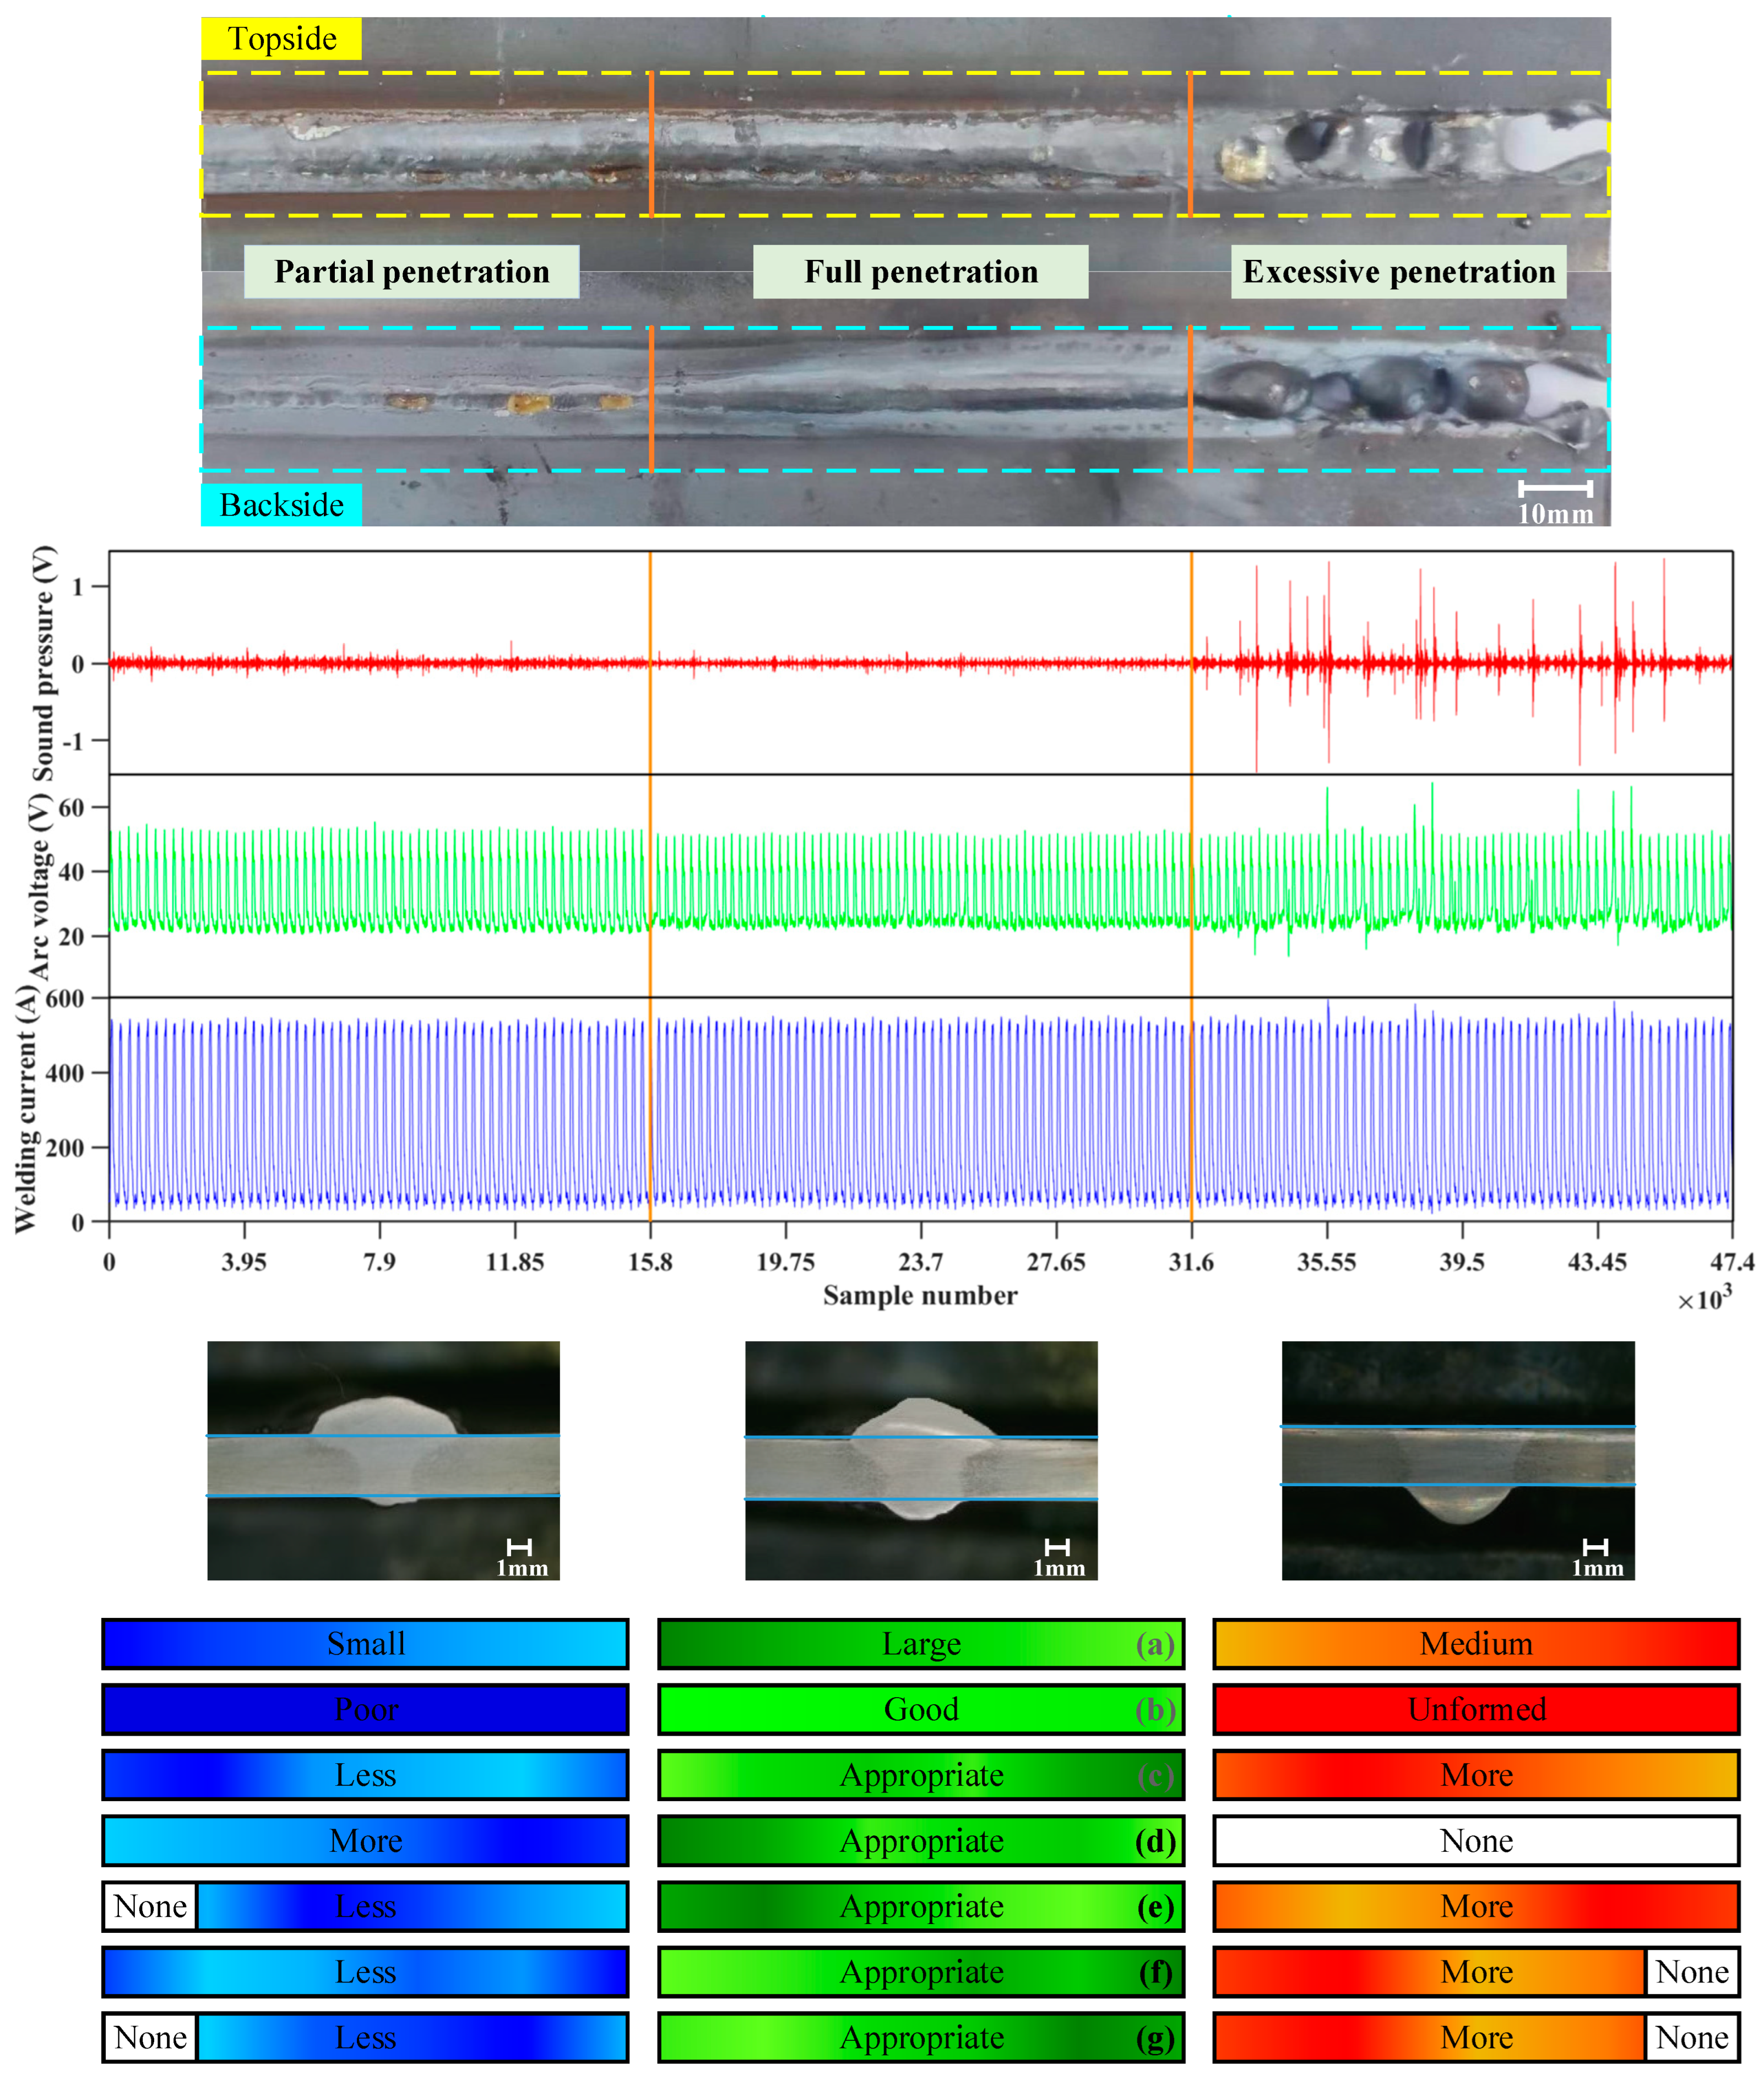
In this case, the low-carbon steel used in ships is selected as the test workpiece, and the welding method is flat butt welding. The quality specifications require one-sided welding and double-sided forming. Figure 7 shows the GMAW results for the topside and backside of an I-shaped plate, as well as the welding process information acquired in real time (including welding current, arc voltage and arc sound signals), the penetration cross-sections of three typical penetration states, and a color temperature map representing the quality of the formed welding. It can be seen that different sensing systems can yield welding process information in a stable and synchronous manner. Following a comparison of the fluctuation trends of arc voltage, welding current and sound signals, it can be concluded that the sound source excitation of the arc sound signal is mainly caused by the change in arc energy. At the same time, the real position of the weld pool at a corresponding time is determined by using the conversion relationship between the weld length and welding speed, so as to identify the different penetration states corresponding to welding process information. In relation to the directional characteristics of welding heat conduction, the formation quality and heat-affected zone change with changes in the type of penetration state. In addition, the weld pool volume is related to the arc heat input and heat accumulation in the base metal, while the topside and backside width, and the reinforcement and penetration depth of the weld, are also increased or decreased regularly. Sections a-g in Figure 7 correspond to the various weld features observed under the three penetration states, which include the heat-affected zone, the forming effect, the topside weld width, the topside weld reinforcement, the backside weld width, the backside weld reinforcement, and the penetration depth. The degree of brightness in the color temperature map reflects the changing formation laws of the weld characteristics under different penetration conditions.
The arc sound signal of ship robotic GMAW is a non-stationary time-varying signal; it is generated by the oscillation of the weld pool caused by changes in the arc energy, and the oscillation speed of the weld pool state is slower than that of arc sound vibration. Therefore, the arc sound signal is regarded as a short-term quasi-stationary process that takes place over a short time (10–30 ms), and the frequency domain and physical characteristics are relatively stable [55]. In view of this, with the help of the short-term analysis of the speech signal, it can be inferred that the time series of the sound signal corresponds one-to-one with the penetration state related to windowing and framing, and the smoothness of the transition between frames is increased by ensuring the continuity of the framing signal. Considering the influence of frequency domain energy leakage, caused by signal framing truncation, a Hamming window with a length of L = 512 (12.8 ms) is specifically selected to frame the arc sound signal x ( n ) , and the sound signal y i ( m ) of the i t h frame is obtained by framing the window function ω ( m ) :
y i m = ω m x i 1 i n c + m ,     1 m L ,     1 i f n
where frame shift i n c = 256 , n is the number of sampling points of the arc sound signal, and f n is the total number of frames after framing.

5. Wavelet Denoising with Application to Penetration State Identification

For the GMAW welding process, the arc sound is a non-stationary random signal generated by air resonances that occur during the welding process, which originates from the energy changes of the welding arc and the oscillatory fluctuations of the weld pool, including short-circuiting transitions between the electrode and the base material, partial splashing into the weld pool, and gas vibrations caused by rapid changes in the temperature of the shielding gas. According to safety guidelines and site requirements, welding experiments are usually conducted in a semi-open environment, and the sound signals collected during the process of ship robotic GMAW in an open environment not only contain quality information related to the entire welding process, but they are also highly susceptible to noise interference with highly nonlinear characteristics. The types of noise interferences are mainly divided into certain and uncertain noise. The certain noise information shows some correlation with the quality of weld forming, which is related to the partial characteristics of the variations in the penetration states, including sensor DC noise and welding machine pulse noise. It can be suppressed by software and hardware alterations, such as de-averaging processing and the inclusion of a differential amplifier circuit. The uncertain noise primarily originates from highly random environmental noise, which includes that caused by the operation and movement of robotic equipment, wire feed mechanisms, and circulating water tanks. Additionally, considering the actual environment of a ship manufacturing site, uncontrollable interferences such as those caused by the voices of construction workers and the impacts of material processing are also incorporated into the arc sound signal data set. Therefore, a reasonable and efficient denoising scheme is designed to provide real acoustic information for the accurate identification of the penetration state. In this case, several methods are used to denoise the preprocessed signal; the corresponding time and frequency domain feature information is extracted, and then different machine learning algorithms can be used for pattern classification modeling to verify the effectiveness of the improved denoising method as applied to the arc sound penetration state during ship robotic GMAW. Refer to Figure 8 below for the specific application and verification process.

5.1. Wavelet Threshold Denoising of Arc Sound Signal

The arc sound signal acquired during ship robotic GMAW contains extensive information regarding the penetration states. However, the welding process does not take place in a closed environment, and the process of non-contact information acquisition employed is easily disrupted by various noises, such as those caused by equipment operation, sensor transmission and the background environment. These interference signals will seriously affect the effective extraction of information regarding the forming features, which will lead to difficulties in ensuring the precision of the relationship model between the arc sound signal and penetration states. Therefore, the wavelet threshold denoising method is selected to separate useful information representing different penetration states from arc sound noisy signals. This method has obvious advantages in view of the random non-stationary characteristics of the arc sound noisy signal. The useful signal is extracted by threshold estimation and by exploiting the threshold function that quantifies wavelet coefficients representing distributed energy. However, the fixed threshold and the selection of the threshold function in traditional methods do not conform to the change trends of penetration state information and noise interference, as they change in relation to the decomposition scales in the GMAW process, leading to the filtering of useful information in the high-frequency part of the arc sound signal or the retention of noise interference. This means this approach cannot improve the SNR and spatial resolution of the signal. Therefore, on the basis of the wavelet threshold denoising framework, the estimation mode and function selection of the threshold are improved by introducing a measurement of the scale and a concave–convex gradient. Through the analysis of the methods of classification of noise interference affecting the arc sound signal, the advantages of the improved denoising method, with the adaptive adjustment of thresholds and the nonlinear gradient characteristics of threshold functions, enable it to adapt to the changes in wavelet energy distribution at different decomposition scales. This results in a reduction in signal distortion probability, and a significant improvement in denoising effect, thus offering technical support in the precise identification of the penetration state during ship robotic GMAW.
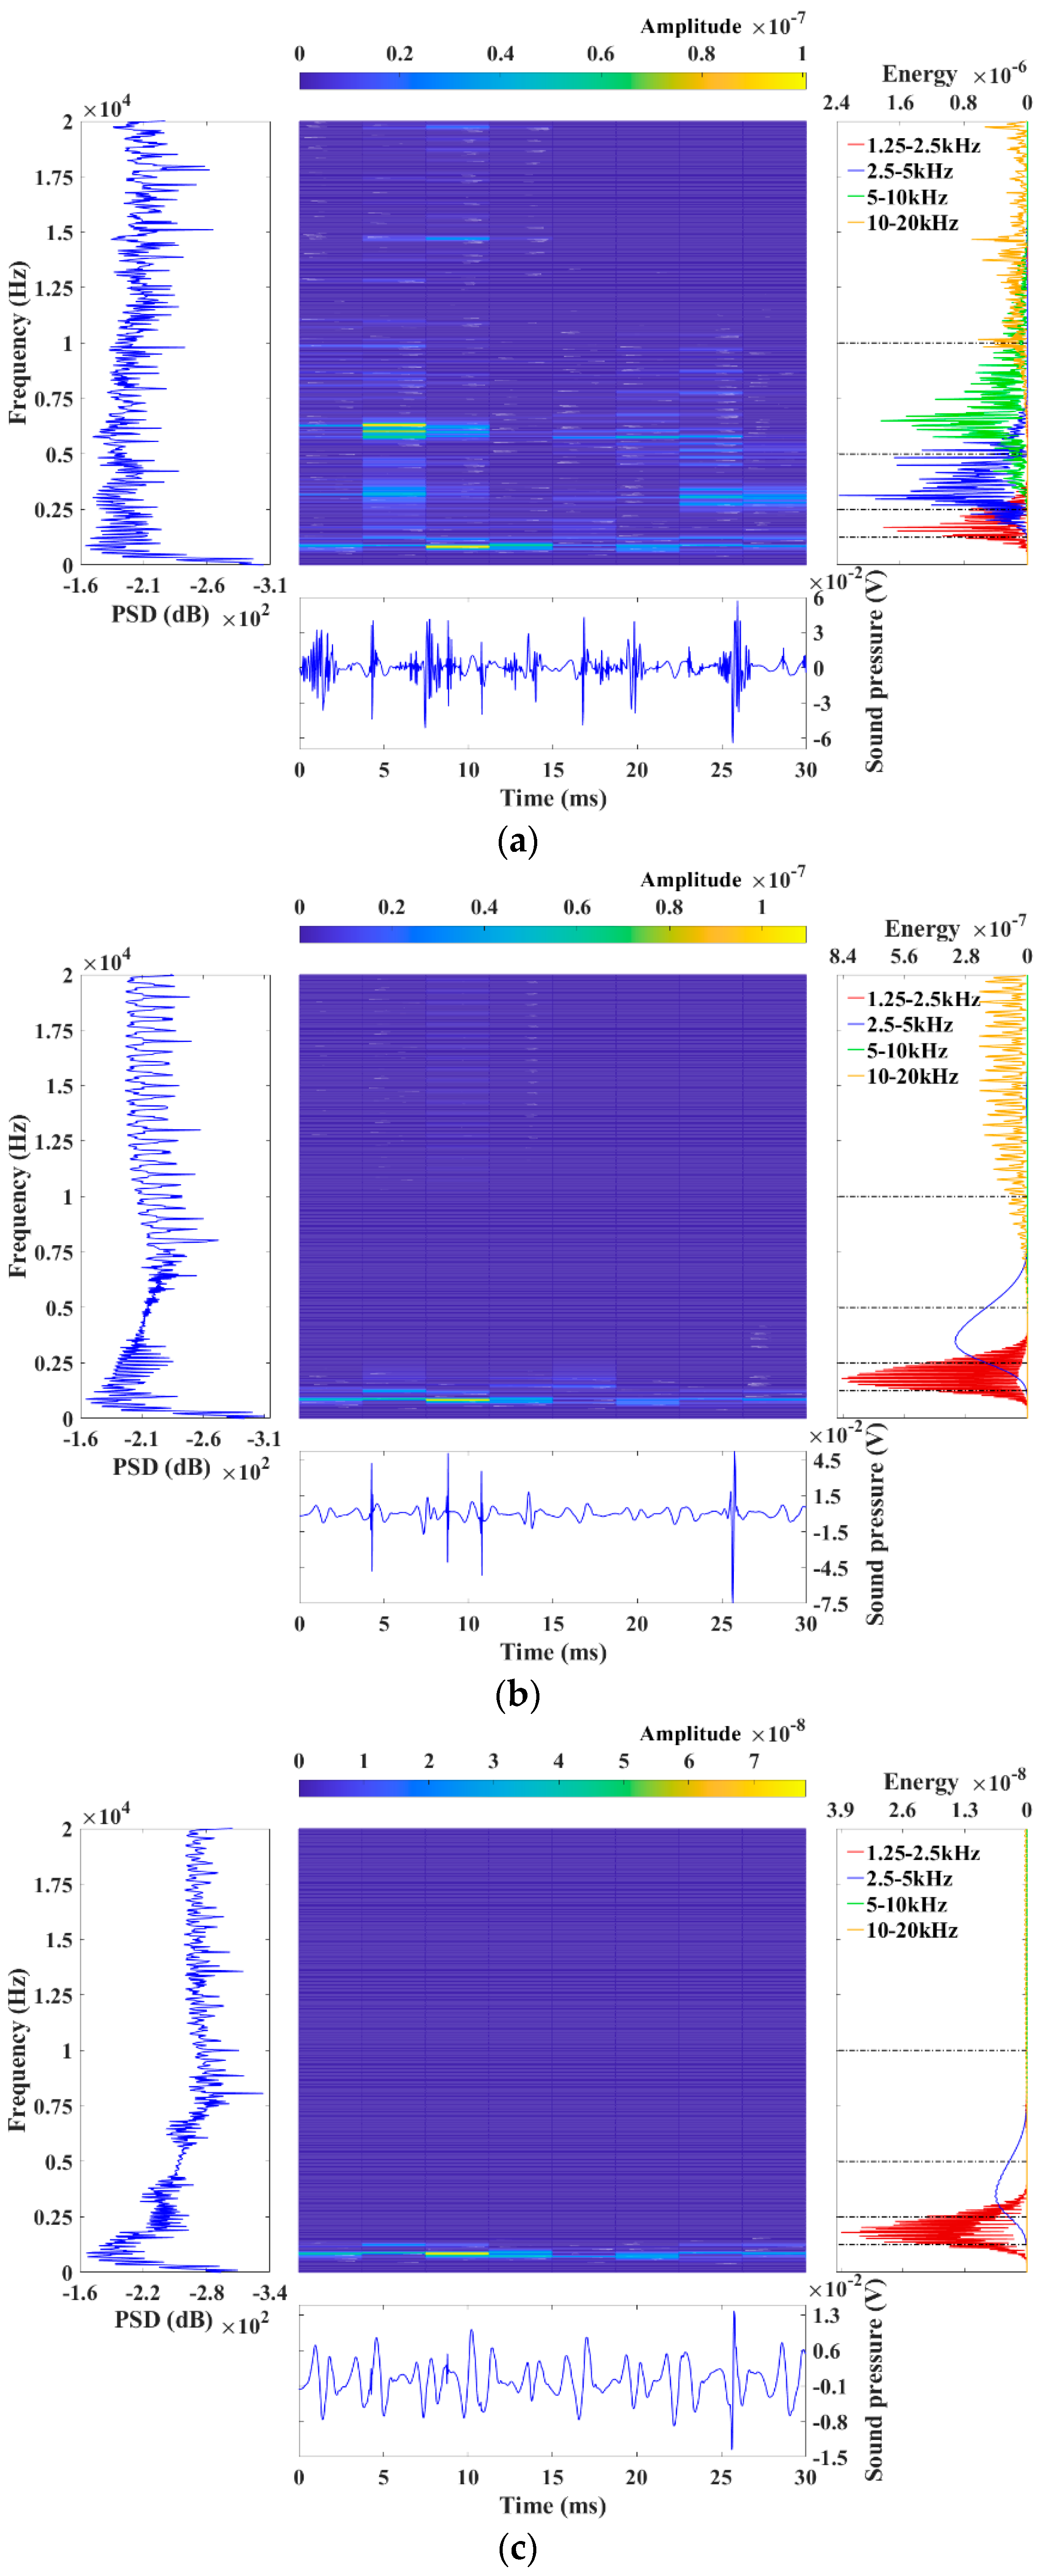
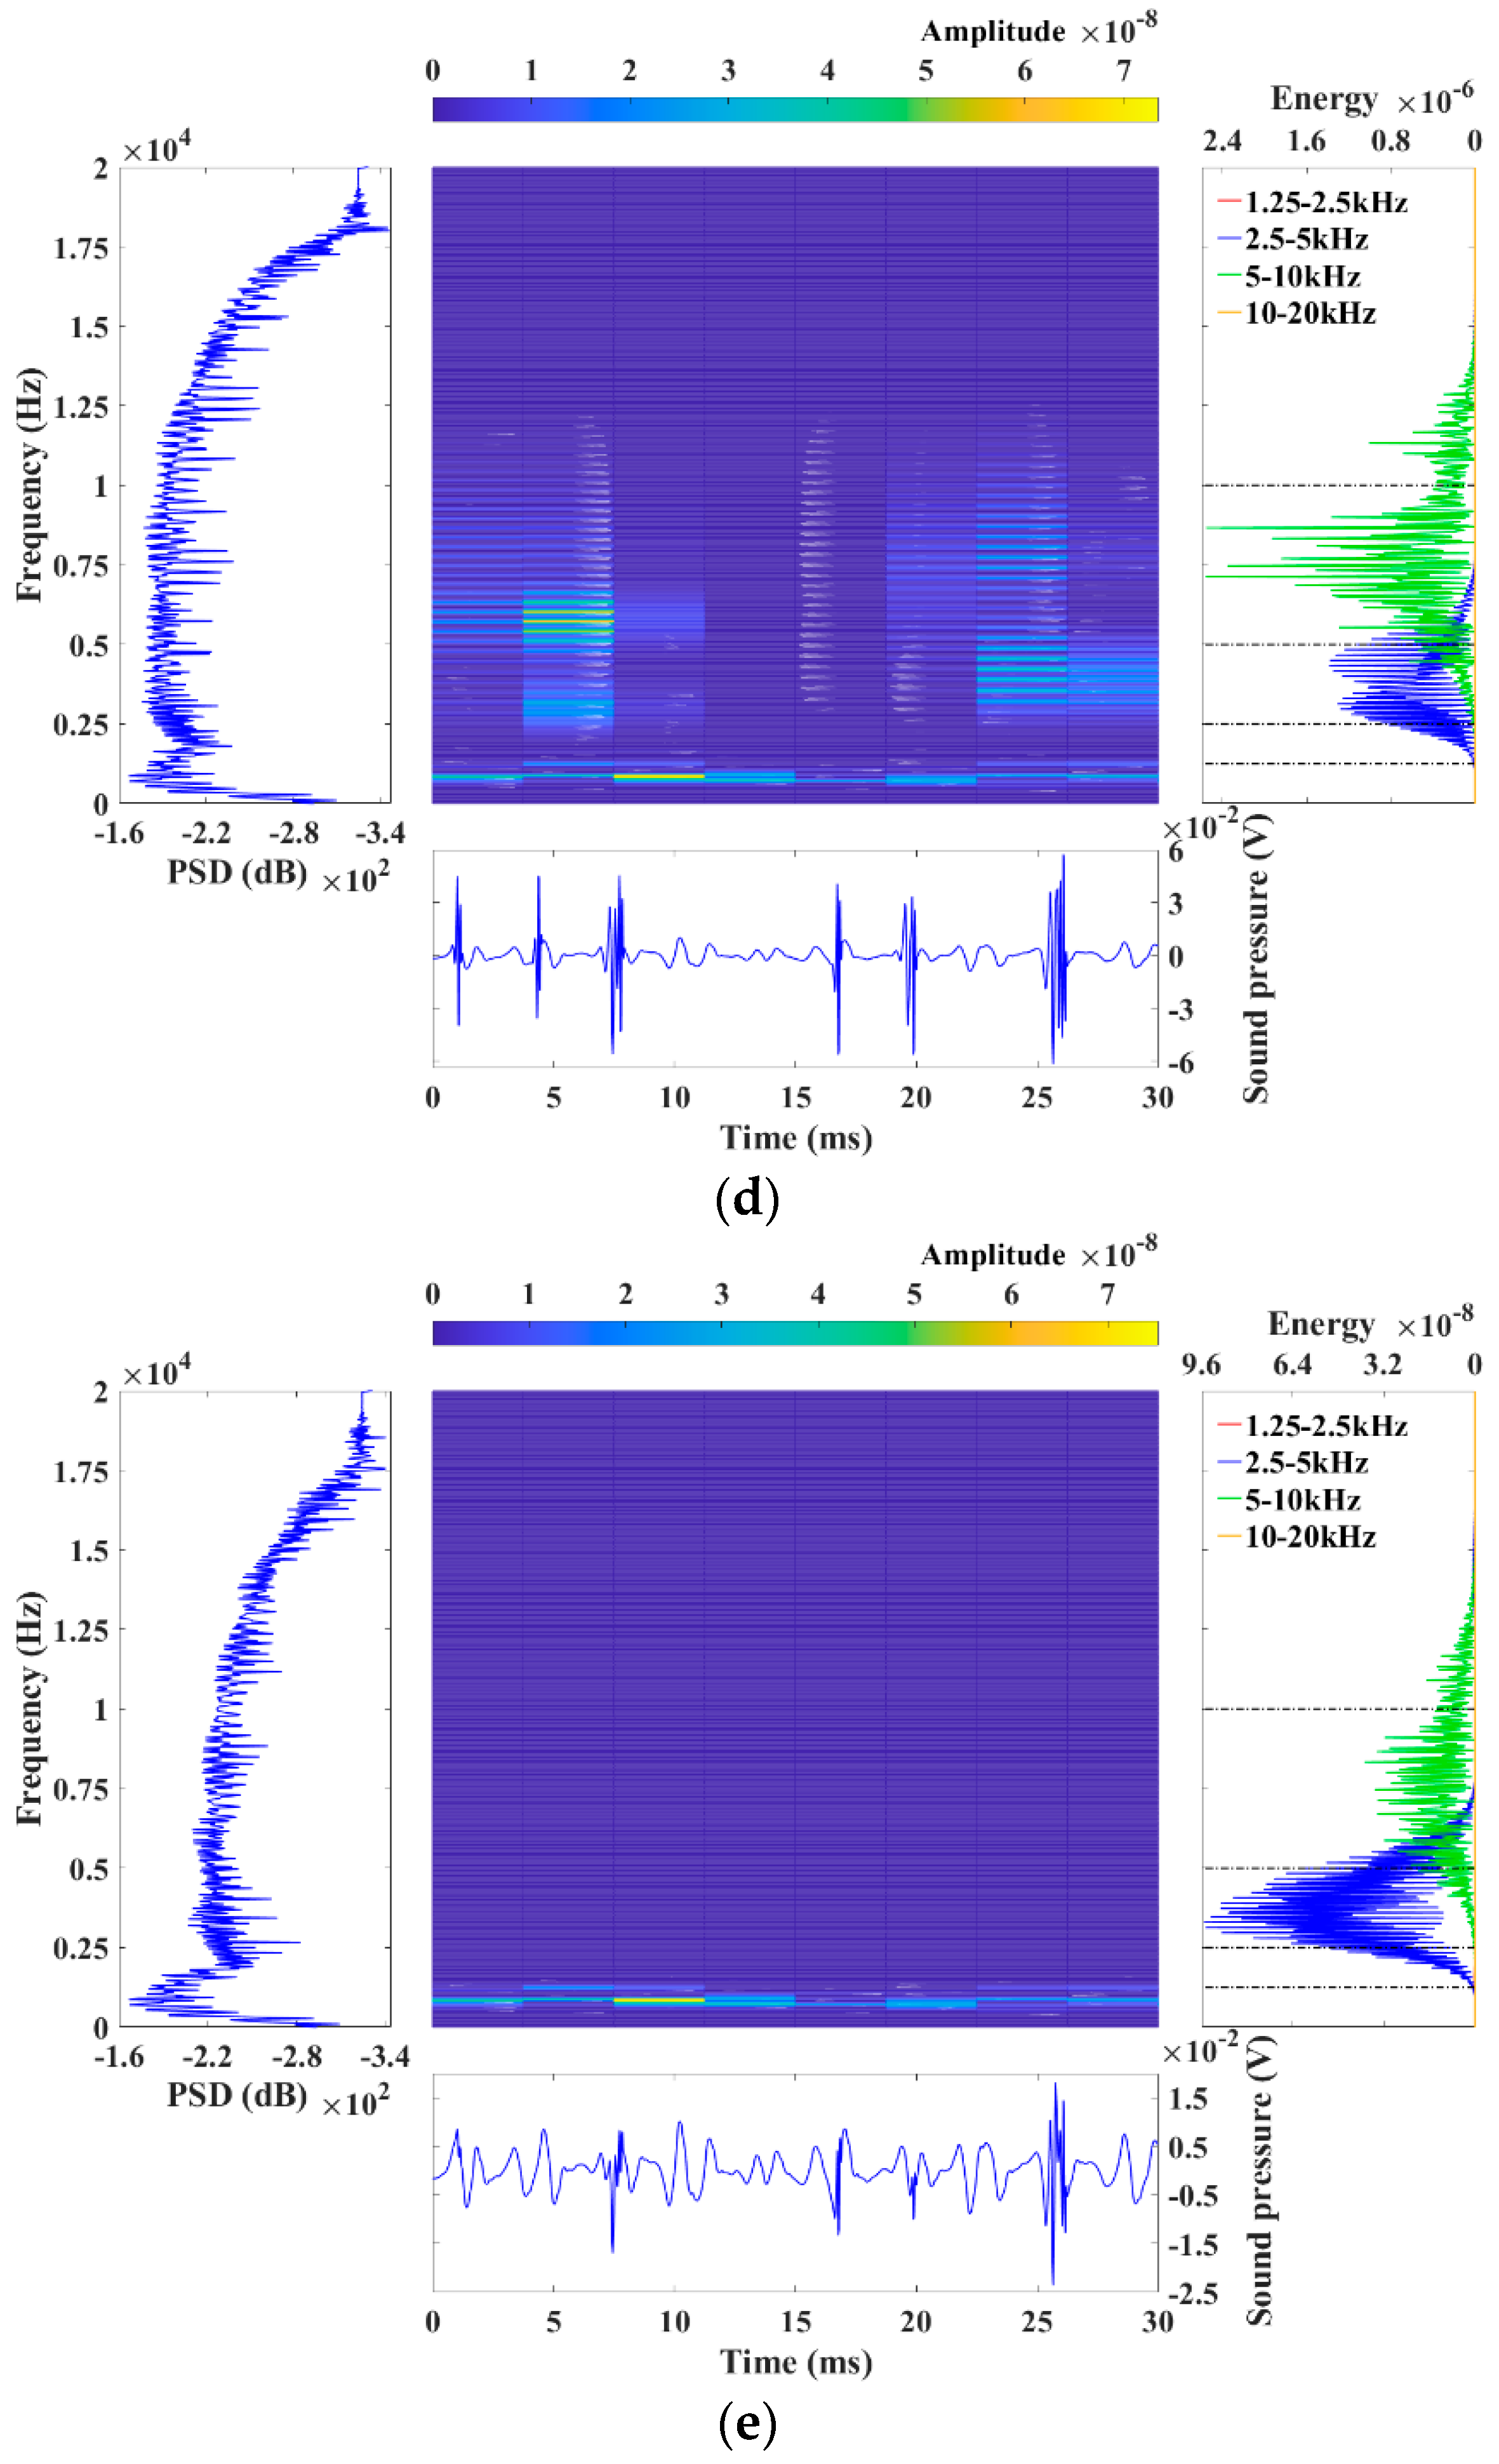
In this case, the wavelet base db4 in the Daubechies wavelet family is selected as the basic function, and then the arc sound signal is subjected to four-layer wavelet decomposition. In accordance with the wavelet coefficients, an adaptive threshold varying with the decomposition scales is set, and the high-frequency detail coefficients are quantified by the GCTF; then, the approximation coefficients and quantized detail coefficients are reconstructed to achieve denoising. The arc sound signal is denoised by selecting different global/universal thresholds and HTF/STF. Figure 9 shows a comparison of the results in the time, frequency and time–frequency domains of a specific sound signal subjected to different denoising methods in the same penetration state, wherein the lower graph illustrates the time domain waveform of the denoised signal, the left-hand graph illustrates the power spectral density distribution in the frequency domain, the middle graph shows the time-varying acoustic spectrum in the frequency domain, and the right-hand graph shows the change in the frequency domain energy spectrum after wavelet reconstruction. Compared with the other four denoising methods, the advantages of the WATD-GC method are as follows:
  • The tiny “glitch” superimposed on the arc sound signal in the time domain is effectively filtered out. The abrupt waveform part containing the welding process information remains intact and the signal contour trend is more clear;
  • The power spectral density waveform of the denoised signal in the frequency domain is similar to that of the arc sound signal, the energy distribution is more uniform, and the fluctuation range of the peaks and valleys is small and presents characteristics of irregular change;
  • The high-frequency detail coefficients D ^ j , k ( j = 1 , 2 , 3 , 4 ) processed by quantization at different decomposition scales are correctly decomposed into four different corresponding frequency bands (the effective frequency ranges are 10–20 kHz, 5–10 kHz, 2.5–5 kHz and 1.25–2.5 kHz) after wavelet reconstruction, thus effectively avoiding the phenomenon of frequency aliasing and frequency band dislocation;
  • The arc sound energy in the time–frequency domain is widely distributed across the whole domain, the process feature information in the high-frequency band is not lost, the distribution features of “intermittent–continuous–intermittent” are presented, and the time-varying energy distribution of the denoised signal in frequency domain is closer to the arc sound signal.

5.2. Feature Extraction and Identification Verification of Penetration State

To further verify the effectiveness of the WATD-GC proposed in this paper, the denoised signal is applied to the feature extraction of the penetration state during ship robotic GMAW. Through the acquisition and analysis of dynamic information during welding, the sound signal extraction features and welding penetration state are quantified, identified and modeled, which enables us to realize the real-time online closed-loop monitoring of welding quality. At present, the methods employed to extract the feature information representing the penetration state in the arc sound signal mainly include the following: time domain and frequency domain feature analysis. The sound signal yielded after wavelet denoising has the characteristics of stationarity and randomness, while the time domain waveform can be directly statistically analyzed and the corresponding feature parameters can be extracted via speech signal analysis methods. At the same time, the weld quality information contained in the arc sound, which can be regarded as the vibration signal, is mostly reflected in the regular changes in the feature parameters with frequency changes in the frequency domain. The sensitive frequency band (4.0–7.5 kHz) is selected as the region of interest by introducing the mechanism of “auditory attention” [56], and the arc sound signal is converted into the time–frequency domain by means of the short-term Fourier transform (STFT), which is used to extract the features of the frequency domain in the region of interest. Meanwhile, the correlation coefficient is employed to gauge the degree of similarity between the extracted features of the arc sound signal (input variables) and the weld penetration state (output results). It plays a crucial role in feature selection, thereby influencing the accuracy of the penetration identification model. In this study, correlation analysis using the Pearson correlation coefficient is adopted to measure the extracted features and the weld penetration state, thus providing a scientific basis for the selection of the eight-dimensional feature parameters. For details on the feature information and correlation analysis, please refer to Table 4. The results demonstrate that the correlation coefficients between each extracted feature and their corresponding weld penetration conditions are all above 0.4. In pursuing feature selection, it is necessary to fully utilize the collective advantages of the multidimensional joint feature vectors. In addition, the use of nonlinear mapping identification models can facilitate the monitoring of weld penetration through arc sound sensing.
The actual penetration state during ship robotic GMAW can be quantitatively identified using the above statistical features. Figure 10 shows the penetration identification results corresponding to time and frequency domain feature extraction with different arc sound denoised signals, in which the blue, green and red curves represent partial, full and excessive penetration states, respectively. In accordance with the figure, the overall change trends of the statistical features of the time and frequency domains extracted from different denoised signals are obvious, and so they basically reflect the change laws of the welding penetration state. Comparatively speaking, the feature value is more sensitive to changes in the excessive penetration state, and the corresponding main feature parameters are short-time energy (SE), peak-to-peak (POP), root mean square (RMS) and mathematical expectation (ME). The feature parameters representing the penetration state, such as average zero-crossing rate (AZR), waveform factor (WF), zero energy ratio (ZER) and average logarithmic energy (ALE), roughly reflect the transition from steady a state in the weldments to incomplete penetration and excessive penetration. This indicates that the arc sound signal contains important information about the quality of the welding process, while the above acoustic parameters can be regarded as statistical features affecting the trend transition of the welding penetration state.
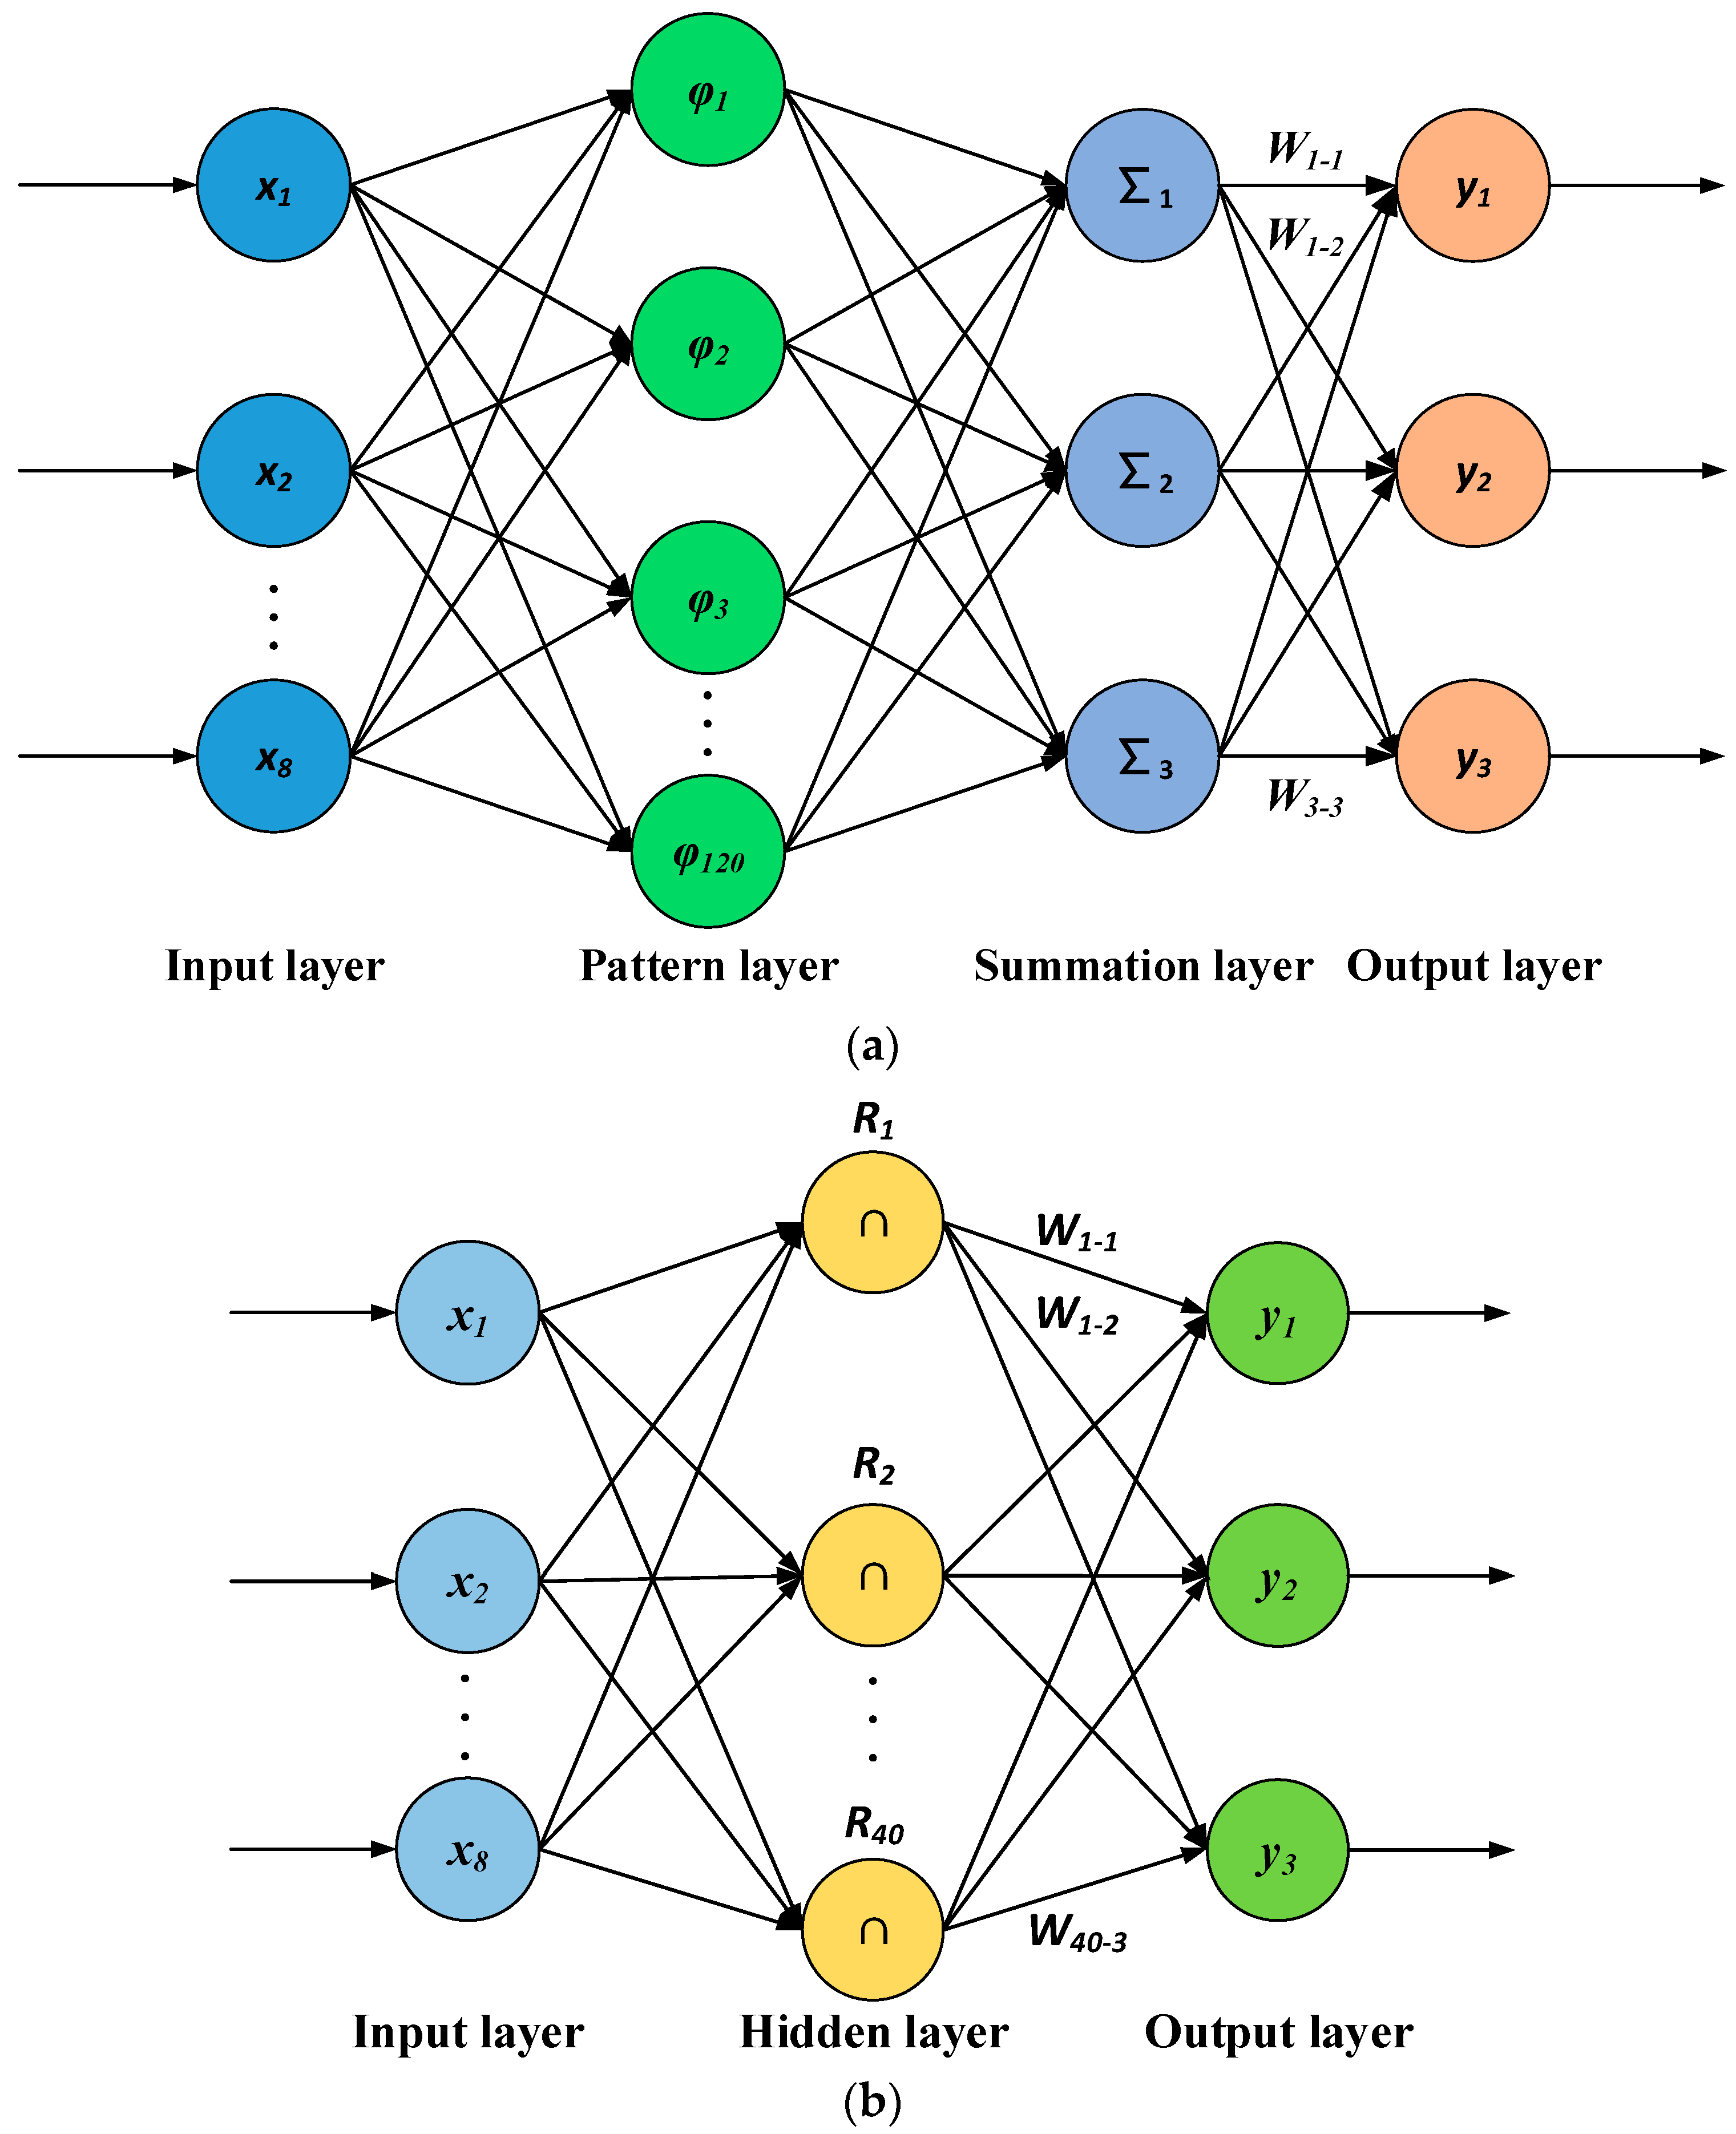
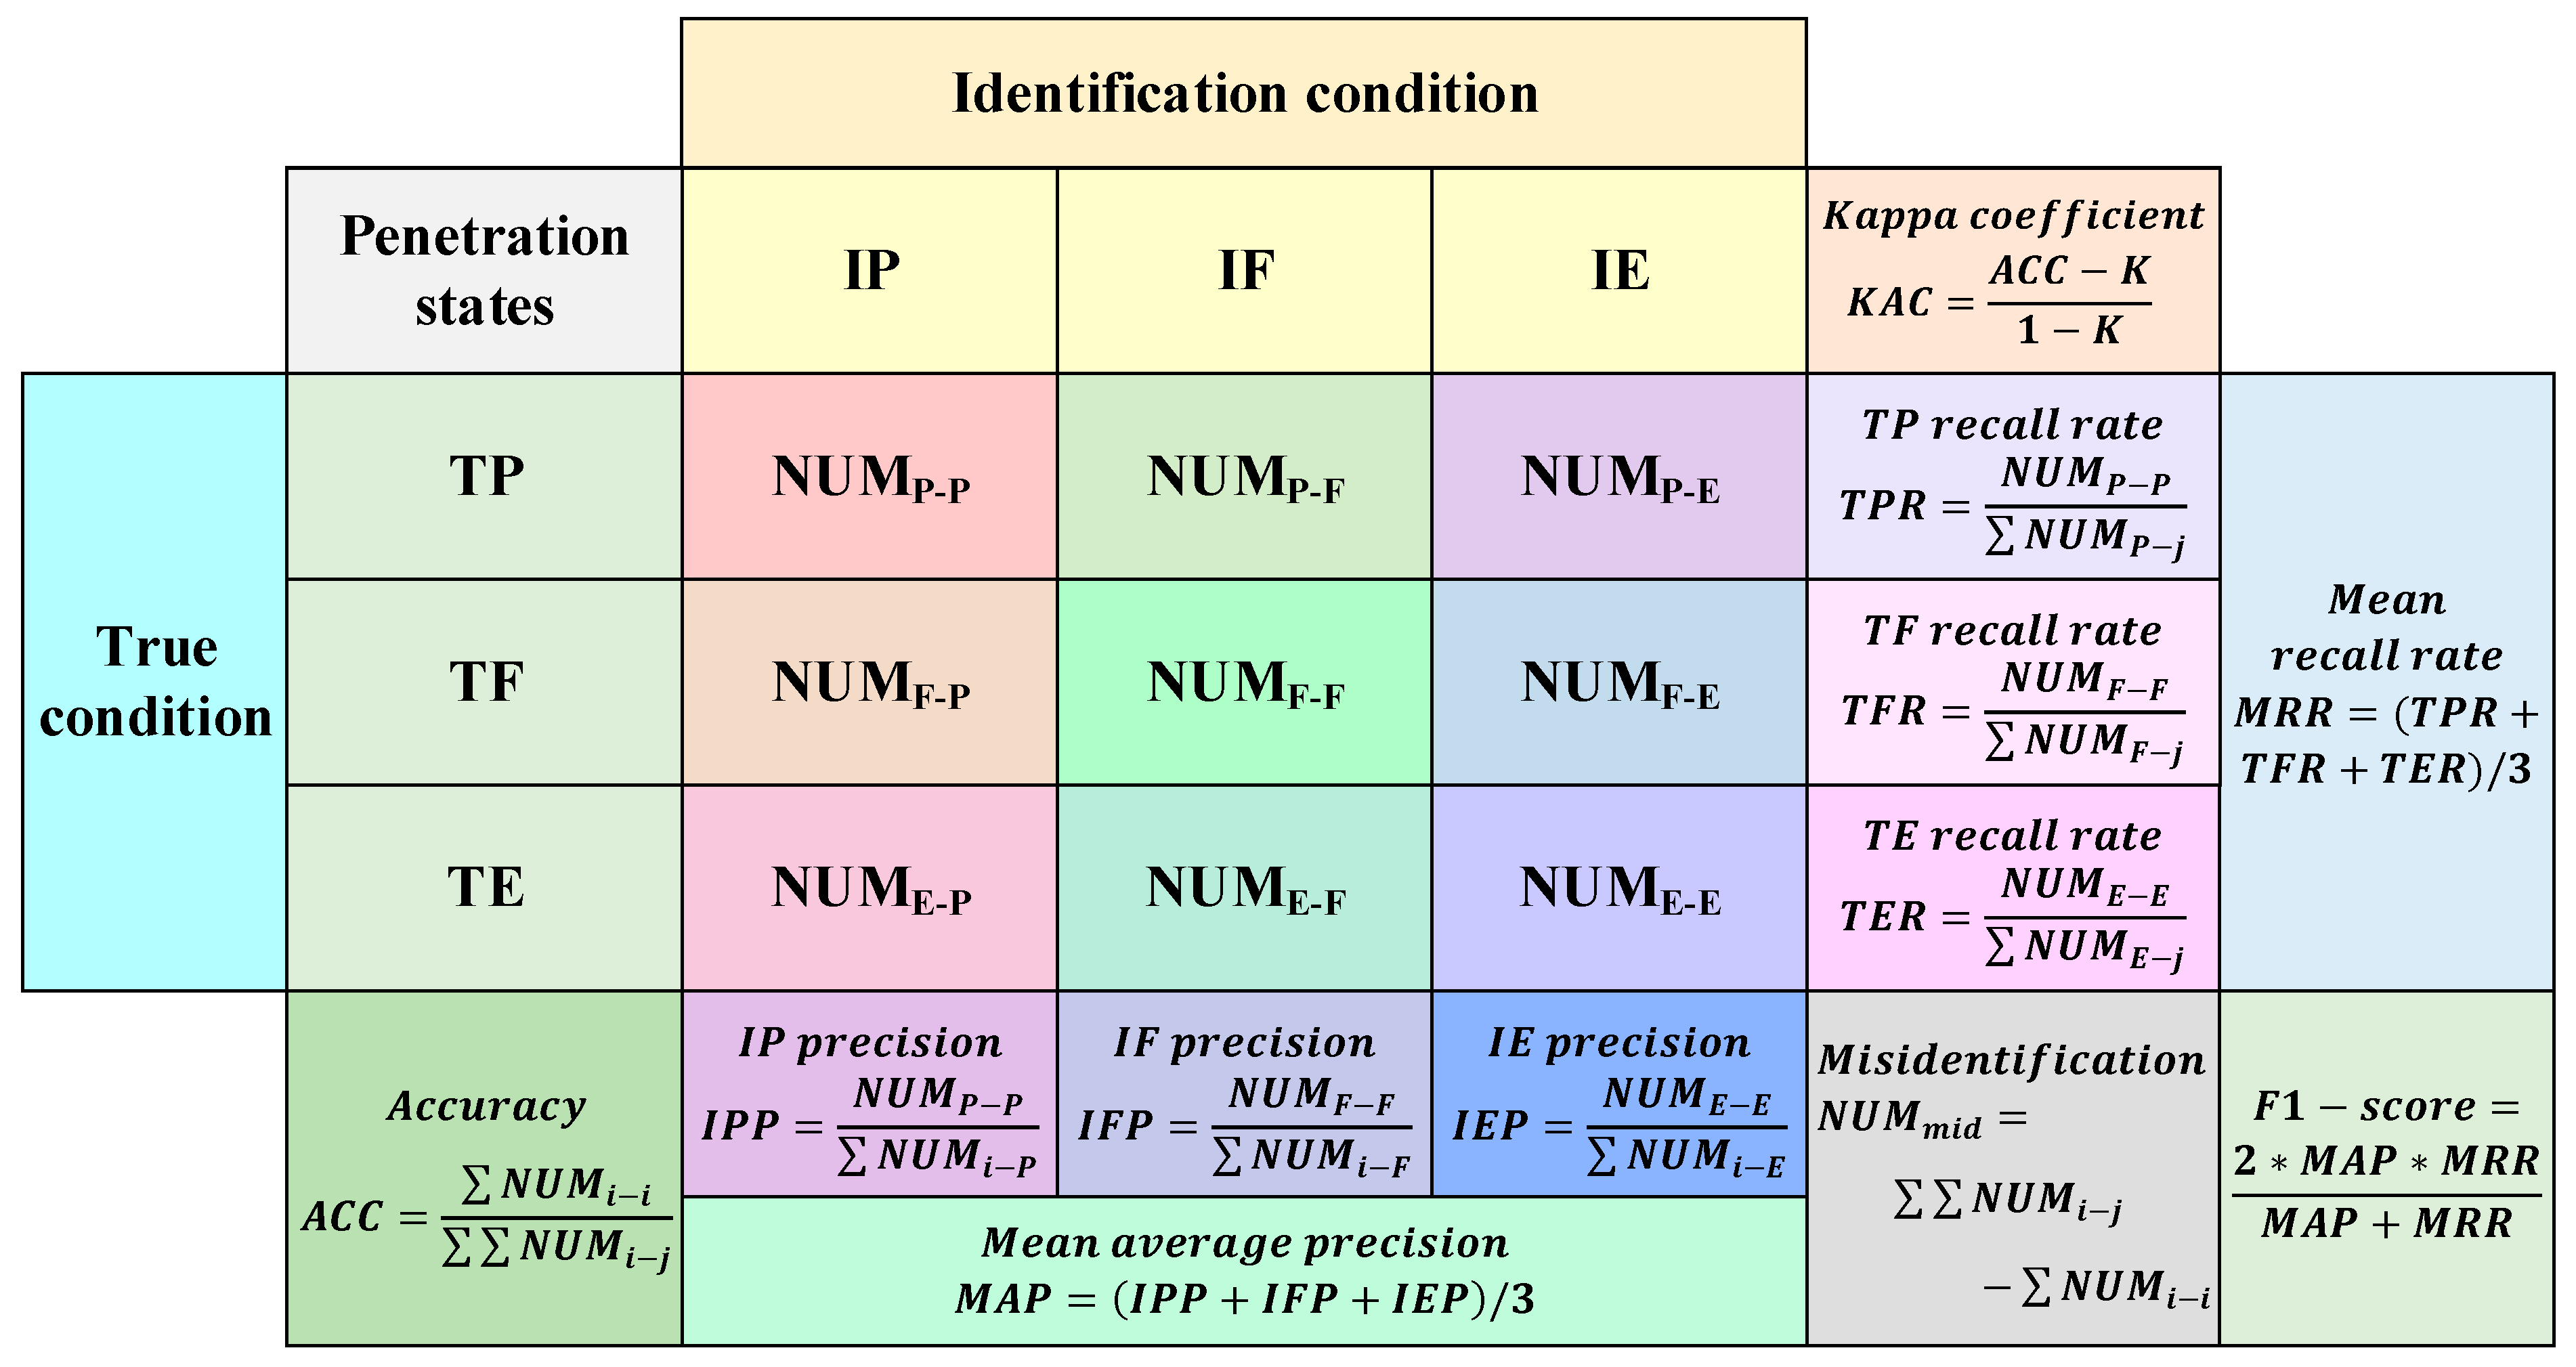
The time and frequency domain features of different denoised signals are associated with better rates of identification for the three different penetration states. However, each statistical feature exhibits varying degrees of state overlap, making it difficult to ensure the accurate classification of different penetration states. Therefore, based on the eight-dimensional joint feature parameters extracted by wavelet threshold denoising, this paper selects the three pattern classifiers of the radial basis function neural network (RBFNN) [57,58], the probabilistic neural network (PNN) [59,60] and the particle swarm optimization–support vector machine (PSO-SVM) [61,62] to construct the penetration state identification model with nonlinear mapping for ship robotic GMAW, and compares the identification results of four traditional wavelet denoising methods to show the advantage of the WATD-GC method. Sixty frames of feature samples for each penetration state have been selected as the model’s input data. A ratio of 2:1 has been randomly selected to divide the training and test sets, and the corresponding output results have been compared with the true penetration states using labels. In addition, all feature data sets have been normalized to reduce the detrimental influence of different data measurement dimensions on the model’s identification accuracy. For PNN, the number of neurons in the input layer is eight, which corresponds to the eight-dimensional statistical features. The number of neurons in the pattern layer is 120, which corresponds to the 120 training sample groups. In the summation layer, the number of neurons is determined to be three, based on the three types of penetration states. To output one, two or three penetration states, the output layer requires three neurons. For RBFNN, similarly to PNN, the numbers of neurons in the input and output layers are 8 and 3, respectively, while the number of neurons in the hidden layer is set to 40 based on the minimum mean square error obtained during the training iteration process. Therefore, the network structures of PNN and RBFNN are 8-120-3-3 and 8-40-3, respectively, as shown in Figure A1 of Appendix A. At the same time, because the arc sound acquired in the dynamic process of ship robotic GMAW is interfered with by noise of unknown types and sizes, it is impossible to verify the denoising effects of different denoising methods using SNR and RMSE. Therefore, to address the multi-classification problem of the identification model, with reference to the architecture mode of the binary confusion matrix, a three-dimensional confusion matrix has been designed for evaluating the penetration state identification model used for ship robotic GMAW, as shown in Figure 11. The three-dimensional confusion matrix [63] used in the welding penetration classification analysis is a 3-by-3 table that tells us the number of N U M i j for the classification results of the identification model. Many statistical indices can be obtained from the confusion matrix, such as accuracy, precision, recall rate, F1-score, and Kappa coefficient [64], and these can comprehensively reflect the model’s performance. Accuracy assesses the overall classification capacity of the identification model, precision and recall rate both represent the ratio of the number of correct classifications to the number in the true state under different conditions, the F1-score can be regarded as the harmonic mean of the accuracy and recall rate of the model, and the Kappa coefficient is used to evaluate the classification performance of the model by checking its statistical consistency based on the confusion matrix.
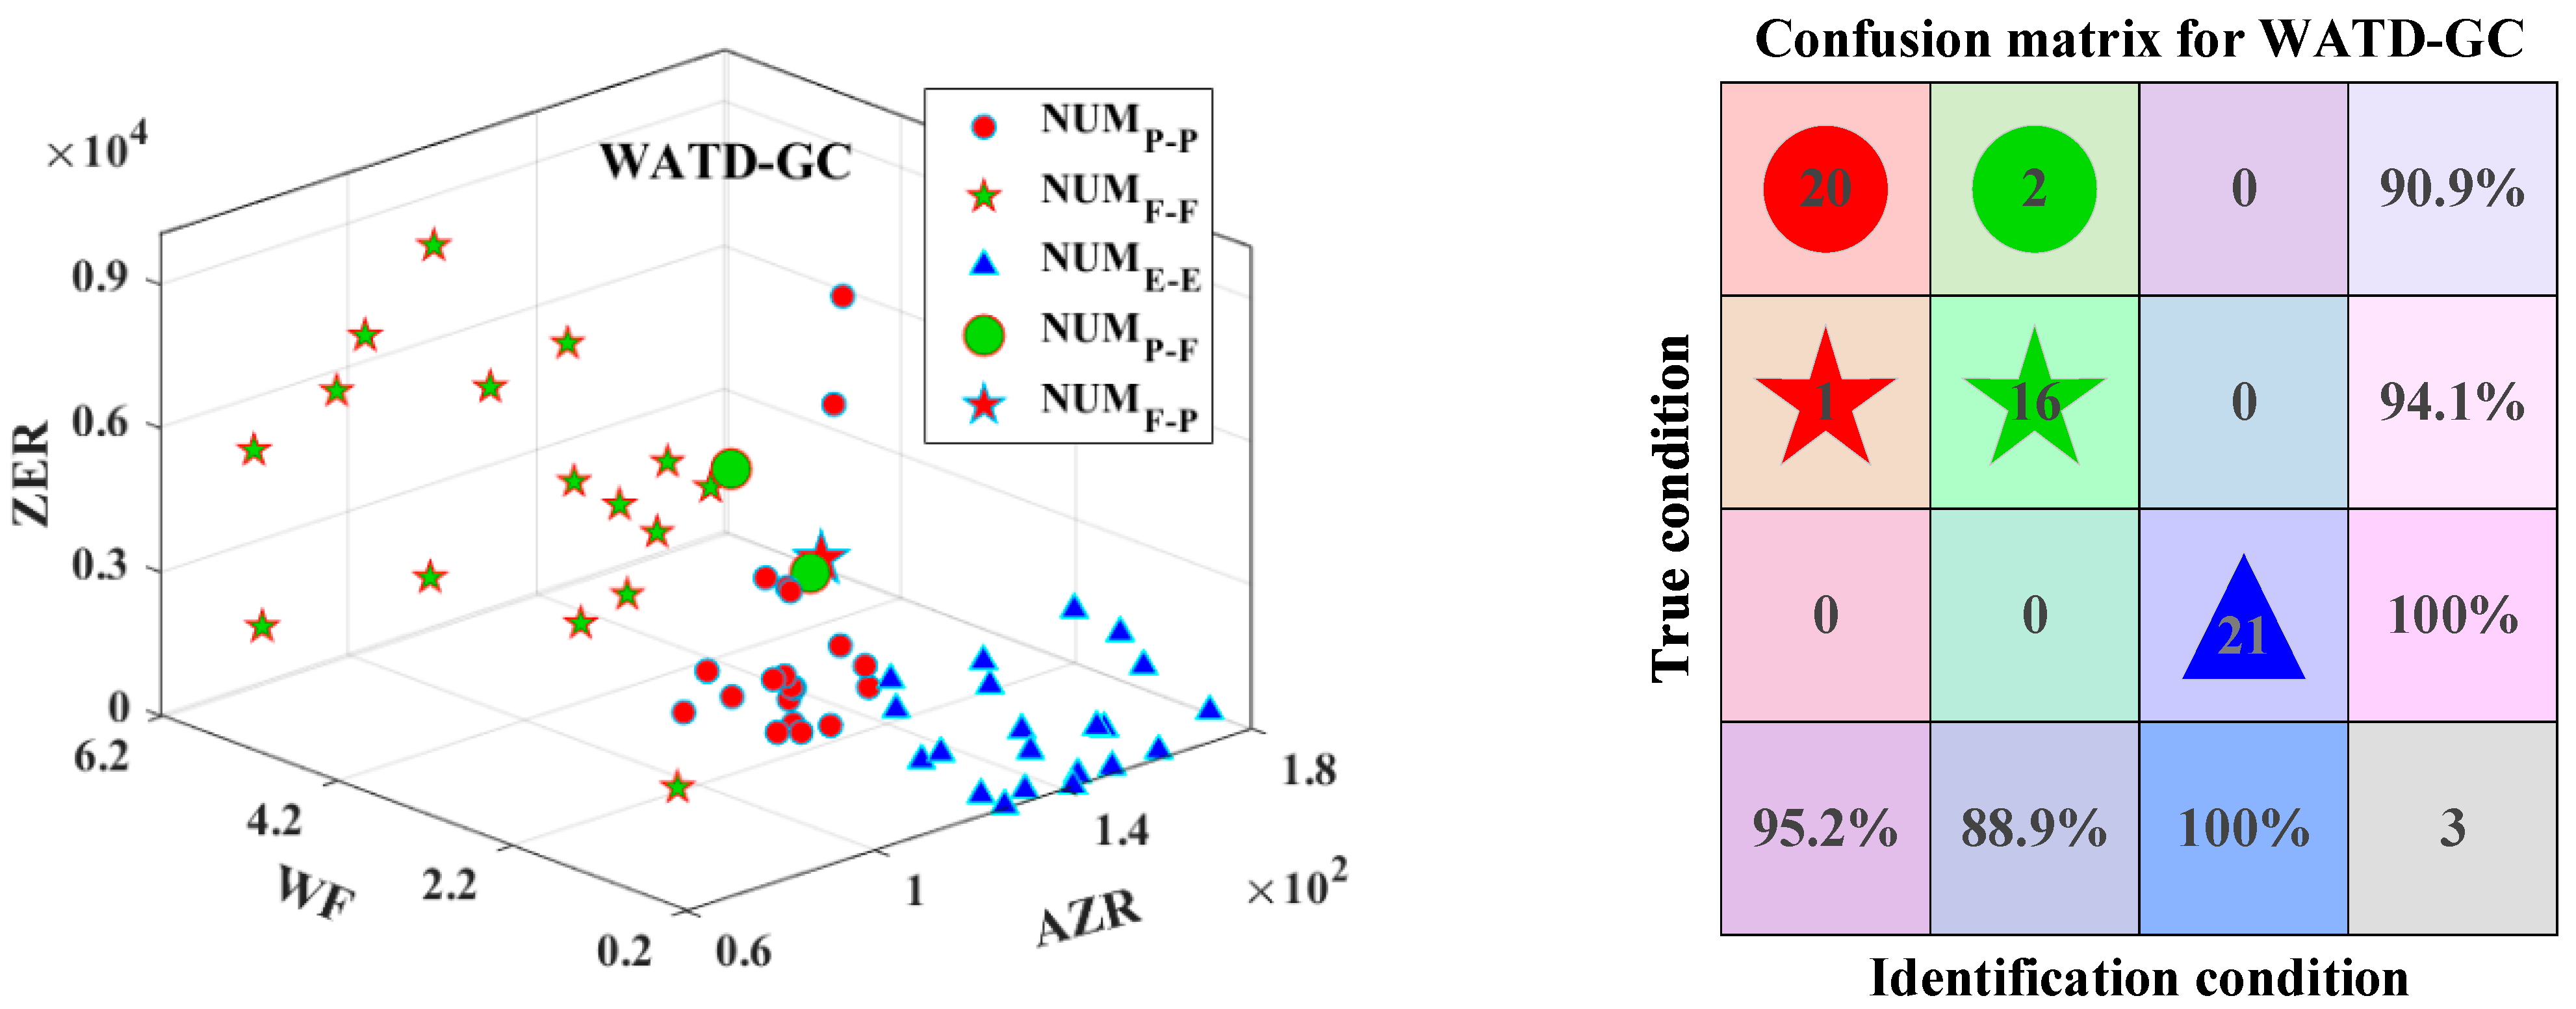
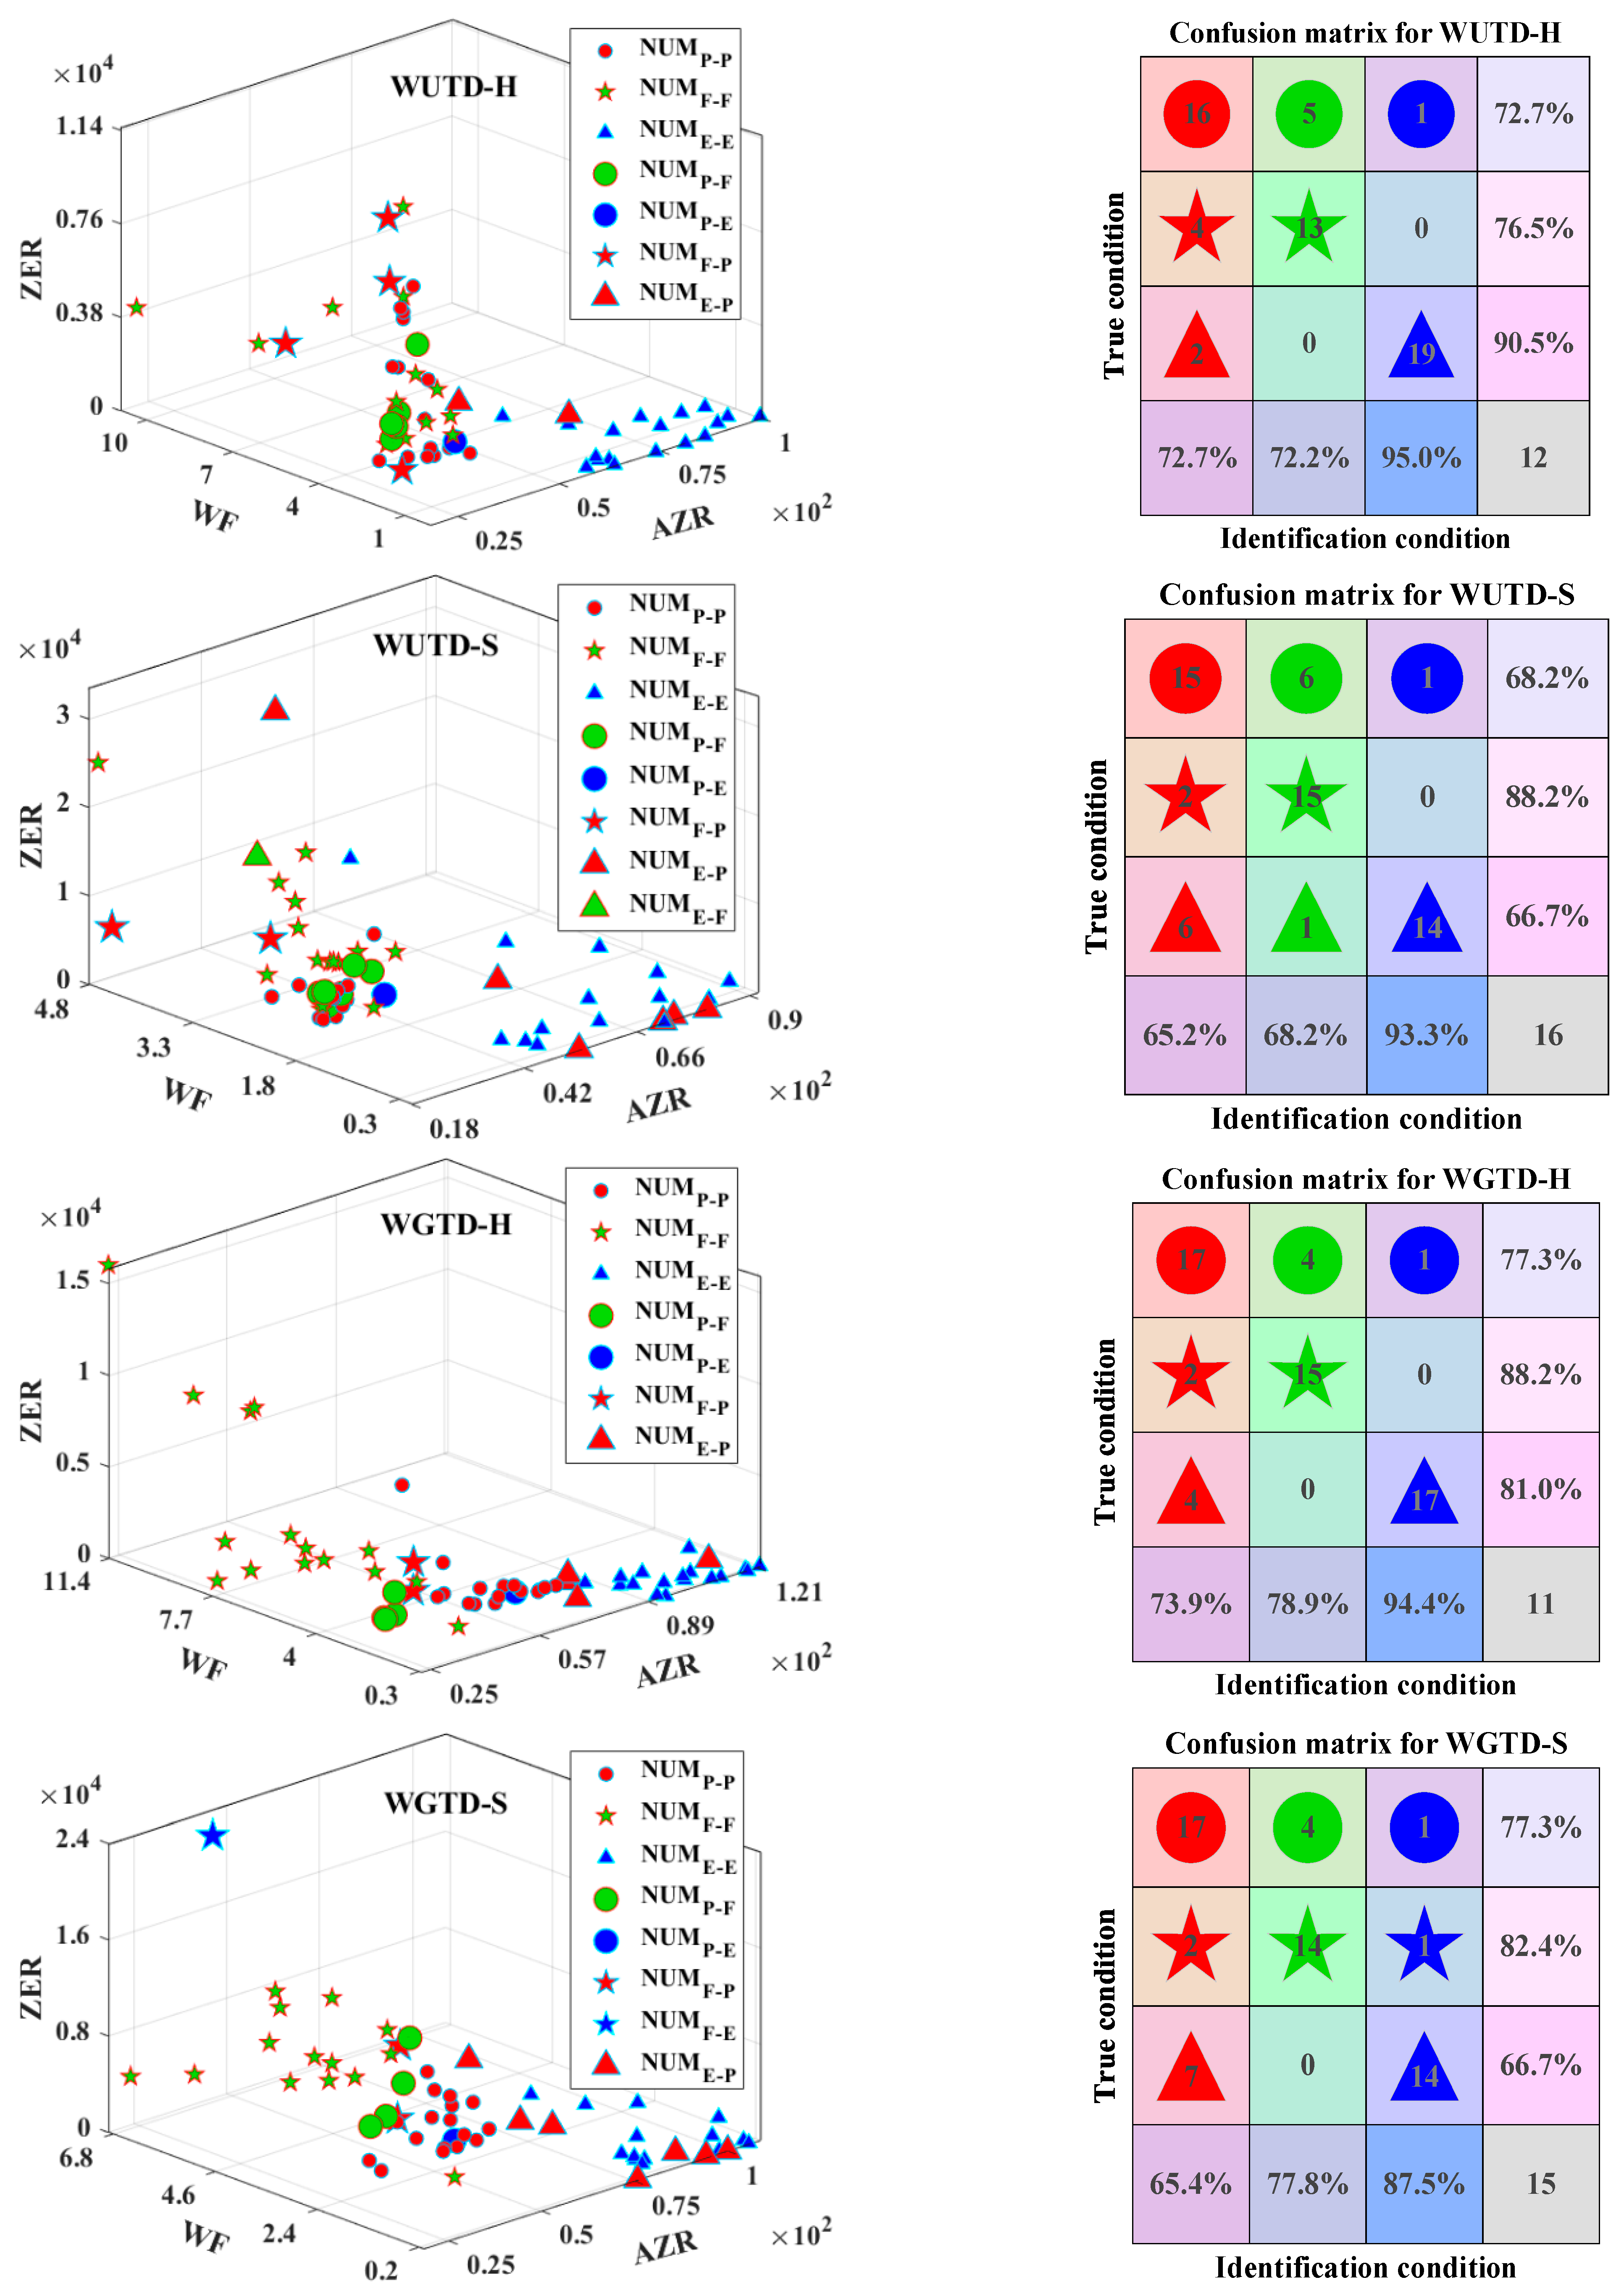
To compare the results of the identification of arc sound signal features processed by different threshold denoising methods applied to different welding penetration states, the process of dimensionality reduction via high-dimensional vector mapping to low-dimensional space has been used for reference. Different feature parameters from each of the three dimensions are selected to enable the visual penetration classification, and the corresponding confusion matrix results of the RBFNN identification method are evaluated, as shown in Figure 12. In accordance with the figure, it can be seen that, compared with the other four methods, the feature parameters extracted from the arc sound signal denoised by the WATD-GC method form three clusters with regular distribution in the low-dimensional space, and only a few items in the feature data show inter-class mode aliasing between adjacent penetration states; however, the degree of intra-class dispersion in different state intervals is small, and there are clear boundaries distinguishing the three penetration states encountered in ship robotic GMAW. The results of the confusion matrix indicate that the arc sound feature parameters extracted by the WATD-GC method correspond to the largest number of positive identifications in each penetration state, with the highest accuracy and recall rate, and the fewest misjudgments arise between the two adjacent states of incomplete penetration and penetration, while the excessive penetration state is accurately identified.
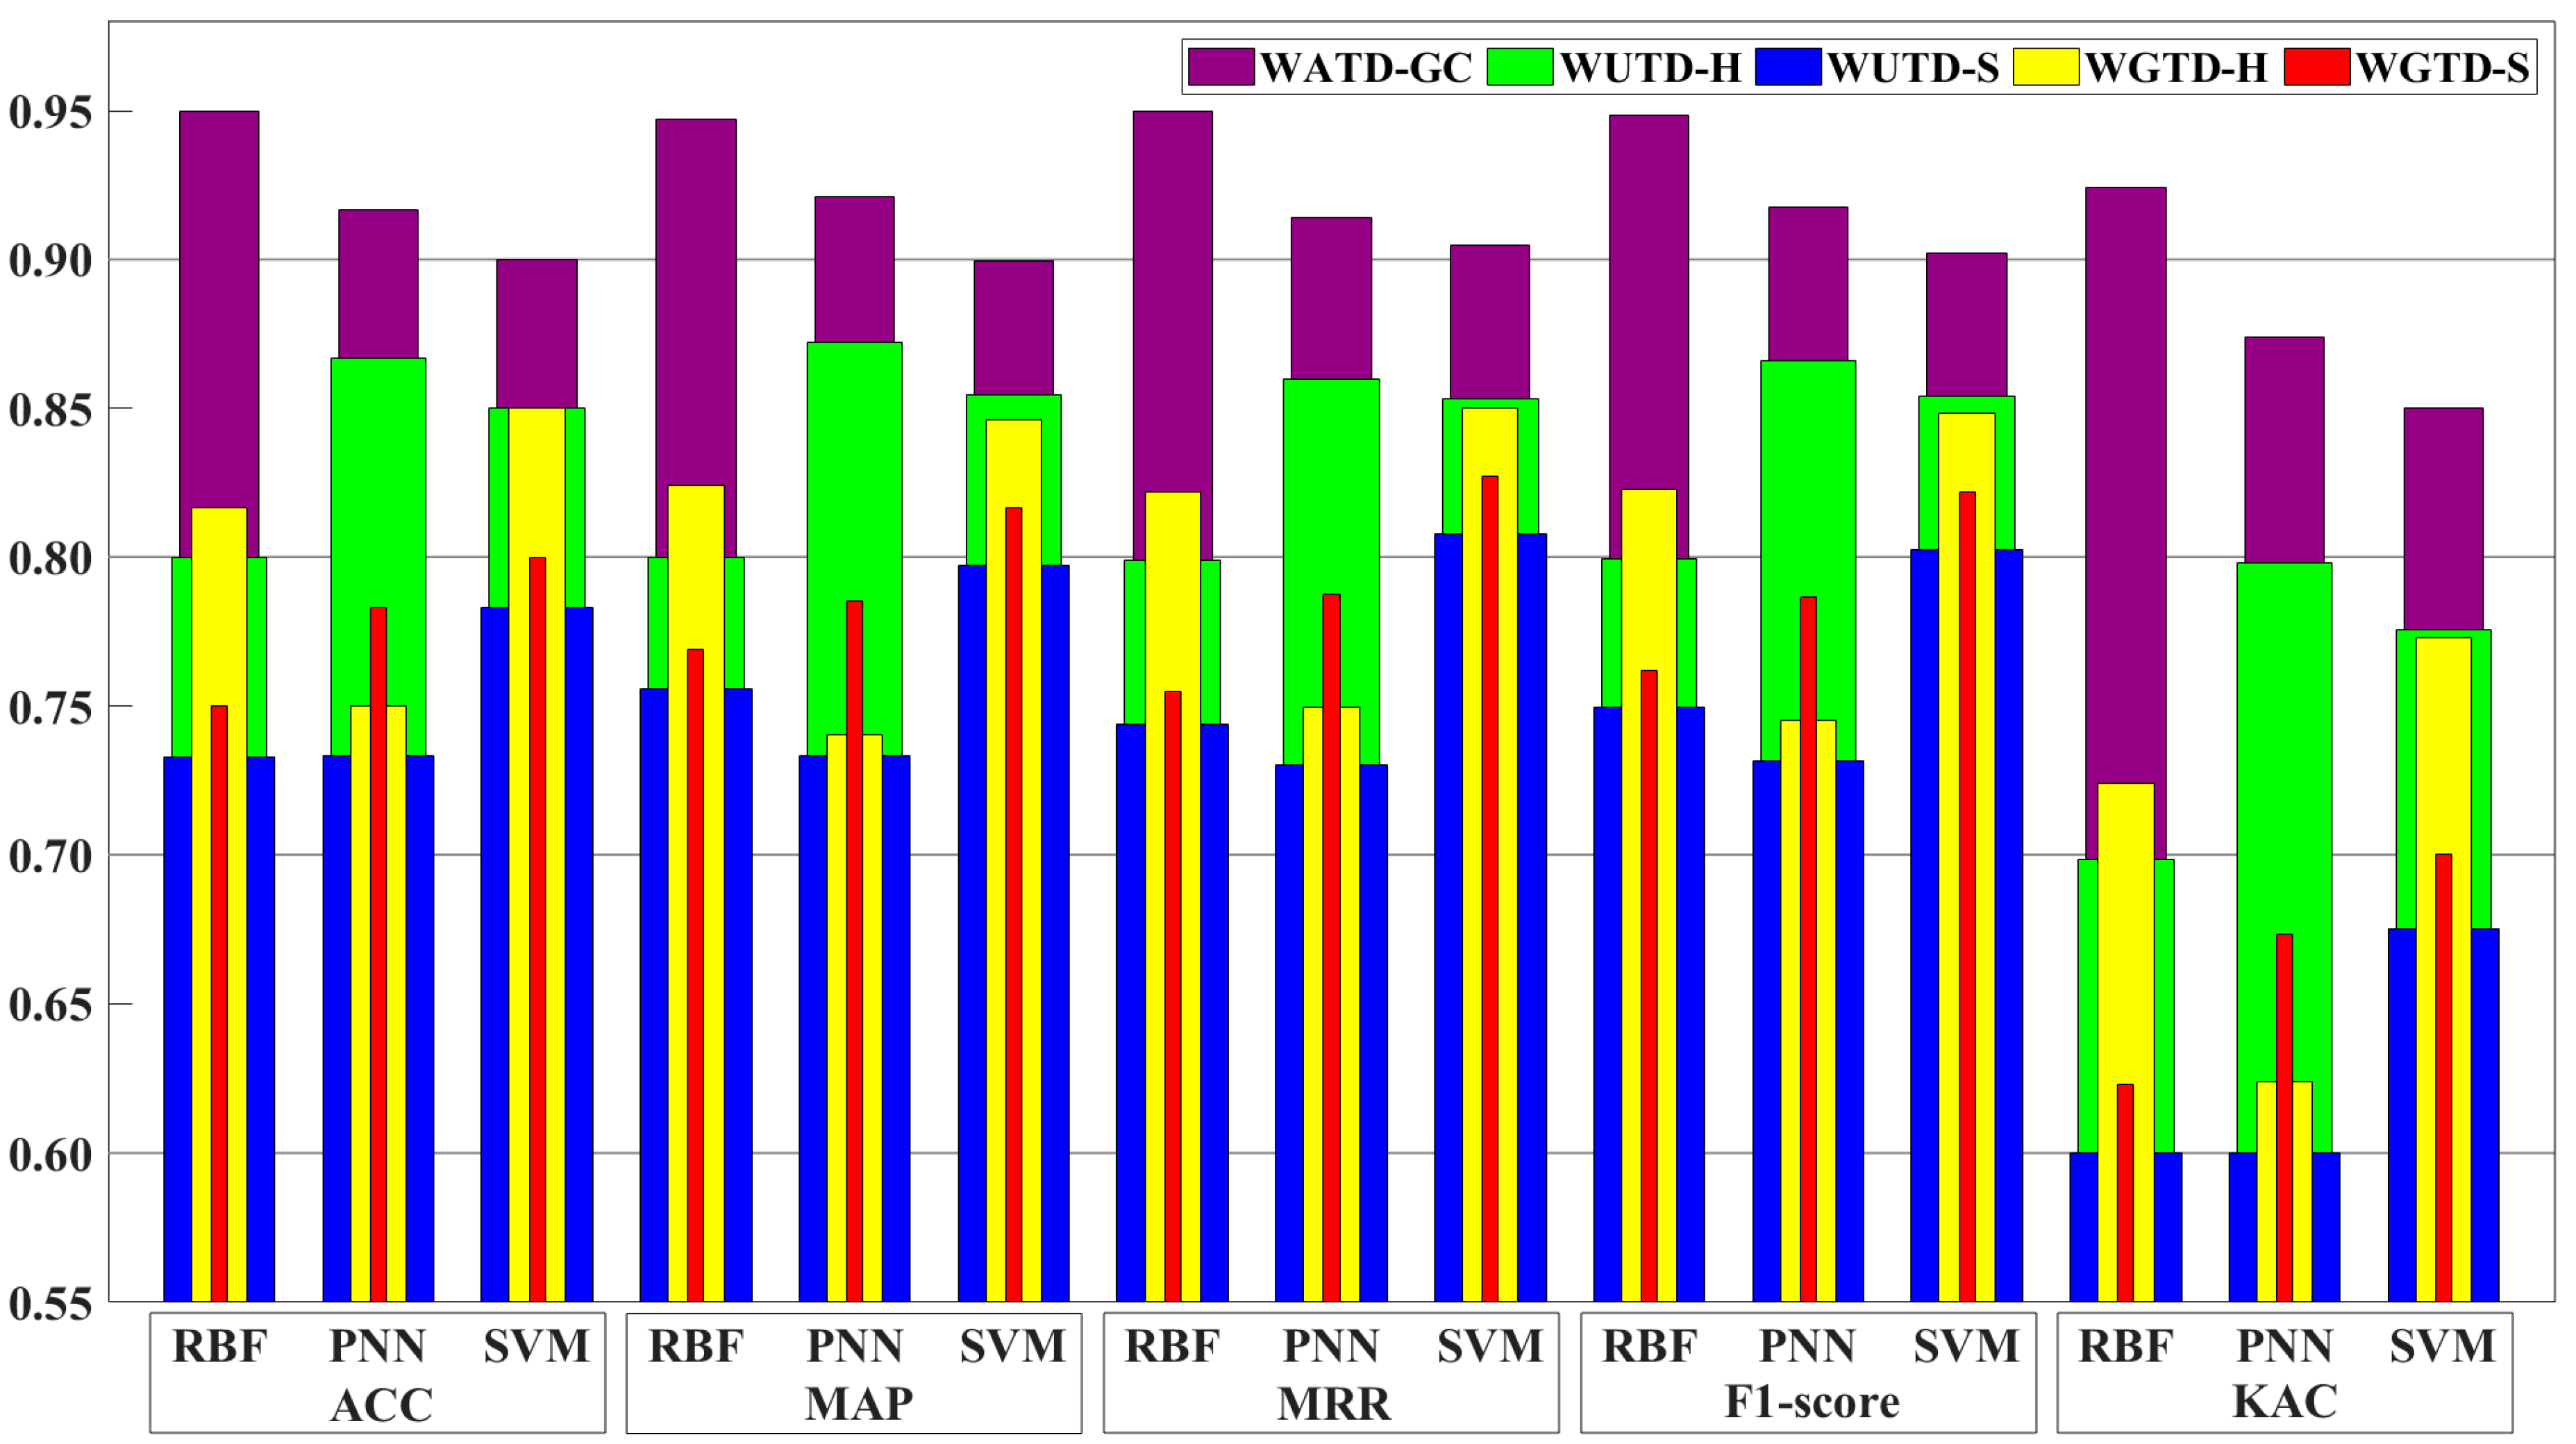
In this case, three commonly used pattern classifiers, i.e., RBFNN, PNN and PSO-SVM, are used to identify the penetration state during ship robotic GMAW. At the same time, five statistical indexes are included in the confusion matrix shown in Figure 11 to help us further judge the advantages and disadvantages of the arc sound feature parameters extracted via different denoising methods (refer to Figure 13 for details). It can be seen that the identification results corresponding to the WATD-GC method are obviously dominant, and their statistical indices are slightly different under the conditions of different identification methods. However, all the indexes remain within the 0.85–0.95 range, thus enabling the high-precision classification of the penetration state during actual welding. Compared with other denoising methods, here, the ACC, MAP, MRR, F1-score, and KAC of penetration identification are significantly higher; the ACC of the WATD-GC method is better than those of other methods (by about 6–30%), the MAP is higher (by about 5–26%), the MRR is about 6–28% greater, and the F1-score and the KAC are improved by 6–27% and 10–54%, respectively. Moreover, the WATD-GC method combined with the RBFNN classifier achieves better penetration state identification, and under this method, all five statistical indexes are greater than those of the other four denoising methods combined with three different classifiers, and all of them maintain a high identification rate range of 0.92–0.95.

6. Conclusions

In this paper, an improved wavelet threshold denoising method is proposed to effectively solve the problem according to which arc sound acquisition is easily disrupted by environmental noise during ship robotic GMAW, which affects the accuracy of penetration state identification. The threshold estimation method is updated by introducing a measure of scale, which is logarithmically negatively correlated with the decomposition scale and follows the change trend of the noise signal in the wavelet domain while increasing adaptive estimation ability. Meanwhile, the advantages of the asymptotic and continuous HTF and STF are taken into account, and a GCTF with high-order differentiability and non-constant deviation characteristics is constructed; this is achieved using the natural logarithmic function structure, and exploits the concave–convex gradient to adjust the asymptotic rate, enabling it to ameliorate the denoising failure phenomenon, which is invoked by single-mode threshold estimation and the additional oscillation of reconstructed signal. Accordingly, we can reasonably estimate the threshold and adjust the parameters of the function architecture to meet the distributed propagation characteristics of penetration state information and noise interference signals in the wavelet scale domain. This improved strategy is applied in the signal denoising of arc sound in ship robotic GMAW, and the results of the feature extraction and identification of penetration states are compared with those of the traditional methods of WUTD-H, WUTD-S, WGTD-H, and WGTD-S to verify the effectiveness of this model. The main conclusions are as follows:
  • We have proposed and theoretically proven the related property theorems of GCTF, such as continuity, an asymptotic property, non-constant deviation, the approximate rate of the concave–convex gradient, etc. By comparing the results of the simulation of speech synthesis signals with different noise intensities, it can be concluded that the signal denoised by the WATD-GC method is basically consistent in terms of waveform amplitude and fluctuation trend with the useful signal in the time and frequency domains, while the frequency band range corresponding to the peak–valley energy region remains unchanged. The indices used for denoising evaluation, which include the SNR increasing by 30−150%, the RMSE decreasing by 37−70%, and the smoothness and NCC approaching 1, are higher under conditions of constant input noise (SNR = 14 dB). This reveals that the denoising effect of the WATD-GC method is both better and more adaptable;
  • In the denoising of arc sound signals for ship robotic GMAW, compared to the traditional denoising methods, the “glitch” in the time domain of denoised signals obtained by the WATD-GC method is effectively filtered out, and the waveform mutation and signal outline are made clearer. The power spectral density waveform of the denoised signal in the frequency domain is the most similar to that of the arc sound signal, and the irregular fluctuation of peak–valley is more reflective of the actual welding situation. The high-frequency detail coefficient of quantization processing is accurately allocated to the effective frequency band, thus maximizing the avoidance of frequency aliasing and frequency band misalignment, and providing a pure and high-quality arc sound signal for the accurate extraction of GMAW penetration state features;
  • The mechanism of “auditory attention” is employed to select the sensitive frequency band (4.0–7.5 kHz) as the region of interest. Applying this principle involves analyzing the correlation between extracted features and weld penetration. The eight-dimensional statistics of the time and frequency domains are adopted to extract the penetration features of different denoised arc sound signals, with correlation coefficients maintained within the range of 0.40–0.79. The three pattern classifiers, i.e., RBFNN, PNN, and PSO-SVM, are utilized for state identification modelling by inputting the extracted features. The feature parameters extracted from the denoised arc sound by the WATD-GC method are regularly distributed, with clustering in low-dimensional space, the statistical dispersion separating the state clusters is smaller, and there is a clear neighborhood boundary. The results of the confusion matrix indicate that the identification capacities of the five statistical indexes are obviously superior under different classifier models; the precision of their identification remains in the high range of 0.85–0.95, while ACC is improved by 6–30%, MAP by 5–26%, MRR by 6–28%, F1-score by 6–27%, and KAC by 10–54%. Therefore, the WATD-GC method can not only preprocess the arc sound signal to achieve the accurate identification of the penetration state, but it can also provide a valid technological basis for quality monitoring in ship robotic GMAW.
Although our limited experimental conditions may not fully represent the actual production environment, we have still presented a new wavelet threshold denoising method, demonstrating its promising practical applications in weld quality monitoring. In the future, more extensive welding experiments will be conducted in shipyard manufacturing workshops. In the face of increasing uncertainty, such as that related to the variety of noise types and the strength of noise intensity, different types of interference effects will be analyzed to construct a noise database. Simultaneously, preprocessing algorithms for specific types of noise interference will be developed, and the corresponding wavelet basis functions will be selected based on denoising effect comparisons. Furthermore, a new wavelet basis function may be created, incorporating the propagation characteristics of various wavelet energies within the wavelet domain, which can be utilized to represent the weld formation mechanism more accurately and expand its practical applications.

Author Contributions

Z.J. wrote the full text, designed the structure of the improved algorithm, proved its convergence theorem, and developed the practical application model. T.Y. was responsible for the simulation experiment calculations and welding procedure test. X.G. and W.L. revised and improved the application case design and results analysis. S.C. supervised and reviewed the research and provided financial support. All authors have read and agreed to the published version of the manuscript.

Funding

We are sincerely thankful for the generous financial funding of the Guangxi Innovation-Driven Development Special Fund Project of China (no. GuikeAA18118002-3), the Guangxi Natural Science Foundation of China (no. 2021GXNSFBA075023), the Guangxi Science and Technology Plan Project of China (no. GuikeAD18281007) and the Innovation Project of Guangxi Graduate Education (nos. YCBZ2019050, 2020YCXB01, and 2021YCXS017).

Data Availability Statement

The data used to support the findings of this study are available from the corresponding author upon request.

Acknowledgments

All authors are very grateful to the Intelligentized Robotic Welding Technology Laboratory of Shanghai Jiao Tong University and the Guangxi Engineering Technology Research Center of Ship Digital Design and Advanced Manufacturing for their experimental guidance and intelligence support during this research.

Conflicts of Interest

The authors declare no conflict of interest.

Appendix A

Table A1. The chemical compositions and mechanical properties of the base metal and welding wire.
TypeChemical Compositions (Mass Fraction)/%Mechanical Properties
CSiMnPSTensile StrengthYield StrengthElongationCharpy V
Impact Test 1
Base metal≤0.20≤0.35≤1.40≤0.045≤0.045370–500 MPa≥235 MPa≥26%≥27 J
Welding wire≤0.15≤0.35≤1.25≤0.025≤0.025480–660 MPa≥400 MPa≥22%≥27 J
1 Impact-absorbing energy (longitudinal).
Figure A1. The network structures of PNN and RBFNN: (a) PNN; (b) RBFNN.
Machines 11 00911 g0a1

References

  1. Zhao, W.; Johan, L.B.; Feng, G.; Gao, C.; Cui, T. A reliability approach to fatigue crack propagation analysis of ship structures in polar regions. Mar. Struct. 2021, 80, 103075. [Google Scholar] [CrossRef]
  2. Srđan, B.; Vujadin, A.; Ljubica, M.; Bojana, Z. An analysis of impact testing of high strength low-alloy steels used in ship construction. Brodogradnja 2021, 72, 1–12. [Google Scholar]
  3. Zhang, Z.; Chen, S. Real-time seam penetration identification in arc welding based on fusion of sound, voltage and spectrum signals. J. Intell. Manuf. 2017, 28, 207–218. [Google Scholar] [CrossRef]
  4. Gao, X.; Liang, Z.; Zhang, X.; Wang, L.; Yang, X. Penetration state recognition based on stereo vision in GMAW process by deep learning. J. Manuf. Process. 2023, 89, 349–361. [Google Scholar] [CrossRef]
  5. Zhang, S.; Hu, S.; Wang, Z. Weld penetration sensing in pulsed gas tungsten arc welding based on arc voltage. J. Mater. Process. Technol. 2016, 229, 520–527. [Google Scholar] [CrossRef]
  6. Ebrahimi, A.; Kleijn, C.R.; Hermans, M.J.M.; Richardson, I.M. The effects of process parameters on melt-pool oscillatory behaviour in gas tungsten arc welding. J. Phys. D Appl. Phys. 2021, 54, 275303. [Google Scholar] [CrossRef]
  7. Ebrahimi, A.; Kleijn, C.R.; Richardson, I.M. A simulation-based approach to characterise melt-pool oscillations during gas tungsten arc welding. Int. J. Heat Mass Transf. 2021, 164, 120535. [Google Scholar] [CrossRef]
  8. Zhao, S.; Qiu, X.; Burnett, I.; Rigby, M.; Lele, A. A lumped-parameter model for sound generation in gas metal arc welding. Mech. Syst. Signal Process. 2021, 147, 107085. [Google Scholar] [CrossRef]
  9. Gao, Y.; Wang, Q.; Xiao, J.; Xiong, G.; Zhang, H. Weld penetration identification with deep learning method based on auditory spectrum images of arc sounds. Weld. World 2022, 66, 2509–2520. [Google Scholar] [CrossRef]
  10. Wu, J.; Shi, J.; Gao, Y.; Gai, S. Penetration recognition in GTAW welding based on time and spectrum images of arc sound using deep learning method. Metals 2022, 12, 1549. [Google Scholar] [CrossRef]
  11. Ren, W.; Wen, G.; Xu, B.; Zhang, Z. A novel convolutional neural network based on time-frequency spectrogram of arc sound and its application on GTAW penetration classification. IEEE Trans. Industr. Inform. 2021, 17, 809–819. [Google Scholar] [CrossRef]
  12. Gao, Y.; Wang, Q.; Huang, L.; Gong, Y.; Xiao, J. Droplet transfer modes identification in MIG welding process based on a human auditory model. J. Mech. Eng. En. 2019, 55, 68–76. [Google Scholar]
  13. Szlapa, P.; Marczak, W. Arc welding noise assessment from the measured ultrasound pressure levels. Part I: The metal active gas welding. Ultrasonics 2018, 90, 71–79. [Google Scholar] [CrossRef]
  14. Bevans, B.; Ramalho, A.; Smoqi, Z.; Gaikwad, A.; Santos, T.G.; Rao, P.; Oliveira, J.P. Monitoring and flaw detection during wire-based directed energy deposition using in-situ acoustic sensing and wavelet graph signal analysis. Mater. Design 2023, 225, 111480. [Google Scholar] [CrossRef]
  15. Liu, L.; Lan, H.; Yu, Z.; Zhou, B. Reducing noise techniques of arc sound signal. Trans. China Weld. Inst. 2009, 30, 13–16. [Google Scholar]
  16. Hong, Y.; Yang, M.; Jiang, Y.; Du, D.; Chang, B. Real-time quality monitoring of ultrathin sheets edge welding based on microvision sensing and SOCIFS-SVM. IEEE Trans. Industr. Inform. 2023, 19, 5506–5516. [Google Scholar] [CrossRef]
  17. Szlapa, P.; Marczak, W. Arc welding noise assessment from the measured ultrasound pressure levels. Part II: Pulsed and double pulsed metal active gas welding. Ultrasonics 2020, 100, 105976. [Google Scholar] [CrossRef] [PubMed]
  18. Lv, N.; Zhong, J.; Wang, J.; Chen, S. Automatic measuring and processing system of audio sensing for real-time arc height control of pulsed GTAW. Sens. Rev. 2014, 34, 51–66. [Google Scholar] [CrossRef]
  19. Liu, J.; Mao, F. Welding current signals interference reduction processing based on particle filter. Hot Work. Technol. 2014, 43, 164–166. [Google Scholar]
  20. Mao, F. Rotating Arc Current Signal Processing Based on Particle Filter and the PID Control Parameter Setting. Master’s Thesis, Nanchang University, Nanchang, China, 2014. [Google Scholar]
  21. Liu, L.; Yu, Z.; Lan, H.; Gao, H. Separating technology of arc sound noise based on ICA in MIG welding. Trans. China Weld. Inst. 2014, 31, 53–56. [Google Scholar]
  22. Ao, S.; Luo, Z.; Feng, M.; Yan, Y. Extraction of the acoustic signal from laser welding in a noisy environment with a microphone array. Lasers Eng. 2016, 33, 129–148. [Google Scholar]
  23. Martinek, R.; Jaros, R.; Baros, J.; Danys, L.; Kawala-Sterniuk, A.; Nedoma, J.; Machacek, Z.; Koziorek, J. Noise reduction in industry based on virtual instrumentation. Comput. Mater. Contin. 2021, 69, 1073–1096. [Google Scholar] [CrossRef]
  24. Huang, J.; Hong, B.; Pan, J.; Qu, Y.; Yuan, C. Signal treatment of the arc-sensor type weld tracking system in SAW. Weld. Technol. 2005, 34, 44–45. [Google Scholar]
  25. Cai, Y.; Luo, Y.; Wang, X.; Yang, S.; Zhang, F.; Tang, F.; Peng, Y. Physical mechanism of laser excited acoustic wave and its application in recognition of incomplete-penetration welding defect. Int. J. Adv. Manuf. Technol. 2022, 120, 6091–6105. [Google Scholar] [CrossRef]
  26. Guo, R.; Luo, Z.; Li, M. A survey of optimization methods for independent vector analysis in audio source separation. Sensors 2023, 23, 493. [Google Scholar] [CrossRef] [PubMed]
  27. Abbas, N.A.; Salman, H.M. Independent component analysis based on quantum particle swarm optimization. Egypt. Inform. J. 2018, 19, 101–105. [Google Scholar] [CrossRef]
  28. Lan, H.; Zhang, H.; Chen, S.; Sheng, K.; Zhao, D. Correlation of arc sound and arc-sidewall position in narrow gap MAG welding. J. Mech. Eng. En. 2014, 50, 38–43. [Google Scholar] [CrossRef]
  29. Huang, Y.; Wang, K.; Zhou, X. Translation invariant wavelet de-noising of CO2 gas shielded arc welding electrical signal. J. Mech. Eng. En. 2018, 54, 95–100. [Google Scholar] [CrossRef]
  30. Yusof, M.F.M.; Quazi, M.M.; Aleem, S.A.A.; Ishak, M.; Ghazali, M.F. Identification of weld defect through the application of denoising method to the sound signal acquired during pulse mode laser welding. Weld. World 2023, 67, 1267–1281. [Google Scholar] [CrossRef]
  31. Ma, Y. Research on the Methods for Quality Monitoring Based on Arc Sound Signal in CO2 Arc Welding. Ph.D. Thesis, Lanzhou University of Technology, Lanzhou, China, 2005. [Google Scholar]
  32. Liu, L.; Lan, H.; Zheng, H.; Yu, Z. Relationship between arc sound signal and penetration status in MIG welding. J. Mech. Eng. En. 2010, 46, 79–84. [Google Scholar] [CrossRef]
  33. Huang, L.; Gao, Y.; Wang, Q.; Gong, Y. Analysis of short-time energy and formant of arc acoustic signals under a different shielding gases. Weld. Technol. 2019, 48, 5–10. [Google Scholar]
  34. Wu, D.; Chen, H.; He, Y.; Song, S.; Lin, T.; Chen, S. A prediction model for keyhole geometry and acoustic signatures during variable polarity plasma arc welding based on extreme learning machine. Sens. Rev. 2016, 36, 257–266. [Google Scholar] [CrossRef]
  35. Yu, Z. MIG Welding Arc Sound Signal De-Noising Technique Research. M.S. Thesis, Harbin University of Science and Technology, Harbin, China, 2010. [Google Scholar]
  36. Shi, Y.; Huang, J.; Nie, J.; Fan, D. Correlation of arc acoustic signals and droplet transfer in aluminum pulsed MIG welding. Trans. China Weld. Inst. 2009, 30, 29–32. [Google Scholar]
  37. Bi, S.; Lan, H.; Liu, L. On-line monitoring of penetration status based on characteristic analysis of arc sound signal in MAG welding. Trans. China Weld. Inst. 2010, 301, 17–20. [Google Scholar]
  38. Hassan, F.; Rahim, L.A.; Mahmood, A.K.; Abed, S.A. A hybrid particle swarm optimization-based wavelet threshold denoising algorithm for acoustic emission signals. Symmetry 2022, 14, 1253. [Google Scholar] [CrossRef]
  39. Li, X.; Li, K.; He, G.; Zhao, J. Research on improved wavelet threshold denoising method for non-contact force and magnetic signals. Electronics 2023, 12, 1244. [Google Scholar] [CrossRef]
  40. Mallat, S.G. A theory for multiresolution signal decomposition: The wavelet representation. IEEE Trans. Pattern Anal. Mach. Intell. 1989, 11, 674–693. [Google Scholar] [CrossRef]
  41. Xie, B.; Xiong, Z.; Wang, Z.; Zhang, L.; Zhang, D.; Li, F. Gamma spectrum denoising method based on improved wavelet threshold. Nucl. Eng. Technol. 2020, 52, 1771–1776. [Google Scholar] [CrossRef]
  42. Donoho, D.L.; Johnstone, I.M. Ideal spatial adaptation by wavelet shrinkage. Biometrika 1994, 81, 425–455. [Google Scholar] [CrossRef]
  43. Donoho, D.L. De-noising by soft-thresholding. IEEE Trans. Inf. Theory 1995, 41, 613–627. [Google Scholar] [CrossRef]
  44. Srivastava, M.; Anderson, C.L.; Freed, J.H. A new wavelet denoising method for selecting decomposition levels and noise thresholds. IEEE Access 2016, 4, 3862–3877. [Google Scholar] [CrossRef] [PubMed]
  45. Guo, T.; Zhang, T.; Lim, E.; Lopez-Benitez, M.; Ma, F.; Yu, L. A review of wavelet analysis and its applications: Challenges and opportunities. IEEE Access 2022, 10, 58869–58903. [Google Scholar] [CrossRef]
  46. Obidin, M.V.; Serebrovski, A.P. Wavelets and adaptive thresholding. J. Commun. Technol. Electron. 2014, 59, 1434–1439. [Google Scholar] [CrossRef]
  47. Hussein, R.; Shaban, K.B.; El-Hag, A.H. Wavelet transform with histogram-based threshold estimation for online partial discharge signal denoising. IEEE. Trans. Instrum. Meas. 2015, 64, 3601–3614. [Google Scholar] [CrossRef]
  48. Maheswari, R.V.; Subburaj, P.; Vigneshwaran, B.; Iruthayarajan, M.W. Partial discharge signal denoising using adaptive translation invariant wavelet transform-online measurement. J. Electr. Eng. Technol. 2014, 9, 695–706. [Google Scholar] [CrossRef]
  49. Ji, M.; Zhao, X.; Zhu, W.; You, Y.; Zhang, J.; Shang, M.; Chuai, X.; Xue, Y.; Lian, C.; Chen, W. Noise attenuation using adaptive wavelet threshold based on CEEMD inf-X domain. J. Seism. Explor. 2023, 32, 131–153. [Google Scholar]
  50. Dixit, A.; Majumdar, S. Comparative analysis of coiflet and Daubechies wavelets using global threshold for image de-noising. Int. J. Adv. Eng. Technol. 2013, 6, 2247–2252. [Google Scholar]
  51. Verma, N.; Verma, A.K. A comparative analysis for wavelets and threshold estimation selection for denoising of audio signals of some Indian musical instruments. Int. J. Adv. Res. Comput. Sci. 2012, 3, 536–541. [Google Scholar]
  52. Zhou, J.; Xing, B.; Ni, L.; Ai, P. A study on adaptive wavelet packet threshold function de-noising algorithm based on Shannon entropy. J. Vib. Shock 2018, 37, 206–211. [Google Scholar]
  53. Shams, M.A.; Anis, H.I.; El-Shahat, M. Denoising of heavily contaminated partial discharge signals in high-voltage cables using maximal overlap discrete wavelet transform. Energies 2021, 14, 6540. [Google Scholar] [CrossRef]
  54. Wang, J.; Chen, B.; Chen, H.; Chen, S. Analysis of arc sound characteristics for gas tungsten argon welding. Sens. Rev. 2009, 29, 240–249. [Google Scholar] [CrossRef]
  55. Zhang, Z.; Huang, J. An adaptive voice activity detection algorithm. Int. J. Smart Sens. Intell. Syst. 2015, 8, 2175–2194. [Google Scholar]
  56. Lv, N.; Xu, Y.; Li, S.; Yu, X.; Chen, S. Automated control of welding penetration based on audio sensing technology. J. Mater. Process. Technol. 2017, 250, 81–98. [Google Scholar] [CrossRef]
  57. Bors, A.G.; Gabbouj, M.G. Minimal topology for a radial basis functions neural network for pattern classification. Digit. Signal Process. 1994, 4, 173–188. [Google Scholar] [CrossRef]
  58. Luo, M.; Shin, Y. Estimation of keyhole geometry and prediction of welding defects during laser welding based on a vision system and a radial basis function neural network. Int. J. Adv. Manuf. Technol. 2015, 81, 263–276. [Google Scholar] [CrossRef]
  59. Donald, F.S. Probabilistic neural networks. Neural Netw. 1990, 3, 109–118. [Google Scholar]
  60. Zhang, H.; Wang, F.; Gao, W.; Hou, Y. Quality assessment for resistance spot welding based on binary image of electrode displacement signal and probabilistic neural network. Sci. Technol. Weld. Join. 2014, 19, 242–249. [Google Scholar] [CrossRef]
  61. Wang, X.; Guan, S.; Hua, L.; Wang, B.; He, X. Classification of spot-welded joint strength using ultrasonic signal time-frequency features and PSO-SVM method. Ultrasonics 2018, 91, 161–169. [Google Scholar] [CrossRef]
  62. Chen, Y.; Ma, H.; Zhang, G. A support vector machine approach for classification of welding defects from ultrasonic signals. Nondestruct. Test. Eval. 2014, 29, 243–254. [Google Scholar] [CrossRef]
  63. Chen, C.; Xiao, R.; Chen, H.; Lv, N.; Chen, S. Prediction of welding quality characteristics during pulsed GTAW process of aluminum alloy by multisensory fusion and hybrid network model. J. Manuf. Process. 2021, 68, 209–224. [Google Scholar] [CrossRef]
  64. Eugenio, B.D.; Glass, M. The kappa statistic: A second look. Comput. Linguist. 2004, 30, 95–101. [Google Scholar] [CrossRef]
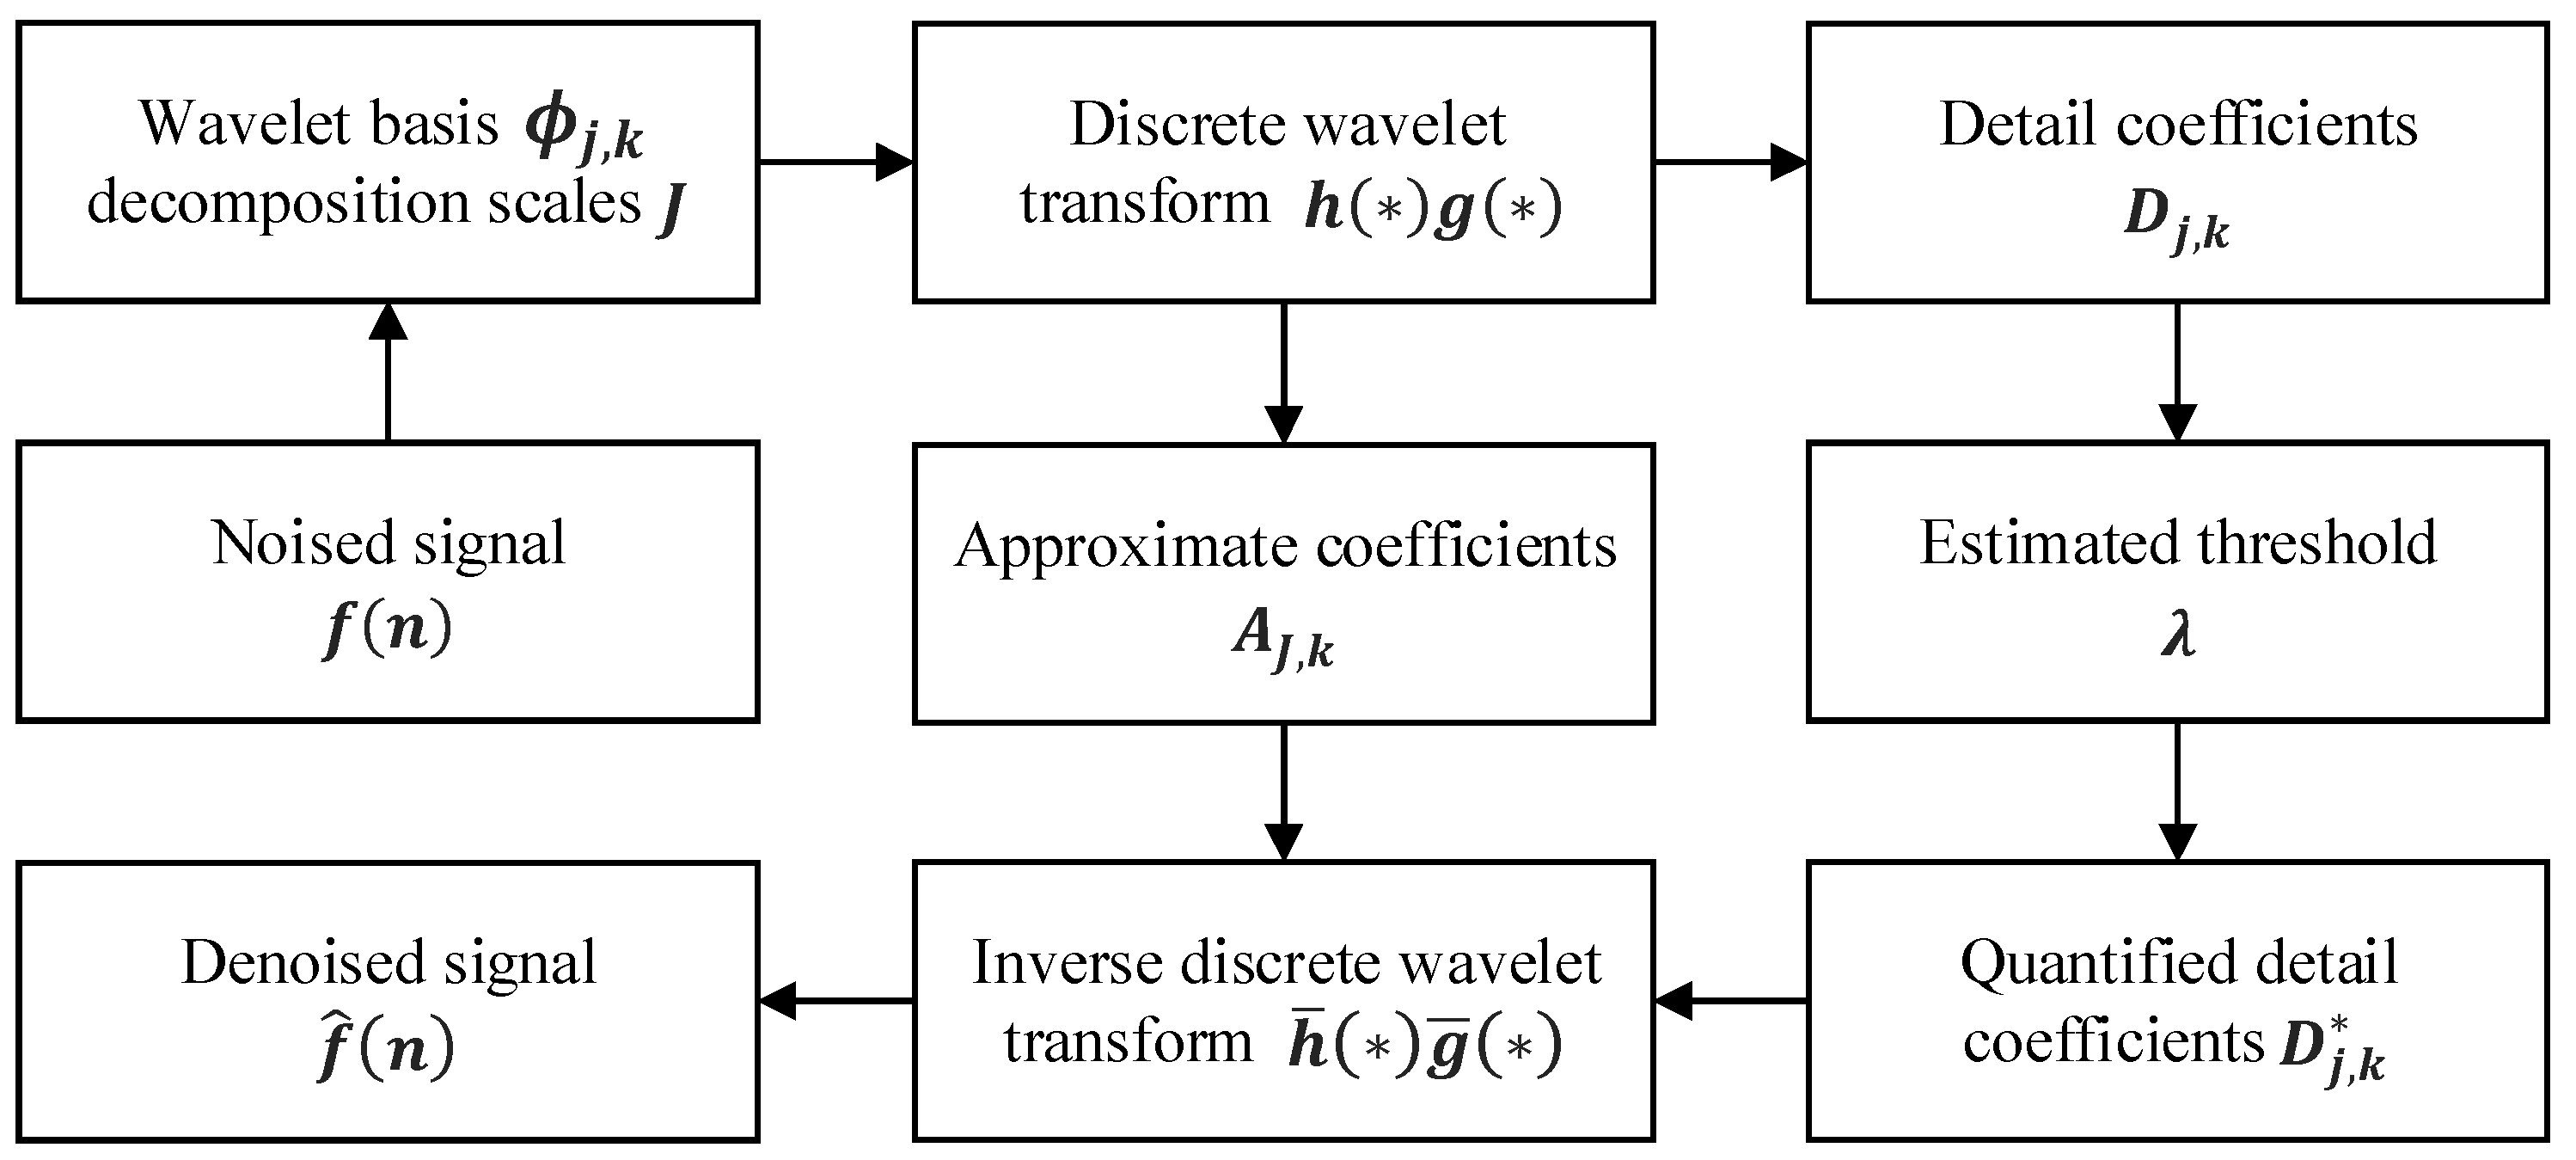
Figure 1. Flowchart of wavelet threshold denoising method.
Machines 11 00911 g001
Figure 2. Denoising process of improved wavelet threshold method.
Machines 11 00911 g002
Figure 3. Hard, soft and gradient convergent threshold functions with different concave–convex gradient ϖ values.
Machines 11 00911 g003
Figure 4. Time and frequency domain information of the useful, noisy and various denoised signals: Time domain information of the useful and (a) noisy signals, as well as the signals denoised by (c) WUTD-H, (e) WUTD-S, (g) WGTD-H, (i) WGTD-S and (k) WATD-GC. Frequency domain information of the useful and (b) noisy signals, as well as the signals denoised by (d) WUTD-H, (f) WUTD-S, (h) WGTD-H, (j) WGTD-S, and (l) WATD-GC.
Machines 11 00911 g004aMachines 11 00911 g004bMachines 11 00911 g004c
Figure 5. Comparison of effects of different denoising methods with input SNR ranging between 0 and 30 dB: (a) input SNR vs. output SNR; (b) input SNR vs. output RMSE. Note: SNR deviation = output SNR − input SNR; RMSE deviation = output RMSE − input RMSE.
Machines 11 00911 g005
Figure 6. Arc sound sensing system for ship robotic GMAW.
Machines 11 00911 g006
Figure 7. Welding seam of Q235 steel and information acquired simultaneously during ship robotic GMAW: (a) Heat-affected zone. (b) Forming effect. (c) Topside weld width. (d) Topside weld reinforcement. (e) Backside weld width. (f) Backside weld reinforcement. (g) Penetration depth.
Machines 11 00911 g007
Figure 8. The application of threshold denoising to identify penetration states for ship robotic GMAW.
Machines 11 00911 g008
Figure 9. Comparison of time, frequency, and time–frequency domains’ results regarding the arc sound signal given by various denoising methods: (a) WATD-GC; (b) WUTD-H; (c) WUTD-S; (d) WGTD-H; (e) WGTD-S.
Machines 11 00911 g009aMachines 11 00911 g009b
Figure 10. The features extracted from the time and frequency domains of different denoised signals.
Machines 11 00911 g010
Figure 11. Confusion matrix of three-dimensional penetration identification: IP, IF, and IE represent the identification of partial, full, and excessive penetration states by the classifier model. TP, TF, and TE represent true states of partial, full, and excessive penetration. N U M i j indicates the number of samples in which the true classification is i , the identification classification is j , and i , j ( P , F , E ) . K = N U M P j N U M i P + N U M F j N U M i F + N U M E j N U M i E N U M i j 2 .
Machines 11 00911 g011
Figure 12. Feature classification visualization of welding penetration states and confusion matrix results corresponding to arc sound signals processed by different denoising methods.
Machines 11 00911 g012aMachines 11 00911 g012b
Figure 13. Comparison of the identification results of arc sound features extracted using the five denoising methods with different penetration classifiers.
Machines 11 00911 g013
Table 1. Denoising effects of various methods on speech signal with an SNR of 14 dB.
IndexesReference FormulasWATD-GCWUTD-HWUTD-SWGTD-HWGTD-S
SNR 10 lg n = 1 N s 2 ( n ) n = 1 N ( s ( n ) f ^ ( n ) ) 2 17.286911.51796.958413.36298.9772
RMSE n = 1 N ( s ( n ) f ^ ( n ) ) 2 N 0.01840.0358 0.06050.02900.0480
Smoothness n = 1 N 1 ( f ^ ( n + 1 ) f ^ ( n ) ) 2 n = 1 N 1 ( s ( n + 1 ) s ( n ) ) 2 0.93340.88110.38430.88280.4418
NCC n = 1 N s ( n ) f ^ ( n ) ( n = 1 N s 2 ( n ) ) ( n = 1 N f ^ 2 ( n ) ) 0.99340.96390.92540.97640.9528
Table 2. The main technical indicators and parameters of arc sound sensing.
MicrophonePreamplifierSignal Conditioner
Thermal noise23 dBADiameter1/2 inchCrosstalk−120 dB
Dynamic range23–158 dBAAttenuation<0.1 dBOutput noise<3 μV
Polarization voltage0 VInherent noise3 μVProtection voltage35 Vp
Frequency response3–20 kHzOutput connectorBNCOutput impedance10 µF
Capacitance (typical)13 pFMax output voltage5 VrmsInput/output channel2*BNC
Open-circuit sensitivity12.5 mv/PaPower requirementICCPConstant current source4 mA
Table 3. The welding conditions for feature extraction in penetration monitoring.
Process VariablesParameters ValuesProcess VariablesParameters Values
Plate size300 × 150 × 3 mm3Welding materialQ235 steel 1
Shielding gas80%Ar + 20%CO2Filler wire materialH08MnSiA 1
Welding speed v 78–95–108 cm/minGas flow Q 20 L/min
Butt joint gap δ 0.2 mmArc length l 3.0 mm
Welding current I 200 AArc voltage U 24.2 V
Filler wire diameter ϕ 1.2 mmDry extension ζ 10.0 mm
Forming-welding processSingle-layer, single-pass CTWD ℏ 213.0 mm
1 Material properties are shown in detail in Table A1 of Appendix A. 2 Contact tip to workpiece distance.
Table 4. The feature parameters of the time and frequency domains of the arc sound signal.
Parameter TypesDetailed FormulasPhysical ImplicationsCorrelation Coefficients
Short-time energy S E i = m = 1 L y i 2 m Energy change0.4095
Average zero-crossing rate A Z R i = 1 2 m = 1 L | sgn ( y i ( m + 1 ) sgn ( y i ( m ) ) ) | Frequency classification characteristics0.7901
Waveform factor W F i = L m = 1 L y i 2 m m = 1 L | y i ( m ) | Distortion degree of
waveform
0.7027
Zero energy ratio Z E R i = A Z R i S E i Attenuation degree of strength0.7203
Peak-to-peak P O P i = max ( y i ) min ( y i ) Distribution statistics
characteristics
0.4966
Root mean square R M S i = m = 1 L y i 2 L Effective energy level0.5571
Mathematic expectation M E i = 1 T i f = 1 T i F i ( f )  1Average amplitude0.6008
Average logarithmic energy A L E i = 1 T i f = 1 T i lg ( F i 2 ( f ) ) Auditory perceptual
degree
0.6076
1  F i ( f ) is the spectrum amplitude of the arc sound signal y i ( m ) in the i t h frame after STFT processing, and T i is the spectrum length in the frequency band of interest.
Disclaimer/Publisher’s Note: The statements, opinions and data contained in all publications are solely those of the individual author(s) and contributor(s) and not of MDPI and/or the editor(s). MDPI and/or the editor(s) disclaim responsibility for any injury to people or property resulting from any ideas, methods, instructions or products referred to in the content.