Article

Optimization of Motor Rotor Punch Wear Parameters Based on Response Surface Method

1
School of Automotive and Rail Transit, Nanjing Institute of Technology, Nanjing 211167, China
2
Jiangsu Collaborative Innovation Center for Smart Distribution Network, Nanjing 211167, China
*
Author to whom correspondence should be addressed.
Machines 2024, 12(10), 671; https://doi.org/10.3390/machines12100671
Submission received: 21 August 2024 / Revised: 18 September 2024 / Accepted: 23 September 2024 / Published: 25 September 2024
(This article belongs to the Special Issue Advances in Design and Manufacturing in Die Casting and Metal Forming)

Abstract

:
To reduce the wear of the motor rotor punching punch and ensure the efficiency is the highest in actual production, the finite element analysis software Deform-3Dv11 is used to simulate the punch wear based on the Archard model theory. With punch wear as the response target and punch speed, punch clearance, and punch edge fillet as the main factors, 17 groups of response surface Box–Behnken test designs are established, as well as a quadratic polynomial regression model between the main factors and the response. The results revealed that: the influence of various parameters on punch wear is in the order of punch edge fillet C > punch clearance B > punch speed A; the order of the interactive influence of various factors is as follows: punch speed and punch edge fillet AC > punch speed and punch clearance AB > punch clearance and punch edge fillet BC. The optimal blanking process combination obtained by using Design-Expert13 software is as follows: blanking speed 50 mm/s, blanking clearance 0.036 mm, and die cutting edge rounded corner 0.076 mm; the predicted response surface value is 6.95 × 10⁻¹² mm. Through simulation verification, the actual optimized simulation value is 6.93 × 10⁻¹² mm, with an absolute relative error of 2.5% for the predicted response value. Moreover, the optimized simulation value is reduced by 30.4% compared to the one before optimization, effectively reducing the punch wear of the motor rotor punching forming and providing a theoretical foundation for further wear optimization.

1. Introduction

As one of the core components of the whole motor, the rotor is the part that generates a magnetic field. The magnetic field created by the current in the stator winding interacts with other components, generating a spinning torque and causing the motor to function. The rotor’s design and manufacturing quality have a direct impact on the motor’s performance. Motor performance is heavily influenced by rotor material selection, winding structure, and insulation treatment, among other factors. Furthermore, the rotor’s stability must be considered while determining steady functioning. The motor rotor must have adequate mechanical strength and stability to withstand the effects of external factors such as electromagnetic force, centrifugal force, vibration, and temperature [1,2]. The motor rotor is typically made up of dozens or even hundreds of pieces of silicon steel laminated riveting, while progressive die automatic riveting is used to replace the traditional process of making an iron core in a mold to complete punching the shaft hole, slot hole, and other punching shapes on the rotor.
Most of the traditional process parameter selection and optimization methods adopt the experiential trial and error method, which is not only time-consuming and laborious but also produces less-than-ideal results. With the development of finite element technology, numerical simulation has been widely used in blanking tests. Trzepiecinski [3] conducted a nonlinear analysis of the tensile process of a 2 mm thick steel plate based on the Akkadian wear model and found that the area with the most accelerated wear was in the upper half of the mold radius. Hernandez [4] proposed a theoretical model of the effect of tool wear on shear mechanism and the subsequent errors, as well as the definition of a new parameter named finite gap. Using 6 and 8 mm AISI A2 steel punches and 1 mm thick AISI 304 stainless steel sheets, the shape error as a function of this new parameter was experimentally analyzed. Hambli [5,6] conducted an in-depth study on die wear during sheet metal blanking through experimental approaches. Taking sheet metal thickness and blanking clearance as the main factors and the change of blanking force as the goal, they found that the blanking force and die wear increased with the decrease of blanking clearance and sheet metal thickness. Based on Archard wear theory, Mo [7] selected the cone angle, punch hardness, friction coefficient, and feed speed of the punch as factors to construct orthogonal experiments to obtain the optimal parameter combination, and the optimized process parameters reduced the punch’s wear. Mucha [8] introduced the surface wear mechanism of silicon chip punching punch, obtained the effect of adding coating on the degradation strength of punch side, and expounded the influence of punch wear on the change of hardness of M530-50A silicon chip material. Luo [9] performed a cross-hole punching experiment with 0.5 mm pure copper plate to investigate the relationship between blade side angle, punch geometry, and punch die wear, and concluded as follows: When the blade side angle of the punch is greater than 15°, the die’s service life is extended. Mucha [10] studied the impact of die clearance, tool material, and tool coating on cutting tool wear. In the blanking process, the impact load and strong reaction of the separating surface plate on the punching surface were generated, and the practicality of various materials for punching tools for generators was analyzed. Ruan [11] used the central experimental design approach to investigate the effect of friction coefficient, blank holding force, and sheet metal thickness on stamping springback using U-shaped parts. Multi-objective optimization yielded a set of optimal parameter combinations capable of achieving the minimal springback. Feng [12] investigated punch wear in the sheet metal punching process based on Archard wear theory, taking the relative sliding speed and pressure between sheet metal and punch as the analytical target, and reflected punch wear using the mesh displacement of finite element method. Based on Archard wear theory, Pereira et al. [13,14,15] studied the relationship between sliding velocity and contact blank holding force on wear during sheet metal forming, demonstrating that finite element simulation can be utilized to predict die wear under various process conditions. Zhao Yanjie [16] et al. established a dynamic wear model based on the Archard wear model for the die wear of an aluminum alloy covering piece. They used Python language to conduct secondary development of ABAQUS6.14 software and coupled the dynamic wear model into finite element simulation to realize the wear calculation of the die wear of an automobile covering piece considering the change of wear coefficient and hardening layer depth. The dynamic wear evolution law of the typical position of the die during the forming process was analyzed by comparison. Wei Zhang [17] et al. proposed a numerical simulation method based on continuous stamping, analyzed the mold modeling, deduced the calculation formula of the wear amount, designed a series of tests to analyze the surface topography, studied the relationship between the mold stress and the wear amount, and predicted the service life.
According to the above analysis, many scholars have conducted extensive research and analysis on die wear, but there are few works on motor rotor blanking simulation. Therefore, this paper focuses on the rotor’s punching process, carries out numerical simulation with the aid of Deform-3D finite element software, analyzes the punch wear, and optimizes the cutting process parameters based on response surface test, thereby reducing the punch wear and providing a reference for the actual production adjustment process parameters.

2. Finite Element Simulation Analysis

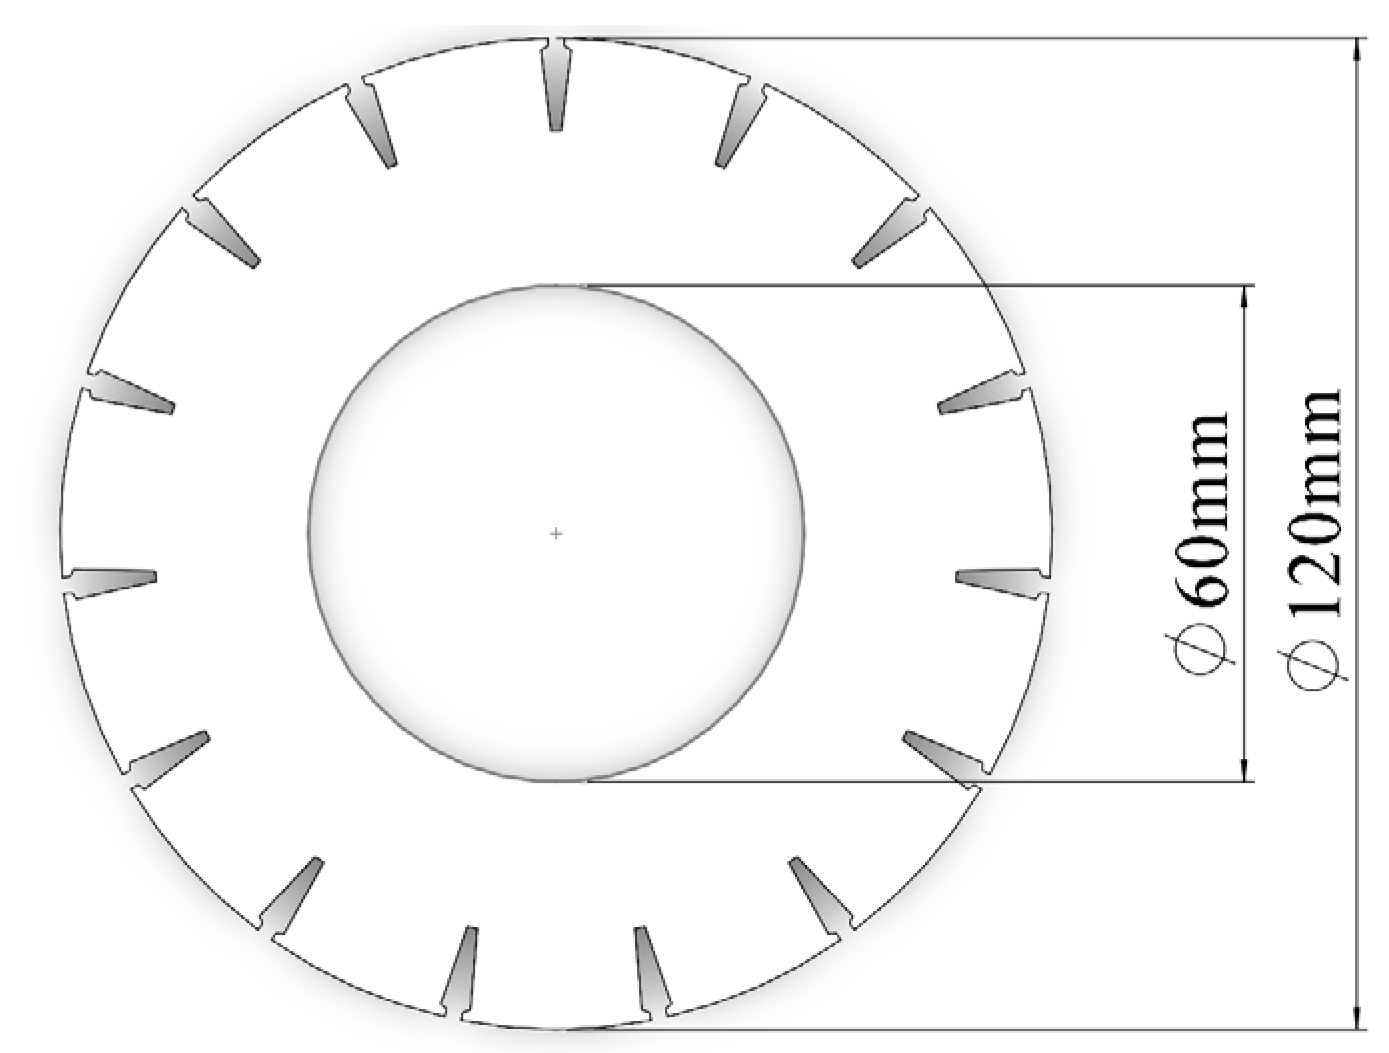
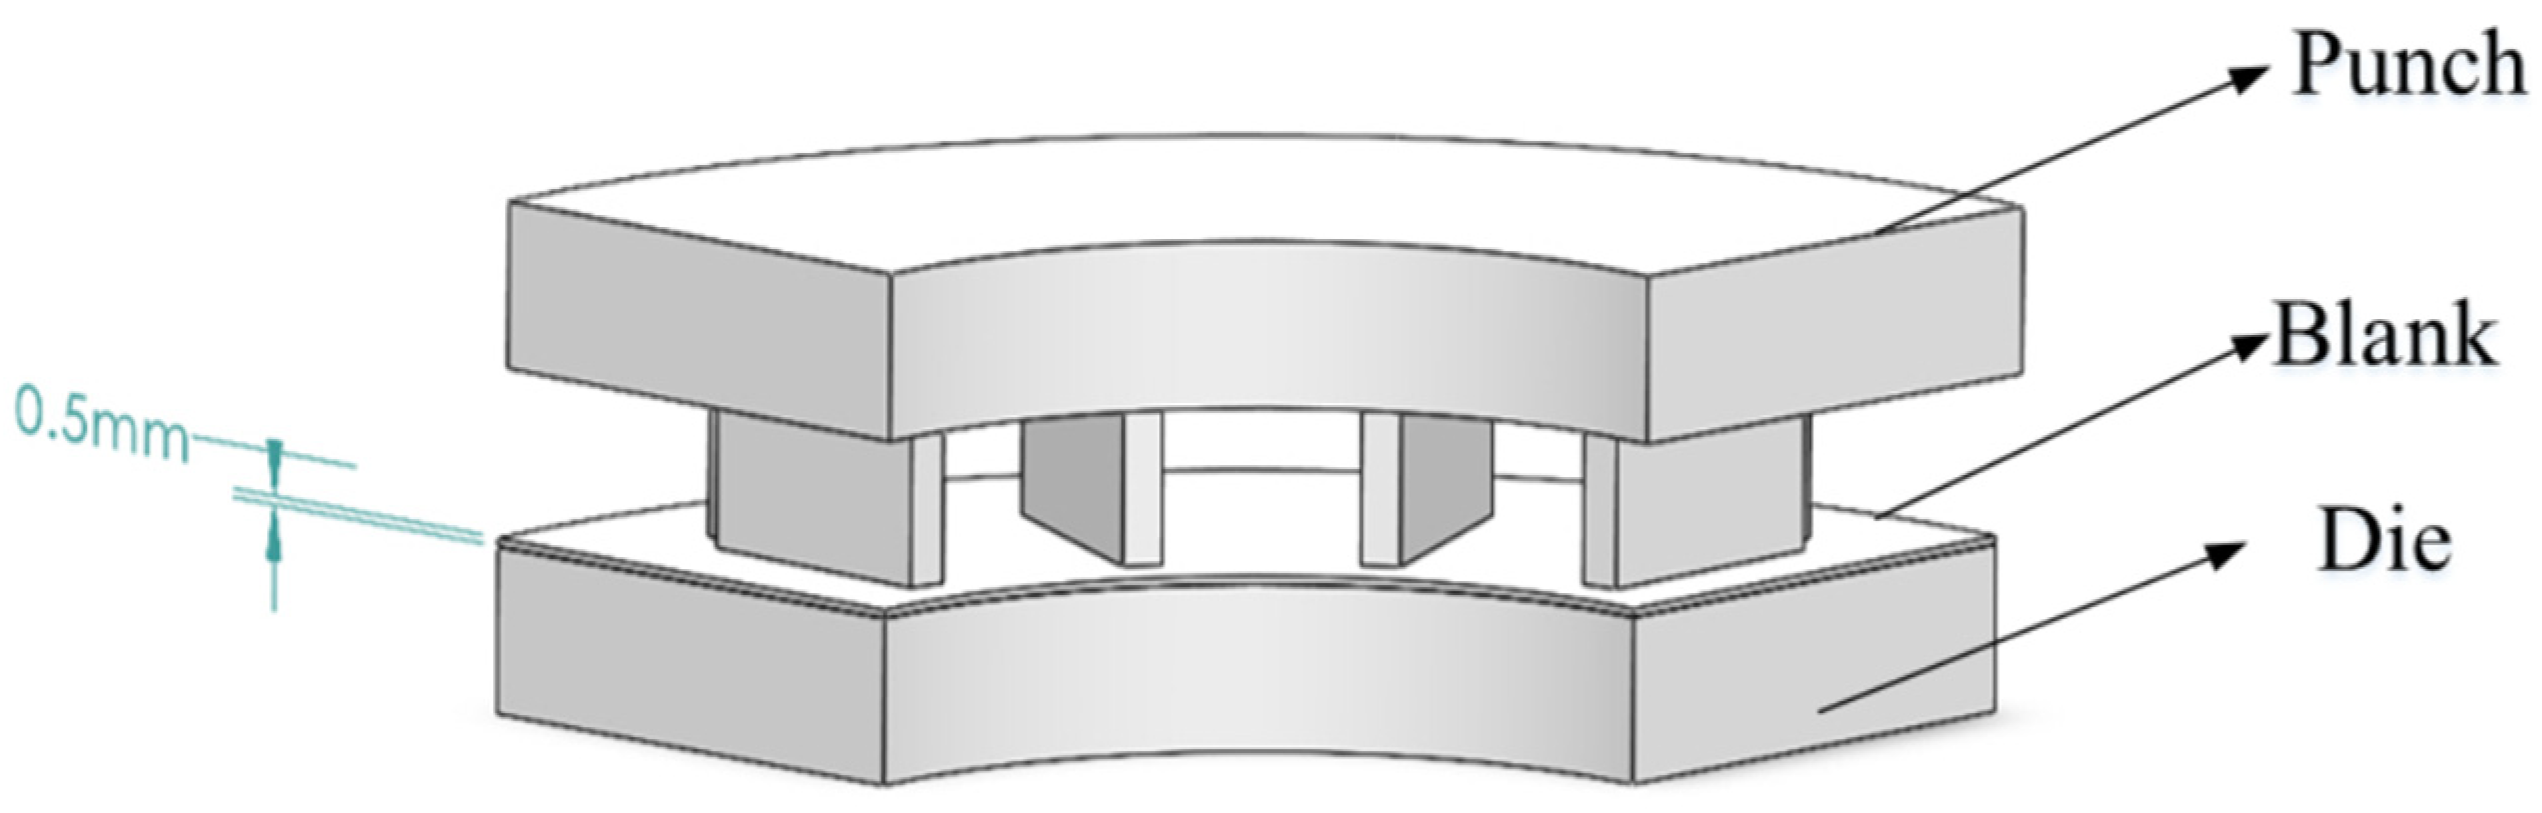
2.1. Model Establishment

The geometric model schematic of the motor rotor is shown in Figure 1. It is composed of a high silicon steel sheet with a size of 120 mm outside diameter, 60 mm inside diameter, and 0.5 mm thickness. The structural diagram of the stator groove is shown in Figure 2. The number of stator slots is 15. There are many factors affecting the rotor throughout the blanking process, and the punch not only wears but also generates a lot of cutting heat owing to friction on the surface, making it extremely difficult to conduct a full examination. Based on these facts, the workpiece and the upper and lower die geometry of punching are simplified and quarter-planed, as illustrated in Figure 3, while preserving the accuracy of the overall simulation results and allowing for fast simulation computation. The performance parameters of rotor Fe-6.5%Si2 material and upper punch AISI-D2 (Cr12MoV) material are shown in Table 1.

2.2. Constitutive Model Establishment
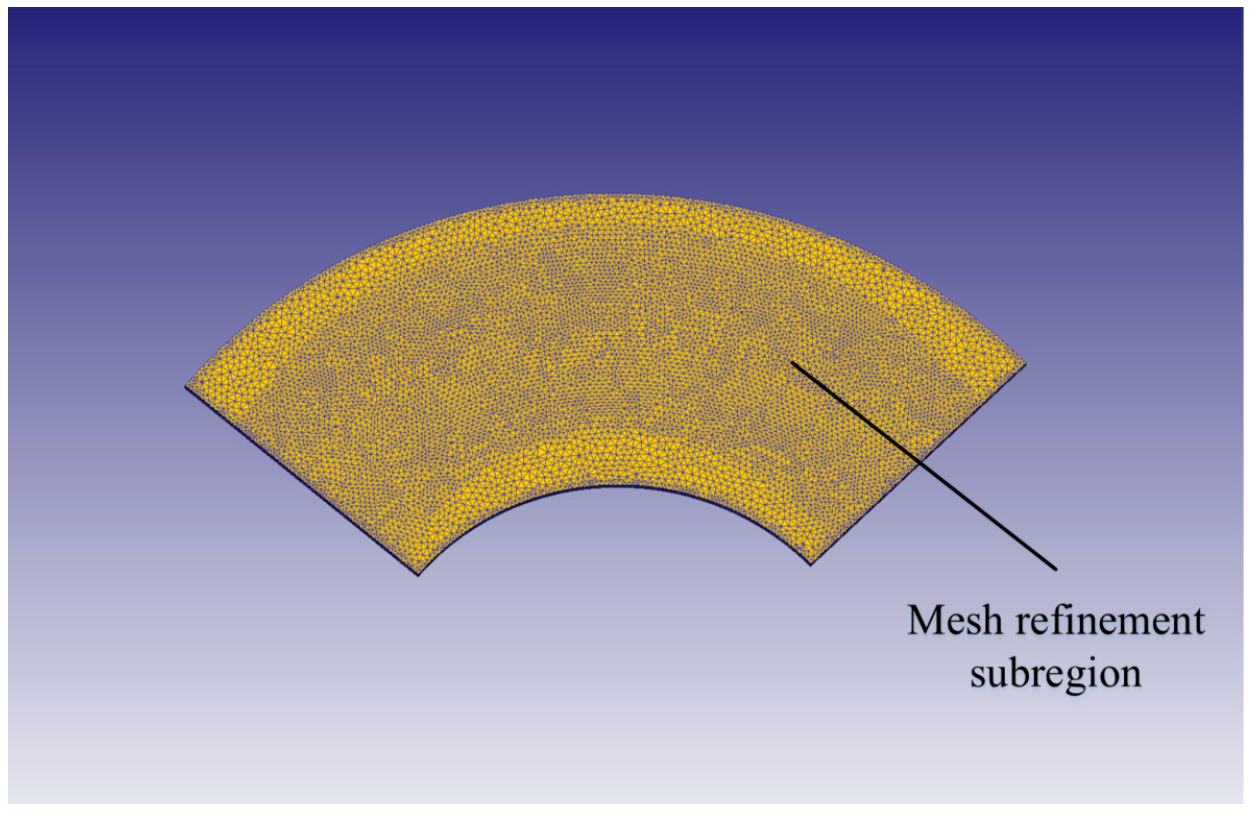
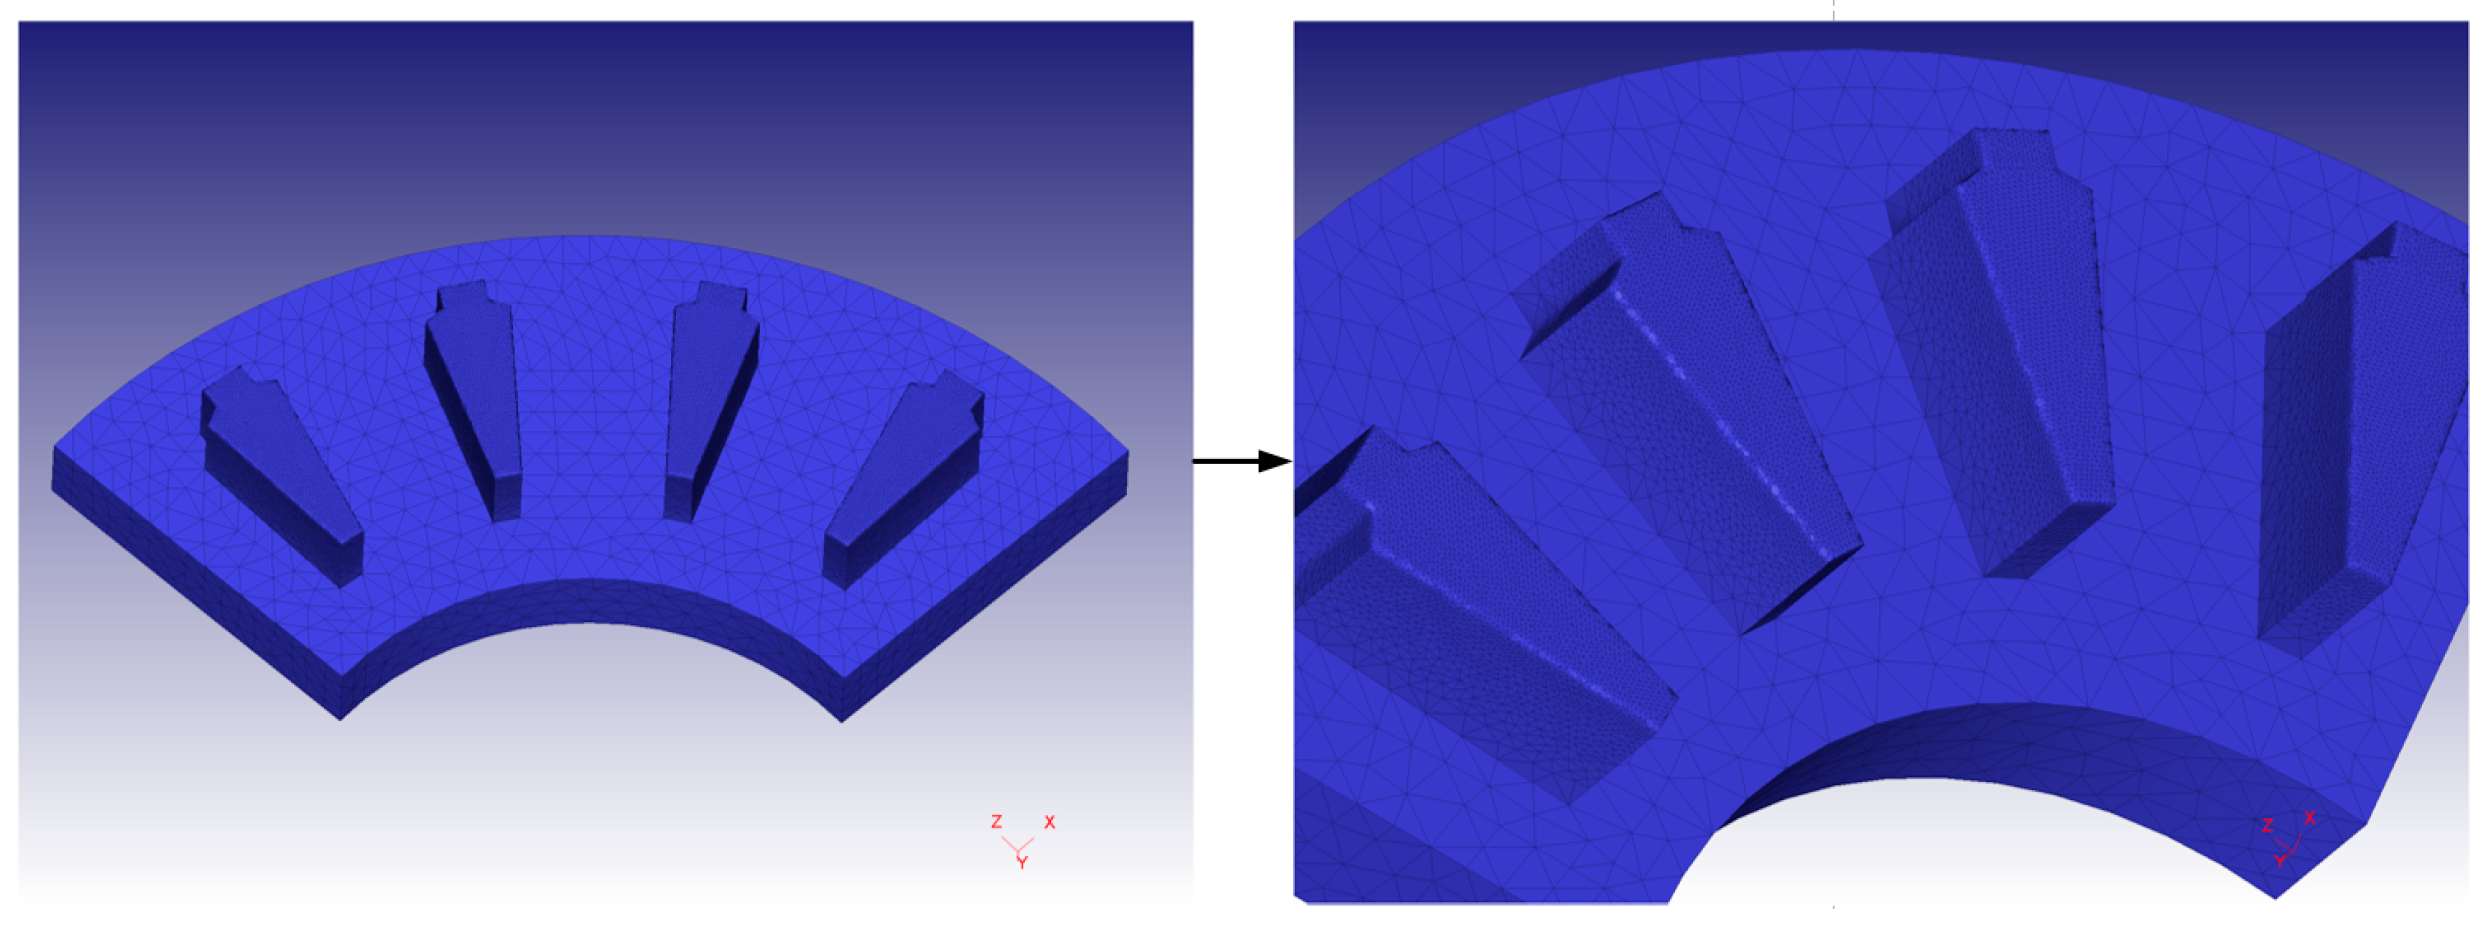
Elastoplastic deformation, damage, and fracture occur during the blanking process of metal materials, and the constitutive model of the material is the law describing the deformation behavior of the material in this process, and serves as the key to the blanking simulation model. Establishing a model capable of reflecting material properties at high strain rates is one of the critical prerequisites for ensuring the accuracy of simulation results. The constitutive equation of uniform plastic phase of Fe-6.5%Si2 steel is constructed by using the cold deformation strain accumulation model. The thermal activation process occurs during the plastic deformation of metal materials at high temperatures, and its thermal deformation behavior can be described by the hyperbolic sinusoidal Arrhenius relation proposed by Sellars and Tegart, which includes the activation energy Q of deformation and the deformation temperature T.
ε ˙ = A s i n h α σ e x p Q / R T n
where A is the structural factor, s 1 ;   α is the stress level parameter, M p a 1 ; n is the stress index; Q is the deformation activation energy, J / m o l ; R is the gas constant, J / m o l · K ; T is the deformation temperature, K. The stress-strain curve is shown in Figure 4, and the values of the Fe-6.5%Si2 material model are shown in Table 2 [18,19,20].

2.3. Grid Division

This paper aims to optimize the wear of the upper punch during the blanking process of the motor rotor. The billet is set to plastic, while the upper punch and the lower die are set to rigid body. As a result, the plate and punch must be meshed during pre-treatment. The workpiece is divided into 100,000 tetrahedral meshes, and the mesh operation is further refined in the blanking area, the ratio is set to 0.01, the punch is divided into 200,000 tetrahedra, and the contact part between the cutting edge and the plate is finely meshed, while the lower die is no longer meshed. The grid division is shown in Figure 5 and Figure 6.

3. Mold Wear Analysis

3.1. Archard Model Theory

In die production, die parts will fail due to a variety of faults or structural defects, among which the qualified parts that cannot be formed due to excessive wear of die parts, which is called die wear failure. As a result, studying the die’s wear process can help increase its service life. The research of die wear mechanism is mainly conducted to observe and compare the wear of various structures of die parts, and to assess the cause of wear through analysis. With the increase of stamping times, the surface accuracy and size of the die parts vary, influencing the forming effect of the parts and making it impossible to create certified parts. Archard theory is a commonly used concept for calculating friction and wear. In this theory, the hardness and wear coefficient of the material are fixed. In the actual hot die forging process, the hardness and wear coefficient of the die material do not remain constant but change with the temperature [21]. According to the theoretical analysis, the wear degree of the die is mainly determined by the normal phase load imposed by the die on the plate, the friction coefficient of the contact surface, and the material properties of the plate. The calculation formula is as follows.
W = K P a V b H c d t
The wear calculation formula is the calculation method used in the finite element software simulation calculation, where, a, b, and c are constant in the process of plastic deformation (a = 1, b = 1, c = 2; a, b, and c are constants); H is the hardness of sheet metal; and the value of K is 0.2 × 10⁻⁷. The fracture criterion is chosen because the silicon steel sheet will experience significant plastic deformation before cracking occurs during the blanking process. The fracture criterion is the key factor to determine whether the simulation can truly reflect the actual blanking situation. In this paper, the Normalized C&L fracture criterion, a stable indicator of metal fracture, is selected. After examining relevant literature, the fracture threshold and the number of fracture units are both set to 2 [22], as shown in Formula (3).
C * = 0 ε ¯ f σ * σ ¯ d ε ¯ = 2
where, C * is the critical damage value of the material, σ ¯ is equivalent stress and σ * is the maximum principal stress, ε ¯ is equivalent strain, d ε ¯ is equivalent strain increment. C * is constant, when ε ¯ f  =  C * , it is considered that the material has broken.

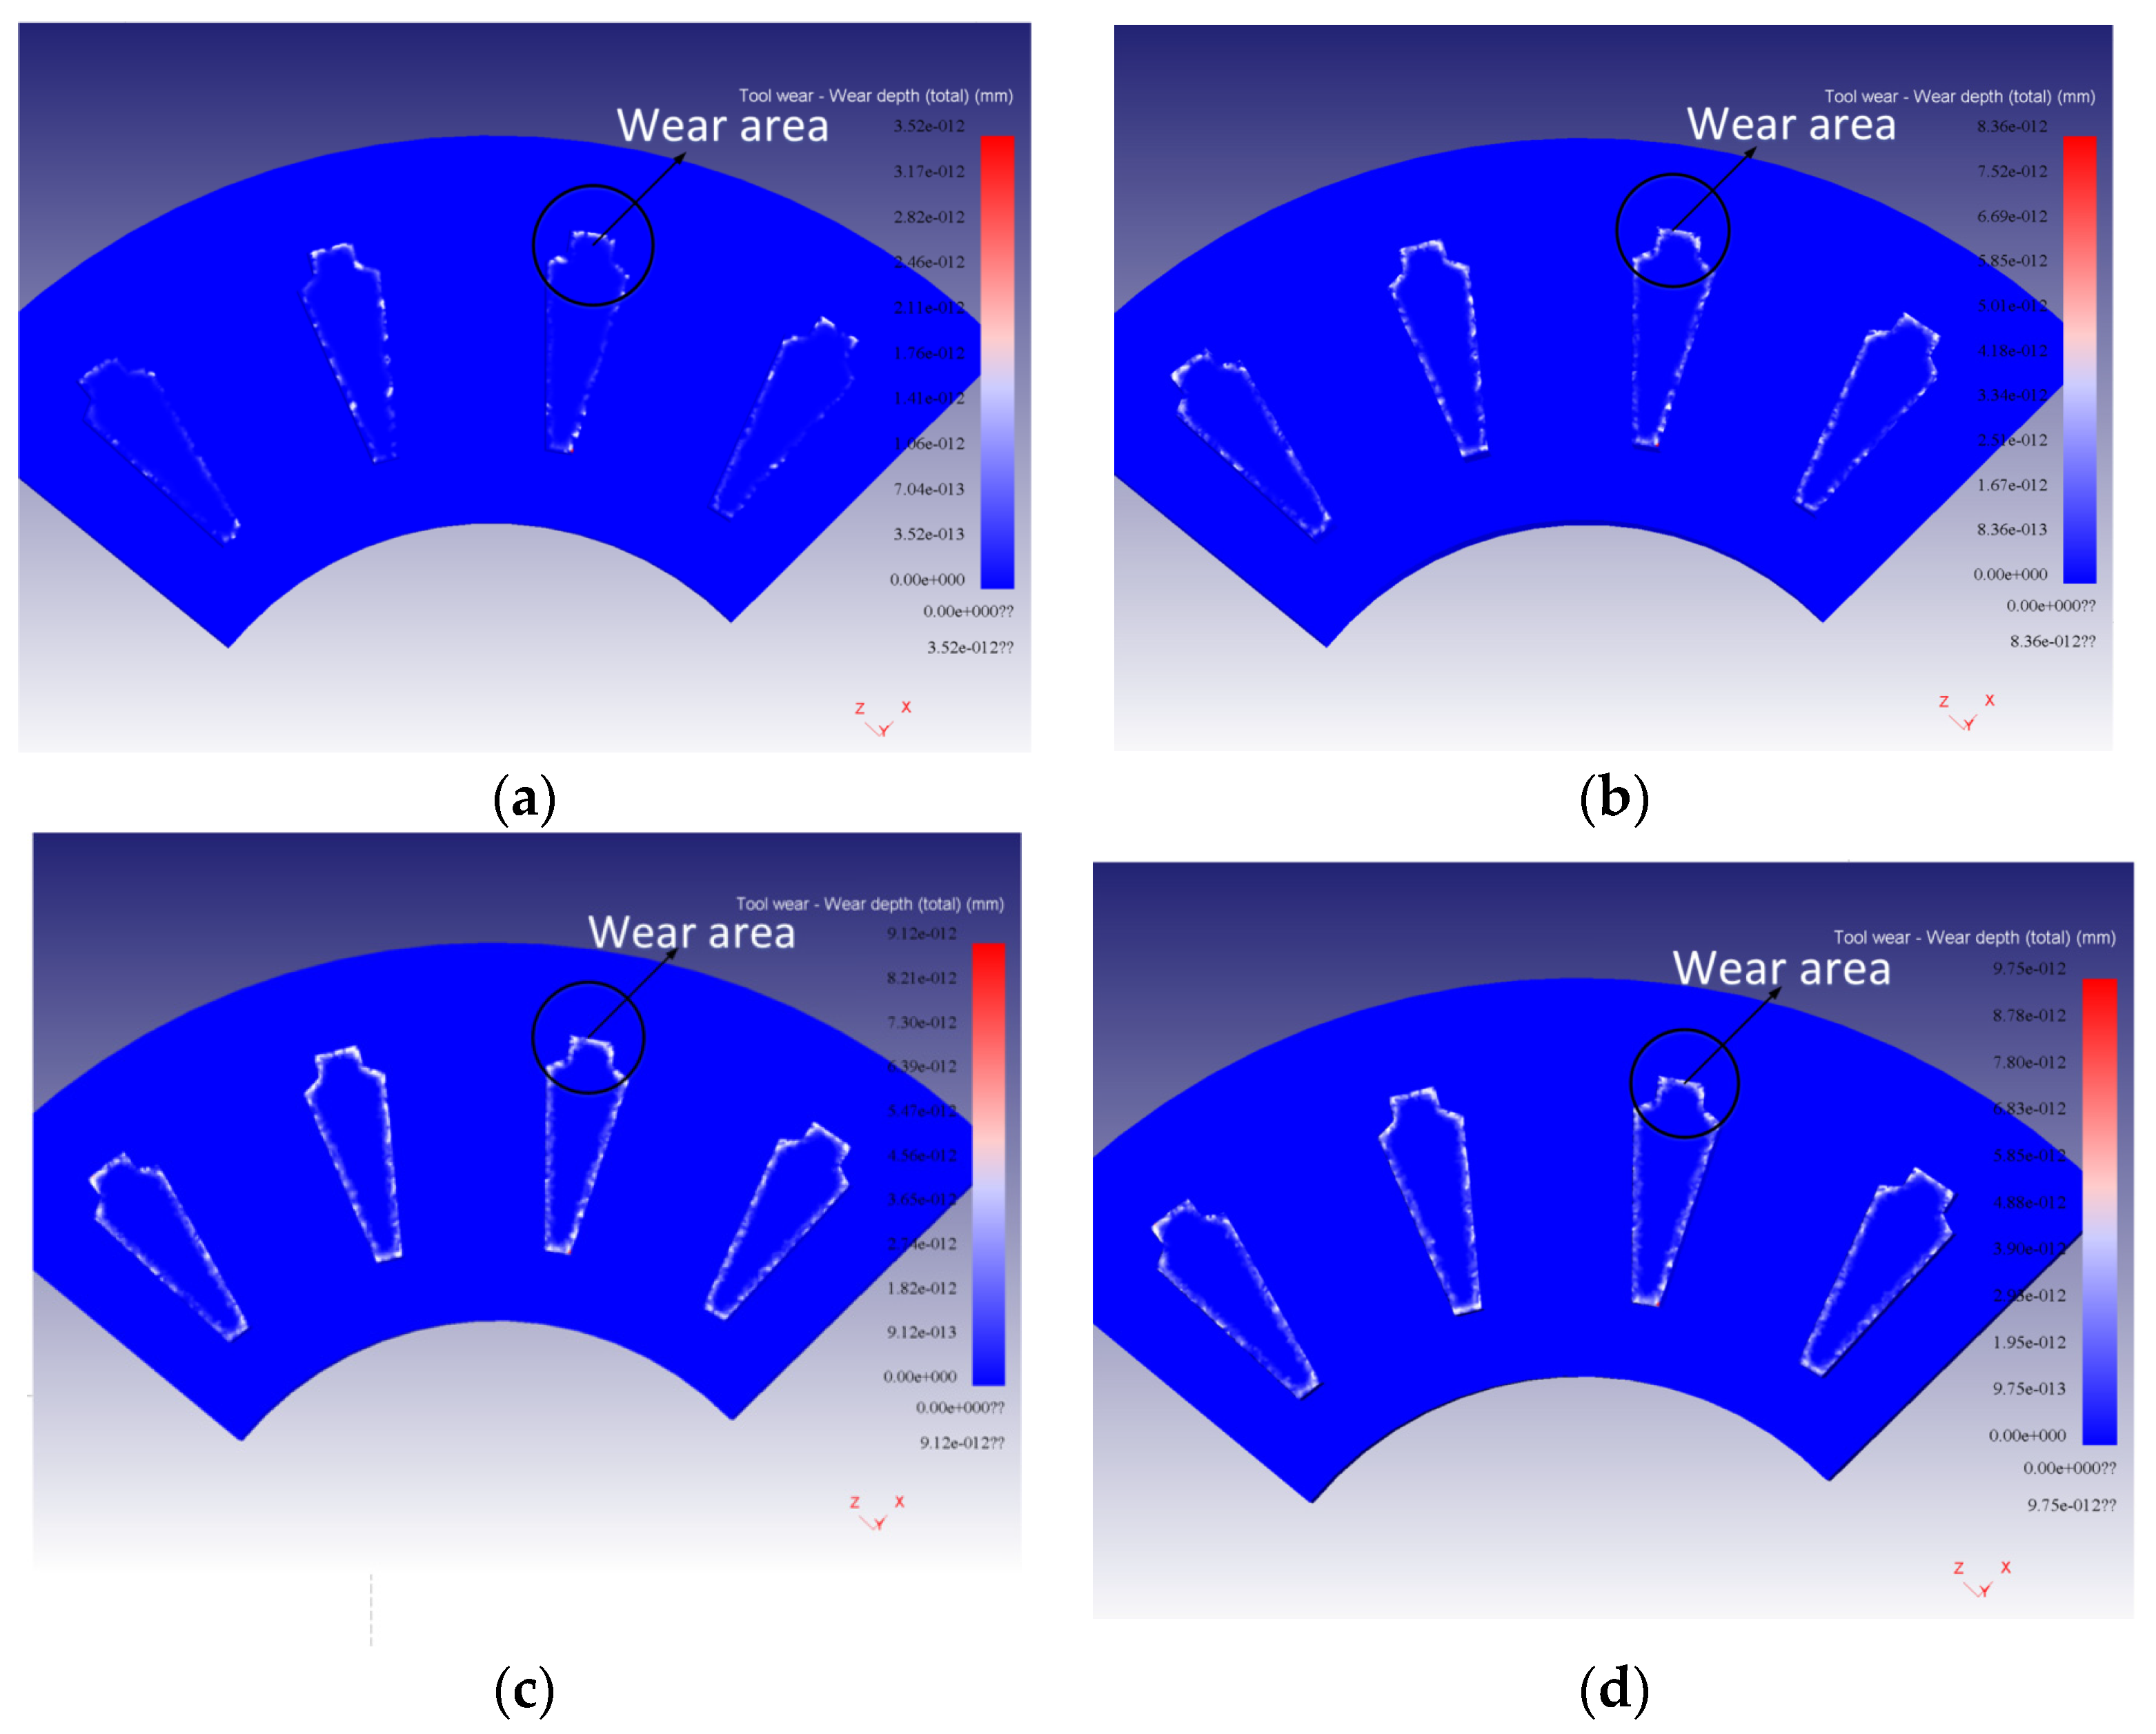
3.2. Punch Wear Change Process

In this simulation process, multiple groups of parameters are selected for simulation. In this paper, a set of parameter combinations with punch speed of 75 mm/s, punch clearance of 0.0425 mm, and cutting-edge fillet of 0.085 mm are selected to analyze punch wear in the rotor punching process. The specific change process of punch wear depth value is shown in Figure 7.
Using the Deform-3D software post-processing tool, it is possible to determine the wear of the punch, as illustrated in the figure above. The rotor’s punching and forming process is accomplished in a very short time. The punch cutting edge has the highest wear rate, with a depth of 9.75 × 10⁻¹² mm. The main reasons are as follows: During the initial stage of rotor blanking, the plate undergoes elastic change, causing friction and wear between the punch section and the plate. As the punch moves down, the sheet material undergoes plastic deformation, and the punch’s cutting-edge region gradually cuts into it. At this point, the friction between the cutting-edge area and the sheet material is enhanced, resulting in the highest stress and strain at the cutting edge, as well as the most severe wear.

4. Blanking Punch Wear Optimization Based on Response Surface Method

Using the traditional expertise or trial and error method to identify the optimal combination of rotor blanking process parameters is expensive and inefficient. Response surface experiment is a statistical method used to deal with the influence of multiple variables on a system or structure. By establishing the functional relationship between variables and response, the optimal process parameters are sought to solve the multi-variable problem. The core of response surface experiment is to use reasonable experiment design method, obtain data through experiments, and then use a multiple quadratic regression equation to fit the functional relationship between factors and response values. This approach, known as response surface analysis, aims to solve complex problems involving multiple variables by analyzing regression equations to find optimal process parameters. In the study of optimization of process parameters by response surface method, the mathematical relationship between response variable and independent variable is typically uncertain. If the relationship between the independent variable and the response variable can be modelled by a linear function, the basic mathematical model is as follows [23].
y x = f x 1 , x 2 , , x k + ε
where: y x —response variable function; x1, x2, … xk—argument; f—fitting function; ε —system random error. Thus, the response surface model of quadratic unbiased estimation can be expressed as [24].
y = β 0 + i = 1 k β i x i + i = 1 k β i i x i 2 + i = 1 k 1 j = 2 k β i j x i x j
where: β0—constant; βi—linear coefficient; βii—coefficient of the square term; βij—coefficient of the interaction term; xi and xj—arguments.

4.1. Response Surface Experiment Design

The wear of the punching die is affected by several punching process parameters, such as punch clearance, punch speed, etc. In the punching process, the punch clearance, punch speed, and cutting-edge fillet are taken as influencing factors. The premise of response surface test design is to determine a reasonable variable and the corresponding value range in advance. In this paper, three factors influence rotor blanking, namely, blanking speed v (50–100 mm/s), blanking clearance t (0.035–0.05 mm), and die cutting edge fillet r (0.07–0.10 mm). Therefore, the BBD (Box–Behnken) experimental design method [25] is utilized to carry out the experimental design of rotor blanking forming process parameters, and the second-order response surface model is established with the fewest number of tests. The selection range of design variables is shown in the chart. The experimental design of rotor blanking is carried out using Design-Expert software, and finite element numerical simulation with various blanking parameter combinations is performed using Deform-3D software. The results are presented in Table 3.

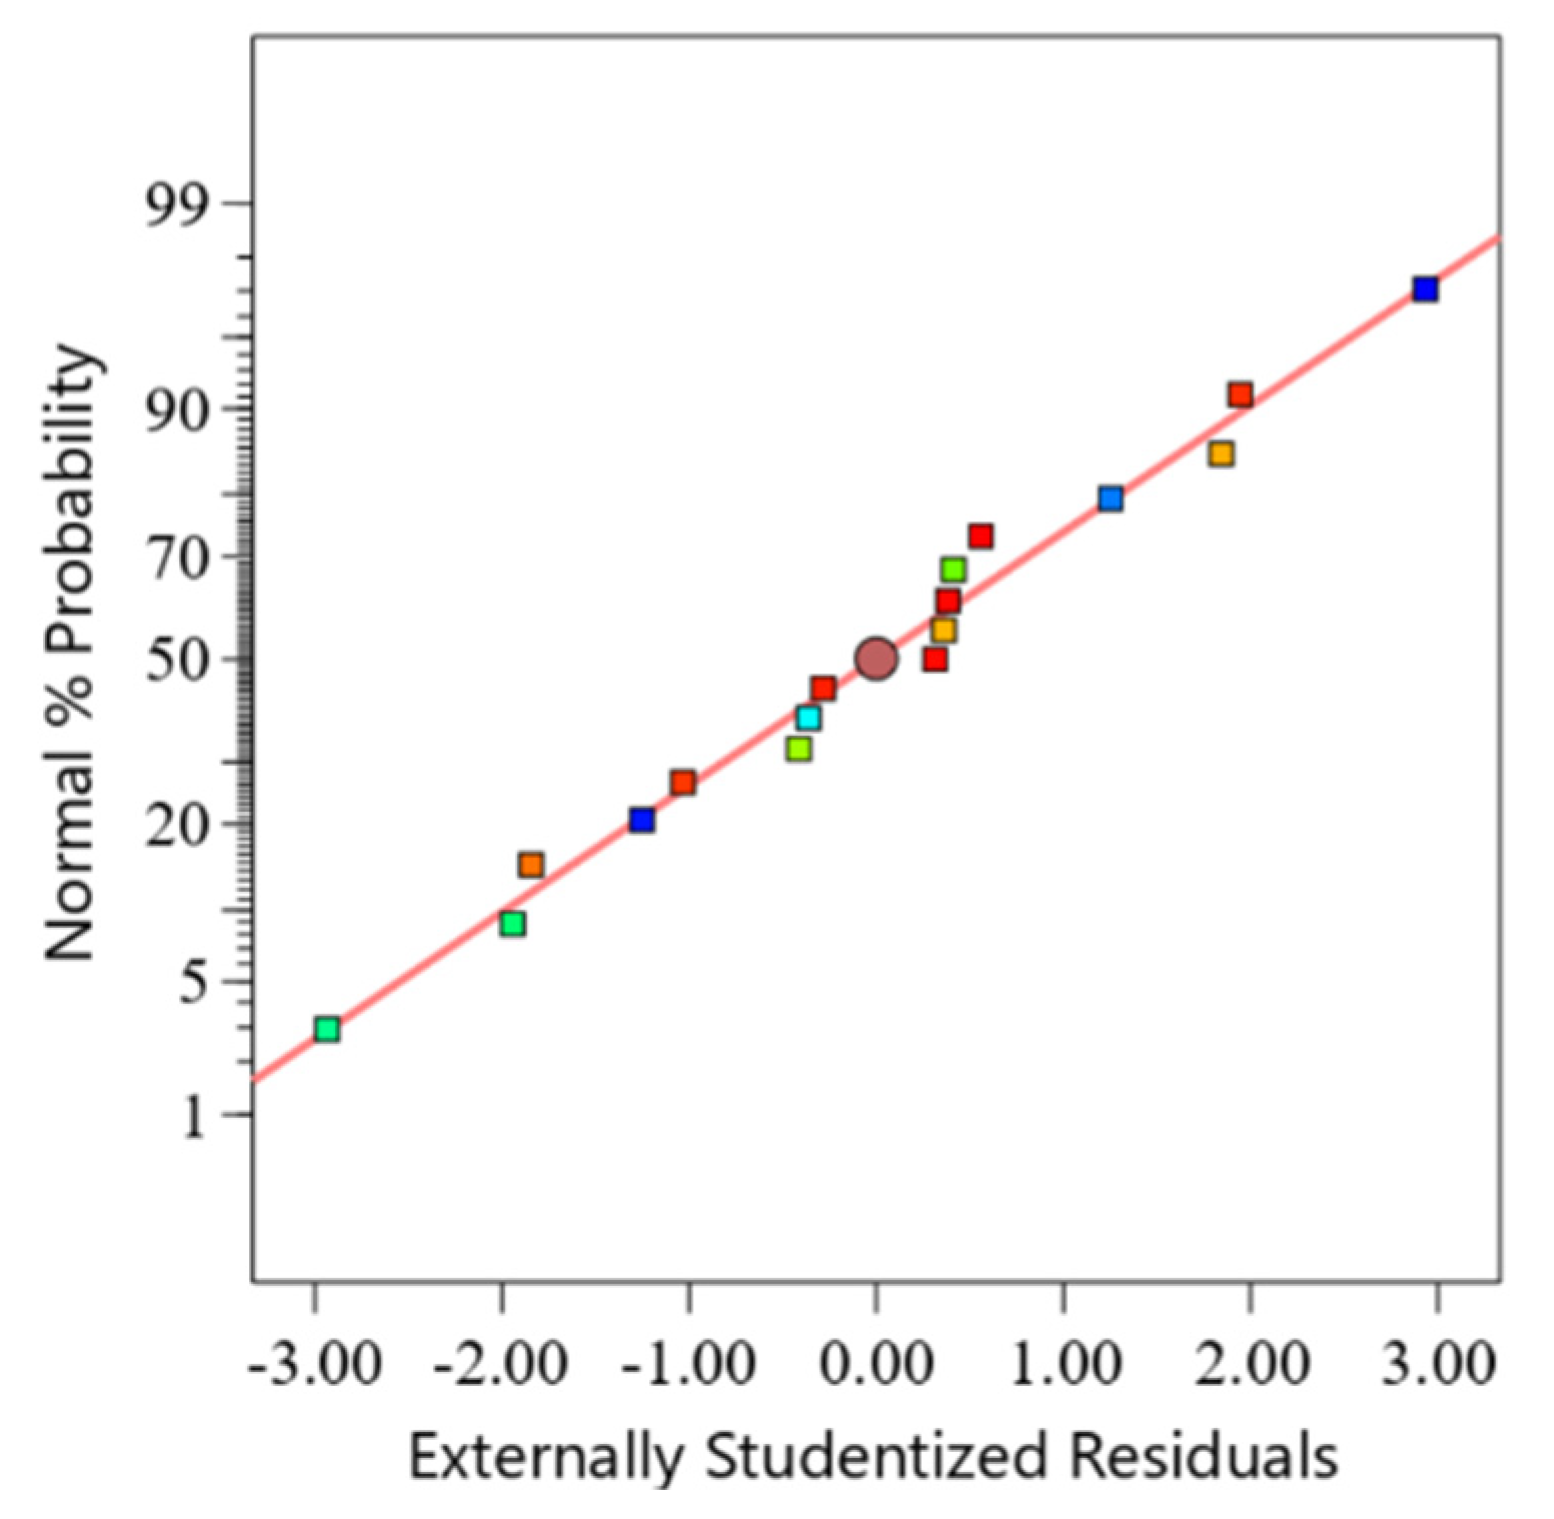
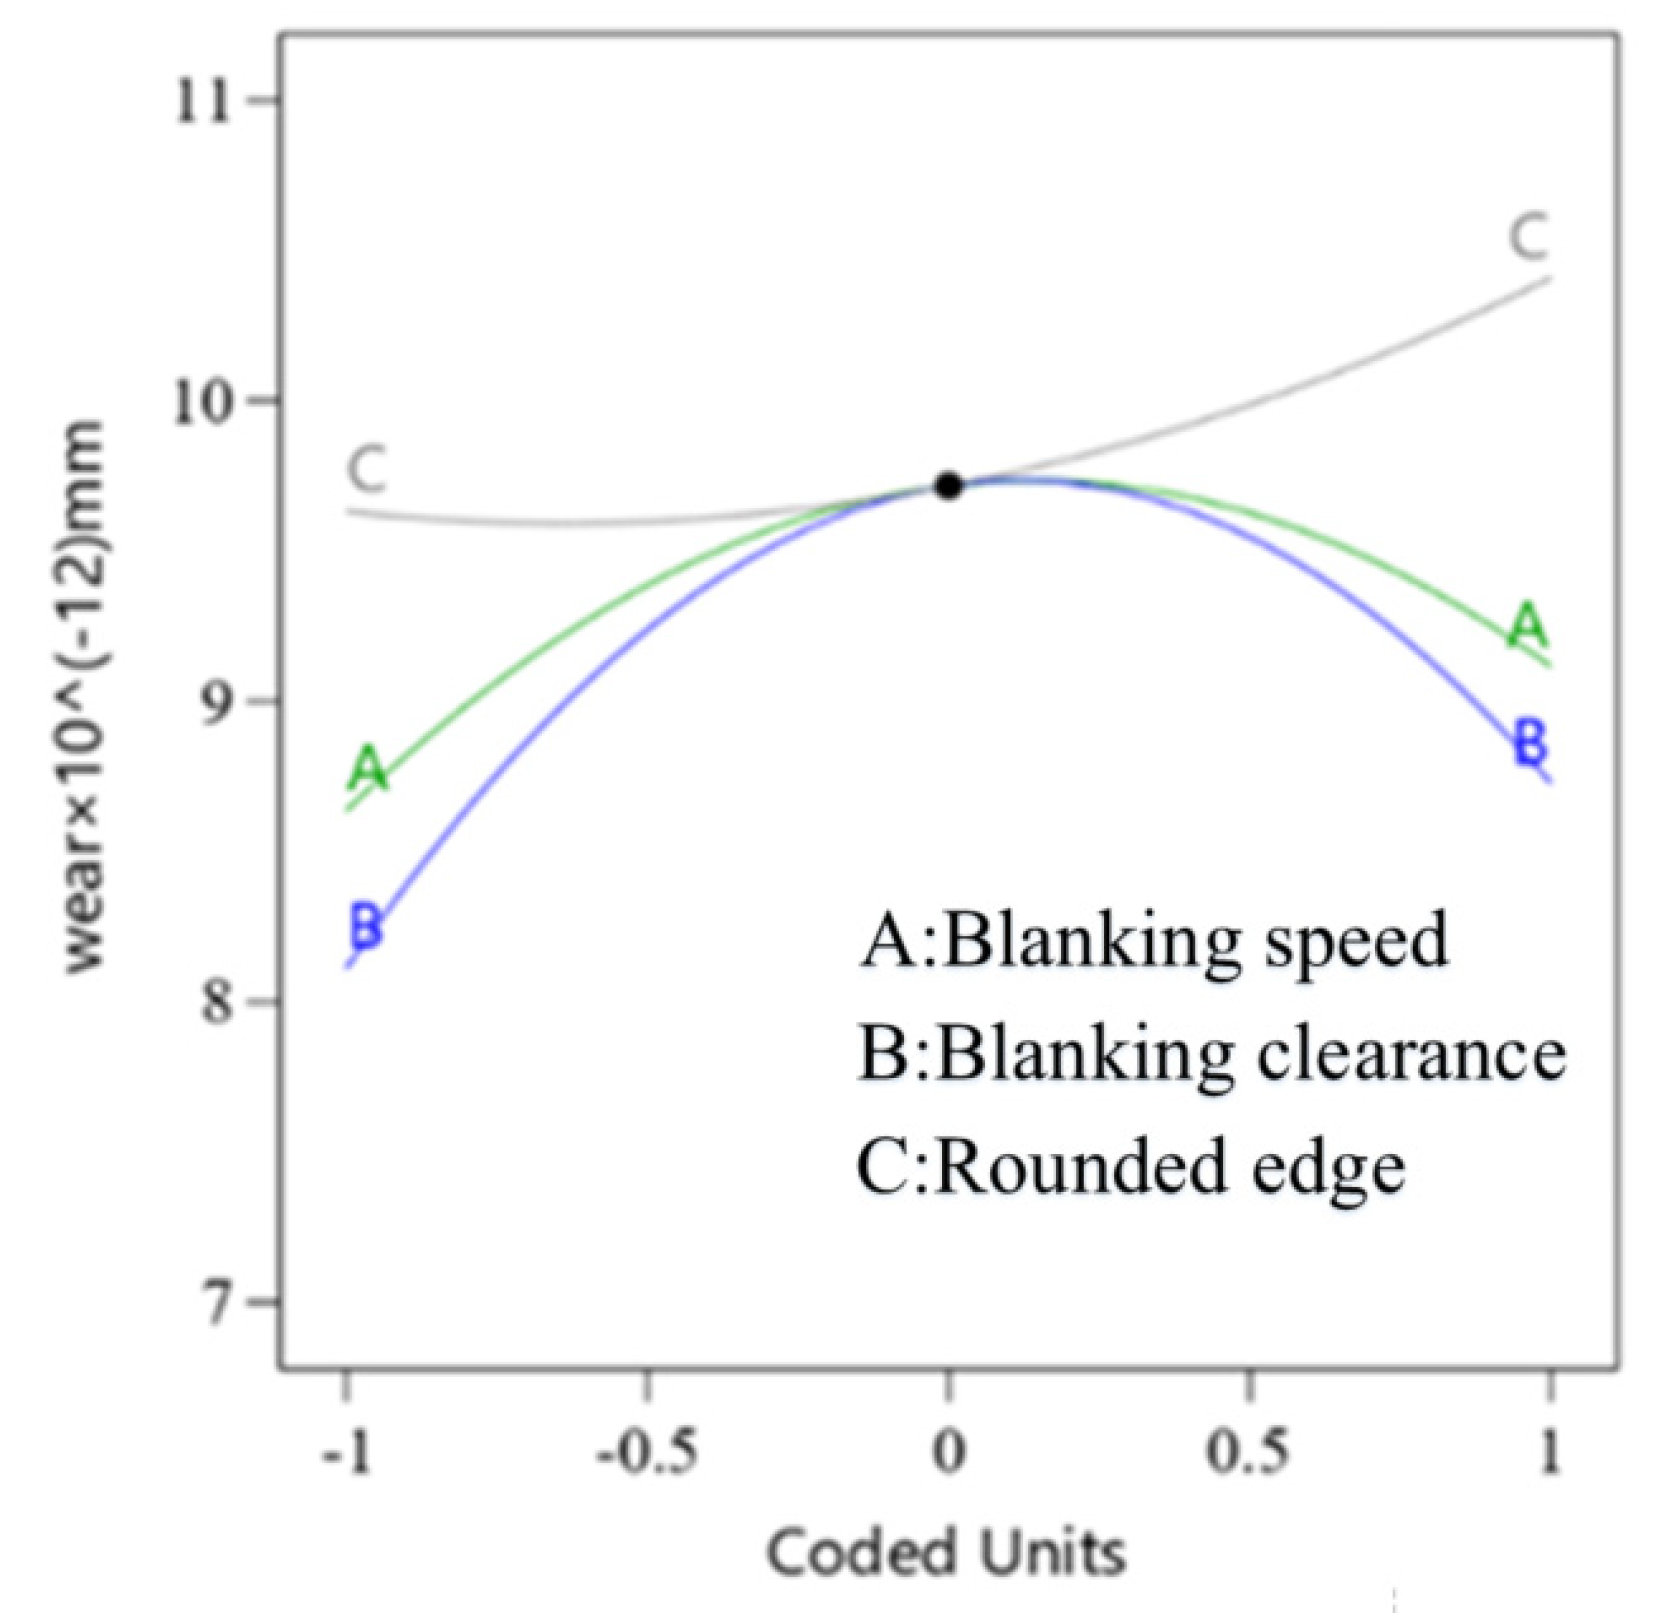
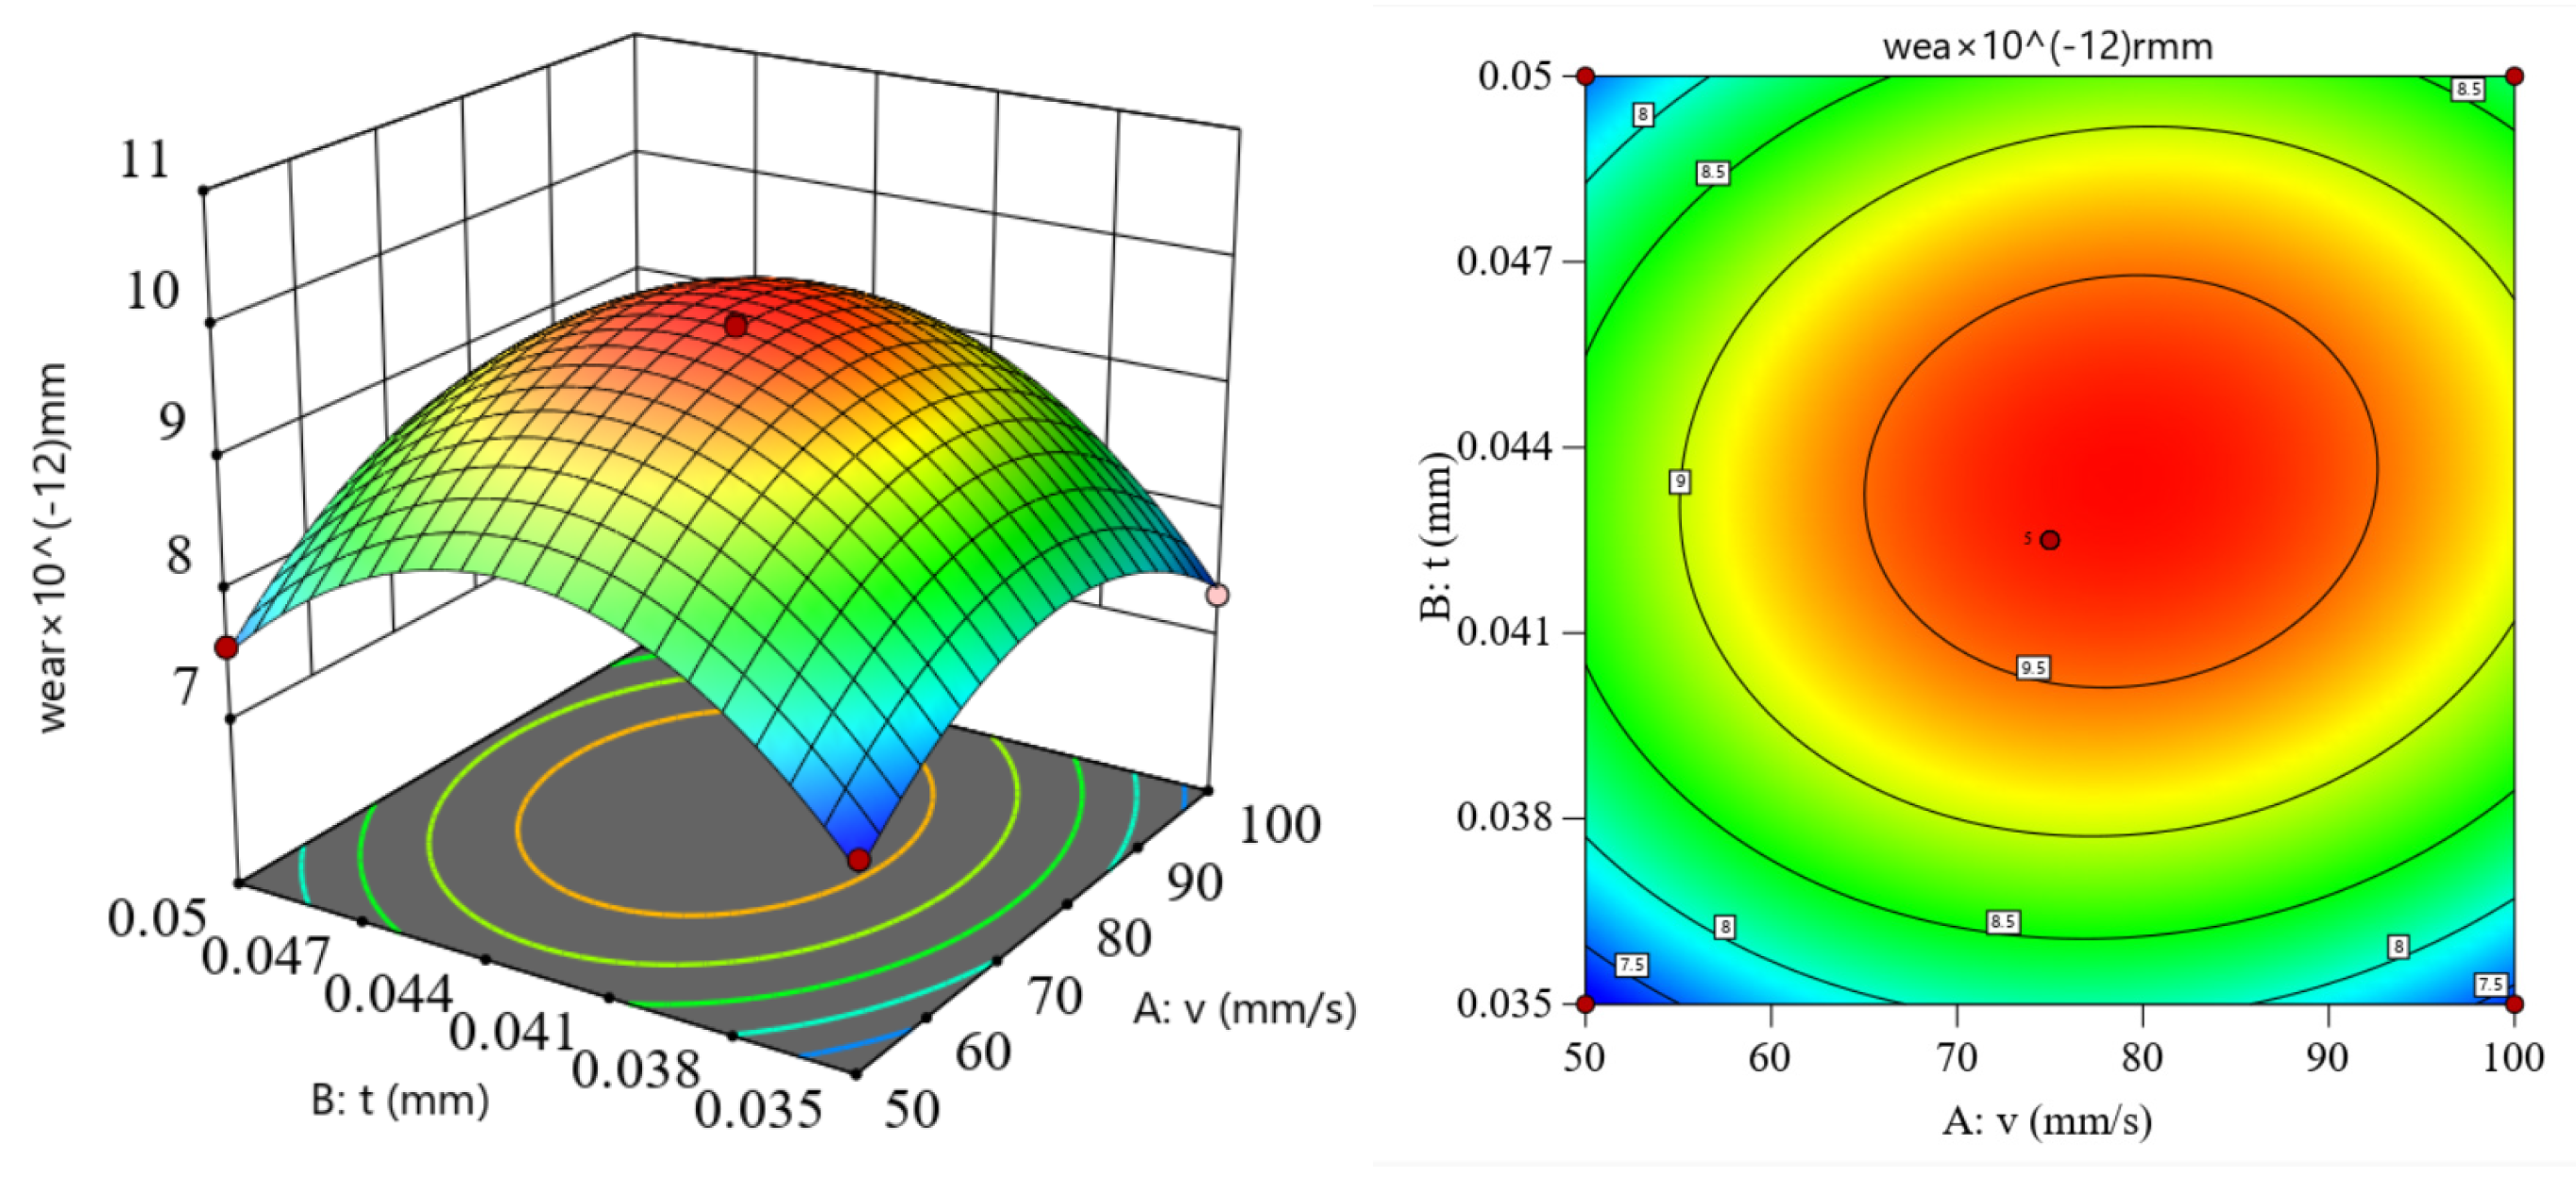
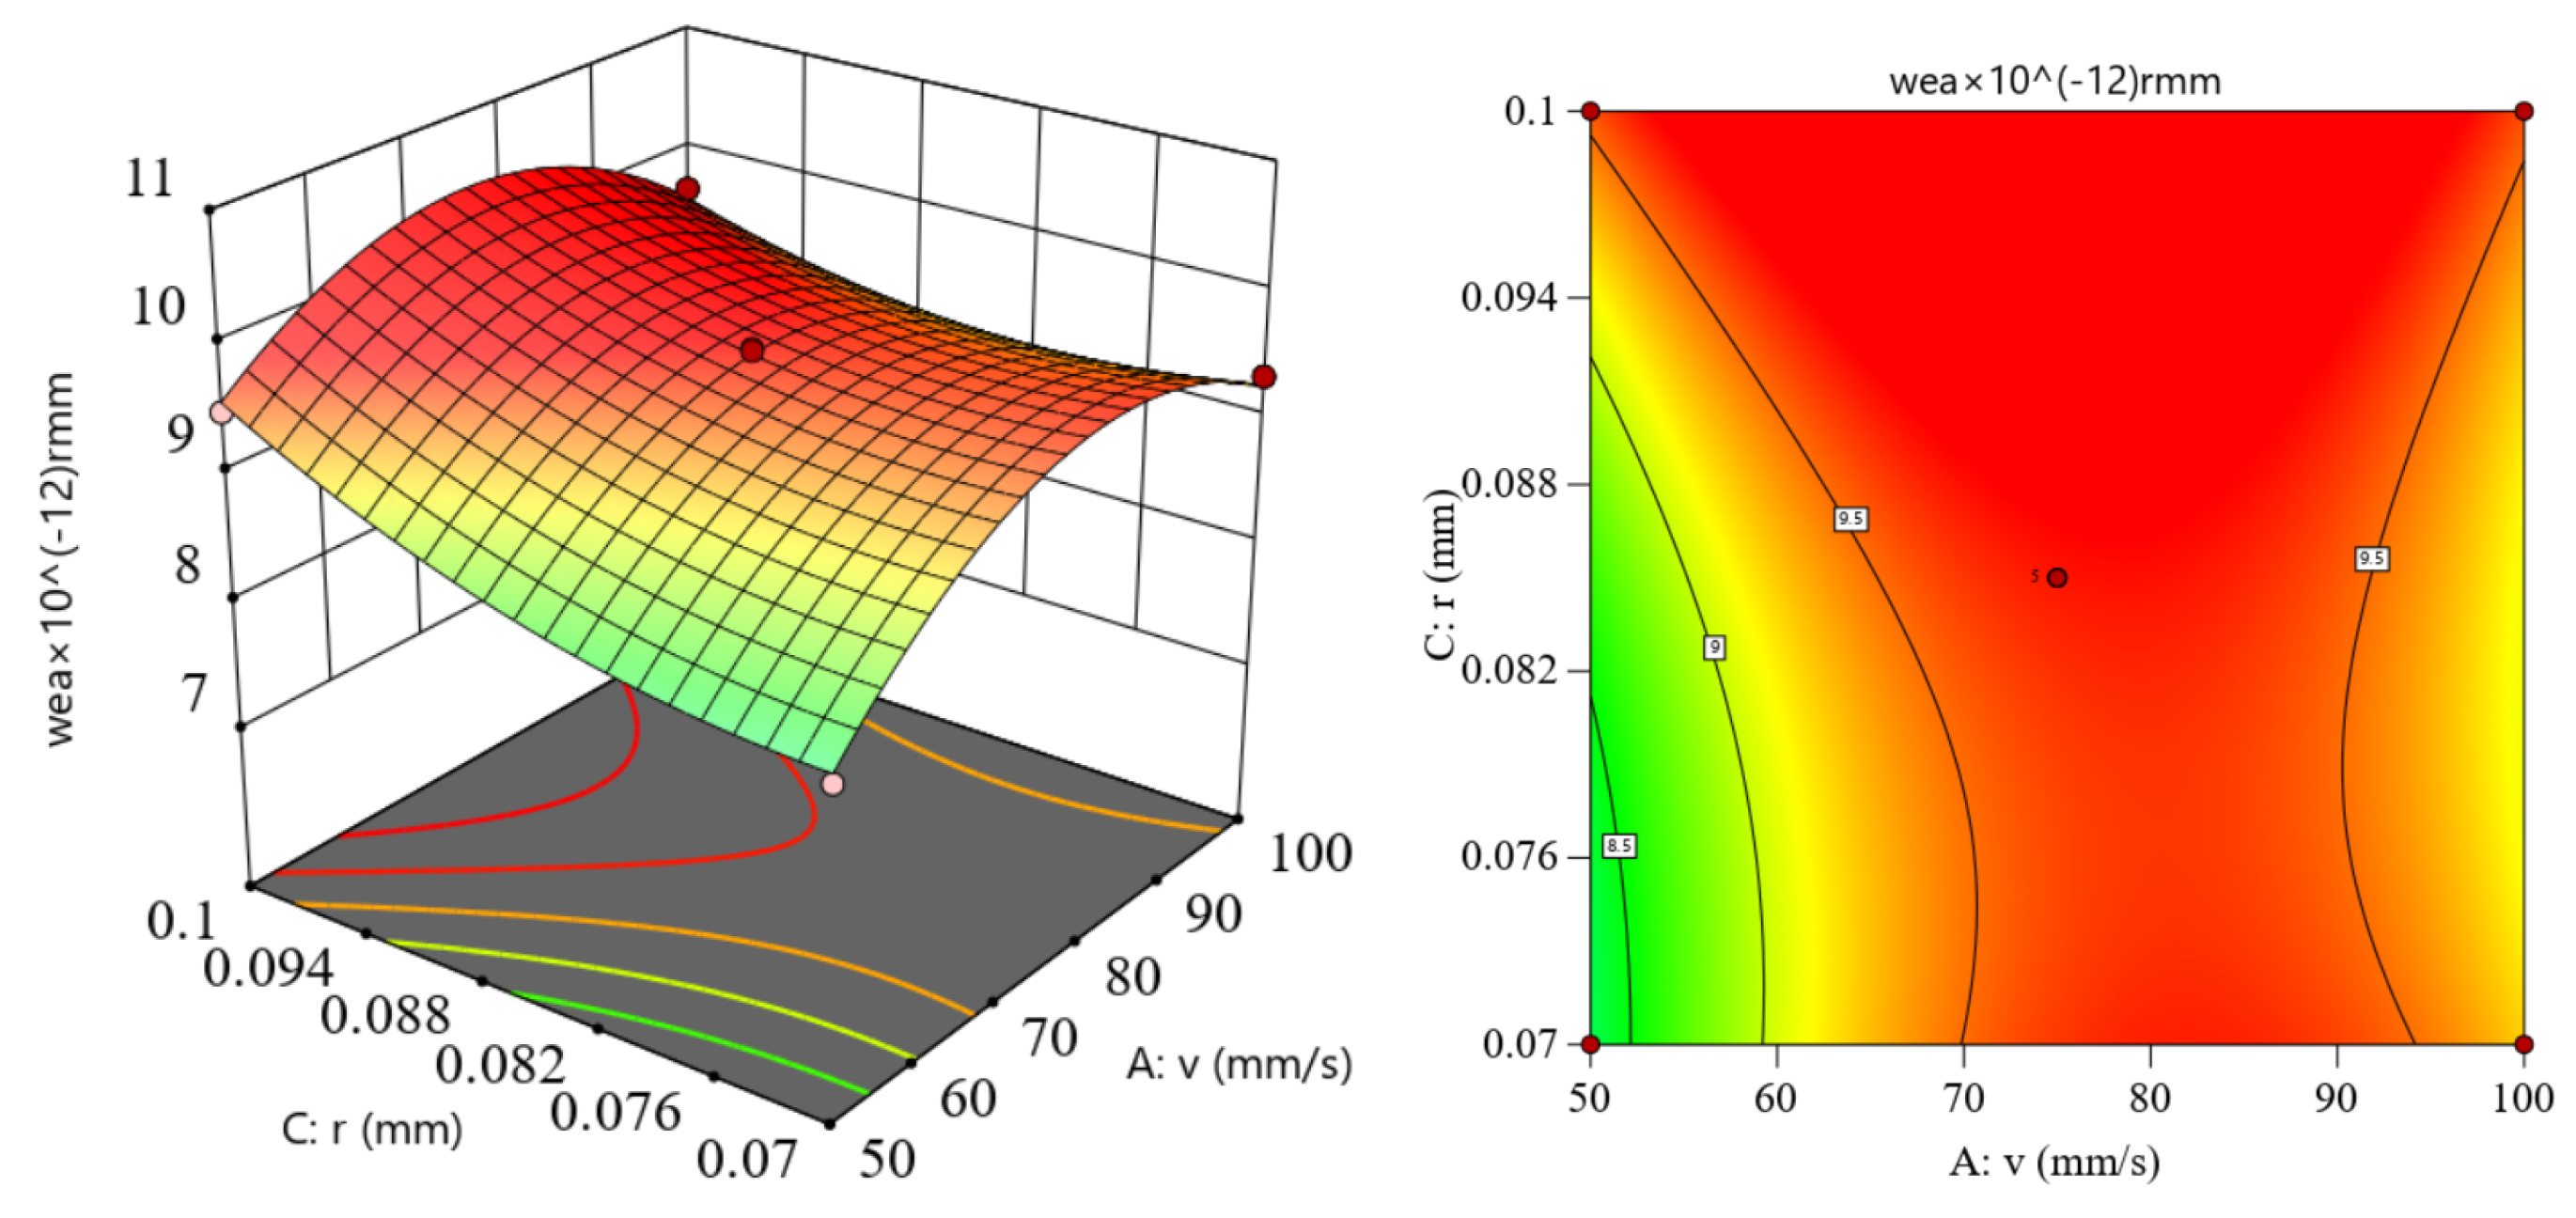
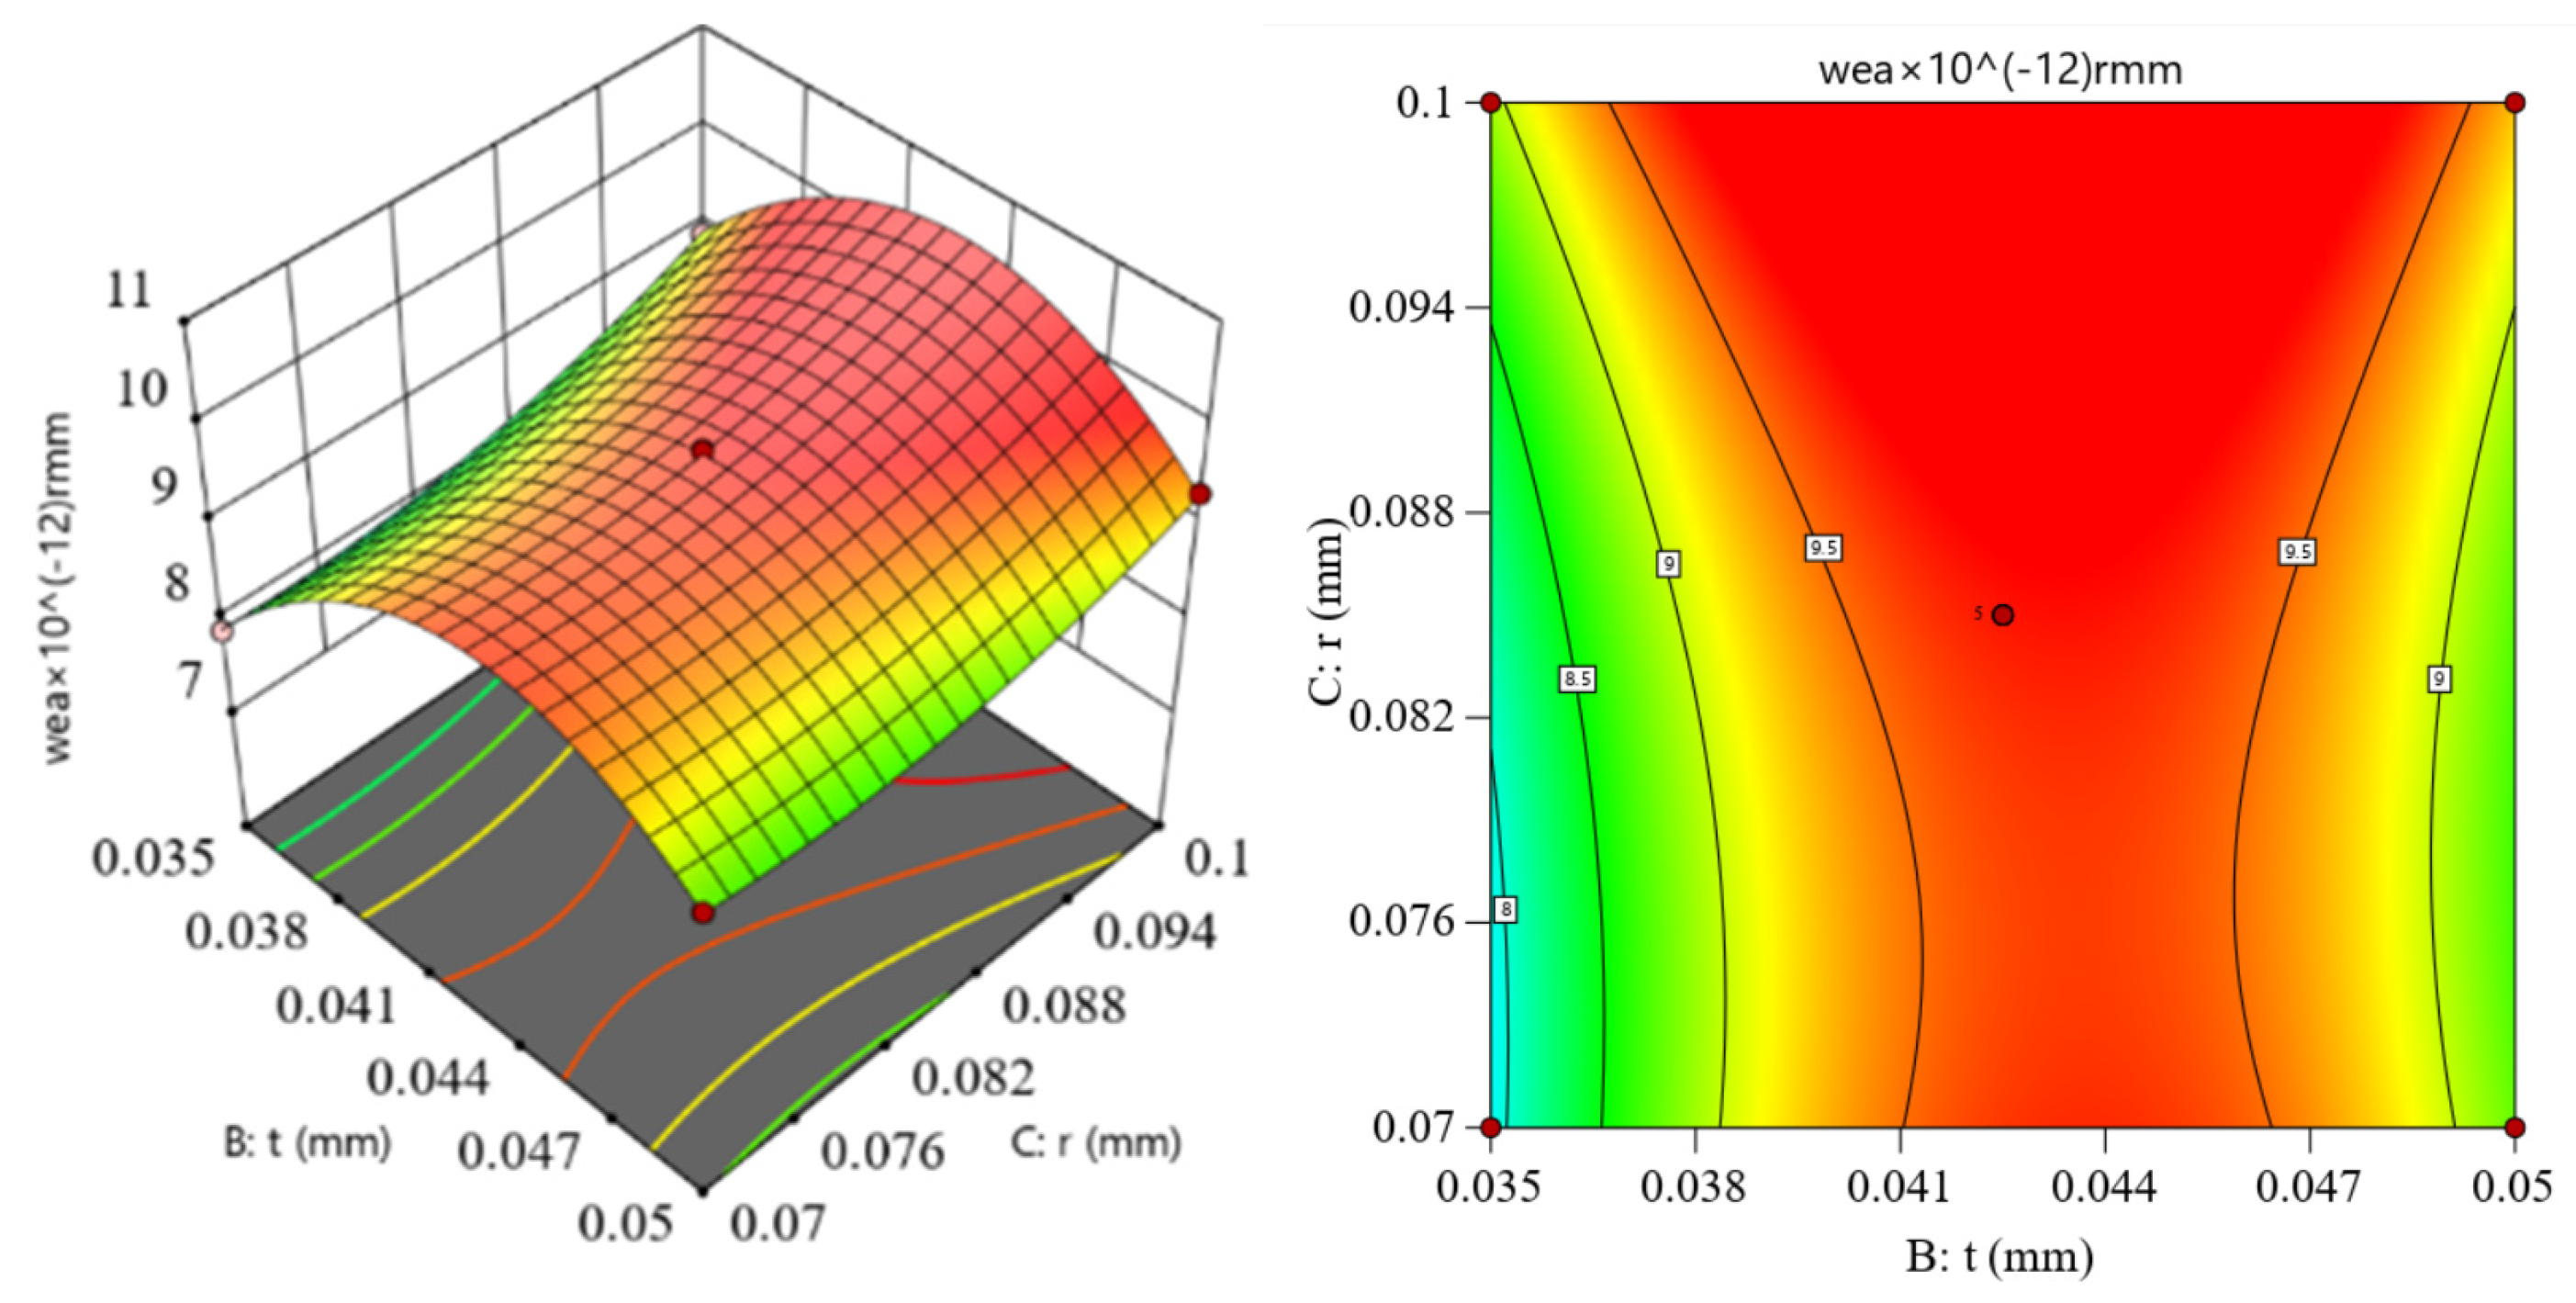
4.2. Analysis of Response Surface Test Design Results

Based on the simulation results in Table 4, the least square method is used to construct the function between the test variable and the test index. The approximate model equation for the wear response surface, namely, the quadratic polynomial between the wear of the rotor punching punch and the process parameters, is as follows.
Wear = 9.72 + 0.3396A + 0.4079B + 0.3888C − 0.0613AB − 0.2320AC − 0.1210BC
− 0.9397A2 − 1.40B2 + 0.4040C2                
Based on the results of ANOVA (analysis of variance), as shown in Table 5, the F value of the response surface model is 185.77, and the corresponding P value is lower than 0.0001 (far less than 0.05, the significant level α = 0.05), indicating that the model is significant. The loss of fit is 0.0720 (not significant), indicating that the model data are satisfactory. The multiple fitting model coefficient R-Squared is 0.9956, the modified fitting coefficient Adj R-Squared is 0.9899, and the prediction fitting coefficient Pred R-Squared is 0.9421. All these values are close to 1, indicating that the established response surface model is well fitted. Figure 8 depicts the normal distribution law of residual error, which should follow a straight line. The more concentrated on a particular line, the better. Figure 9 shows the relationship between the test value and the predicted one, and the closer the point is to the straight line, the better. It shows that the response surface model has high accuracy and can accurately predict the wear amount of punch in punching process.
The influence trend of various factors on punch wear is shown in Figure 10. Punch wear tends to increase with the increase of punch edge fillet C. The increase of the cutting edge fillet value increases the contact area with the material, which will lead to more friction and heat generation, and the increase of friction will accelerate the wear of the punch. It increases first and then decreases with the increase of punch speed A and punch clearance B, respectively. Too fast a blanking speed will lead to increased punch wear, while too large and too small blanking clearance will reduce punch life. As such, suitable blanking clearance is the key to reduce wear.
According to the value of F in the variance analysis results in Table 5, the magnitude of single factor influence to punch wear is as follows: punch edge fillet C is the most influential factor, followed by punch clearance B and punch speed A. The order of the interactive influence of punch wear is: punch speed and punch edge fillet AC > punch speed and punch clearance AB > punch clearance and punch edge fillet BC.
Figure 11, Figure 12 and Figure 13 show the response surfaces for the interactive influence of punching process parameters on punch wear. The interactive influence of the interaction between the process parameters on punch wear is investigated. The darker red areas in the figure represent the largest amount of wear, and the lighter the color, the less wear.
Figure 11 shows the response surface relation diagram and contour diagram of punch speed and punch clearance to punch wear depth. It can be seen that when punch speed is 50–100 mm/s, the punch wear depth shows a trend of first increasing and then decreasing. When the punch clearance is 7–10%, the punch wear depth initially increases first and then decreases as the punch clearance increases. The most punch wear occurs when the punch speed and punch clearance are about the middle value. As can be seen from Figure 12, punch wear rises with the increase of cutting-edge fillet. Smaller cutting-edge fillet and punch speeds can result in less punch wear. The smaller cutting-edge fillet reduces the contact area with the plate, increasing the contact pressure between the punch and the plate contact surface, while the smaller punch speed reduces the punching punch temperature, increases the wear resistance, and thus reduces the punch wear. As can be seen from Figure 13, in the range of blanking process parameters studied, punch wear is the greatest when the blanking clearance value is in the middle value and the cutting-edge fillet is also in the middle. When the clearance value is the highest and the cutting edge is the smallest, the wear amount is relatively reduced.

4.3. Blanking Process Parameters Optimization and Verification

To minimize the punch wear during the rotor punching process, with blanking speed, blanking clearance, and die cutting edge fillet as variables and punch wear as optimization target value, Design-Expert software is applied to further optimize the parameters of the test scheme. A group of blanking process parameters obtained through the software is shown in the chart. With the blanking speed of 50 mm/s, the blanking gap of 0.036, and the die cutting edge of 0.076 mm, the corresponding response target predicted value is 6.95 × 10⁻¹² mm, as shown in Table 6. In order to verify the accuracy of the process parameters obtained from the optimization target, the punching parameters are substituted into the Deform-3D software for numerical simulation. The simulated punch wear depth is compared to the predicted value of the response target and the punch wear depth prior to optimization. As shown in Figure 14, the punch wear depth after optimization is 6.93 × 10⁻¹² mm, with an absolute relative error of 2.5% between the simulated value and the predicted value of the response surface. This suggests that the response surface method is highly reliable for optimizing the process scheme. As a result, the optimal process parameters are 28.9% lower than the pre-optimized punch wear depth.
The research of rotor punch wear mainly focuses on the influence of material coating on punch wear. Moreover, different values of material properties and punching parameters of research objects in literature will lead to different punch wear values. However, the change rule of influence between punching parameters and punch wear is basically consistent in the study. For example, in Hong Yi Liang’s [26] analysis on the wear of thick plate punching die, it was found that the greater the punching speed, the greater the punch wear; the greater the punch wear with the increase of cutting-edge fillet, the lower the punch wear with the increase of punching clearance. In this paper, the response surface design method is adopted to analyze the influence law of cross factors, and a set of optimal parameter combination is obtained in line with the influence law between punching parameters and punch wear. The certain error between the predicted punch wear obtained by the relevant response surface test design and the punch wear obtained by the simulation software is less than 5%, which is acceptable to enterprises. It has certain reference value to the production of enterprises.

5. Conclusions

(1)
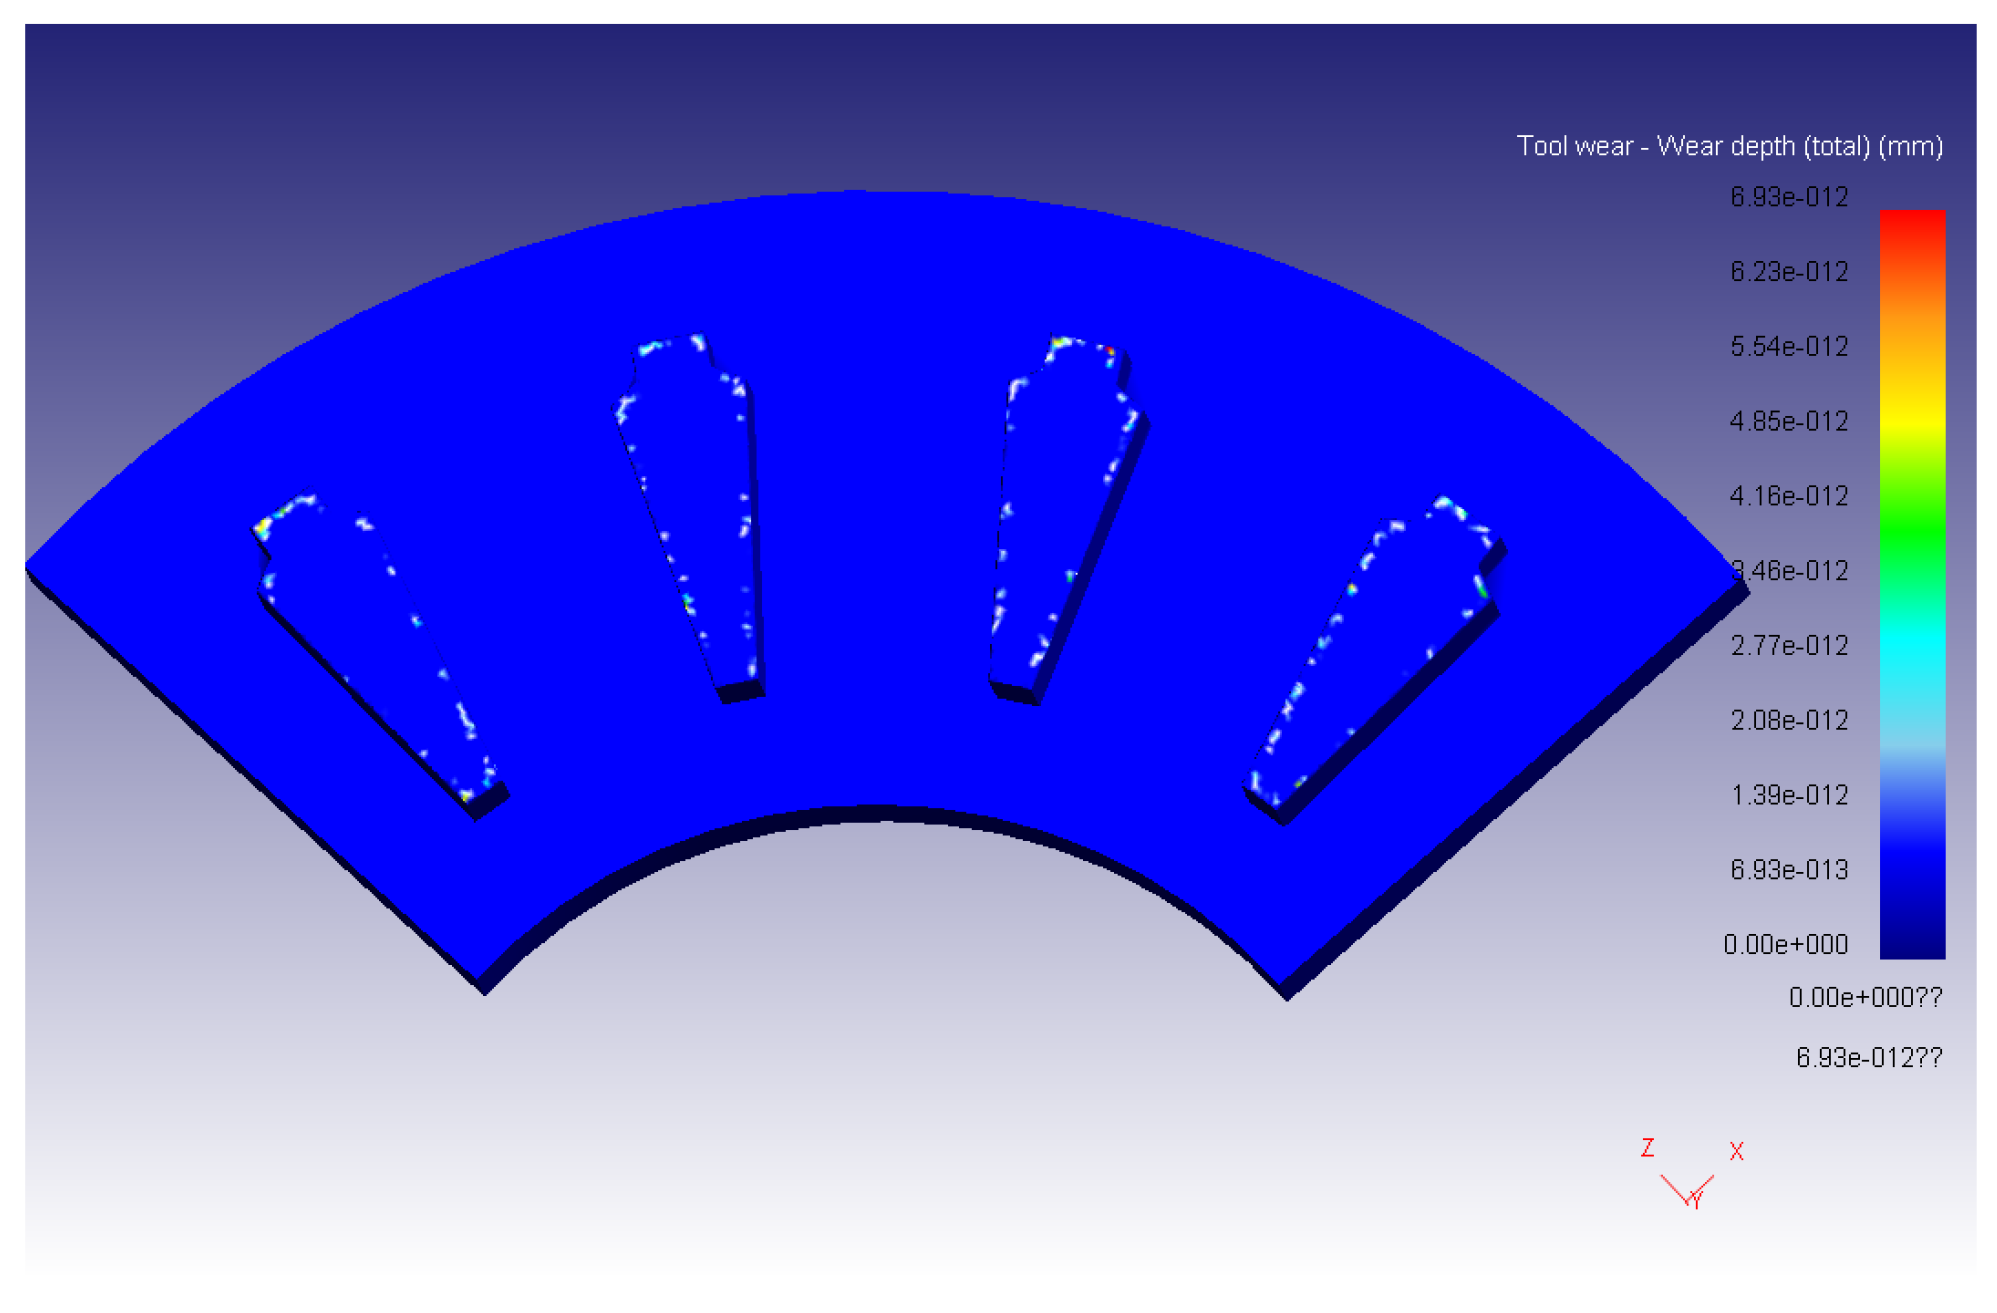
Based on the response method and Deform-3D, the finite element model of punch wear in the punching process of the motor rotor is analyzed, and it is found that the punch wear is mainly concentrated in the cutting-edge area directly in contact with the sheet metal.
(2)
Through the response surface Box–Behnken test design, the influence rule of each punching parameter on punch wear is obtained from the variance analysis of the response surface model. The influence magnitude of each factor is as follows: punch cutting edge rounded Angle C > punch clearance B > punch speed A. The order of the interactive influence of punch wear is as follows: punch speed and punch edge fillet AC > punch speed and punch clearance AB > punch clearance and punch edge fillet BC.
(3)
Optimized by the response surface method, the optimal parameter combination with the smallest wear depth of the rotor punching punch is as follows: The blanking speed is 50 mm/s, the blanking clearance is 0.036 mm, and the die cutting edge is 0.076 mm. The predicted response surface value is 6.95 × 10⁻¹² mm, with a simulated test value of 6.93 × 10⁻¹² mm. The relative error between them is 0.2%, which verifies the effectiveness of the response surface method for optimizing the rotor blanking punch wear. It lowers punch wear and establishes a theoretical foundation for assessing and minimizing wear in rotor blanking production.

Author Contributions

Conceptualization, S.W.; methodology, R.S.; software, R.S.; formal analysis, Z.Z.; writing—original draft preparation, S.W. and R.S.; writing—review and editing, Y.G. All authors have read and agreed to the published version of the manuscript.

Funding

This research was supported by the Open Research Fund of Jiangsu Collaborative Innovation Center for Smart Distribution Network (XTCX202412), Nanjing Institute of Technology Enterprise cooperation project (K23-535).

Data Availability Statement

The original contributions presented in the study are included in the article. Further inquiries can be directed to the corresponding author.

Conflicts of Interest

The authors declare no conflicts of interest.

References

  1. Li, Y.; Wang, Y.; Liu, X.; Gao, Y. Topology Optimization of Rotor Punch Structure of Permanent Magnet Synchronous Motor for Commercial Vehicles. China Automob. 2024, 3, 38–41. [Google Scholar]
  2. Cui, Y. Analysis of Rotor Strength and Fatigue Characteristics of Permanent Magnet Synchronous Motor for Vehicles. Master’s Thesis, Shanghai Jiao Tong University, Shanghai, China, 2023. [Google Scholar]
  3. Trzepiecinski, T.; Lemu, G.H. FEM-based assessment of wear of stamping die. IOP Conf. Ser. Mater. Sci. Eng. 2019, 526, 012002. [Google Scholar] [CrossRef]
  4. Hernández, J.J.; Franco, P.; Estrems, M.; Faura, F. Modelling and experimental analysis of the effects of tool wear on form errors in stainless steel blanking. J. Mater. Process. Technol. 2006, 180, 143–150. [Google Scholar] [CrossRef]
  5. Hambli, R. Blanking tool wear modeling using the finite element method. Int. J. Mach. Tools Manuf. 2001, 41, 1815–1829. [Google Scholar] [CrossRef]
  6. Hambli, R. Design of experiment-based analysis for sheet metal blanking processes optimization. Int. J. Adv. Manuf. Technol. 2002, 19, 403–410. [Google Scholar] [CrossRef]
  7. Mo, J.; Liu, J.; Li, X.; Zheng, Q.-E. Wear Analysis and Process Parameter Optimization of Hexagonal Punch Based on Orthogonal Test. Forg. Stamp. Technol. 2022, 47, 1–6. [Google Scholar]
  8. Mucha, J.; Jaworski, J. The tool surface wear during the silicon steel sheets blanking process. Eksploat. I Niezawodn.—Maint. Reliab. 2016, 18, 332–342. [Google Scholar] [CrossRef]
  9. Luo, S.Y. Effect of geometry and the surface of treatment of punching tool on the tool life and wear conditions in the piercing of thick sheet plate. J. Mater. Process. Technol. 1999, 88, 122–133. [Google Scholar] [CrossRef]
  10. Mucha, J. An experimental analysis of effects of various material tool’s wear on burr during generator sheets blanking. Int. J. Adv. Manuf. Technol. 2010, 50, 495–507. [Google Scholar] [CrossRef]
  11. Ruan, G. Based on the response surface method of high strength steel stamping DP800 springback process parameters optimization. J. Forg. Technol. 2015, 40, 40–44. [Google Scholar]
  12. Feng, C.X.; Wang, X. Development of empirical models for surface roughness prediction in finish turning. Int. J. Adv. Manuf. Technol. 2002, 20, 348–356. [Google Scholar]
  13. Pereira, M.P.; Yan, W.; Rolfe, B.F. Contact pressure evolution and its relation to wear in sheet metal forming. Wear 2008, 265, 1687–1699. [Google Scholar] [CrossRef]
  14. Pereira, M.P.; Yan, W.; Rolfe, B.F. Sliding distance, contact pressure and wear in sheet metal stamping. Wear 2010, 268, 1275–1284. [Google Scholar] [CrossRef]
  15. Pereira, M.P.; Weiss, M.; Rolfe, B.F.; Hilditch, T.B. The effect of the die radius profile accuracy on wear in sheet metal stamping. Int. J. Mach. Tools Manuf. 2013, 66, 44–53. [Google Scholar] [CrossRef]
  16. Zhao, Y.; Zhang, S.; Mu, Z.; Wang, W.; Yan, H.; Ma, S.; Zhang, Y. Research on Numerical Simulation of Die Wear of Automobile Covering Based on Dynamic Wear Model. China Mech. Eng. 2024, 35, 515–523. [Google Scholar]
  17. Zhang, W.; Wang, S.; Chen, J.; Cheng, C.; Zhang, L. Experimental and continuous stamping simulation study on surface wear of hardened steel mold. Int. J. Interact. Des. Manuf. (IJIDeM) 2018, 12, 1481–1494. [Google Scholar] [CrossRef]
  18. Mei, R.; Bao, L.; Li, C.; Liu, X. Constitutive Equation of mid-temperature deformation of Fe-6.5%Si Steel. J. Northeast. Univ. (Nat. Sci. Ed.) 2019, 40, 43–47. [Google Scholar]
  19. Sellars, C.M.; Mctegart, W.J. On the mechanism of hot deformation. Acta Metall. 1966, 14, 1136. [Google Scholar] [CrossRef]
  20. Mei, R.; Bao, L.; Du, Y.; Zhang, X.; Li, C.; Liu, X. Constitutive Equation of high temperature deformation of Fe-6.5%Si Steel. Iron Steel 2018, 53, 98–102. [Google Scholar]
  21. Li, Y.; Lv, Y.; Ni, M. Analysis of Influence of Die Design Parameters on Die Wear of Aircraft Blade. Mater. Sci. Technol. 2019, 27, 79–84. (In Chinese) [Google Scholar]
  22. Cao, H. Influence of Blanking Parameters on Blanking Quality of Non-Oriented Silicon Steel. Master’s Thesis, Huazhong University of Science and Technology, Wuhan, China, 2016. [Google Scholar]
  23. Liu, K.-W.; Bian, W. Optimization of blanking process Parameters of C75S Spring Steel based on Response Surface Method. Forg. Stamp. Technol. 2016, 41, 32–36. [Google Scholar]
  24. Liu, J.; Zhang, M.; Chen, H. Optimization of Punching process Parameters for Stepped Punch based on Response Surface Method. J. Plast. Eng. 2016, 23, 52–57+67. [Google Scholar]
  25. Jiang, T.-L.; Gong, H.-Y.; Shi, W.-Z.; Zhao, X.-Y. Optimization of U-shaped Bending Forming Process Parameters Based on Response Surface Method. J. Shanghai Univ. Eng. Technol. 2019, 33, 278–282. [Google Scholar]
  26. Liang, H.Y. Finite Element Simulation and Life Analysis of Die Wear in Heavy Plate Punching. Master’s Thesis, Kunming University of Science and Technology, Kunming, China, 2017. [Google Scholar]
Figure 1. Rotor structure diagram.
Machines 12 00671 g001
Figure 2. Structure diagram of rotor slot.
Machines 12 00671 g002
Figure 3. Simplified finite element model of rotor blanking.
Machines 12 00671 g003
Figure 4. Stress-strain curve of Fe-6.5%Si2.
Machines 12 00671 g004
Figure 5. Grid division of sheet metal.
Machines 12 00671 g005
Figure 6. Punch local refinement diagram.
Machines 12 00671 g006
Figure 7. Punch wear process. (a) The punch has just pressed into the plate stage. (b) Elastic deformation stage. (c) Plastic deformation stage. (d) Fracture separation stage.
Machines 12 00671 g007
Figure 8. Distribution of residual normal rule.
Machines 12 00671 g008
Figure 9. Relationship between actual and forecast.
Machines 12 00671 g009
Figure 10. Influence trend of each factor on response quantity.
Machines 12 00671 g010
Figure 11. Interactive influence of punch speed and punch clearance on punch wear.
Machines 12 00671 g011
Figure 12. Interactive influence of punch speed and cutting-edge fillet on punch wear.
Machines 12 00671 g012
Figure 13. Interactive influence of punch clearance and cutting-edge fillet on punch wear.
Machines 12 00671 g013
Figure 14. Optimized kyphotic die wear simulation value.
Machines 12 00671 g014
Table 1. Performance parameters of sheet and punch materials.
Parameter NameMaterial Parameter Value
Work MaterialPunch Material
Thermal conductivity (W/m·K)18.924
Coefficient of thermal expansion (μm/m·K) 1.16 × 10 4 1.2 × 10 5
Hardness (HV)395690
Young’s modulus (Gpa)190206
Poisson’s ratio0.280.3
Density (g/cm3)7.857.85
Table 2. Parameters of Fe-6.5%Si2 material model.
NameNumerical Value
Constant (A)0.0433
Constant (α)0.0136
Deformation activation Energy (Q)342.2
Stress index (n)2.4593
Gas constant (R)8.314
Table 3. Process parameters and level Settings.
FactorProcess ParameterLevel
−101
ABlanking speed5075100
BBlanking clearance0.0350.04250.05
CRounded edge0.070.0850.1
Table 4. Test plan and results.
Test
Number
ABCPunch Wear
S / × 10 12
11000.050.0858.173
21000.0350.0857.318
3500.04250.19.489
4750.04250.0859.751
5750.0350.077.889
6750.04250.0859.692
7750.04250.0859.745
8500.050.0857.566
91000.04250.19.564
101000.04250.079.338
11750.04250.0859.632
12750.0350.18.906
13750.050.078.785
14500.04250.078.245
15500.0350.0857.266
16750.04250.0859.766
17750.050.19.318
Table 5. Analysis of variance of regression model of punch wear depth.
Source of VarianceSum of SquaresDegree of Freedom Mean VarianceF Valuep ValueSignificance
Model13.4891.50174.85<0.0001significant
A-punch speed0.459410.459453.610.0002
B-punch clearance0.758310.758388.50<0.0001
C-punch edge fillet1.2111.21141.10<0.0001
AB0.077010.07708.990.0200
AC0.215310.215325.130.0015
BC0.058610.05866.830.0347
A22.9712.97346.50<0.0001
B27.0817.08826.28<0.0001
C20.389210.389245.420.0003
Residual0.060070.0086
Lack of Fit0.047830.01595.230.0720not significant
Pure Error0.012240.0030
Cor Total13.5416
R-Squared = 0.9956Adj R-Squared = 0.9899Pred R-Squared = 0.9421
Table 6. Optimization process plan.
Blanking ParameterThe Optimal Parameter Value
Blanking speed 50 mm/s
Blanking clearance 0.036 mm
Punch edge rounded corners 0.076 mm
Punch wear value (forecast)6.95 × 10⁻¹² mm
Disclaimer/Publisher’s Note: The statements, opinions and data contained in all publications are solely those of the individual author(s) and contributor(s) and not of MDPI and/or the editor(s). MDPI and/or the editor(s) disclaim responsibility for any injury to people or property resulting from any ideas, methods, instructions or products referred to in the content.

