Article

Characteristics of Differential Entropy Generation in a Transonic Rotor and Its Applications to Casing Treatment Designs

1
Marine Engineering College, Jimei University, Xiamen 361000, China
2
Department of Power Engineering, North China Electric Power University, Baoding 071003, China
3
Zhejiang Rongda Yongneng Compressor Co., Ltd., Hangzhou 310000, China
*
Author to whom correspondence should be addressed.
Machines 2024, 12(10), 673; https://doi.org/10.3390/machines12100673
Submission received: 23 August 2024 / Revised: 19 September 2024 / Accepted: 23 September 2024 / Published: 26 September 2024
(This article belongs to the Section Machine Design and Theory)

Abstract

:
Casing treatments improve compressor stability but often at the expense of compressor efficiency. In this study, the differential entropy generation rate (DEGR) was applied to both efficiency evaluation and stall margin estimation. Rotor 67 was used as the compressor in this study and the simulation results were analyzed to correlate the distribution of the DEGR with the flow structures in the rotor at three rotating speeds. The characteristics of the DEGR at each speed were analyzed, exhibiting the characteristics of the flow structures at peak efficiency (PE) and near stall (NS) flow conditions. Loss analysis was conducted on the peak efficiency operating condition, particularly at 100% rotating speed. The critical state of the DEGR was investigated to identify stall occurrences on the near-stall condition. It was thus concluded that the DEGR can be a unified measure of both efficiency and stall margin. This theoretical exploration was subsequently applied to the design of casing treatments with two objectives: enhancing peak efficiency at 100% rotating speed and improving stability margins at all speeds. Two casing treatments were designed, with two circumferential grooves positioned axially at different locations. Their mechanisms for reducing the high DEGR area in the peak efficiency condition of 100% speed and suppressing an increase in DEGR during approaching stall were investigated, respectively. The results indicated that the presence of a groove near the leading edge of the blade tip can effectively suppress stall at all speeds. In order to achieve peak efficiency at high speeds, the extent of casing treatment coverage above the shock wave plays a crucial role in minimizing losses.

1. Introduction

Casing treatment (CT) is commonly recognized as an effective technique that can enhance stability by extending the stable operating range. However, it also often introduces flow losses that lead to a reduction in compressor efficiency [1]. Early studies primarily focused on investigating the impact and mechanism of CTs on stability expansion for various compressors [2,3,4,5,6,7,8]. In recent years, research on CTs has further improved CTs influence on efficiency [9,10,11]. Specifically, improvements have involved adjusting the structure of CTs or even coupling blade modifications with CTs simultaneously [12]. In some research, optimization methods such as genetic algorithms have been employed to identify optimal schemes for CTs [13].
When designing the optimal CT, it is necessary to tie the specified goals of the compressor performance improvements to the specific requirements of given applications. For instance, axial compressors in marine gas turbines often lack of sufficient stall margins at medium and low rotating speeds, making it imperative to enlarge the stall margins at these rotating speeds while maintaining efficiency at full speeds at high levels. These particular requirements pose two challenges in designing CTs: the balance between efficiency and stability margin, and the different requirements at multiple operating speeds.
Currently, the majority of research on CT design primarily focuses on enhancing the stability margin. It is difficult to consider both efficiency and the stability margin simultaneously during the design phase. This difficulty stems from the absence of a unified measurement standard for assessing both efficiency and the stability margin. Ma et al. [14,15] proposed that the differential entropy generation rate (DEGR) could serve as a comprehensive measure to evaluate both the stability margin and efficiency. In [14], the correlation between the DEGR and peak efficiency was analyzed and how the flow mechanism of casing treatments affects entropy generation was determined. In [15], the distributions of the DEGR in the near stall were explored and the relationships between the DEGR and the flow structures are detailed. These findings enable the consideration of a balance between efficiency and the stability margin at the initial stage of CT design. In principle, DEGR analysis can also be extended to achieve a balance of stability and efficiency at multiple rotating speeds. Therefore, this study aims to provide such a case study by exploring the characteristics of the DEGR for three rotational speeds.
In this paper, the flow field of the NASA Rotor 67 at seven rotational speeds was calculated with CFD simulations. Three rotating speeds, including the design rotating speed and two partial rotating speeds, were taken for detailed analysis. The circumferential grooves of two axial positions were set. For each rotating speed, the DEGR characteristics at two typical operating points were analyzed: the peak efficiency (PE) operating points and the near-stall (NS) operating points. Two cases were designed: one to improve compressor efficiency at 1.0n speed (where n is the design speed), the other to expand the stability margin at all speeds.
This paper is divided into three parts. First, the overall DEGR analysis of the compressor at multiple speeds is presented. Then, the sources of the flow field loss at PE condition are analyzed and the influence of two kinds of CT on DEGR reduction are demonstrated for the purpose of reducing the loss. Thirdly, the DEGR caused by flow structures at near stall condition is analyzed and the influence of two kinds of CTs on the advance of DEGR boundary line that separate the incoming main flow with the reverse tip leakage flow in DEGR contours is analyzed for the purpose of restraining the flow structure.

2. Grid Independence Verification and Numerical Simulation Method Validation

The NASA Rotor 67 (R67) was chosen as the model for this study. The experimental data in Figure 1 were obtained from a report published by NASA in 1991 [16]. The grid independence verification of the rotor at its 100%n, where n is the rotating speed, was present in Reference [15]. The same meshes were applied to all rotating speeds, i.e., 0.4n to 1.0n. DEGR was the criterion for the verification of grid independence present in Reference [15]. A total of 6.26 million grids can satisfy the grid independence. The DEGR was defined by Equations (1)–(4) shown below and calculated in post processing with the commercial software package, ANSYS CFX-Post. These equations were first derived from References [17,18,19] and briefly reworked in Ref. [14]. Due to limitations in paper length, the details are omitted here. Interested readers can be referred to those references. The boundary conditions for the inlet and the outlet were set as follows: the inlet had a total pressure of 0.101 MPa and a total temperature of 288.15 K, and the outlet static pressure was varied to obtain different compressor operating conditions along the same speed line. The SST turbulence model was chosen for the steady-state calculation of the single-blade passage of the compressor. Single passage and steady condition were simulated. The model and the validation of numerical simulation method are shown in Figure 1, quoted from Ref. [15] (Ref. [15] is a previous published article by the author). In the formulas, entropy generation (S) relates to the temperature (T), dynamic viscosity ( μ ), thermal diffusivity ( α ), thermal conductivity ( λ ), local average velocity gradient, and local fluctuating velocity gradient.
S ˙ i r r , D ¯ = μ T 2 u ¯ x 2 + v ¯ y 2 + w ¯ z 2 + u ¯ y + v ¯ x 2 + u ¯ z + w ¯ x 2 + v ¯ z + w ¯ y 2 ,
S ˙ i r r , D = μ T 2 u x 2 ¯ + v y 2 ¯ + w z 2 ¯ + u y + v x 2 ¯ + u z + w x 2 ¯ + v z + w y 2 ¯ ,
S ˙ P R O , C ¯ = Φ ¯ θ T 2 = λ T ¯ 2 T ¯ x 2 + T ¯ y 2 + T ¯ z 2 ,
S ˙ P R O , C = α t α λ T ¯ 2 T ¯ x 2 + T ¯ y 2 + T ¯ z 2 ,

3. Results and Discussion

3.1. The DEGR Characteristic of the Compressor with Smooth Casing

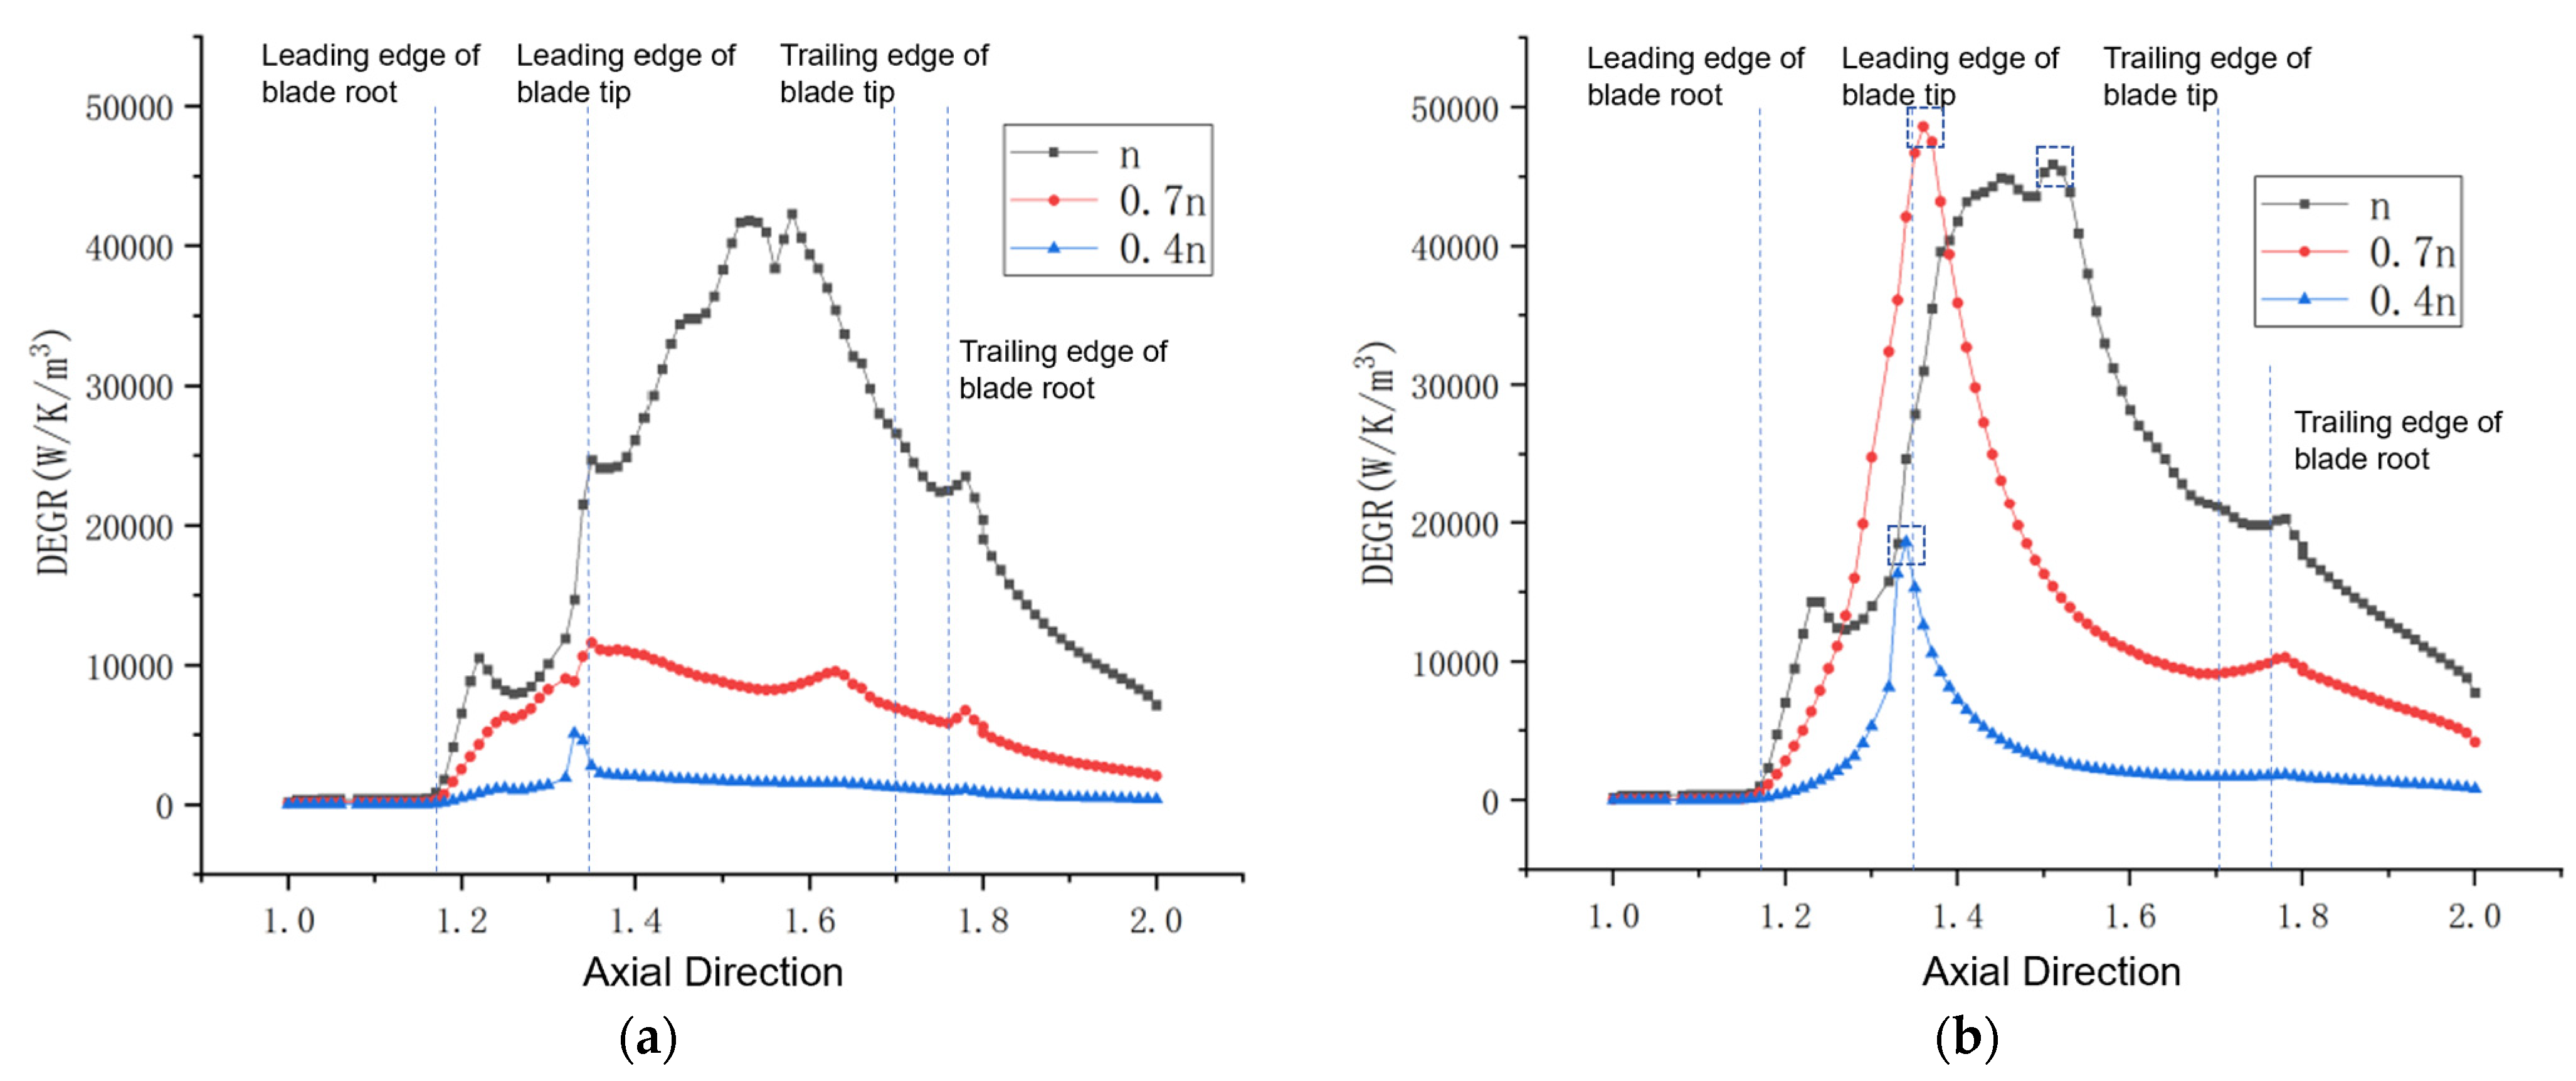
The compressor multi-speed characteristic lines are depicted in Figure 2 for seven speeds: 0.4n, 0.5n, 0.6n, 0.7n, 0.8n, 0.9n, and 1.0n (where n represents the rotating speed at 100%). As observed from Figure 2, the efficiencies at high speeds (0.8n and 0.9n) are relatively low and the stable operating ranges are narrow. This paper aims to enhance efficiency at high speeds while improving the stability margin for all speeds. Due to limitations on the paper’s length, detailed analyses on DEGR were only conducted at the three typical speeds of 0.4n, 0.7n, and n. The results presented in Figure 3 illustrate the DEGR distributions in the PE and NS conditions along the axial direction corresponding to these three rotational speeds, respectively, and within which each point on the DEGR curves was calculated as an averaged value along both the circumference and radial directions. Note that the highest DEGR value at 0.4n is significantly smaller compared to that of the other two speeds.
The streamwise locations of the highest DEGR (the points in the small blue boxes in Figure 3) of three rotating speeds are taken and the DEGR distributions along the blade span are presented in Figure 4. It can be seen in Figure 4 that the high DEGR regions of the three rotational speeds are concentrated near the tip of the blade. In PE and NS conditions, compared with the other two speeds, the DEGR values of n rotating speed in the tip area are the highest, while the DEGR values of 0.4n are the smallest. In order to specifically analyze what flows caused the high DEGR, contours were plotted for the area near the tip of the blades for these three rotational speeds. The flow structures causing the local losses were analyzed.

3.2. The Relevance of DEGR Contours and Flow Structures on the Tip

3.2.1. The Relevance of DEGR and Efficiency at PE

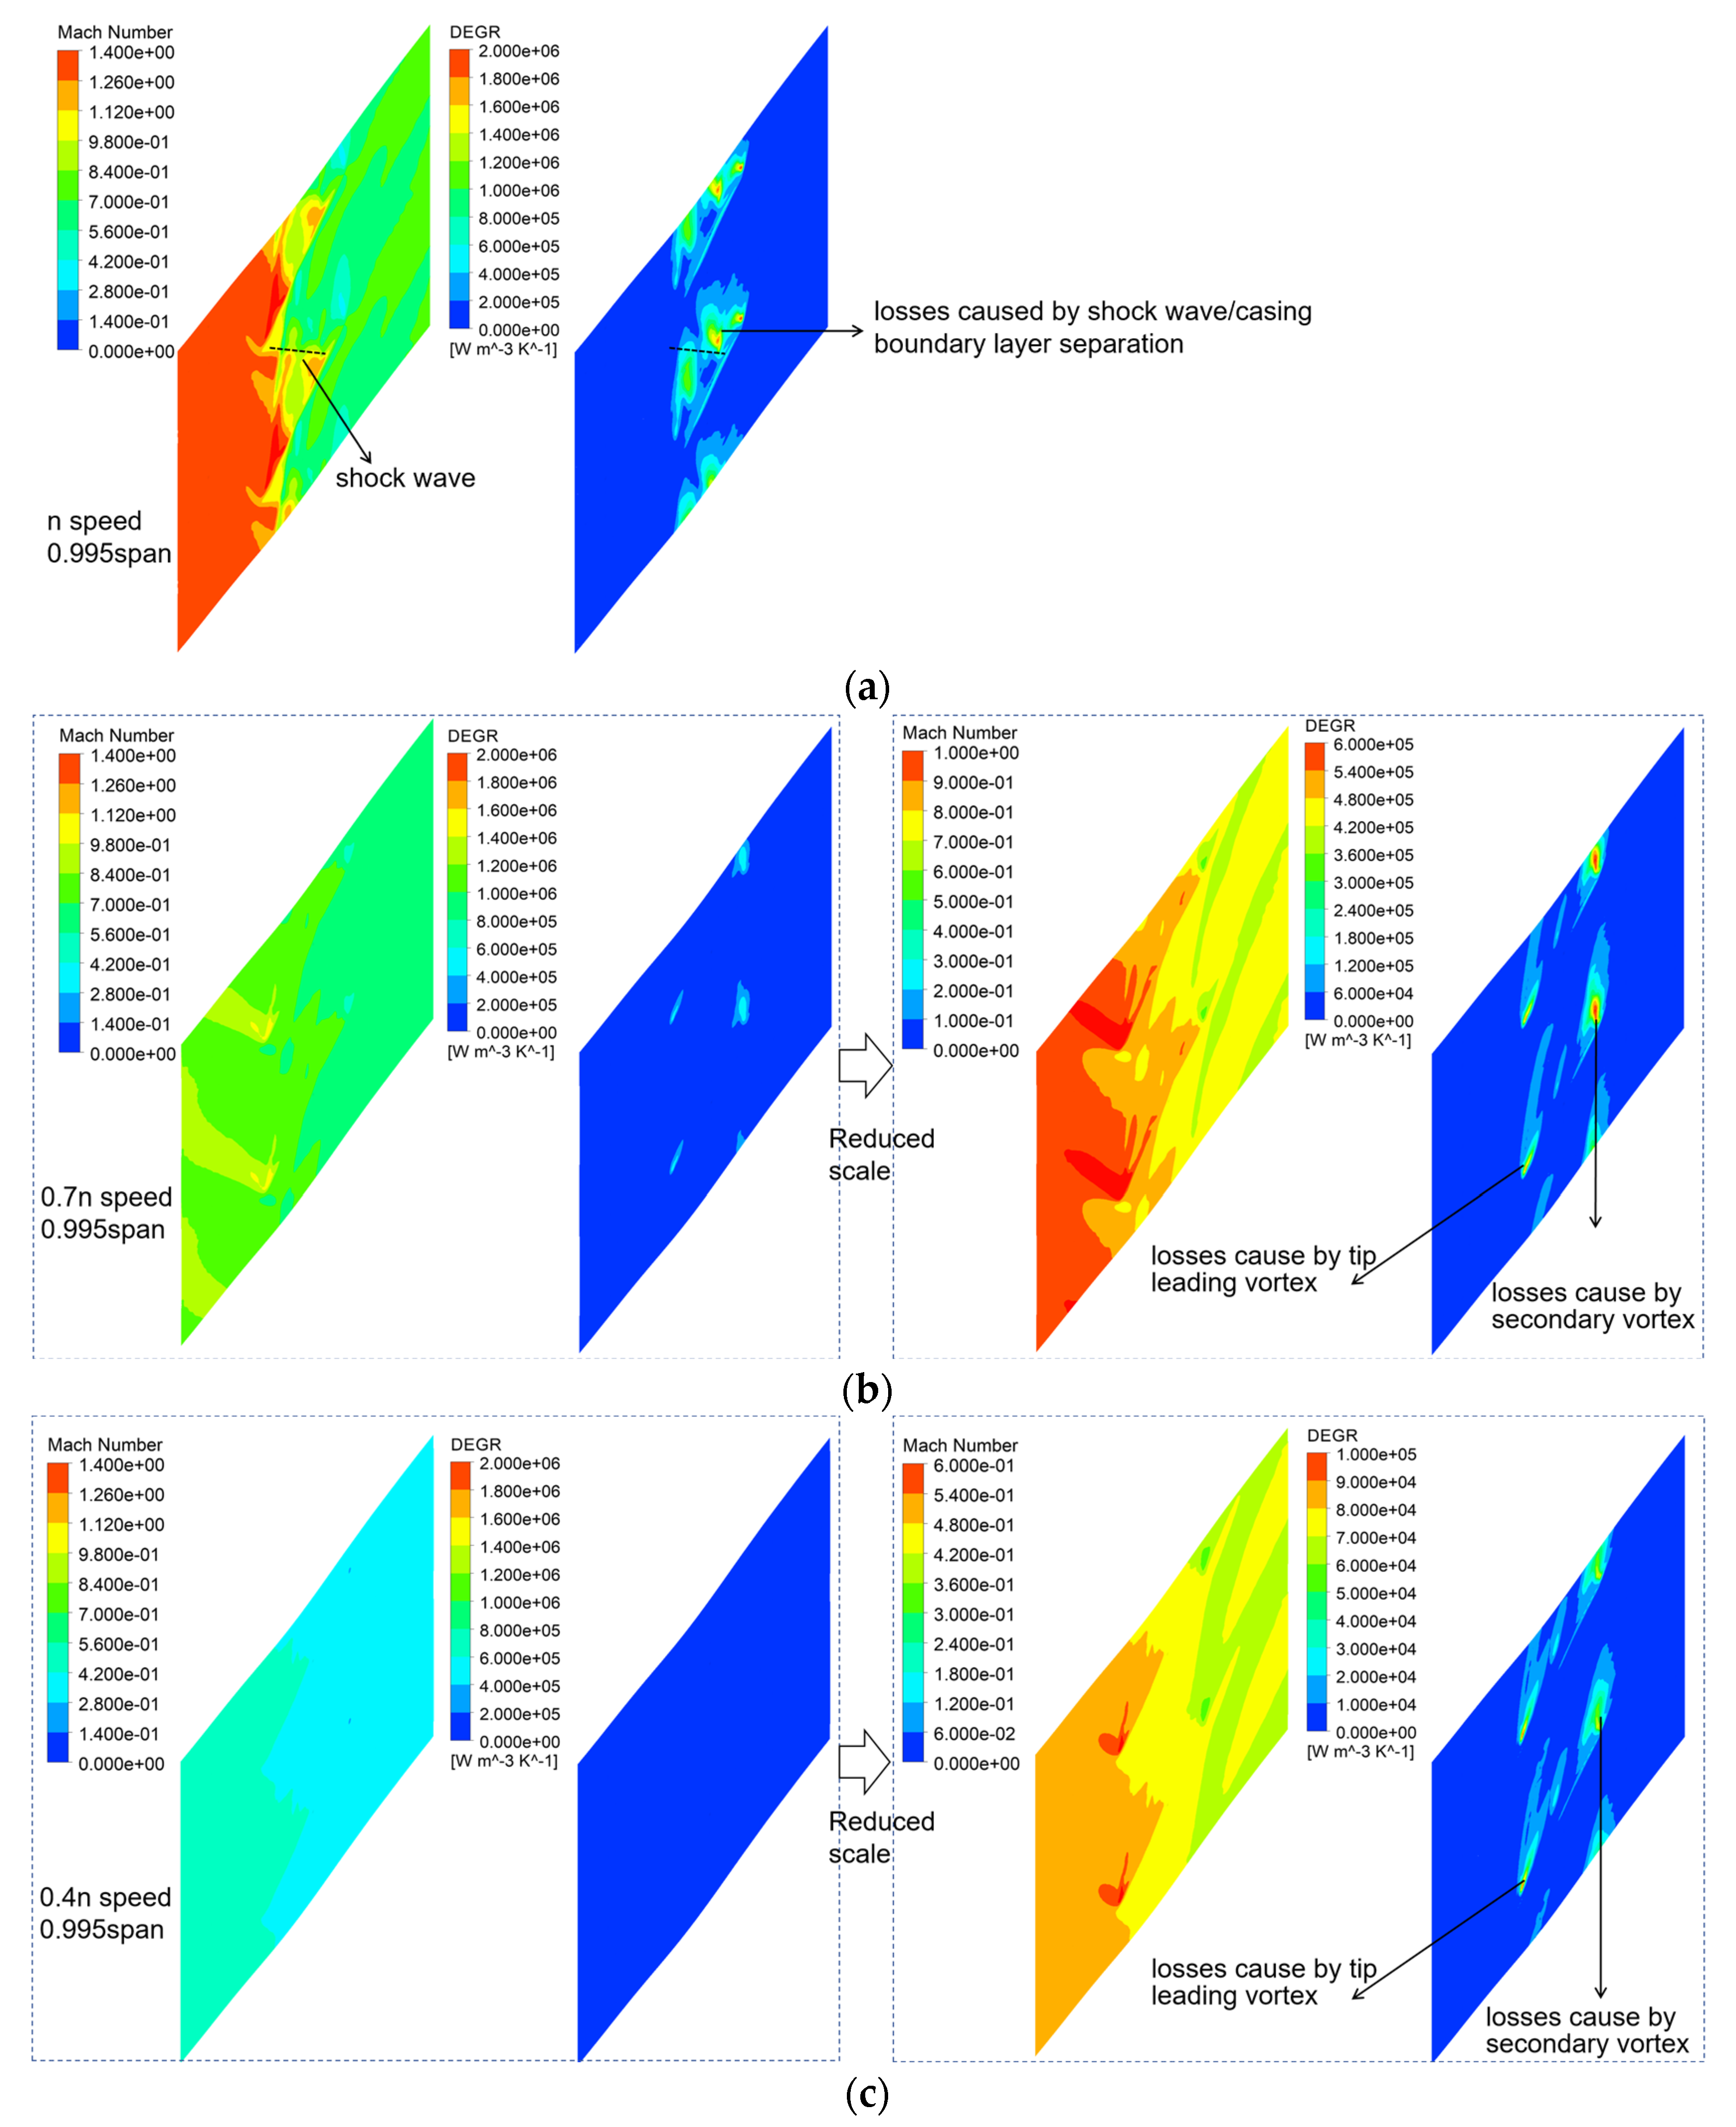
The DEGR contours and the Ma contours of the three rotating speeds on 0.995span at PE condition are depicted in Figure 5. At the 1.0n speed, the position of the shock wave (the black dotted line) can be found from the Mach number map and the corresponding DEGR distribution reveals that the highest DEGR region is located behind the shock wave, which is attributed to the separation of shock wave/casing boundary layer causing significant losses. Another high DEGR region associated with 1.0n speed is observed at first half of the chord length, where tip leakage vortex and tip leakage vortex/boundary layer interference contribute to substantial losses. Due to the fact that the values of the Ma number and DEGR at partial speeds are much smaller than those at the full speed, the scales of the contours were reset to depict the details, which are plotted in the right columns in Figure 5.
It can be observed that at the 0.7n and 0.4n rotating speeds, there is no shock wave on 0.995span. At the 0.7n rotating speed, a prominent high DEGR area exists at both the leading edge of the blade tip and on its trailing edge suction surface. These losses can be attributed to tip leakage vortex at the leading edge and radial secondary flow/boundary layer interference at the trailing edge, respectively [20]. Note that for this speed, higher losses are observed on the trailing edge suction surface compared to other regions. At the 0.4n rotating speed, there is a similar distribution of losses compared to the 0.7n speed, but the losses on the trailing edge suction surface are almost the same as those on the leading edge.
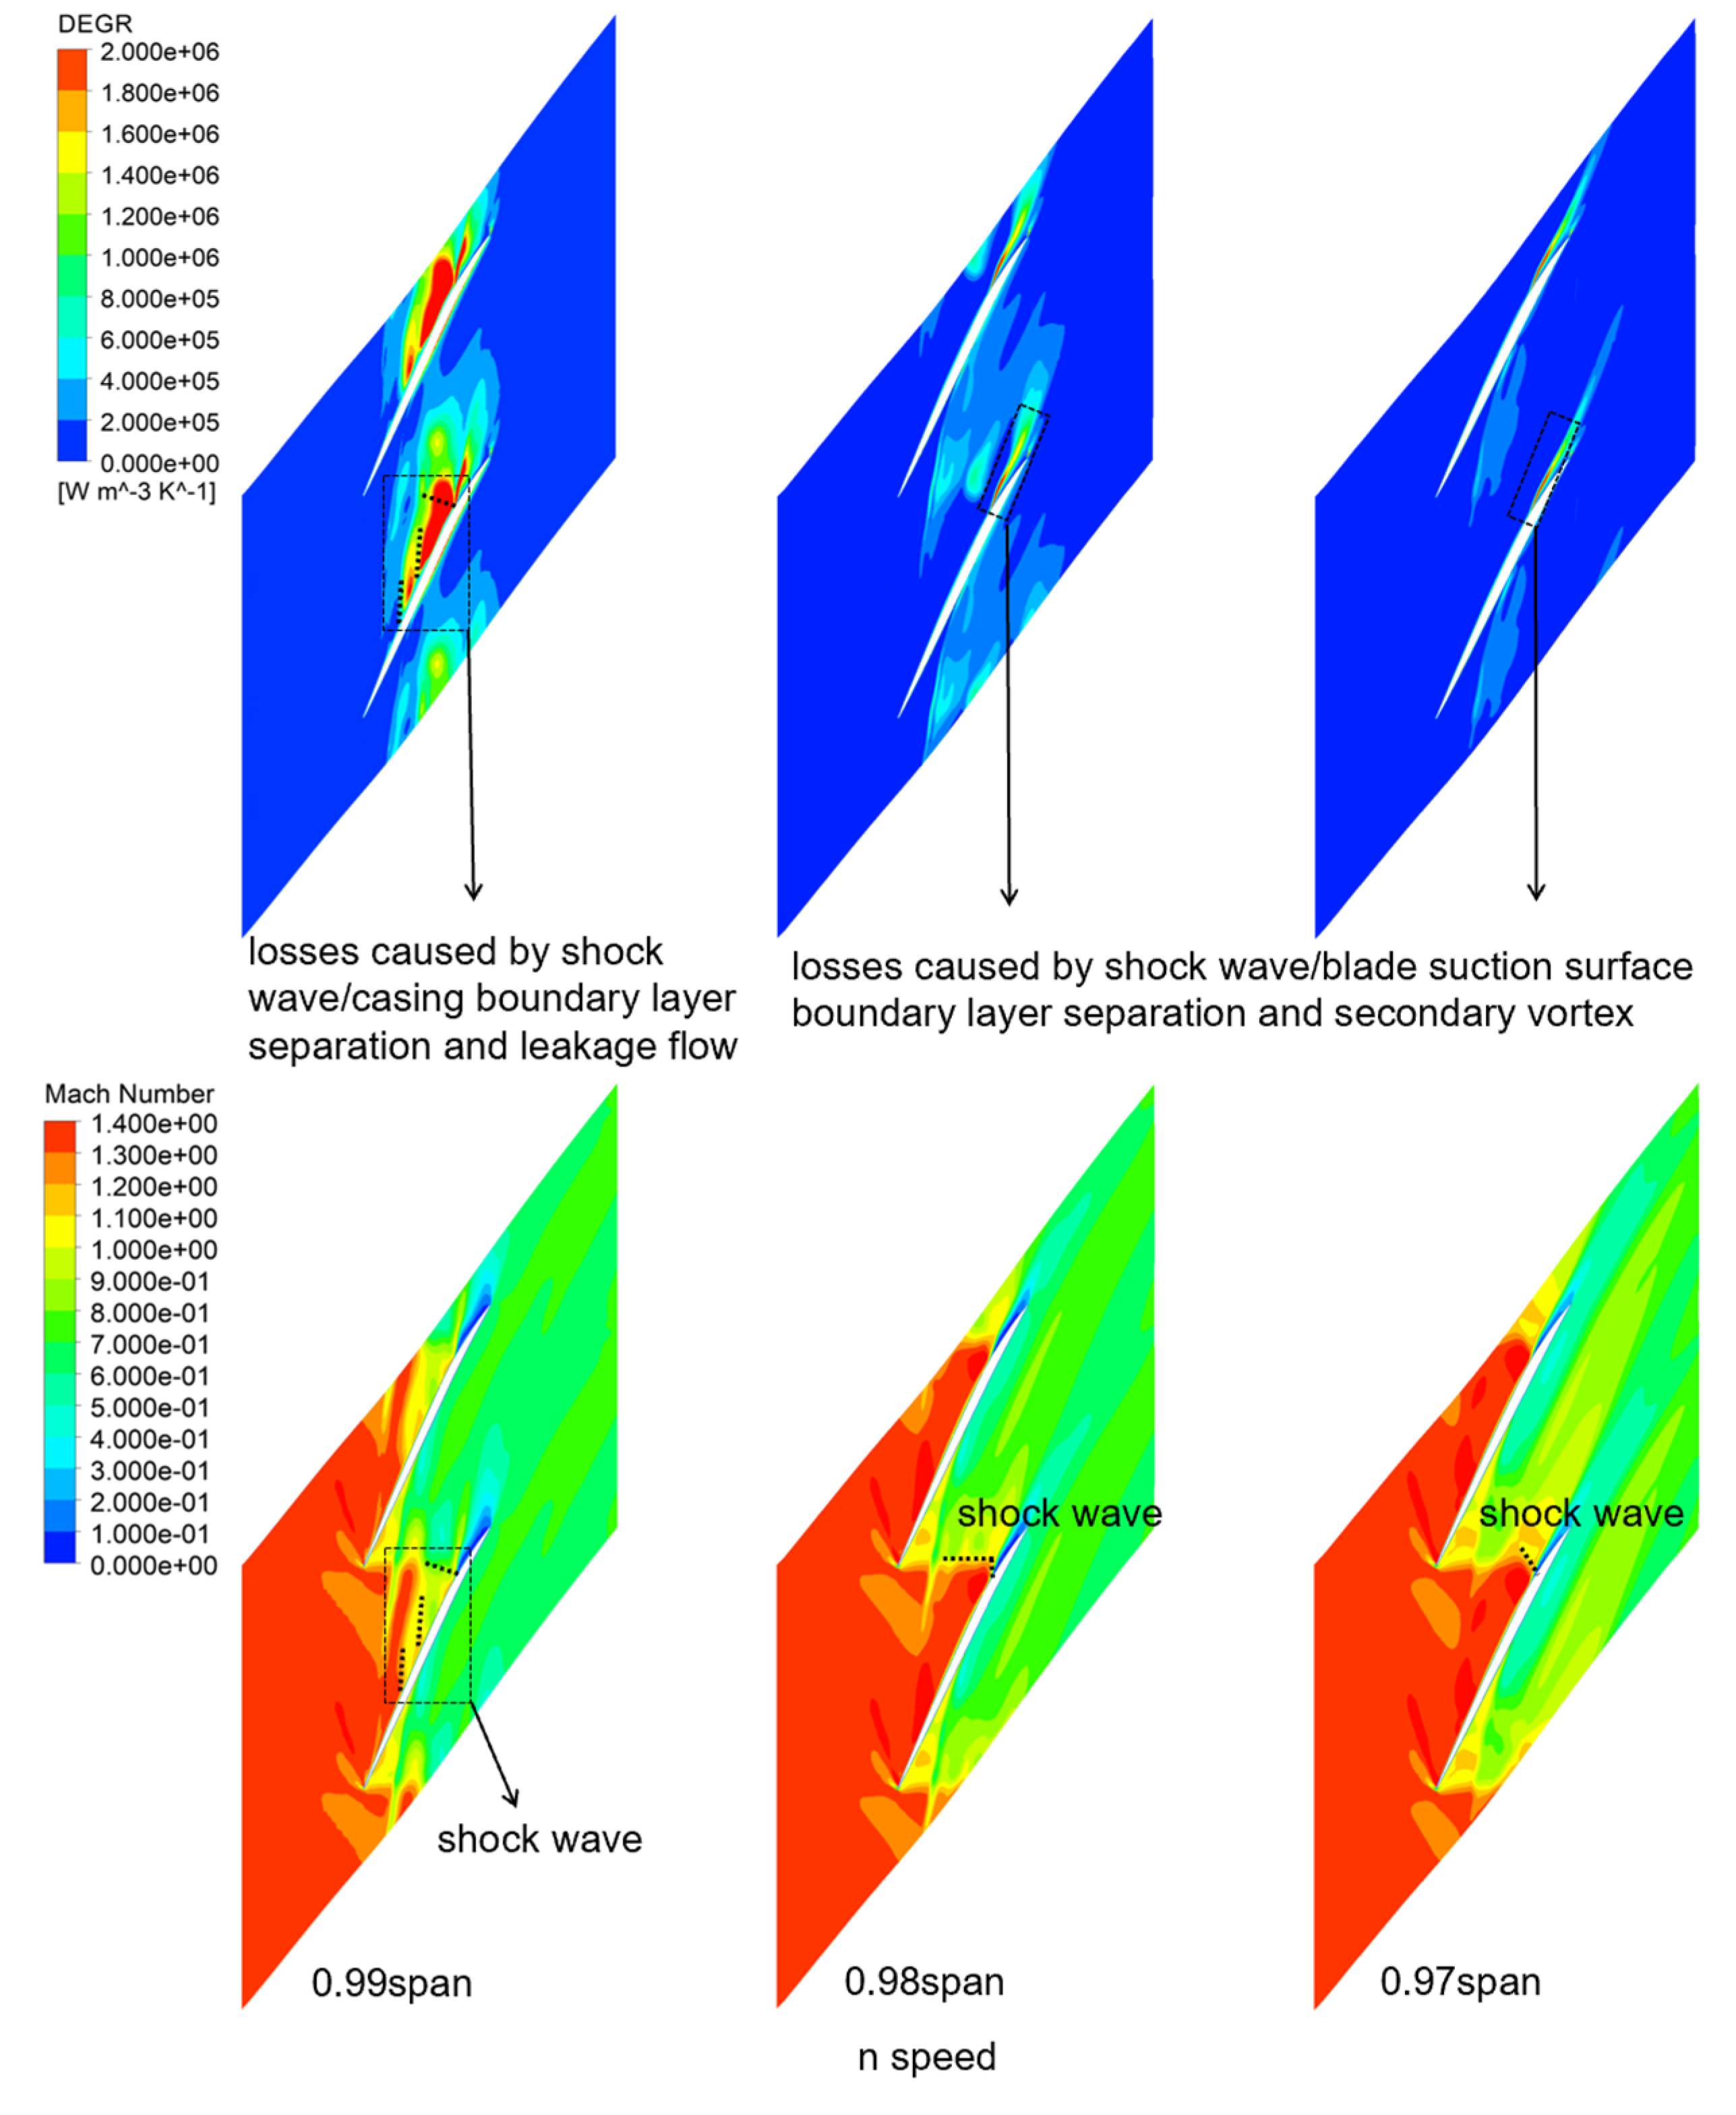
The objective of this study is to enhance the peak efficiency of the compressor at high speeds, thus a detailed analysis near tip region at 1.0n rotating speed was conducted. Figure 6 illustrates the distributions of the DEGR and Ma number for three different spans at 1.0n speed. The 0.99span height corresponds to the blade tip. The DEGR exhibits a high-value region (inside the black dotted box) in the middle of the chord length at 0.99span. Compared with the Ma number distribution, it is evident that the DEGR experiences a jump after shock waves, indicating their significant role in this area. The flow structure here can be characterized as shock wave/boundary layer interference, which has been discussed in Reference [14]. The DEGR values are higher at 0.99span compared to 0.995span, potentially due to the interference caused by leakage flow and shock wave/boundary layer interaction. At 0.98span and 0.97span, the high DEGR area near the trailing edge is caused by the interference of the shock wave/blade suction surface boundary layer and the secondary vortex. The impact of the shock wave at this height is very small.
Based on the aforementioned analysis, it can be inferred that in order to enhance the compressor efficiency at 1.0n rotating speed, mitigating losses resulting from shock wave/casing boundary layer separation should be taken into consideration. Previous studies have suggested employing casing treatment (CT) as a means of attenuating shock wave intensity and subsequently reducing these losses [14,15]. In this paper, the effect of CT applied for 1.0n speed on 0.7n and 0.4n will be studied in Section 3.3.2.

3.2.2. The Relevance of DEGR and Stability at NS

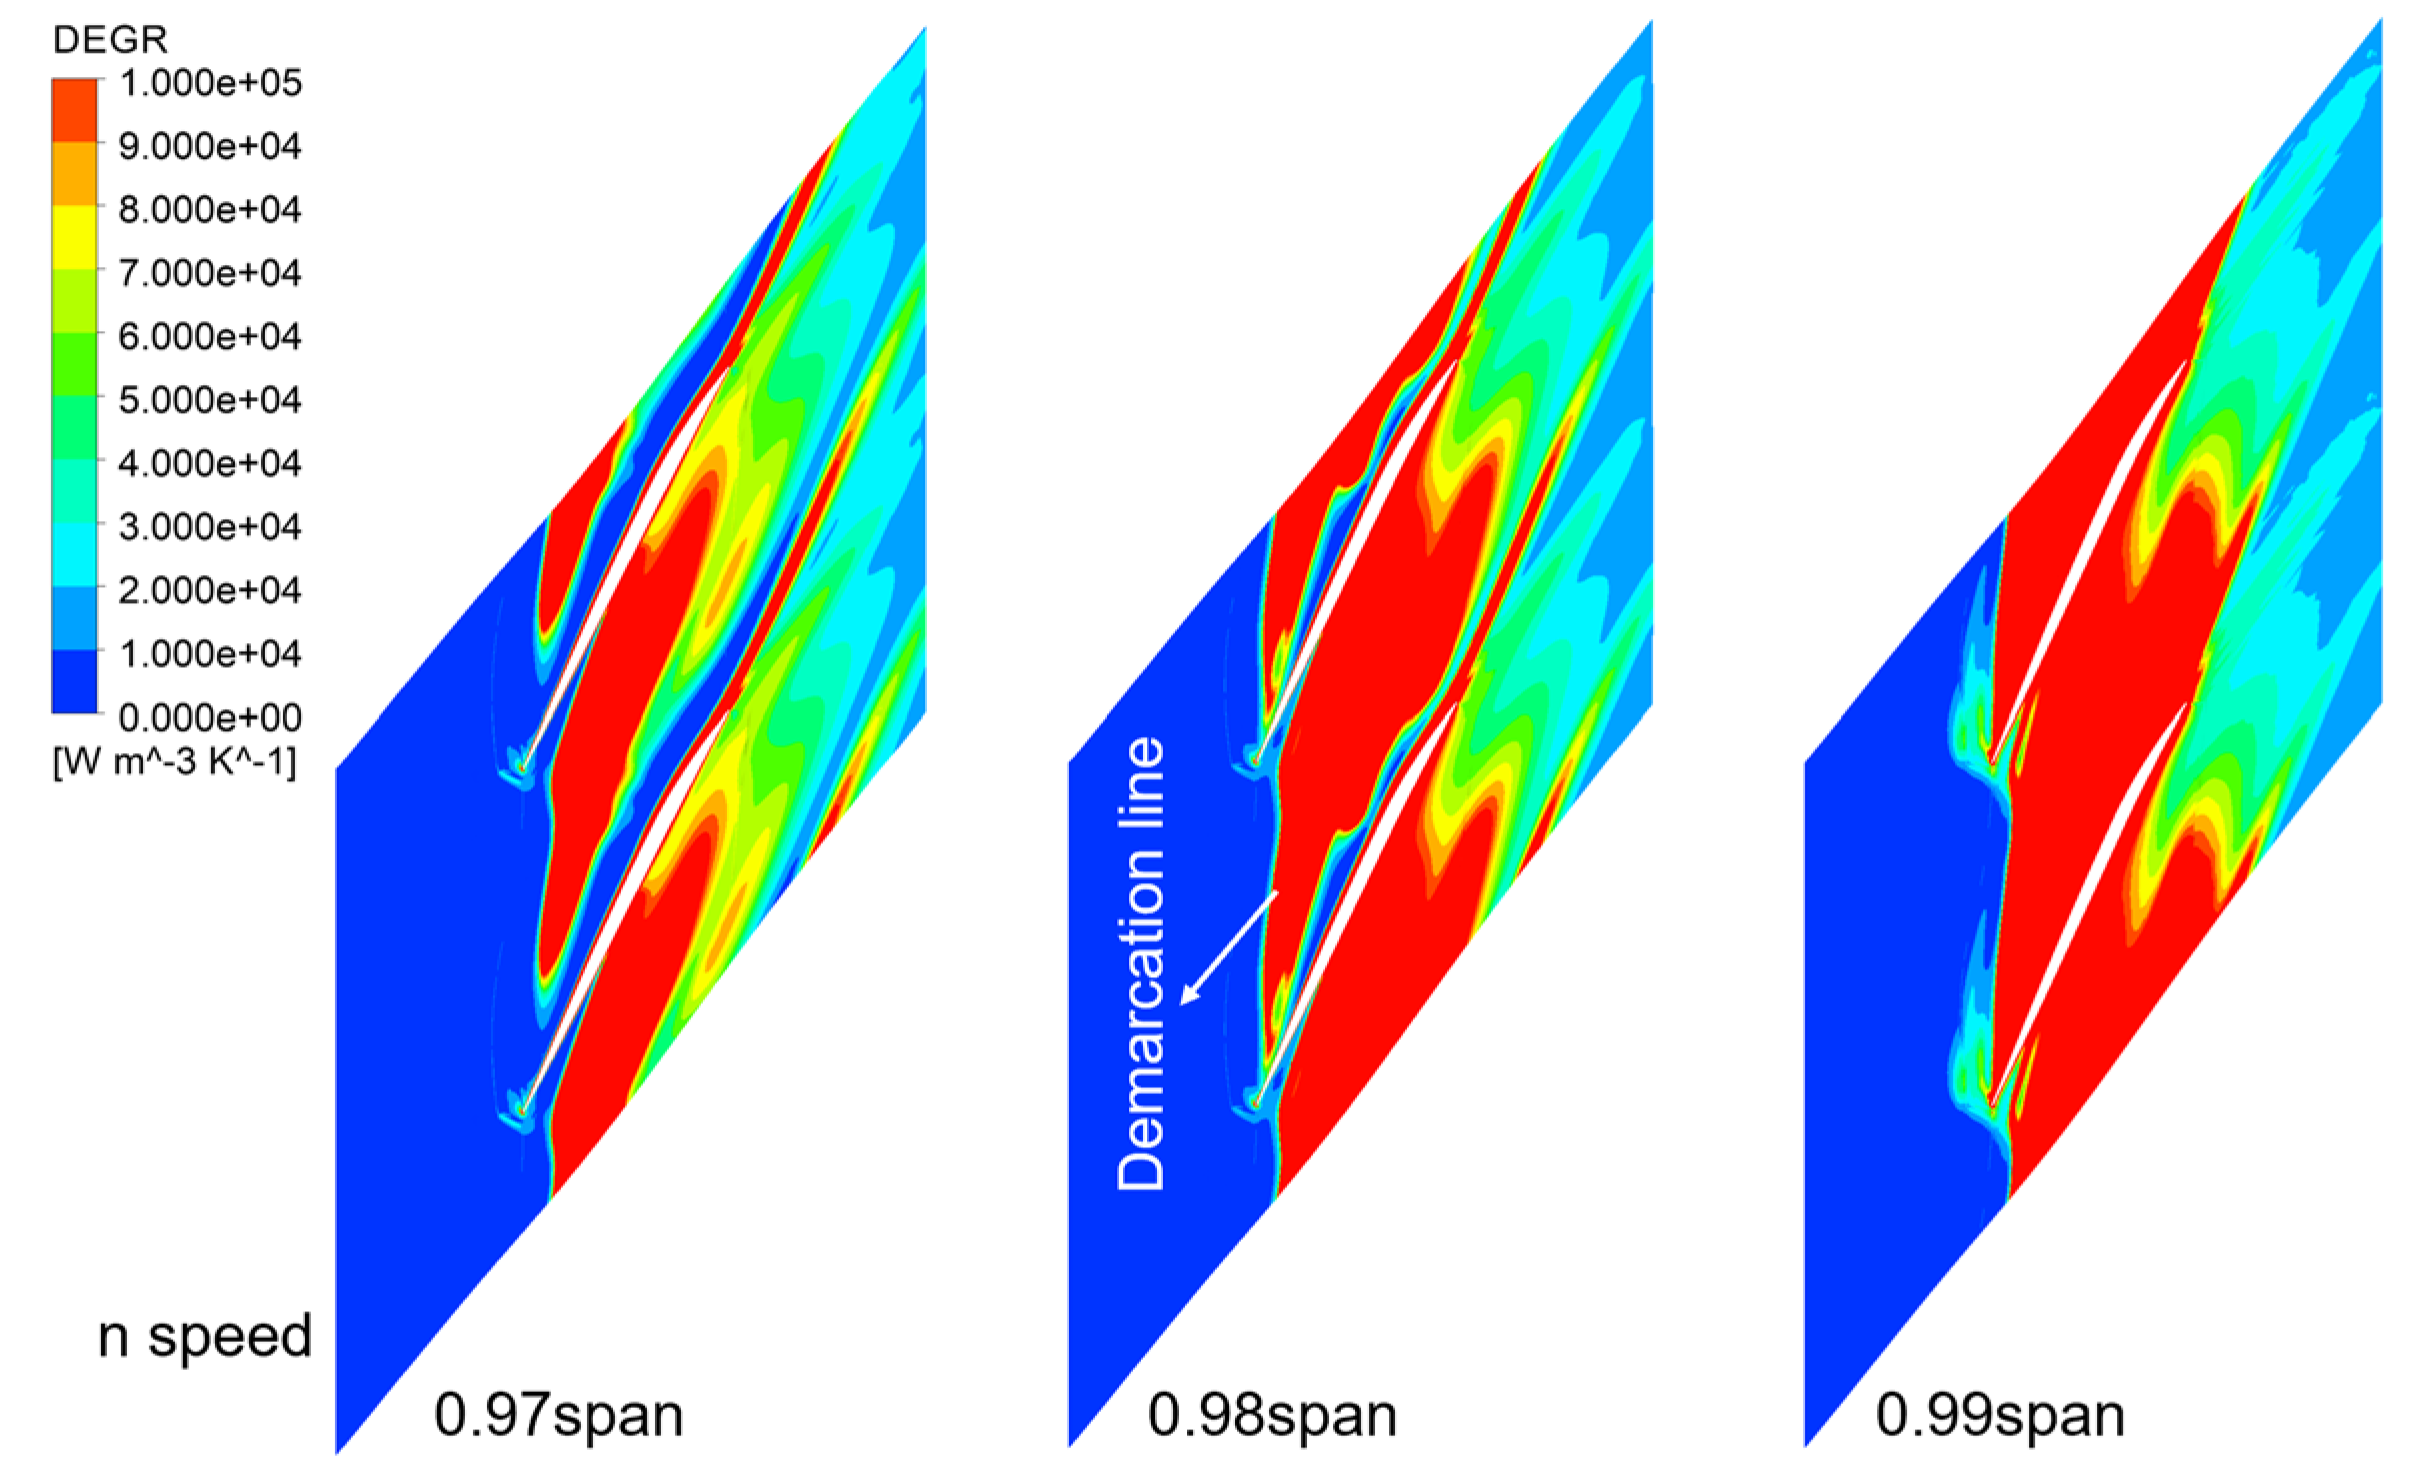
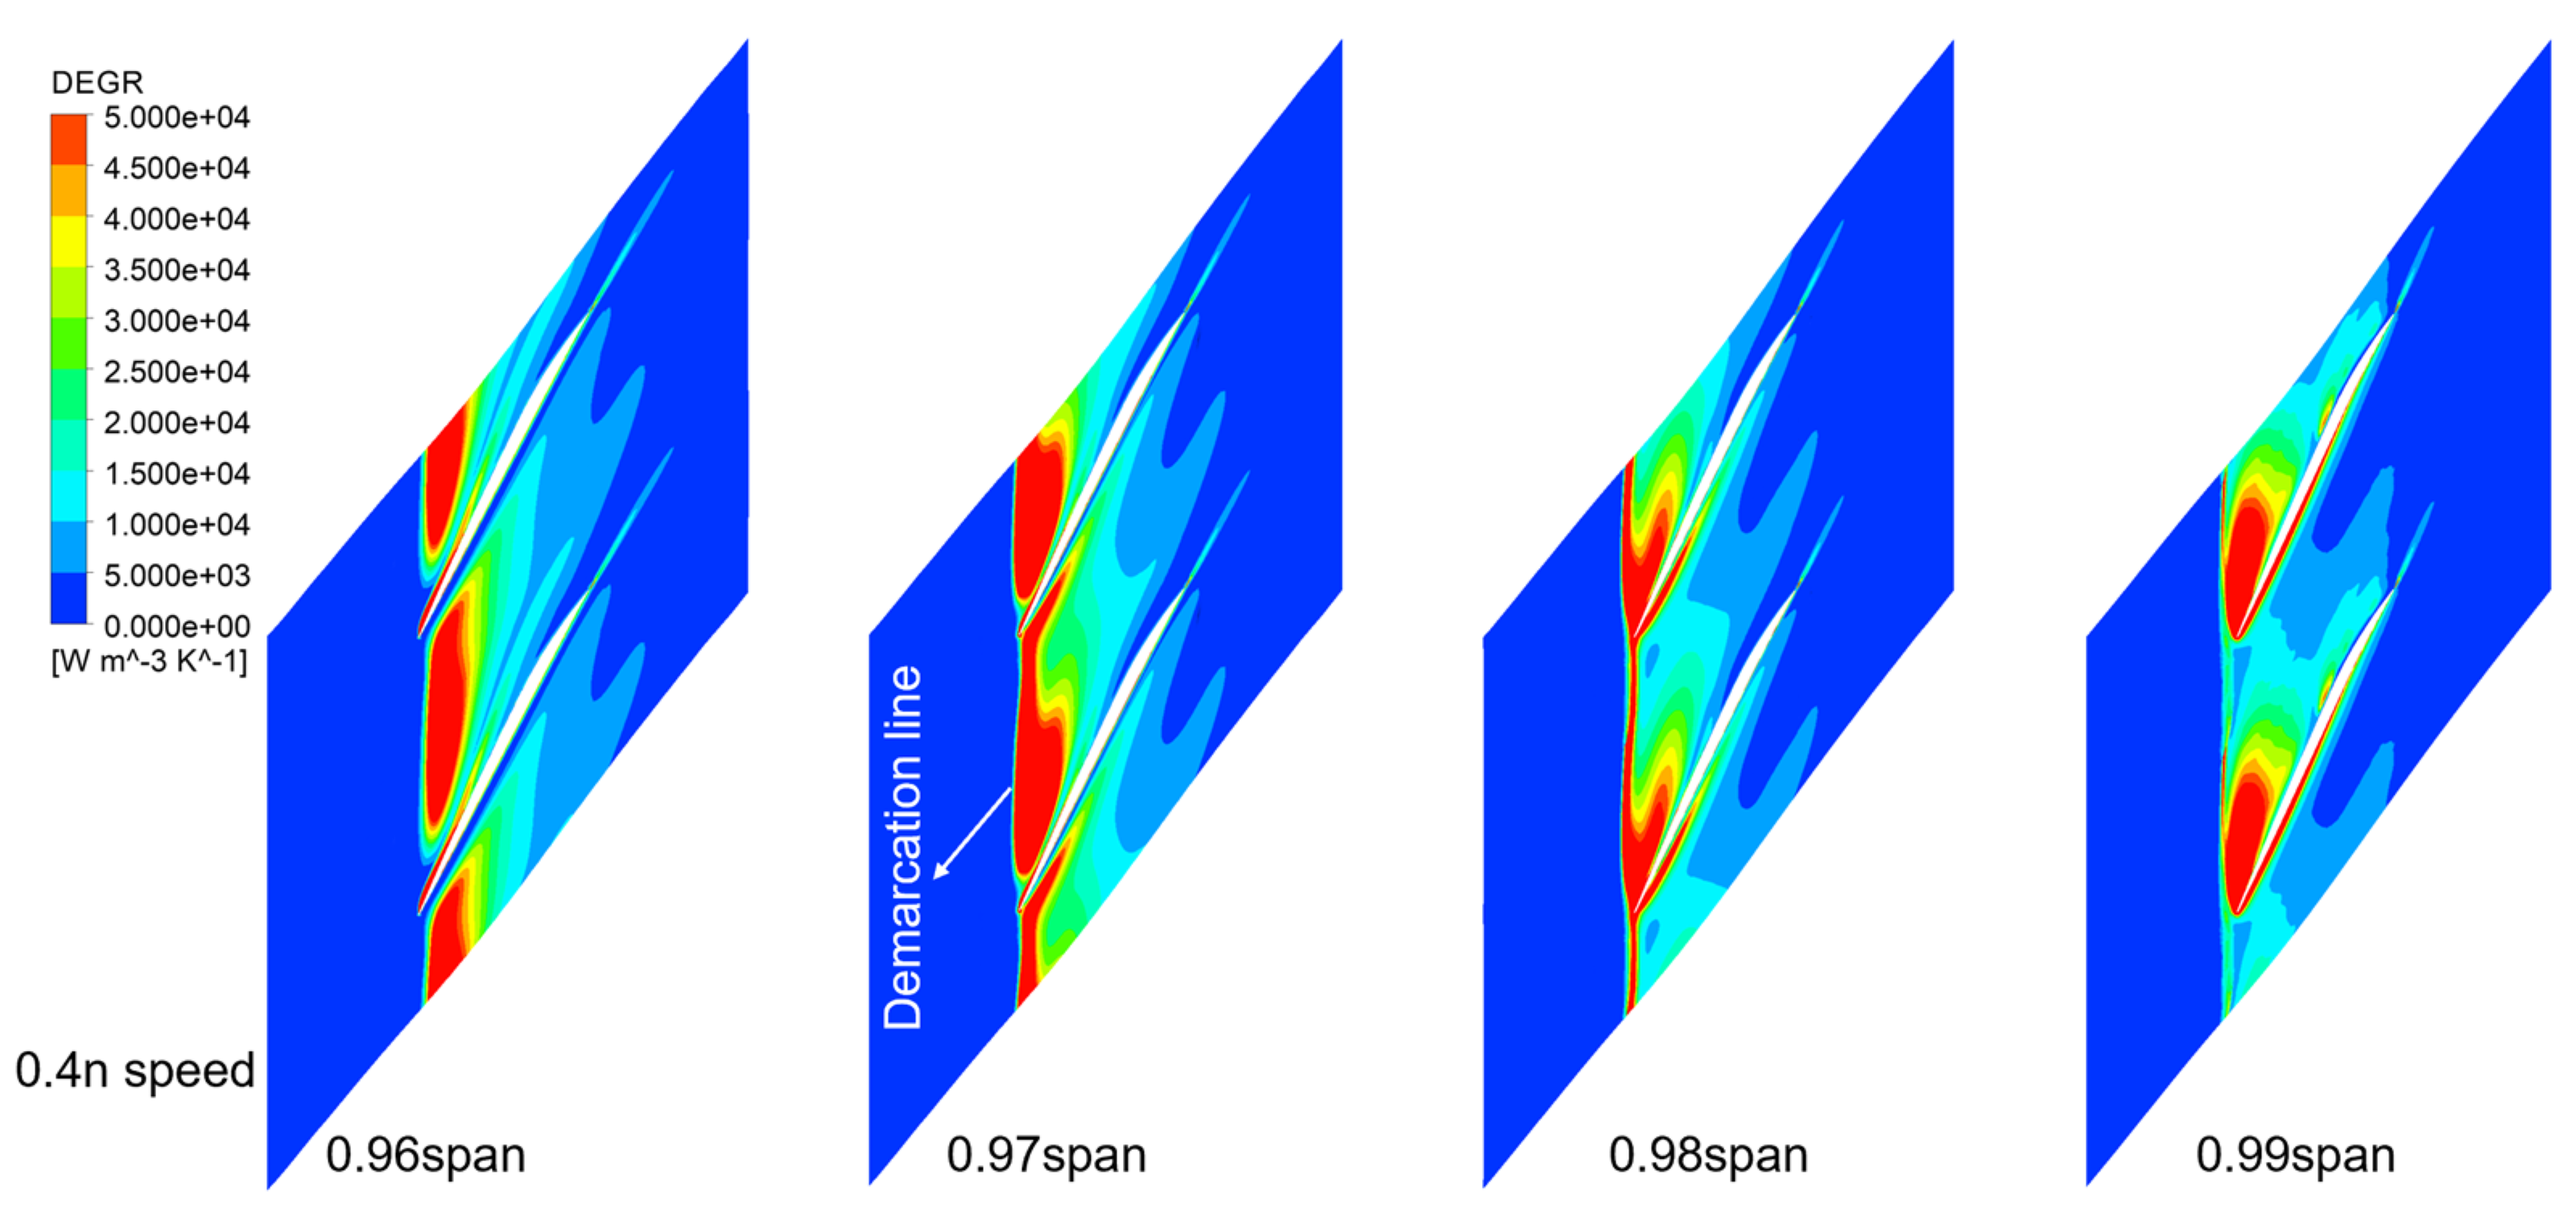
Figure 7, Figure 8 and Figure 9 illustrate the DEGR distributions near the blade tip at the NS conditions for three rotating speeds. It is observed that, under NS conditions, the lines of demarcation that separate the incoming main flow with the reverse tip leakage flow in the DEGR contours are located close to the leading edges of the tip across all three speeds. It was argued in [15] that these lines can be used to characterize the stall onset as long as the compressor is tip-sensitive and its stall is triggered by the spillage of reversed flow out of the blade passages. These lines are all taken from 3D demarcation surfaces that cover a range of span in the tip region (for instance, 0.96–1.0span for 0.4n). Ideally, the stall onset should be identified as the most protrusive location of such demarcation surfaces that spill outside the blade passage. However, for practical purposes, we choose one spanwise location for each speed to represent the stall onset. For the 1.0n speed, the representative height for observing the DEGR demarcation line is 0.98span. For the 0.7n and 0.4n speeds, the representative heights are 0.97span.

3.3. The Casing Treatment Designs and Their Effects on Efficiency and Stability

3.3.1. Design of the CTs

The design of the CTs adheres to two goals: reducing the loss of flow at 1.0n speed and broadening the stability margin on all speeds. Two casing grooves were designed to serve these two goals, respectively. The first groove was positioned near the leading edge of the blade tip (0.05–0.22 chord length), restraining the advancement of DEGR demarcation lines. It was expected that the main function of this casing groove would be to extend the stall margin at all speeds. The second casing groove was located approximately one-third along the blade (0.22–0.39 chord length), where the shock interacts with the casing boundary layer at 1.0n speed. Its primary purpose was to disrupt shock waves and subsequently mitigate losses resulting from shock wave/casing boundary layer interference. Figure 10 illustrates the location of two CTs. The groove depth was five times greater than the blade tip clearance.

3.3.2. The Effects on Efficiency at PE

The influence of the two circumferential grooves on the PE condition of three compressor speeds is presented in Table 1. It can be seen that CT2, designed to address the loss caused by shock waves in the middle of the tip chord length of blades operating at a speed of 1.0n, enhances compressor efficiency. However, at speeds 0.7n and 0.4n under PE conditions, the high loss area does not reside in the middle of the chord length (as depicted in Figure 5), rendering CT2 ineffective for improving compressor efficiency. CT1, designed for addressing the DEGR demarcation line, does not yield a positive impact on compressor efficiency for these two partial speeds.
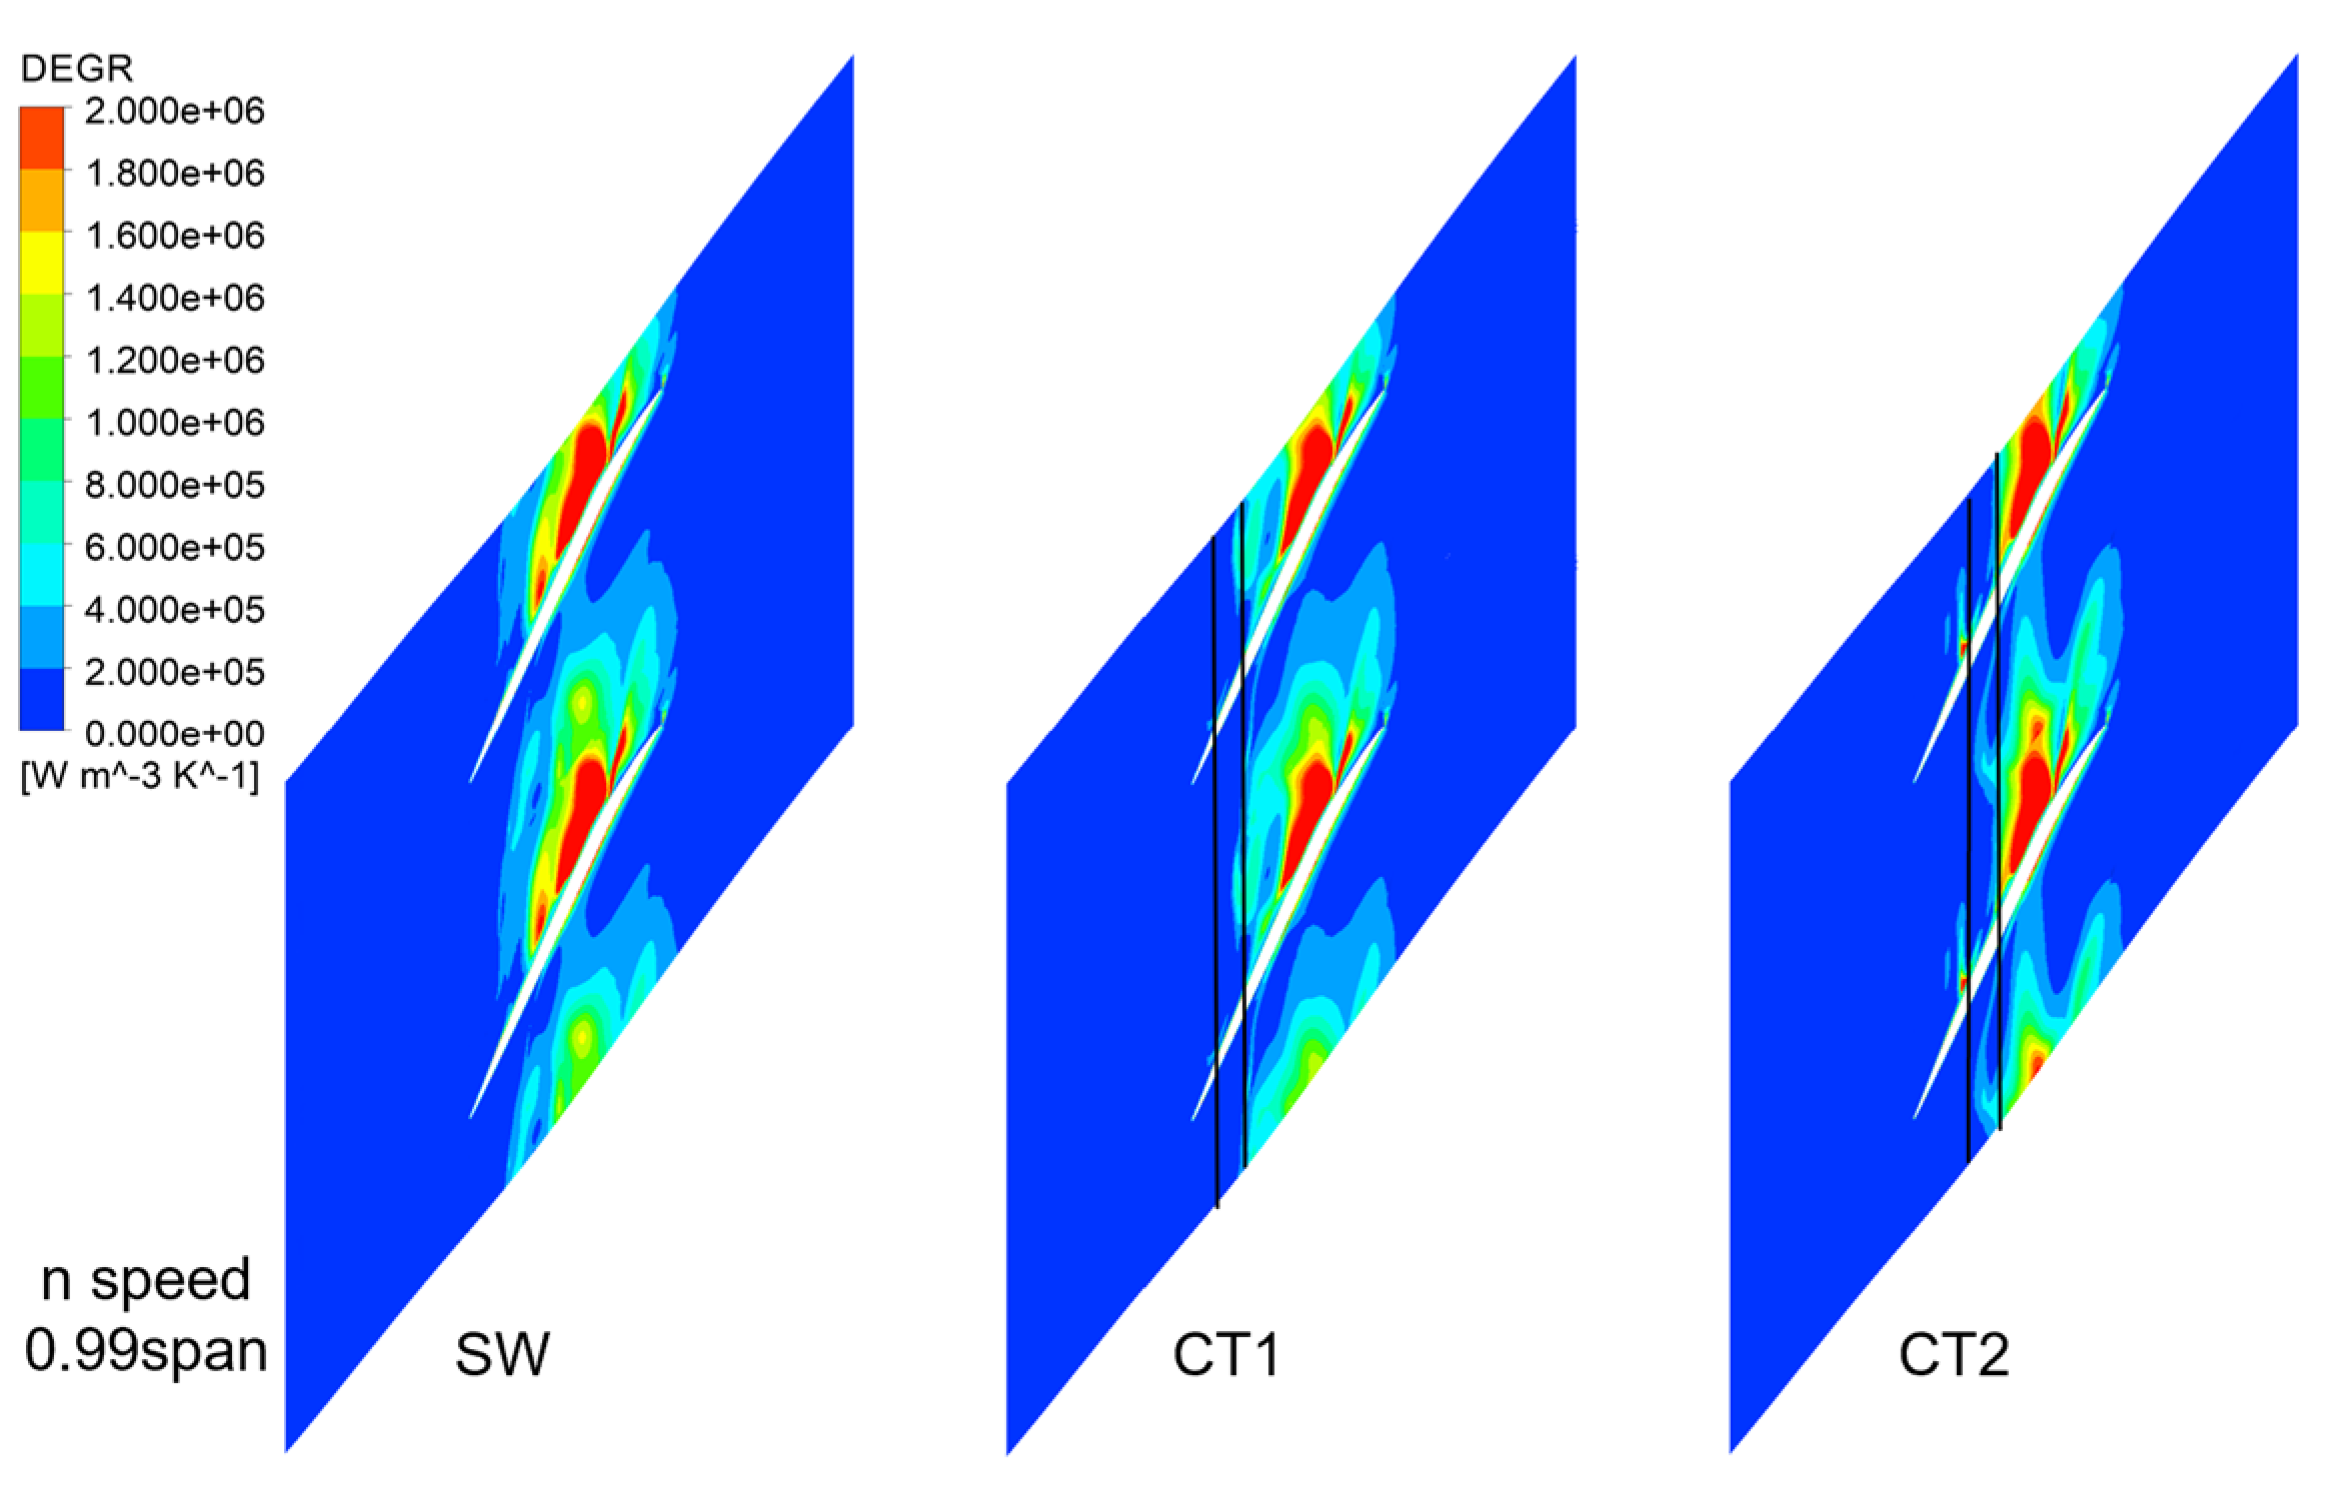
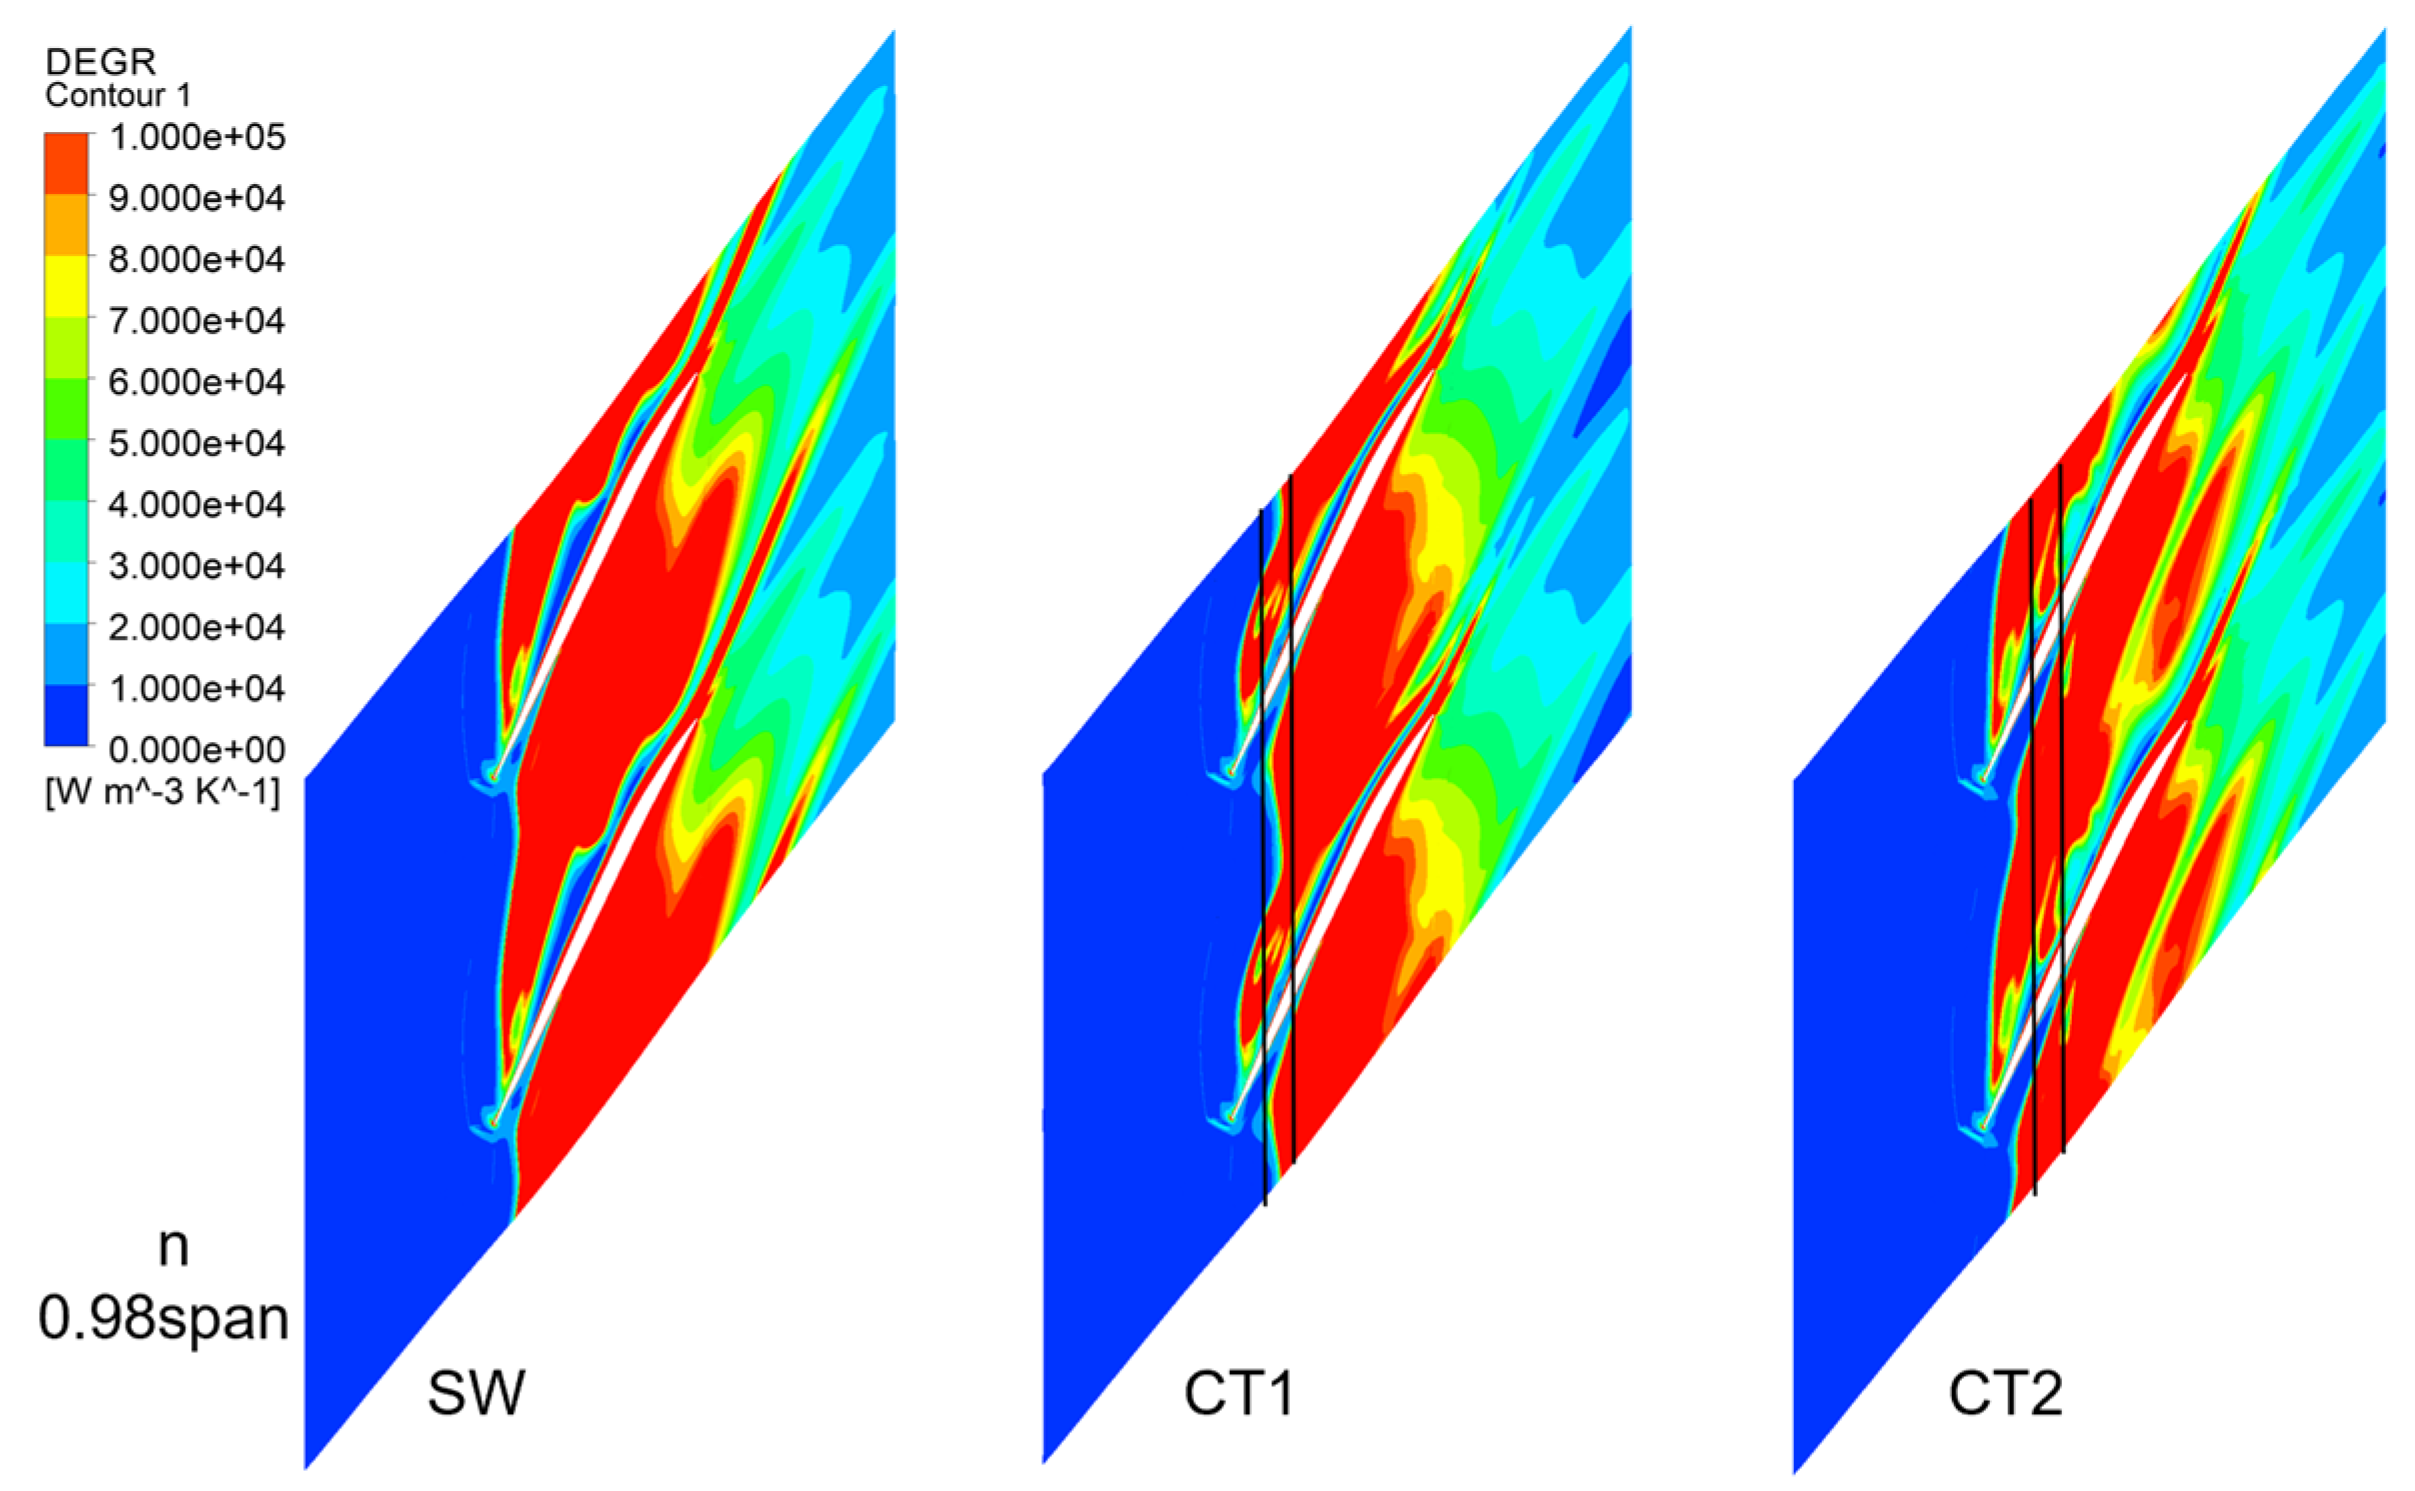
The DEGR distribution of SW (solid wall) and the two CTs under PE condition at three speeds are presented in Figure 11, Figure 12 and Figure 13 to facilitate a comprehensive analysis of the impact of CTs on shock wave/boundary layer interference. It demonstrates that CT2 effectively mitigates the occurrence of high DEGR regions prior to reaching the midpoint of the blade’s chord length.

3.3.3. The Effect on Stability

The influence of the two CTs on the stability margin of the compressor at the three speeds is presented in Table 2. It can be observed that CT1, designed for the DEGR jump line, exhibits a superior stability expansion ability compared to CT2 across all three speeds. Figure 14 illustrates the DEGR distribution along flow direction on the NS condition of SW and the two CTs with identical mass flow rates. This figure provides insights into how these two CTs affect the overall DEGR distribution. At identical mass flow rates, a significant change in overall DEGR distribution occurs due to variations in 1.0n rotational speed, which has a pronounced effect on the stability of the compressor. Comparatively, CT1 demonstrates greater reduction in the DEGR near the leading edge of blade tip compared to CT2, aligning with its enhanced stability expansion ability. Both CTs effectively mitigate high DEGR levels at various positions along streamwise. At the 0.7n and 0.4n speeds, the peak values of DEGR are reduced by both CTs. Compared with CT2, CT1 yields better results and consistently aligns with improved stability expansion outcomes (Table 2).
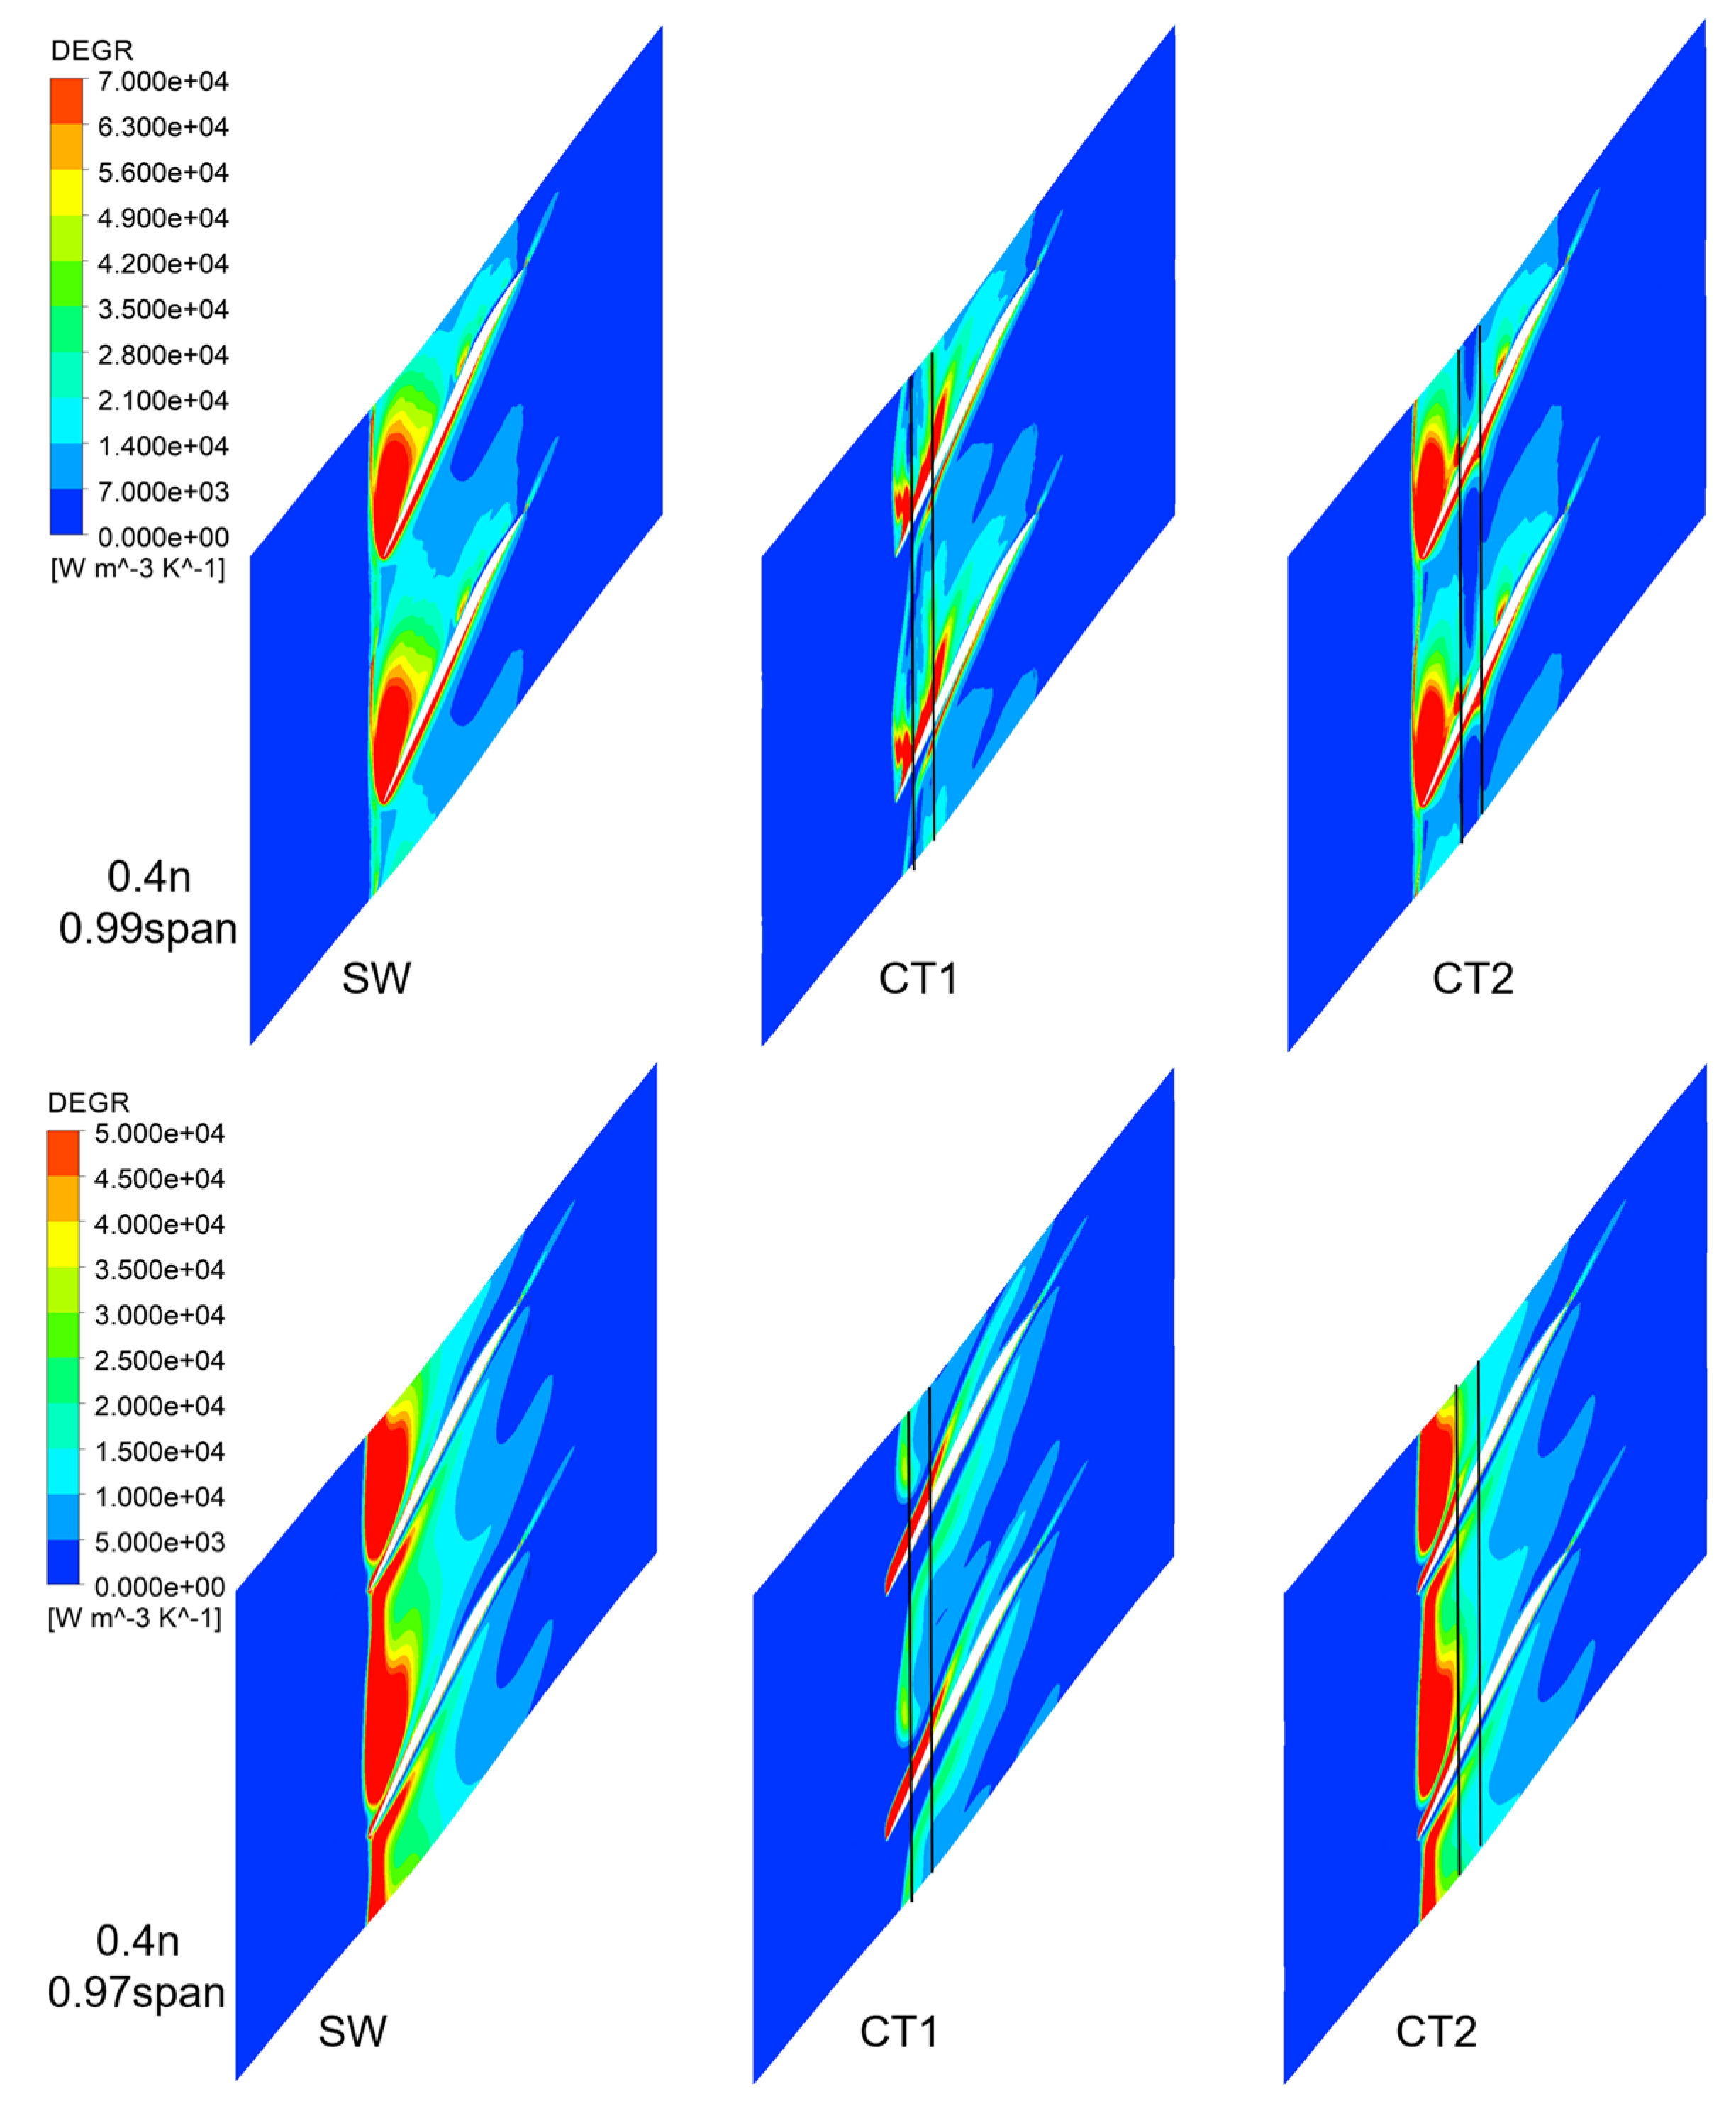
The DEGR distribution near the tip at NS condition is illustrated in Figure 15, Figure 16 and Figure 17 for three different rotating speeds. It can be observed from Figure 15 that CT1 exerts a greater influence on the tip leakage vortex compared to CT2, primarily due to its more forward position and larger circumferential coverage on the tip leakage vortex. Furthermore, as depicted in Figure 16, CT1 significantly reduces high DEGR levels at both 0.99span and 0.97span positions, while CT2, being positioned further back, only impacts the high DEGR region near the tip (at 0.99span). When operating at a speed of 0.4n, CT1 demonstrates superior inhibition effects on the high DEGR jump line caused by the tip leakage vortex and flow with large angles of attack compared to CT2 [21]. The outcome aligns with our design expectations.

4. Conclusions

In this paper, the NASA Rotor67 is used as a model to analyze its multi-speed DEGR characteristics. Two typical working conditions were analyzed: the PE condition and the NS condition. In order to improve the efficiency of high speed, CT2 was designed, while CT1 was designed for the purpose of extending the stall margin. Both adopt the form of the circumferential groove. The conclusions are as follows:
Firstly, The DEGR value of the compressor with smooth casing at 1.0n speed is significantly greater than at 0.7n and 0.4n. The primary source of loss is attributed to shock wave/boundary layer interactions. The demarcation lines of DEGR are observed at all speeds at NS condition, which can be used as an indicator of stall onset.
Secondly, By placing a casing groove, CT2, on top of the axial location where the passage shock waves intersect with the blade’s suction surface, CT2 can effectively mitigate the losses caused by shock wave/boundary layer interference and improve the peak efficiency at 1.0n speed.
Thirdly, CT1 is located near the leading edge of the blade tip, which can effectively defer the advance of the DEGR demarcation lines, thus suppressing the stall onset for all speeds.

Author Contributions

J.M. performed all the numerical computations and wrote manuscript. F.L. proposed the research ideas and gave guidance. Y.W. proposed revisions and proofread the data and text. All authors have read and agreed to the published version of the manuscript.

Funding

This project was supported by Fujian Provincial Natural Science Foundation of China [grant number 2020H6015 and 2022I0018], the Jimei University research start-up fund (J.M.), and the Jimei University research start-up fund (F.L.).

Data Availability Statement

The data that support the findings of this study are openly available in Baidu Netdisk at https://pan.baidu.com/s/1oTMfS87Xmc9bqcvXzeq7_Q (accessed on 18 July 2024), code number [mq9u].

Conflicts of Interest

Author Yongsheng Wang is employed by the company Zhejiang Rongda Yongneng Compressor. The remaining authors declare that the research was conducted in the absence of any commercial or financial relationships that could be construed as a potential conflict of interest.

Nomenclature

α Thermal diffusivity, (m2/s)
α t Thermal diffusivity of the fluctuating temperature, (m2/s)
θ Dimensionless temperature, (K)
λ Thermal conductivity, (J s−1 m−1 K−1)
μ Dynamic viscosity, (kg m−1 s−1)
Φ ¯ θ Entropy production term, (WK/m3)
n Rotation speed, (rpm)
S ˙ i r r , D Entropy production rate by turbulent dissipation, (W/(m3 K))
S ˙ i r r , D ¯ Entropy production rate by viscous dissipation,(W/(m3 K))
S ˙ P R O , C Entropy production rate by heat transfer with gradients of the fluctuating temperature, (W/(m3 K))
S ˙ P R O , C ¯ Entropy production rate by heat transfer with mean temperature gradients, (W/(m3 K))
T Bulk temperature, (K)
u’, v’, wLocal fluctuating velocity component, (m s−1)
u ¯   v ¯   w ¯ Local average velocity component, (m s−1)
x y zCoordinate vector component, (m)
Abbreviations
CTCasing treatment
DEGRDifferential entropy generation rate
SWSolid wall
NSNear stall
PEPeak efficiency
R67NASA Rotor 67
Subscripts
i r r , D Turbulent dissipation
i r r , D ¯ Viscous dissipation
PRO, CHeat transfer with gradients of the fluctuating temperature
PRO,   C ¯ Heat transfer with mean temperature gradients

References

  1. Yoon, S.; Cargill, P. Casing treatment: Its potential and limitations. J. Turbomach. 2023, 145, 041011. [Google Scholar] [CrossRef]
  2. Cevik, M.; Duc Vo, H.; Yu, H. Casing treatment for desensitization of compressor performance and stability to tip clearance. J. Turbomach. 2016, 138, 121008. [Google Scholar] [CrossRef]
  3. Guo, Y.C.; Mao, X.C.; Gao, L.M. Numerical investigation on the cross-stage self-recirculating casing treatment for a counter-rotating axial compressor. Aerosp. Sci. Technol. 2023, 135, 108161. [Google Scholar] [CrossRef]
  4. Zhang, H.; Wang, H.; Dong, F.; Jing, F.; Chu, W. Mechanism study on the effect of self-circulating casing treatment with different circumferential coverage ratios on the axial compressor stability. Phys. Fluids 2023, 35, 05611. [Google Scholar]
  5. Nan, X.; Ma, N.; Lin, F.; Himeno, T.; Watanabe, T. A new approach of casing treatment design for high speed compressors running at partial speeds with low speed large scale test. Aerosp. Sci. Technol. 2018, 72, 104–113. [Google Scholar] [CrossRef]
  6. Liu, L.; Li, J.C.; Lin, F. The stall inceptions in an axial compressor with single circumferential groove casing treatment at different axial locations. Aerosp. Sci. Technol. 2016, 59, 145–154. [Google Scholar] [CrossRef]
  7. Du, J.; Gao, L.; Li, J.; Lin, F.; Chen, J. Initial selection of groove location combination for multi-groove casing treatments. Mech. Sci. Technol. 2016, 30, 697–704. [Google Scholar] [CrossRef]
  8. Houghton, T.; Day, I. Stability enhancement by casing grooves: The importance of stall inception mechanism and solidity. Turbomach 2012, 134, 02100. [Google Scholar] [CrossRef]
  9. Ma, N.; Nan, X.; Lin, F. Numerical study on effects of axial-slot casing treatment on peak efficiency of axial compressors. In Turbo Expo: Power for Land, Sea, and Air; American Society of Mechanical Engineers: New York, NY, USA, 2016; Volume 02A, p. 11. [Google Scholar]
  10. Nan, X.; Ma, N.; Li, J.; Liu, L.; Lin, F. Evaluation of the effectiveness of typical casing treatments for a low-speed compressor by an integral method. Aerosp. Sci. Technol. 2016, 52, 234–242. [Google Scholar] [CrossRef]
  11. Zhang, Q.; Du, J.; Li, Z.; Li, J.; Zhang, H. Entropy generation analysis in a mixed-flow compressor with casing treatment. Therm. Sci. 2019, 28, 915–928. [Google Scholar] [CrossRef]
  12. Kendall-Torry, C.; Gümmer, V. Design of a rear-stage subsonic axial compressor with casing treatments. CEAS Aeronaut. J. 2020, 11, 1083–1096. [Google Scholar] [CrossRef]
  13. Goinis, G.; Voß, C.; Aulich, M. Automated optimization of an axial-slot type casing treatment for a transonic compressor. In Turbo Expo: Power for Land, Sea, and Air; American Society of Mechanical Engineers: New York, NY, USA, 2013; Volume 6B, p. 13. [Google Scholar]
  14. Ma, J.Y.; Lin, F. Loss analysis of a transonic rotor with a differential approach to entropy generation. Machines 2023, 11, 472. [Google Scholar] [CrossRef]
  15. Ma, J.Y.; Lin, F. The differential entropy generation rate as a unified measure for both the stability and efficiency of an axial compressor. Machines 2023, 11, 815. [Google Scholar] [CrossRef]
  16. Strazisar, A.J.; Wood, J.R.; Hathaway, M.D.; Suder, K.L. Laser Anemometer Measurements in a Transonic Axial-Flow Fan Rotor; NASA Technical Paper; 2879; NASA: Washington, DC, USA, 1989. [Google Scholar]
  17. Kock, F.; Herwig, H. Local entropy generation in turbulent shear flows: A high-reynolds number model with wall functions. Int. J. Heat Mass Transf. 2004, 47, 2205–2215. [Google Scholar] [CrossRef]
  18. Herwig, H.; Schmandt, B. How to determine losses in a flow field: A paradigm shift towards the second law analysis. Entropy 2014, 16, 2959–2989. [Google Scholar] [CrossRef]
  19. Schmandt, B.; Herwig, H. Losses due to conduit components: An optimization strategy and its application. Fluids Eng. 2016, 138, 031204. [Google Scholar] [CrossRef]
  20. Hah, C. Stall margin improvement in a transonic compressor with a casing treatment: Flow mechanism. Turbomach 2023, 145, 041004. [Google Scholar] [CrossRef]
  21. Hah, C. Passive controls of tip clearance flow in a transonic compressor for stall margin improvement: Common flow physics. In Turbo Expo: Power for Land, Sea, and Air; American Society of Mechanical Engineers: New York, NY, USA, 2023; Volume 13A, p. 14. [Google Scholar]
Figure 1. The model and numerical simulation method validation [15]. (a) Single passage of the R67 model [15]. (b) Compressor characteristics validated using experimental data [15].
Machines 12 00673 g001
Figure 2. Compressor multi-speed characteristic lines.
Machines 12 00673 g002
Figure 3. DEGR distribution along the flow direction corresponding to the three rotating speeds at PE and NS conditions. (a) PE. (b) NS.
Machines 12 00673 g003
Figure 4. DEGR distribution along the span corresponding to the three speeds at the highest point of DEGR in Figure 2. (a) PE. (b) NS.
Machines 12 00673 g004
Figure 5. DEGR and Ma distribution of three speeds at PE condition on 0.995span. (a) n speed. (b) 0.7n speed. (c) 0.4n speed.
Machines 12 00673 g005
Figure 6. DEGR and Ma distribution of three span heights at n speed in PE condition.
Machines 12 00673 g006
Figure 7. DEGR distribution of n speed near the tip at NS condition.
Machines 12 00673 g007
Figure 8. DEGR distribution of 0.7n speed near the tip at NS condition.
Machines 12 00673 g008
Figure 9. DEGR distribution of 0.4n speed near the tip at NS condition.
Machines 12 00673 g009
Figure 10. The location of the two casing grooves.
Machines 12 00673 g010
Figure 11. DEGR distribution of SW and the two CTs on PE condition at n speed.
Machines 12 00673 g011
Figure 12. DEGR distribution of SW and the two CTs on PE condition at 0.7n speed.
Machines 12 00673 g012
Figure 13. DEGR distribution of SW and the two CTs on PE condition at 0.4n speed.
Machines 12 00673 g013
Figure 14. DEGR distribution along flow direction on the NS condition of SW and the two CTs with identical mass flow rates. (a) n speed. (b) 0.7n speed. (c) 0.4n speed.
Machines 12 00673 g014
Figure 15. DEGR distribution near the tip on n speed at NS condition.
Machines 12 00673 g015
Figure 16. DEGR distribution near the tip on 0.7n speed at NS condition.
Machines 12 00673 g016
Figure 17. DEGR distribution near the tip on 0.4n speed at NS condition.
Machines 12 00673 g017
Table 1. The influence on efficiency of the two CTs on the PE condition of the three speeds.
Rotating SpeedEfficiency Change of CT1Efficiency Change of CT2
n−0.040.11
0.7n−0.02−0.02
0.4n−0.04−0.03
Table 2. The influence on efficiency of the two CTs on the PE condition of three speeds.
Rotating SpeedStability Margin of CT1Stability Margin of CT2
n12.02%8.32%
0.7n6.78%4.21%
0.4n3.13%3.04%
Disclaimer/Publisher’s Note: The statements, opinions and data contained in all publications are solely those of the individual author(s) and contributor(s) and not of MDPI and/or the editor(s). MDPI and/or the editor(s) disclaim responsibility for any injury to people or property resulting from any ideas, methods, instructions or products referred to in the content.