Article

Optimization of the Synchronous Pressurization Process for the Elimination of Double-Layer Oxide Film Defects

1
National Key Laboratory for Precision Hot Processing of Metals, Harbin Institute of Technology, Harbin 150001, China
2
School of Materials Science and Engineering, Harbin Institute of Technology, Harbin 150001, China
3
School of Physics, Harbin Institute of Technology, Harbin 150001, China
4
National Key Laboratory of Space Environment and Matter Behaviors, Harbin Institute of Technology, Harbin 150001, China
5
School of Materials Science and Engineering, Jiangsu University, Zhenjiang 212000, China
6
School of Materials Science and Engineering, North University of China, Taiyuan 030051, China
*
Authors to whom correspondence should be addressed.
Machines 2024, 12(10), 702; https://doi.org/10.3390/machines12100702
Submission received: 29 August 2024 / Revised: 28 September 2024 / Accepted: 30 September 2024 / Published: 3 October 2024
(This article belongs to the Section Advanced Manufacturing)

Abstract

:
The counter-pressure casting (CPC) process has the technical advantages of smooth filling and solidification under pressure, which is conducive to obtaining high-quality castings. In the counter-pressure casting process, the way of fixed solenoid valve opening is used for synchronous pressurization at present. However, this synchronous pressurization method causes the melt to rise first in the transfer tube and then fall back. The falling process of the melt will lead to the formation of the double-layer oxide films on the melt surface. In the subsequent pouring stage, part of the double-layer oxide films will enter the inside of the casting to form defects. To solve this problem, the synchronous pressurization process was optimized. Combined with numerical simulation and measurement results, the influence of two kinds of processes on melt rise behavior in transfer tubes before and after optimization is compared. The optimized process can reduce the rise height of melt by about 90% in the process of synchronous pressurization and change the flow behavior of melt so that the melt is always filled forward and the fall of melt is eliminated. Furthermore, the formation of double-layer oxide films in the melt during synchronous pressurization is eliminated.

1. Introduction

With the development of industry, for light alloy castings, it is the current technical trend to combine multiple castings into one casting [1]. This makes the volume of castings become larger and more complex; at the same time, the metallurgical quality of castings also puts forward higher requirements. At present, the low-pressure casting process and counter-pressure casting process are particularly effective in solving large and complex thin wall castings [2,3]. Low-pressure casting has a smooth and controlled filling process, which can effectively reduce air entrapment defects [4]. Compared with low-pressure casting, counter-pressure casting is a relatively new casting process [5]. Based on the controllable filling process of low-pressure casting, counter-pressure casting combines low-pressure casting and pressure kettle casting, which can make the melt solidify under pressure, help to obtain dense castings, and greatly improve the metallurgical quality and mechanical properties of castings [6,7].
The structure of counter-pressure casting equipment is shown in Figure 1a. The equipment is divided into two independent zones, the pouring zone and the melting zone, through the middle sealing diaphragm and locking system. The pouring zone is used to house the mold, and the melting zone is used to house the melt, which is connected to the mold and melt by means of the transfer tube. Through the external control system and pipes, the pouring zone and the melting zone can be independently pressurized, depressurized, and connected [8]. As shown in Figure 1b,c, the counter-pressure casting process is divided into the following steps:
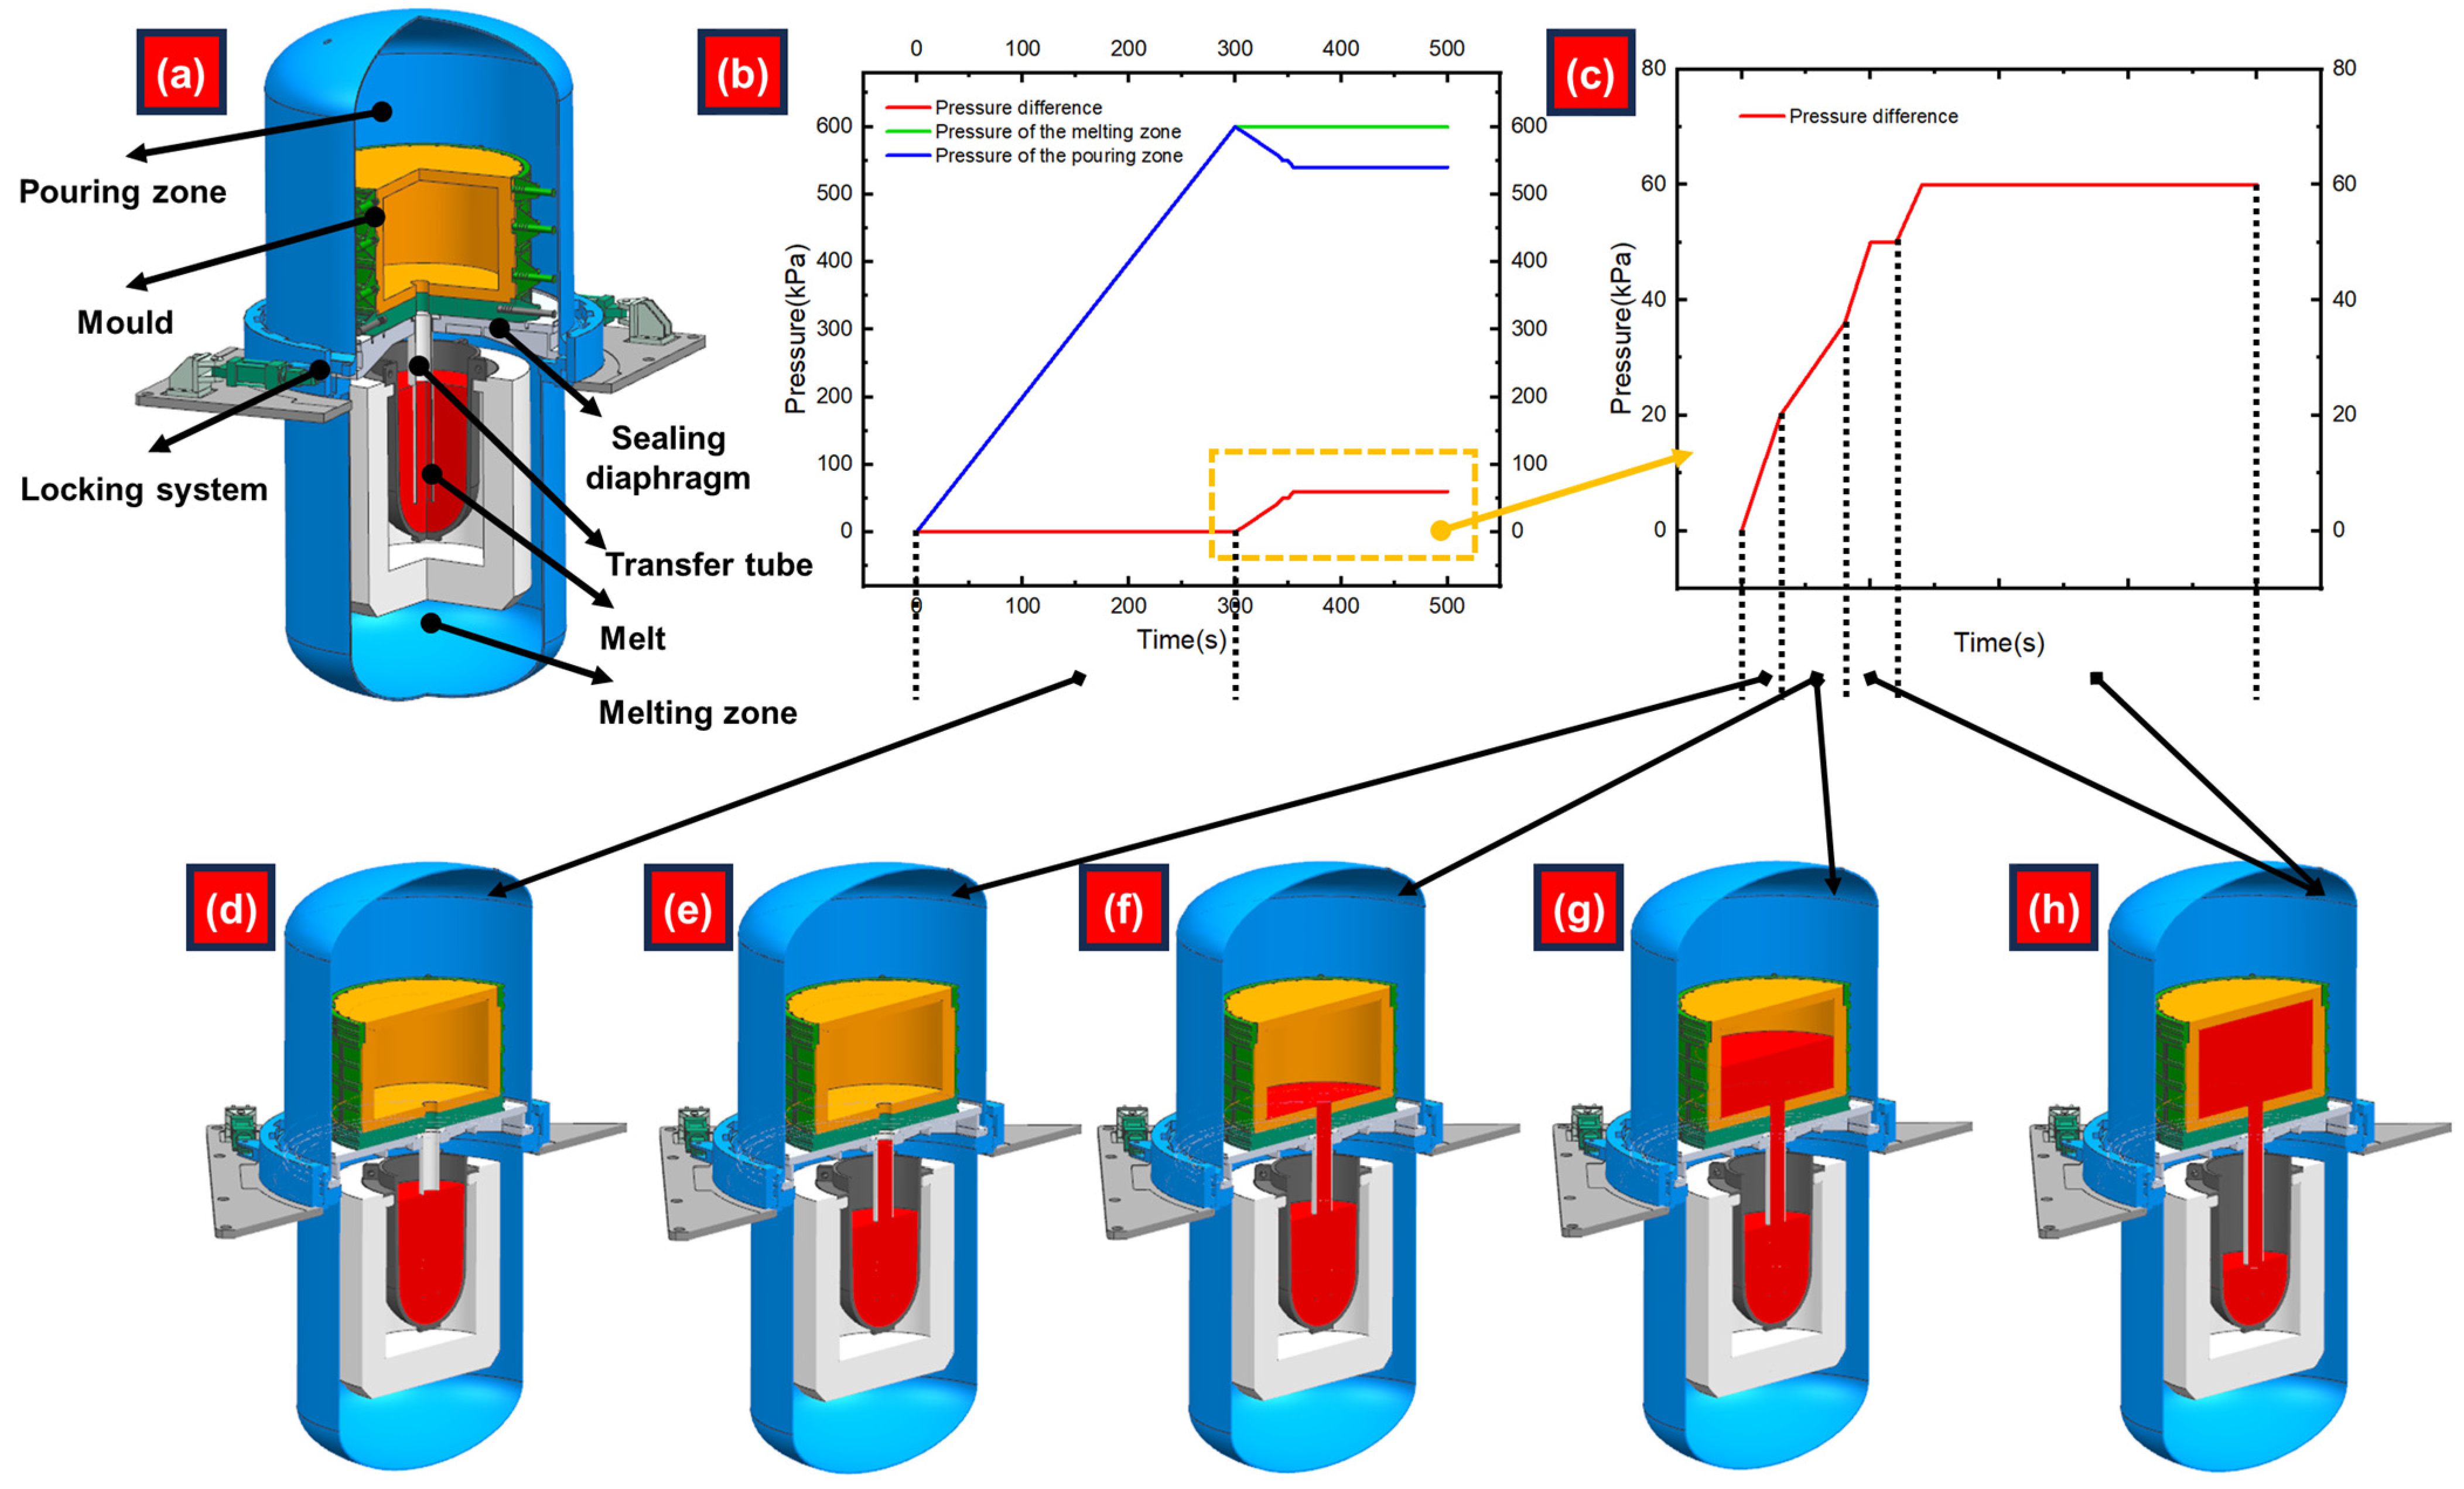
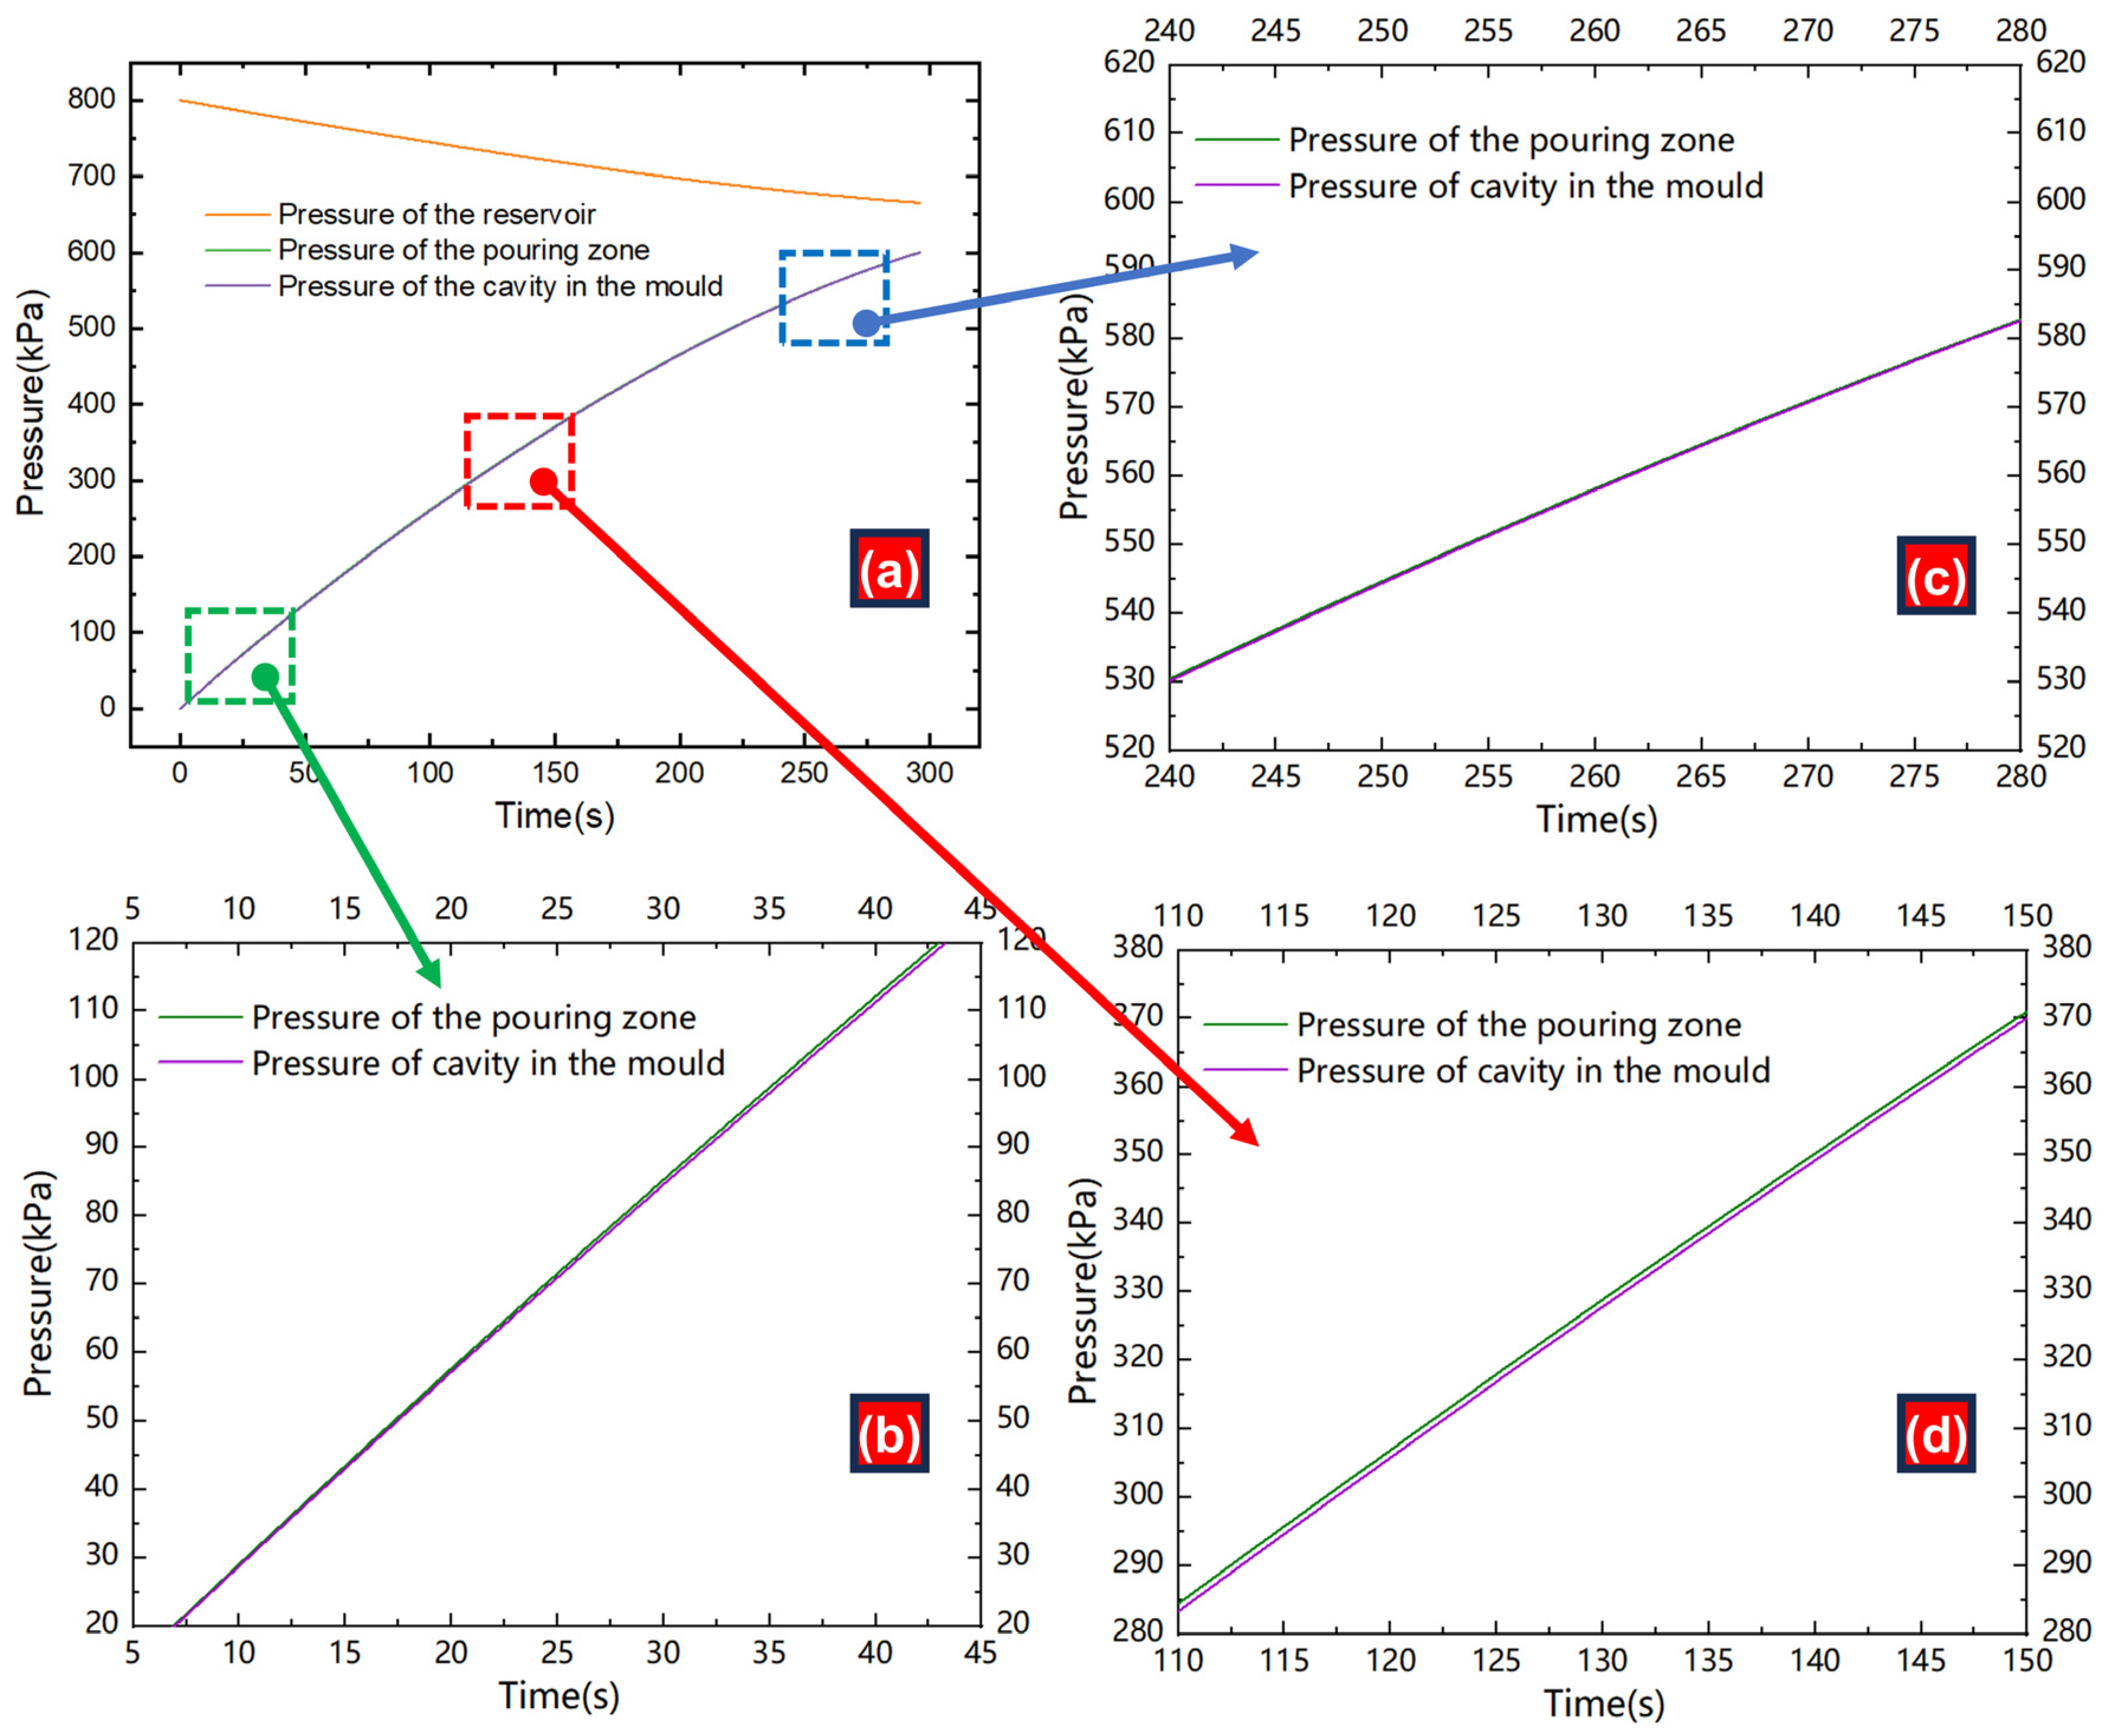
  • In the synchronous pressurization stage, the control system connects the pouring zone and the melting zone and pressurizes them to 600 kPa, as shown in Figure 1d;
  • In the stage of filling the riser with melt, the control system keeps the pressure of the melting zone unchanged and makes the melt rise in the transfer tube by reducing the pressure of the pouring zone, as shown in Figure 1e;
  • In the stage of filling the cavity with melt, the control system continuously reduces the pressure of the pouring zone and makes the melt continue to rise to fill the cavity, as shown in Figure 1f,g;
  • In the pressurization and pressure holding stage, a layer of solid metal is formed between the melt and the mold through the first pressurization and a short time of pressure holding, and then between the second pressurization and a long time of pressure holding, as shown in Figure 1h. This process can improve the surface quality of the casting while improving the melt feeding pressure.
Compared with low-pressure casting, the counter-pressure casting process has a synchronous pressurization process. At present, the synchronous pressurization process is to first open the valve between the pouring zone and the melting zone, then open the fixed caliber solenoid valve, and synchronically raise the pouring zone and the melting zone to the pressure value required by the process (generally 0.6 mPa) [9]. In this process, due to the limited permeability of the sand mold, there will be a difference between the pressure in the pouring zone and the pressure in the sand mold. This difference will cause the melt to fluctuate, and the double-layer oxide film is formed on the melt surface during the falling process [10]. In recent years, the defects of double-layer oxide film have been paid more and more attention. Taking aluminum alloy as an example, the part of a liquid metal surface in contact with air will react quickly with oxygen to form a layer of alumina film. During the filling process, when turbulent flow occurs due to the excessive flow rate of liquid metal, part of the oxide film will be involved in the interior of the liquid metal. The double-layer oxide films are formed. In addition, the free surface volume shrinkage caused by liquid level fluctuations can also cause this to occur. Part of the double-layer oxide films will form the double-layer oxide film defect in the casting, and this kind of defect will seriously reduce the mechanical properties of the casting [11,12]. Numerous studies have been conducted to eliminate double oxide film defects by controlling the gating velocity. Fox et al. used a reduced pressure test to reveal the presence of double oxide film defects and predict the potential for the formation of hydrogen porosity in aluminum alloy castings [13]. Oxide film defects were also found in tilt pouring of TiAl casting and the entrained oxide films contribute to the formation of shrinkage [14]. It has been proved that the mechanical properties of aluminum and magnesium alloy castings can be improved by controlling the gating velocity through low-pressure casting [15,16]. Bahreinian demonstrated that the critical gating velocity of aluminum alloys is 0.5 m/s, through experimental observation of the filling processes of an open space controlled by a bottom gating system [17]. However, the defects of the double-layer oxide film produced in the process of synchronous pressurization have not been paid enough attention.
Recently, much research has been conducted to optimize counter-pressure casting processes based on simulation and coupled experiments. Luo et al. summarized the advances in casting simulation and the concept of Integrated Computational Materials Engineering (ICME) for counter-pressure casting applications [1]. Fu et al. and Zhang et al. studied the effects of low-pressure casting process parameters on the mechanical properties, microstructure, and residual stress of castings with simulation and experiments [18,19]. Kuo et al. developed an interactive computer simulation system to aid the determination of the pressure–time relationship during the filling of a low-pressure casting to eliminate filling-related defects while maintaining its productivity [20]. Liu et al. studied the effects of hollow sand mold on the microstructure and mechanical properties of low-pressure casting through experiments [21]. Dong et al. optimized the pressure holding time and cooling processes of the low-pressure die-casting process of the wheel hub with simulation and experimental coupling methods [22]. Moreover, a machine learning-based design strategy has been proposed for the gating system design of counter-pressure casting [23].
In this study, the process optimization of synchronous pressurization in the counter-pressure casting process was mainly carried out. Firstly, the permeability of the sand mold is measured and equivalent to the corresponding area of the hole. Based on this, the pressure difference between the pouring zone and the mold in the process of synchronous pressurization was quantitatively calculated by numerical simulation technology. The influence of pressure difference on melt flow behavior was analyzed to optimize the process curve of synchronous pressurization. By changing the process curve of synchronous pressurization, the flow behavior of melt in the process of synchronous pressurization can be changed. With the process after optimization, the defects of double-layer oxide film formed in castings during synchronous pressurization can be eliminated.

2. Experimental Methods

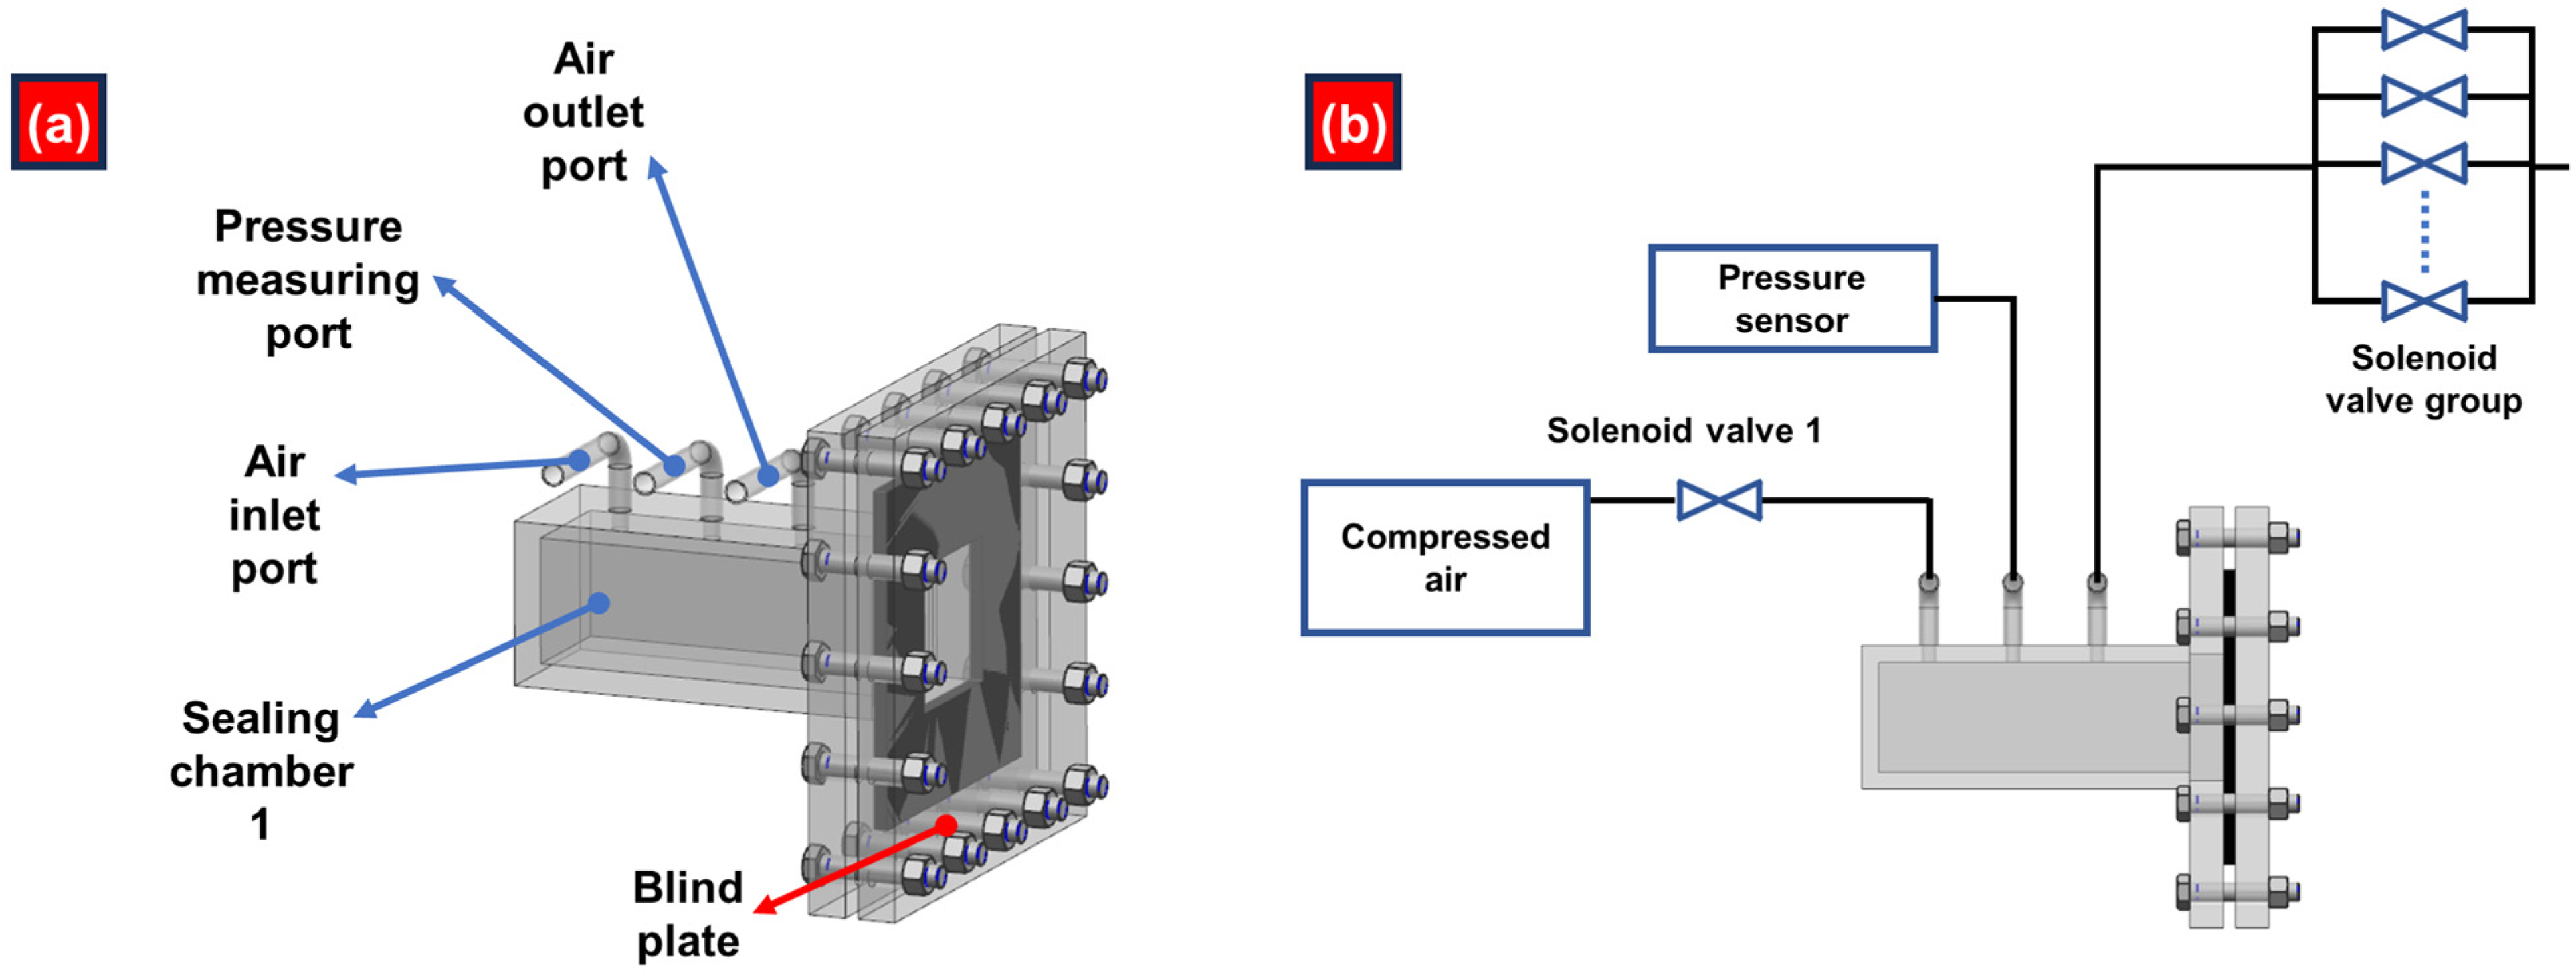
2.1. Sand Permeability Test Device and Method

The experimental device shown in Figure 2a was used to measure the permeability of sand mold with different thicknesses. There are two independent chambers on both sides of the device: the left closed chamber 1 is the intake end and the right closed chamber 2 is the exhaust end. The intake end has 3 interfaces: 2 ports for measuring gas pressure and 1 port for passing compressed air. The exhaust end has 2 ports, 1 port for measuring gas pressure and 1 port for discharging compressed air. The middle part is two flanges, which are used to clamp the sand mold by bolts. A silicone rubber gasket is placed between the sand mold and the flange to ensure the tightness between them, as shown in Figure 2b.
As shown in Figure 2c, the air inlet port is connected to the solenoid valve 1 and the compressed air, and pressure measuring port 1 is connected to the pressure sensor. Pressure measuring port 2 and pressure measuring port 3 are connected to the differential pressure sensor, where the air inlet port is connected to the positive electrode of the sensor, and the exhaust port is connected to the negative electrode of the sensor. The air outlet port at the exhaust end is connected to the solenoid valve 2.
The specific measurement process is as follows:
  • The solenoid valve 1 is open, the solenoid valve 2 is closed, the control pressure sensor value is 120 kPa, and the differential pressure sensor value is 0 kPa;
  • The solenoid valve 1 is closed, the solenoid valve 2 is open; when the differential pressure sensor increases from 0 kPa to the peak value, start to record the real-time data of the differential pressure sensor, record the value every 0.5s, until the differential pressure sensor data drops to 0 kPa.

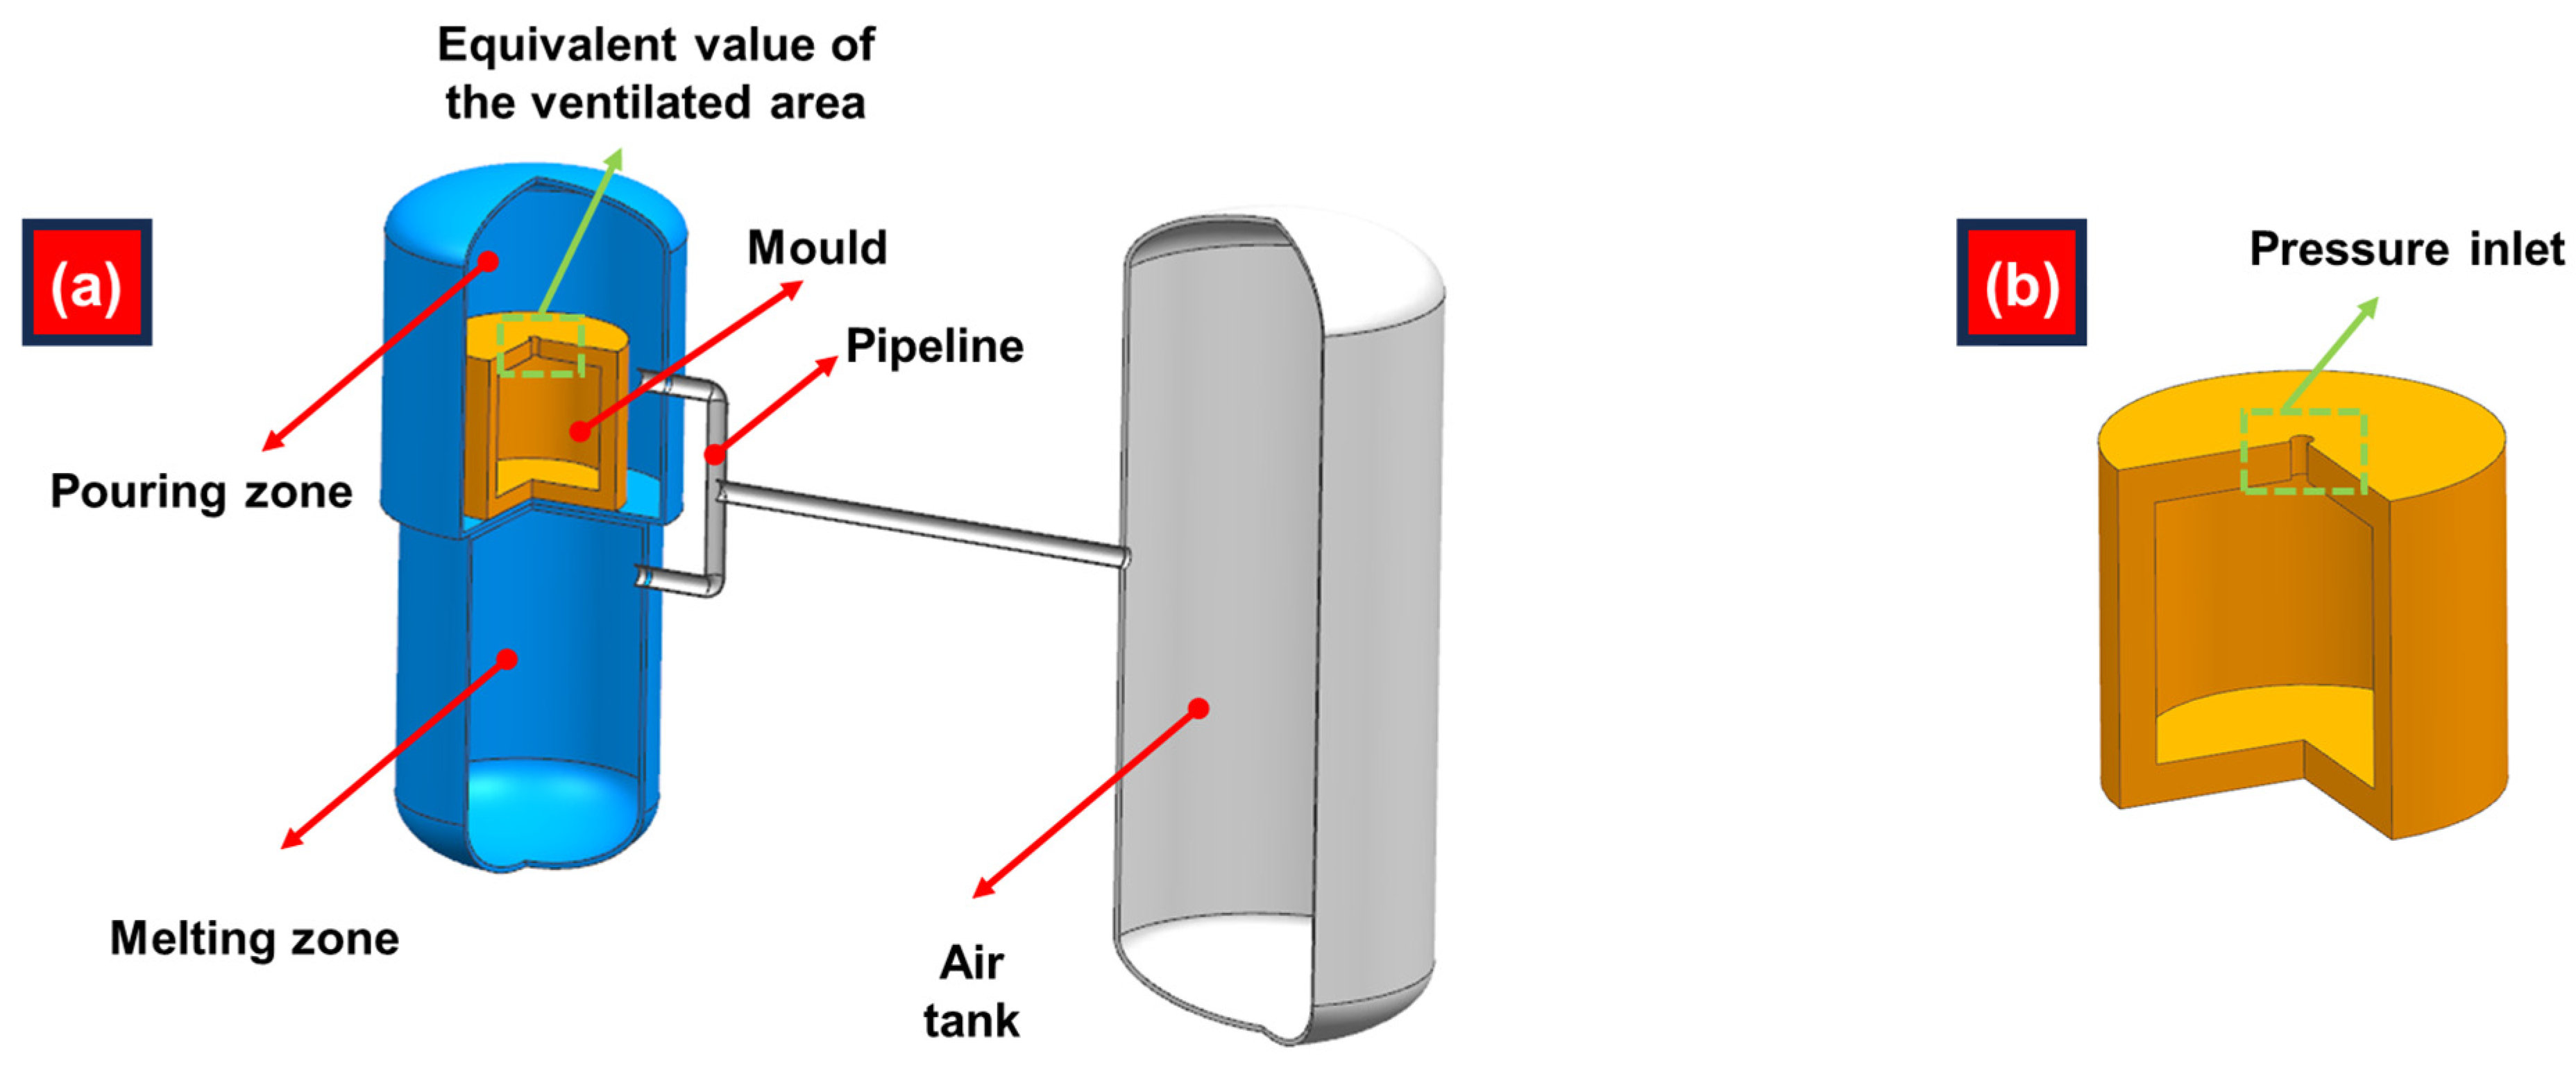
2.2. Device and Method for Equivalent Measurement of Sand Permeability and Effective Pore Area

The permeability of sand mold is equivalent to an effective pore area by the experimental device shown in Figure 3a. The device borrows chamber 1 of the sand mold permeability testing device. On the right side is a blind plate, and a sealing gasket is installed between the flange and the blind plate. The connection mode of each part of the working process is shown in Figure 3b. The air inlet hole is connected to compressed air, the pressure measuring hole is connected to the pressure sensor, and the exhaust hole is connected to the solenoid valve group.
The specific measurement process is as follows:
  • Raise the pressure in sealed chamber 1 to 100 kPa;
  • The air permeability equation of the sand mold with the corresponding thickness is simulated and input into the control system as the target value, and the control solenoid valve group tracks the corresponding equation to exhaust the gas until the pressure is 0 kPa;
  • Record the opening and closing date of the solenoid valve group and calculate the overall effective cross-sectional area; the air permeability of the corresponding thickness of the sand mold is equivalent to the effective pore area.

2.3. Preparation of Sand Mold

A total of 5 thickness sand mold thicknesses was tested, and PEP-SET resin self-hardening sand was used for modeling; the specific size is shown in Table 1. The sand mold is made of 80 mesh sand with 1 wt% binder added. The structure of the sand mold is shown in Figure 4, and metal plates are fixed around it. Before fixing, the sand mold is coated with silicone rubber on all sides, the metal plate is fixed with bolts, and the silicone rubber is fixed for 24 h. The sand mold of this structure ensures an air inlet on one side and an air outlet on one side, which can more accurately measure the influence of sand thickness on air permeability.

2.4. Mathematical Model of the Simulation Process

The physical model of numerical simulation of the process before optimization is shown in Figure 5a. The connecting pipeline between the pouring zone and the melting zone achieves pressure balance and joint pressurization. The initial parameters are shown in Table 2. The physical model of the numerical simulation of the optimized process is shown in Figure 5b, the outer diameter of the sand mold is 1800 mm, the height is 1600 mm, and the wall thickness is 140 mm. The optimized process is pressurized synchronously by controlling the pressure in the pouring chamber. In this condition, only the process of pressure diffusion into the sand mold needs to be calculated. Since the process curve of synchronous pressurization has been given, the pressure inlet condition is set at the vent of the sand mold. The equivalent ventilation area is calculated by measuring the air permeability per unit area of the sand mold and the surface area of the sand mold used in the experiment. Because the side and bottom of the sand mold are in close contact with the sandbox during the molding process, only the upper surface of the sand mold is considered in the calculation of the equivalent air permeability area. Ansys Fluent software (2022 R1) was used for numerical simulation. The meshing process uses tetrahedral meshes, and the number of grids is 1,897,431. In the calculation of the process before optimization, all the boundary conditions pertain to the wall. In the calculation of the optimized process, the inlet is the pressure inlet and the other boundary conditions are the wall.
The gas flow of the numerical simulation process is calculated using the k-ε model [24] shown in Equation (1).
ρ K t + ρ u j ¯ K x j = x j μ + μ t P r K K x j + P K + G b ρ ε Y M
where ρ is the fluid density, K is the turbulent kinetic energy, t is the time, u j ¯ is the velocity vector, x is the spatial coordinate, μ is the dynamical viscosity, P K is the turbulent kinetic energy transport term, and ε is the turbulent kinetic energy dissipation term.

2.5. Method for Measuring the Pressure Difference between the Pouring Zone and the Mold

As shown in Figure 6a, the differential pressure sensor is used to measure the pressure difference between the pouring zone and the mold. The seal between the negative electrode of the differential pressure sensor and the tank body is carried out by the flange as shown in Figure 6b. Both sides of the flange are connected with sealed joints. Silicone rubber is applied between the air pipe and the sand mold and is kept at rest for 24 h waiting for it to cure to ensure the sealing between the two.

2.6. Physical Property Parameters of Magnesium Alloys Used in Experiments

The composition of the magnesium alloy used in the experiment is shown in Table 3, and the change in physical property parameters with temperature is shown in Table 4.

3. Results and Discussion

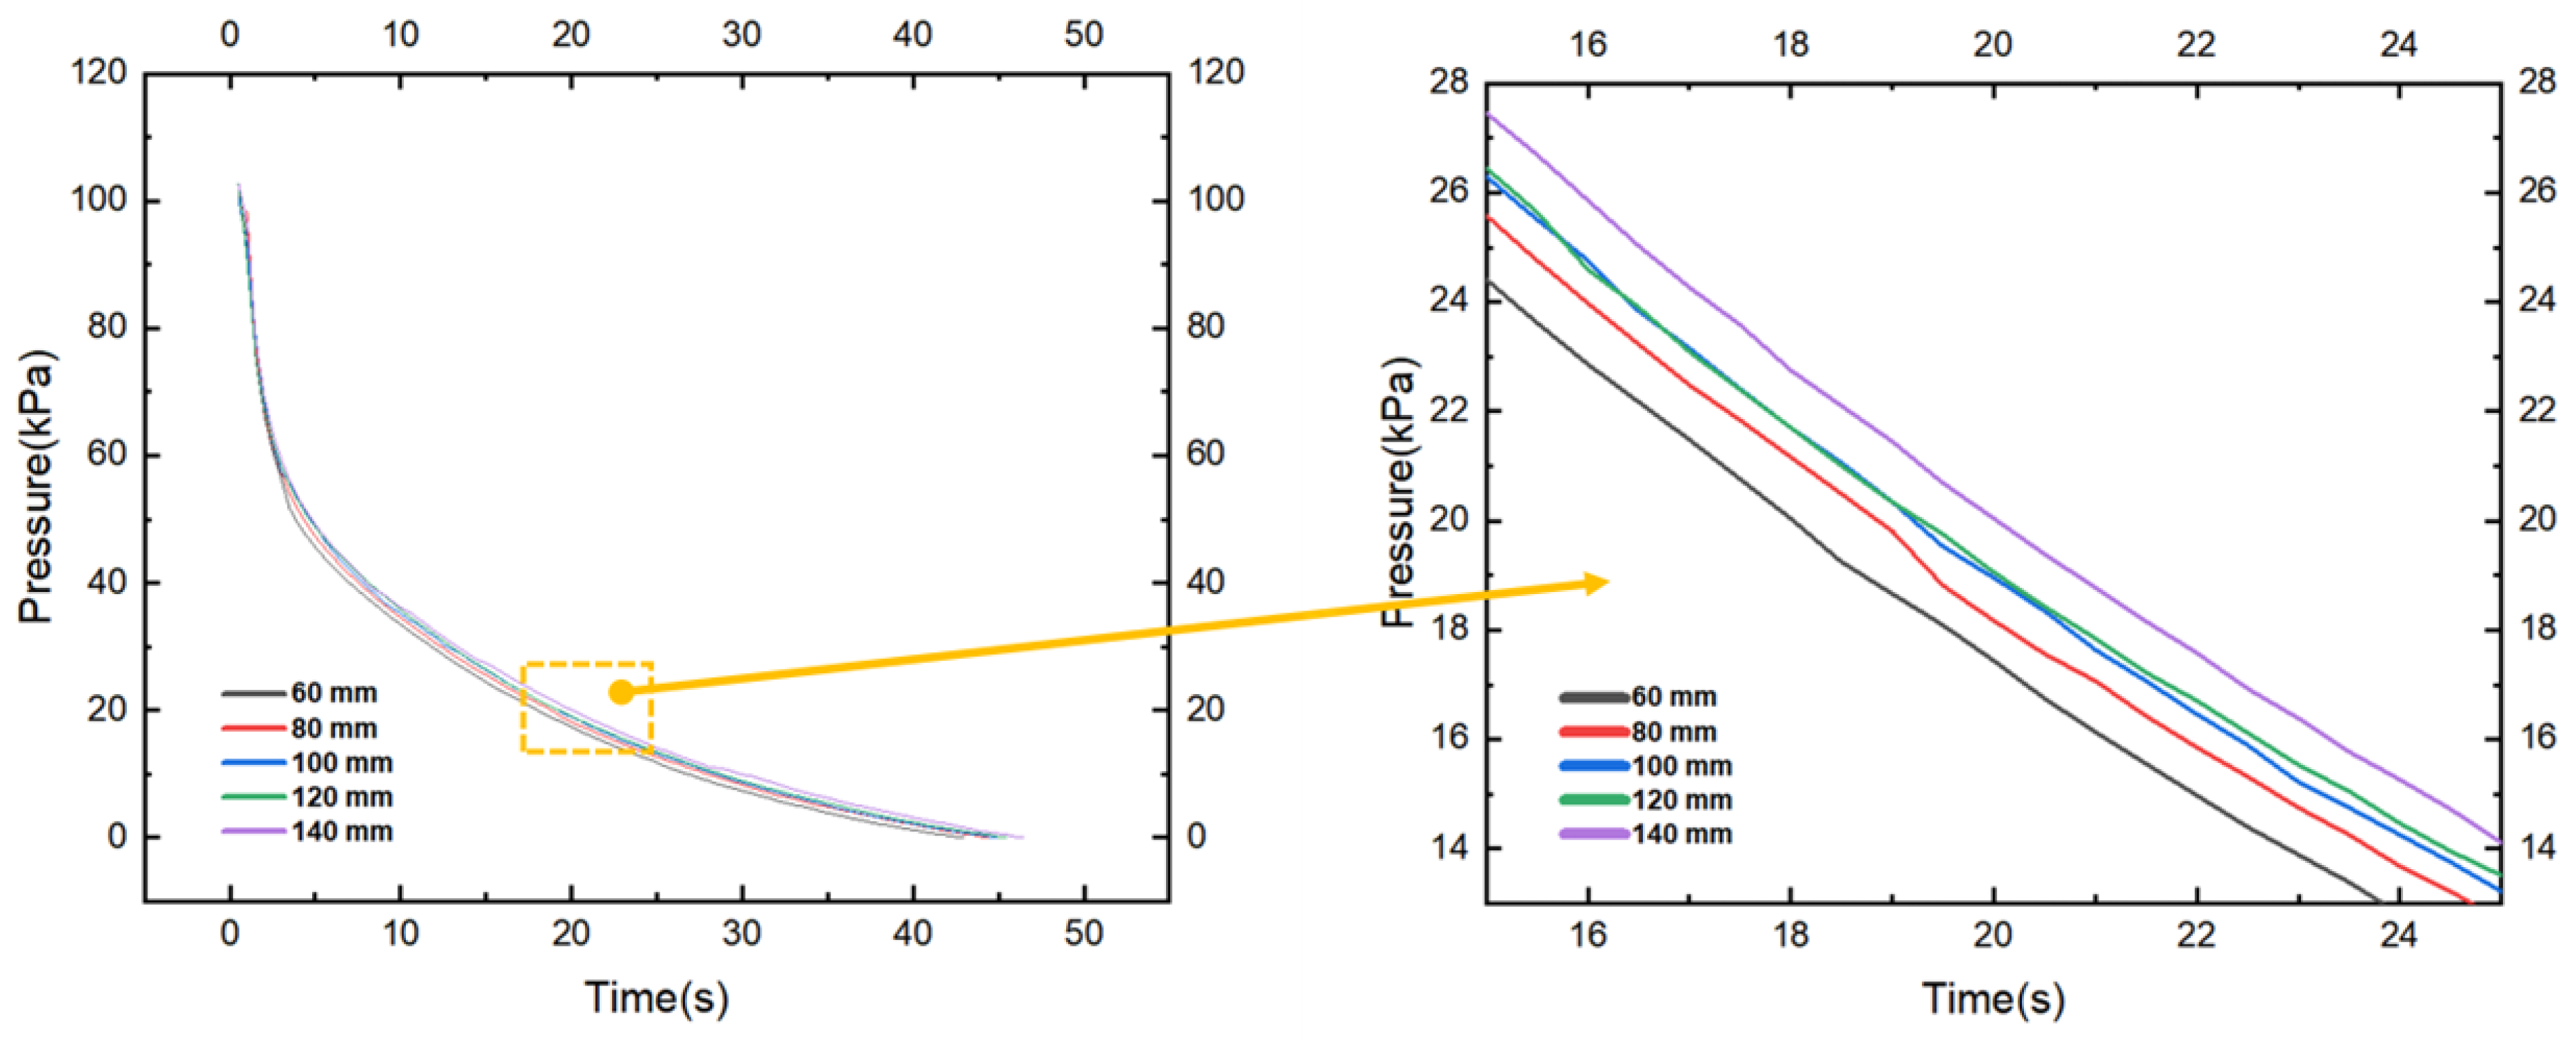
3.1. Permeability of Sand Mold

The measurement results of the air permeability of the five thickness sand molds are shown in Figure 7. The effective volume of the sealing cavity 1 is 60 L, and the time required for the pressure to completely drop to 0 is about 45 s. When the pressure difference between the two sides of the sand mold is greater than 47 kPa, the air permeability of the sand mold with different thicknesses is almost the same. When the pressure difference between the two sides of sand mold is less than 47 kPa, the air permeability of sand mold with different thicknesses is different, and the air permeability gradually decreases with the increase in sand thickness.

3.2. Equivalent Permeability of Sand Mold to Effective Pore Diameter

The air permeability data of five sizes of sand mold are fitted into an exponential function as shown in Equation (2). The parameters of fitting results of sand mold with different thicknesses are shown in Table 5.
y = A 1 exp x t 1 + A 2 exp x t 2 + y 0
where y is the pressure difference between the two sides of the sand mold, x is the time, and t1, t2, and y0 are coefficients in the process of fitting discrete data into continuous functions and have no practical physical significance.
The above five equations are taken as the target values, and the device shown in Figure 3a is used to control the solenoid valve group to control the pressure in the sealing chamber to gradually reduce to 0kPa according to the target curve. Consistent with the sand permeability test, the effective volume of the sealing chamber 1 is also 60 L. The test results of sand mold with thicknesses of 80 mm, 100 mm, 120 mm, 140 mm, and 160 mm are shown in Figure 8a–e. The target curves of each group are in good agreement with the actual pressure curves. The opening number of the solenoid valve gradually becomes stable within 3s until the pressure drops to 0 kPa. This shows that the air permeability of sand mold can be equivalent to a fixed size hole. Furthermore, the average of the open area of the solenoid valve is calculated; the specific calculation formula is shown in Equation (3).
O p e n   a r e a   O A = A n × i = 1 n 1 t i + 1 t i × 1 2 × N x i + 1 + N ( x i )
where t is the time, N is the number of solenoid valve opened, n is the number of data, and A is the effective area of a solenoid valve. The effective area of the solenoid valve used in this experiment is 2.4 mm2, and the number of solenoid valve groups is 20.
The calculation results are shown in Table 6.

3.3. Influence of the Pressurization Process on Melt Surface Fluctuation during Synchronous Pressurization

The curves of the pressure of the air tank, the pressure of the pouring zone, and the pressure in the mold during the synchronous pressurization process are shown in Figure 9a. The time required for the pressure of the pouring zone to increase to 600 kPa is about 300 s. In the process of synchronous pressurization, the effective area of the air intake is always 1256 mm2, but because the difference between the pressure of the air tank and the pouring zone is constantly changing, the pressurization speed of the pouring zone gradually decreases. At the initial stage, the pressure difference between the air tank and the pouring zone is larger, and the pressurization speed of the pouring zone is larger, which can reach about 2 kPa/s. With the decrease in the pressure of the air tank and the increase in the pressure of the pouring zone, the pressurization speed of the pouring zone gradually decreases, and at the end of the synchronous pressurization, the pressurization speed of the pouring zone drops to about 1 kPa/s.
At the initial stage of synchronous pressurization, the pressure difference between the pouring zone and the mold gradually increases from 0, as shown in Figure 9b. In the middle stage of synchronous pressurization, the pressure difference between the pouring zone and the mold cavity gradually increases and stabilizes at the maximum value, as shown in Figure 9c. At the end stage of synchronous pressurization, the pressure difference between the pouring zone and the mold cavity gradually becomes smaller, as shown in Figure 9d.
The simulation results of the pressure difference between the pouring zone and the mold are shown in Figure 10. In the initial stage of synchronous pressurization, the pressurization rate of the pouring zone is fast, and the pressure in the pouring zone increases rapidly. The pressure difference between the pouring zone and the mold cavity is small; the air penetration rate of the pouring zone into the mold cavity is slow. When the pressurization rate in the pouring zone is much higher than that in the mold cavity, this results in the pressure difference between the pouring zone and the mold cavity gradually rising. Then, with the increase in the pressure difference, the speed of penetrating gas into the mold cavity also gradually increases. At 89 s, the pressure difference between the pouring zone and the mold cavity reaches 1.15 kPa. Currently, the pressure increase rate in the pouring zone is basically the same as that in the mold cavity, reaching the maximum pressure difference. Under the action of this pressure difference, the melt (magnesium alloy) level rises by about 69 mm as calculated by Equation (4). As the pressurization speed of the pouring zone gradually decreases, the pressure in the pouring zone and the mold cavity gradually decreases, and the melt will also gradually fall back in the transfer tube.
P = ρ g h
where P is the difference in pressure, ρ the density of magnesium alloy, and h is the height of metal liquid rise.
The pressure difference between the pouring zone and the mold was measured, and the results are shown in Figure 10. Compared with the numerical simulation results, the two trends are consistent. The measured maximum pressure difference is 0.86 kPa, which is smaller than the numerical simulation result of 1.15 kPa. The time to reach the peak is 83 s, 6 s earlier than the simulation result. The difference in the analysis of the two results should be caused by inaccurate estimation of the air permeability of the side wall and bottom of the sand mold. The actual combination between sand mold and sandbox is complicated, and the boundary condition set that is completely airtight in the numerical simulation causes some errors in the results. At the same time, the sealing surface between the bottom of the sand mold and the transfer tube will also increase the overall permeability of the sand mold to a certain extent. Therefore, in the actual situation, the overall permeability of the sand mold is larger than the pre-calculated equivalent permeability aperture area of 0.0027 m2.
The rise and fall of the melt in the transfer tube will cause the double-layer oxide film to be formed on the melt surface, which will enter the cavity with the subsequent pouring process, forming double-layer oxide film defects. This kind of defect will affect the mechanical properties of the casting.
According to the above results, to reduce the pressure difference between the pouring zone and the mold cavity in the process of synchronous pressurization, a lower pressurization speed should be used in the initial stage of synchronous pressurization, and then the pressurization speed should be gradually increased as the pressure in the pouring zone and the mold cavity increases. Therefore, the power function shown in Equation (5) is used to design the process curve of synchronous pressurization.
P = a × t b
Subject to the requirements of the process, the time when the pressure of the pouring zone reaches 600 kPa by synchronous pressurization needs to be controlled within 300 s, and too long time of this process will affect the metallurgical quality of melt. At the same time, the control accuracy of the equipment requires that the minimum pressure speed of the initial stage of synchronous pressurization is 0.1 kPa/s, and the maximum pressure speed of the end stage of synchronous pressurization is 3.5 kPa/s.
The parameters are solved under the following conditions:
P 1 = 0.1
P 300 P 299 < 3.5
P 300 > 600
The specific parameters obtained are shown in Table 7.
The optimized process curve of the synchronous pressurization process is shown in Figure 11a. In the initial stage, the supercharging speed is slow at 0.1 kPa/s, and in the end stage, the maximum supercharging speed is 3.1 kPa/s. The pressure of the pouring zone and the melting zone reached 600 kPa at 295 s. The numerical simulation results and the actual measurement results are shown in Figure 11b. The trend of the measurement results and the simulation results is consistent. The simulation results show that the maximum pressure difference between the pouring zone and the mold cavity is 0.101 kPa, while the actual measurement results show that the maximum difference is 0.077 kPa. The source of error is that the permeability between the side wall and the bottom surface of the sand mold and the sandbox was not considered in the numerical simulation process.
Compared with the two pressurization processes, the peak value of the differential pressure before optimization is 0.86 kPa, which is equivalent to the liquid magnesium alloy in the transfer tube increased by 51.6 mm. By using the optimized process, the actual peak measured pressure difference is 0.077 kPa, which is equivalent to only a 4.62 mm increase in liquid magnesium alloy in the transfer tube. The height of the melt rise in the transfer tube is reduced by about 90%, and the small fluctuation value can avoid the formation of folded double-layer oxide films in the melt.
In the process before optimization, the metal liquid rises first in the transfer tube and then gradually decreases. The process of the melt falling back will lead to the folding of the oxide film on the melt surface and the formation of a double-layer oxide film structure on the melt surface. In the optimized process, the metal liquid slowly rises in the transfer tube until both the pouring zone and the melting zone reach the preset value. At this point, the equipment will begin to expel gas from the pouring zone, making the pouring zone pressure lower than the melting zone, which in turn drives the melt to fill the transfer tube and the mold. When the optimized process is used, the melt always flows upward in the transfer tube. The falling behavior of the melt in the transfer tube is eliminated, so the folding double-layer oxide film structure on the melt surface is avoided.
During the experiment, the alloy is melted by a 75 kW resistor furnace. The melting process uses a protective gas, a mixture of CO2 and SF6, and the synchronous pressurization process uses compressed air. After synchronous pressurization using the process before optimization, the melt in the transfer tube as shown in Figure 12a was taken out and poured into the sand mold to prepare the metallographic samples. The surface of the metallographic sample was observed by scanning electron microscopy, in Figure 12b. The irregular black lines are defects of the double-layer oxide film [25]. Since the melt had been refined before the experiment, the defects of the double-layer oxide film were mostly caused by the fall of the melt during the synchronous pressurization. The experiment was repeated three times, and the results were the same; there were defects in the double-layer oxide film.

4. Conclusions

In this study, the process optimization of the synchronous pressurization process of counter-pressure casting was carried out. Through the analysis of the numerical simulation and measurement results before and after process optimization, the following conclusions were drawn:
  • The numerical simulation results show that the metal liquid rises first and then falls back in the process of synchronous pressurization under the condition of considering the permeability of the sand mold;
  • With the process curve of synchronous pressurization designed by exponential function. The metal liquid rises slowly in the process of synchronous pressurization until the end. The falling behavior of the liquid metal is eliminated;
  • The optimized synchronous pressurization process reduces the height of the metal liquid in the riser tube. Taking magnesium alloy as an example, the height is reduced from 51.6 mm to 4.62 mm, which is about 90% lower.

Author Contributions

Conceptualization, Z.Q. and F.C.; Methodology, Z.Q. and C.Z.; Software, Z.Q., Z.J., X.Z. and H.S. (Heqian Song); Validation, Z.Q., C.Z. and G.C.; Writing—original draft preparation, Z.Q.; Visualization, Z.Q., C.Z., Z.J. and H.S. (Heqian Song); Data curation, C.Z., G.C., S.J. and F.C.; Writing—review and editing, L.Z. and H.S. (Hongxian Shen); Investigation, S.J. and X.Z.; Project administration, J.S.; Funding acquisition, J.S. All authors have read and agreed to the published version of the manuscript.

Funding

This research was funded by the National Natural Science Foundation of China (Grant No. 52105349) and the research funds for the key lab (Grant No. 6142909220102).

Data Availability Statement

The data that support the findings of this research are available from the corresponding author upon reasonable request.

Conflicts of Interest

The authors declare no conflicts of interest.

References

  1. Luo, A.A.; Sachdev, A.K.; Apelian, D. Alloy development and process innovations for light metals casting. J. Mater. Process. Technol. 2022, 306, 117606. [Google Scholar] [CrossRef]
  2. Ruff, G.; Prucha, T.E.; Barry, J.; Patterson, D. Pressure Counter Pressure Casting (PCPC) for Automotive Aluminum Structural Components. In SAE World Congress; SAE International: Warrendale, PA, USA, 2002. [Google Scholar]
  3. Bonollo, F.; Urban, J.; Bonatto, B.; Botter, M. Gravity and low pressure die casting of aluminium alloys: A technical and economical benchmark. In Proceedings of the Die Casting Conference of the Australian Die Casting Association, Columbus, OH, USA, 18–21 April 2006. [Google Scholar]
  4. Sun, J.Y.; Le, Q.C.; Fu, L.; Bai, J.; Tretter, J.; Herbold, K.; Huo, H.W. Gas entrainment behavior of aluminum alloy engine crankcases during the low-pressure-die-casting process. J. Mater. Process. Technol. 2019, 266, 274–282. [Google Scholar] [CrossRef]
  5. Katzarov, I.; Arsov, Y.; Stoyanov, P.; Zeuner, T.; Buehrig-Polaczek, A.; Sahm, P. Porosity formation in axi-symmetric castings produced by counter-pressure casting method. Int. J. Heat Mass Transf. 2001, 44, 111–119. [Google Scholar] [CrossRef]
  6. Mi, G.; Xin, P.; Zeng, S. Effect of solidification condition on secondary dendrite arm spacing of the A357 alloy under counter-pressure casting. J. Wuhan Univ. Technol.-Mater. Sci. Ed. 2009, 24, 119–122. [Google Scholar] [CrossRef]
  7. Yan, Q.; Yu, H.; Xu, Z.; Xiong, B.; Cai, C. Effect of holding pressure on the microstructure of vacuum counter-pressure casting aluminum alloy. J. Alloys Compd. 2010, 501, 352–357. [Google Scholar] [CrossRef]
  8. Zhensong, S.J.M.R. Development State and Prospect of Counter-pressure Casting Technology. Mater. Rev. 2004. [Google Scholar]
  9. Yan, Q.S.; Yu, H.; Lu, G.; Xiong, B.W.; Zou, X. Effect of crystallization pressure on secondary dendrite arm spacing of vacuum counter-pressure casting aluminum alloy. Sch. Aeronaut. Manuf. Eng. Nanchang Hangkong Univ. 2014, 24, 1194–1199. [Google Scholar]
  10. Runyoro, J.; Boutorabi, S.M.A.; Campbell, J. Critical gate velocities for film-forming casting alloys: A basis for process specification. Chukung 1992, 23, 67–77. [Google Scholar]
  11. Griffiths, W.D.; Lai, N.W. Double Oxide Film Defects in Cast Magnesium Alloy. Met. Mater. Trans. A 2007, 38, 190–196. [Google Scholar] [CrossRef]
  12. Zhao, X.Y.; Ning, Z.L.; Cao, F.Y.; Liu, S.G.; Huang, Y.J.; Liu, J.S.; Sun, J.F. Effect of Double Oxide Film Defects on Mechanical Properties of As-Cast C95800 Alloy. Acta Metall. Sin.-Engl. Lett. 2017, 30, 541–549. [Google Scholar] [CrossRef]
  13. Fox, S.; Campbell, J. Visualisation of oxide film defects during solidification of aluminium alloys. Scr. Mater. 2000, 43, 881–886. [Google Scholar] [CrossRef]
  14. Mi, J.; Harding, R.A.; Wickins, M.; Campbell, J. Entrained oxide films in TiAl castings. Intermetallics 2003, 11, 377–385. [Google Scholar] [CrossRef]
  15. Cais, J.; Weiss, V.; Svobodová, J. Microstructure and Mechanical Properties of Products of Alloy AL+3%Mg Made by Low-Pressure Casting. Metallurgist 2016, 60, 99–102. [Google Scholar] [CrossRef]
  16. Jiang, W.; Fan, Z.; Liao, D.; Dong, X.; Zhao, Z. A new shell casting process based on expendable pattern with vacuum and low-pressure casting for aluminum and magnesium alloys. Int. J. Adv. Manuf. Technol. 2010, 51, 25–34. [Google Scholar] [CrossRef]
  17. Bahreinian, F.; Boutorabi, S.M.A.; Campbell, J. Critical gate velocity for magnesium casting alloy (ZK51A). Int. J. Cast. Met. Res. 2006, 19, 45–51. [Google Scholar] [CrossRef]
  18. Fu, P.; Luo, A.A.; Jiang, H.; Peng, L.; Yu, Y.; Zhai, C.; Sachdev, A. Low-pressure die casting of magnesium alloy AM50: Response to process parameters. J. Mech. Work. Technol. 2008, 205, 224–234. [Google Scholar] [CrossRef]
  19. Zhang, Z.; Liu, J.; Chen, J.; Wen, F.; Jia, R.; Ma, Q. Optimization of residual stress in low-pressure casting of ZL205A alloys. J. Manuf. Process. 2023, 99, 338–350. [Google Scholar] [CrossRef]
  20. Kuo, J.H.; Hsu, F.L.; Hwang, W.S. Development of an interactive simulation system for the determination of the pressure-time relationship during the filling in a low pressure casting process. Sci. Technol. Adv. Mater. 2001, 2, 131. [Google Scholar] [CrossRef]
  21. Liu, B.L.; Kang, J.W.; Yang, X.; Zhang, B.; Bian, Y. Effects of hollow sand mold on the microstructure and mechanical properties of a low pressure aluminum alloy casting. J. Mater. Res. Technol.-JMRT 2024, 28, 4488–4497. [Google Scholar] [CrossRef]
  22. Bi, J.; Dong, G.J.; Zhang, L.; Ma, S.; Zhang, D.; Wang, J.; Li, W.; Xu, Z. Process Optimization of A356 Aluminum Alloy Wheel Hub Fabricated by Low-Pressure Die Casting with Simulation and Experimental Coupling Methods. J. Mater. Res. Technol. 2023, 24, 3118–3132. [Google Scholar]
  23. Duan, Z.Q.; Chen, W.P.; Pei, X.L.; Hou, H.; Zhao, Y.H. A multimodal data-driven design of low pressure die casting gating system for aluminum alloy cabin. J. Mater. Res. Technol.-JMRT 2023, 27, 2723–2736. [Google Scholar] [CrossRef]
  24. Tominaga, Y.; Stathopoulos, T. Numerical simulation of dispersion around an isolated cubic building: Comparison of various types of k-ε models. Atmosp. Environ. 2009, 43, 3200–3210. [Google Scholar] [CrossRef]
  25. Campbell, J. Casting, Complete Casting Handbook; Elsevier: Oxford, UK, 2011. [Google Scholar]
Figure 1. Counter-pressure casting process. (a) Schematic diagram of counter-pressure casting equipment (b) Counter-pressure casting process curve diagram. (c) The curve of the pressure difference. (d) Schematic diagram of the synchronized pressurization process. (e) Schematic diagram of the metal filling riser process. (f,g) Schematic diagram of the molten metal filling mold process. (h) Schematic diagram of the pressure maintenance phase.
Machines 12 00702 g001
Figure 2. Device for measuring the permeability of sand mold (a) The structure of the experimental device. (b) Sealing method of sand mold. (c) Connections to sensors and solenoid valves.
Machines 12 00702 g002
Figure 3. Measuring device for the equivalent value of sand mold permeability (a) The structure of the experimental device. (b) Connections to sensors and solenoid valves.
Machines 12 00702 g003
Figure 4. The structure of sand mold.
Machines 12 00702 g004
Figure 5. The model for numerical simulation. (a) The model for the process before optimization. (b) The model for the process after optimization.
Machines 12 00702 g005
Figure 6. The connection structure of measuring the pressure difference between the pouring zone and mold. (a) Connection of sensor. (b) Flange of special construction.
Machines 12 00702 g006
Figure 7. The measurement results of air permeability of sand mold with different thickness.
Machines 12 00702 g007
Figure 8. Measurement data of equivalent permeability of sand mold with the thickness of sand mold of (a) 80 mm; (b) 100 mm; (c) 120 mm; (d) 140 mm; and (e) 160 mm.
Machines 12 00702 g008
Figure 9. The pressure of pouring zone and mold during synchronous pressurization process, (a) Pressure of sand mold and pouring chamber, (b) Initial phase of synchronous pressurization, (c) End phase of synchronous pressurization and (d) Intermediate phase of synchronous pressurization.
Machines 12 00702 g009
Figure 10. The pressure difference between the pouring zone and mold using the process before optimization.
Machines 12 00702 g010
Figure 11. Process optimization and experimental results. (a) The synchronous pressurization process after optimization. (b) The pressure difference between the pouring zone and mold using the process after optimization.
Machines 12 00702 g011
Figure 12. The formation of double-layer oxide film during synchronous pressurization with the process before optimization. (a) Sampling point. (b) The double-layer oxide films observed by SEM.
Machines 12 00702 g012
Table 1. Size of sand mold used in the experiment.
Effective permeable section size (mm)100 × 100
Sand mold thickness (mm)160 140 120 100 80
Table 2. Initial conditions of numerical simulation.
ZonesEffective Volume (m3)Initial Pressure (kPa)
Pouring zone80
Melting zone4.60
Mold0.20
Air storage tank36800
Equivalent ventilation area0.0027-
Table 3. Chemical composition of magnesium alloy.
ZnNdZrCuNi
0.202.800.400.10.01
Table 4. Physical property parameters of magnesium alloy.
Temperature
(K)
Density
(g/cm3)
Liquid Viscosity
(mPa·s)
Surface Tension
(mN/m)
1033.151.599021.08833521.1553
1028.151.600331.09972522.904
1023.151.601651.11133524.6526
1018.151.602961.12319526.4012
1013.151.604271.13529528.1499
1008.151.605571.14764529.8985
1003.151.606881.16026531.6471
998.151.608181.17314533.3958
993.151.609471.18629535.1444
988.151.610771.19973536.893
983.151.612061.21346538.6416
978.151.613341.22749540.3903
973.151.614631.24182542.1389
968.151.615911.25648543.8875
963.151.617191.27146545.6361
Table 5. Parameters of the fitting equation for sand mold of different thickness.
Thickness of Sand Mold (mm)A1t1A2t2y0
8069.88 ± 1.571.36 ± 0.0567.75 ± 0.5922.28 ± 0.89−10.15 ± 0.99
10066.72 ± 2.151.45 ± 0.0869.30 ± 0.8122.29 ± 1.22−9.52 ± 1.34
12062.54 ± 1.301.40 ± 0.0571.01 ± 0.4822.89 ± 0.70−10.26 ± 0.79
14064.10 ± 0.821.21 ± 0.0369.75 ± 0.2420.78 ± 0.31−7.73 ± 0.35
16065.44 ± 1.361.46 ± 0.0668.87 ± 0.5224.04 ± 0.83−9.92 ± 0.87
Table 6. The opening area of the solenoid valve.
Thickness of Sand Mold (mm)Average of the Open Area of the Solenoid Valve (mm2)
8015.57
10014.78
12014.13
14013.68
16013.32
Table 7. The results of parameter solving.
ParametersValue
a0.1
b1.53
Disclaimer/Publisher’s Note: The statements, opinions and data contained in all publications are solely those of the individual author(s) and contributor(s) and not of MDPI and/or the editor(s). MDPI and/or the editor(s) disclaim responsibility for any injury to people or property resulting from any ideas, methods, instructions or products referred to in the content.

