Article

Study on Crashworthiness of Shrink Tube Anti-Creep Device

1
Key Laboratory of Traffic Safety on Track, Ministry of Education, Central South University, Changsha 410075, China
2
School of Intelligent Manufacturing and Mechanical Engineering, Hunan Institute of Technology, Hengyang 421002, China
3
Joint International Research Laboratory of Key Technology for Rail Traffic Safety, Central South University, Changsha 410075, China
*
Author to whom correspondence should be addressed.
Machines 2024, 12(10), 720; https://doi.org/10.3390/machines12100720
Submission received: 3 September 2024 / Revised: 6 October 2024 / Accepted: 8 October 2024 / Published: 11 October 2024
(This article belongs to the Section Machine Design and Theory)

Abstract

:
Based on the requirements of the narrow installation space of a train end, compact energy-absorbing travel, and huge energy suck, a shrink tube anti-creep device was designed. The crashworthiness of different structures was studied by means of a material test, a trolley test, and numerical simulation. For every 1 mm increase in tube wall thickness, 1 mm increase in the axial length of the friction cone, and 0.01 increase in the friction coefficient, the mean crushing force (MCF) increased by 45.1 kN, 13.5 kN, and 30.5 kN, respectively. When the cone angle of the shrink tube increased from α = 5° to α = 25°, the increase in the MCF with different thicknesses was about 600%. The MCF was most affected by the cone angle, followed by the wall thickness, the friction coefficient, and the axial length of the friction cone. The change in the contact length of the friction cone of the shrink tube under different structural parameters was compared. The contact length decreased with the increase in tube wall thickness and increased with the increase in angle. The variation rule of MCF was obtained to provide a reference for the development of genealogical products.

1. Introduction

With the increase in railway running speed, the passive safety of vehicles is of concern to researchers [1]. Various energy-absorbing structures [2,3,4,5] are designed to protect passengers from injury and are installed in the uncrewed area of the train to absorb collision energy using filling foam and honeycomb. The energy-absorbing structure is the key to passive safety, and it needs to absorb a large amount of kinetic energy to mitigate the impact. Lu and Yu [6] point out the basic requirements of energy absorption structures: (1) controllable and stable MCF, (2) long deformation stroke and high SEA, and (3) low cost and easy installation. Thin-walled circular tubes are widely used in automotive, railway transportation, and aerospace industries due to the above characteristics [7,8,9]. The circular tube could produce a specific deformation mode, which has a stable reaction force and a high SEA [10,11,12] and becomes an ideal energy-absorption structure. The circular tube has various common deformation modes, such as expansion [13,14,15,16,17,18], outward inversion [19,20,21,22,23,24], and splitting [25,26,27,28,29]. Studies on the shrink circular tube are still rare. In contrast, the shrink-tube energy-absorption structure is easy to process, manufacture, and maintain, and it has higher MCF and SEA [30], which makes it suitable for a train anti-creep device, and it has gradually gained the attention of researchers of energy-absorption structures.
Yan et al. [7] proposed a theoretical prediction model and studied the effect of the expansion cone angle on energy absorption. Liu and Qiu [10] proposed a theoretical model for predicting compression force and tube radius after expansion. The prediction accuracy of the compressive force was high, but the prediction accuracy of the expansion radius was only suitable for small cone angles. On this basis, by considering the ratio of mold radius and thickness, as well as mold cone angle, the model was improved again, which expanded the applicability of the theoretical model and more accurately predicted the stable compression force in a wider range of parameters [11]. Yang et al. [12] reported the mechanical behavior of a circular 5A06 aluminum tube expanded by four different cone-cylinder molds. The characteristics of force and displacement curves are discussed, and the effects of tube size and cone angle on steady-state force and specific energy absorption are given. Shakeri et al. [15] studied the influence of the surface friction coefficient of a deformed tube and a rigid tube on the average crushing load value and characterized the typical deformation expansion mode that may occur during axial compression. Karrech and Seibi [18] used a theoretical model to predict the average breaking force during the expansion of a circular tube. The research shows that the optimal conical angle under low friction conditions is between 22° and 25°, and it increases nonlinearly when friction increases.
Compared with the expansion tube, there is relatively little research on the shrink tube, but the research methods and experience of the expansion tube are helpful to the research on the shrink tube. Yao et al. [9] proposed a new type of linear conical shrinkage (STS) ring tube for railway connectors and studied the crashworthiness of this STS tube. There are two deformation modes: shrinkage (S) and buckling (B). The increase in structural parameters α, t, and L1 all lead to the increase in SEA and maximum crushing force (Fmax), and α has the most significant effect. Li et al. [30] reported the influence of the friction coefficient, cone angle, and tube body size on the crashworthiness of the shrinkable tube. In addition, they also found that the SEA of the shrink tube is significantly greater than that of the expanded tube in all cases. Almeida et al. [31] and Alves et al. [32] studied the shrinking process of circular tubes and considered it as a forming method for producing circular tubes. Tanaskovic [33] designed a new structure by combining two modes of shrinking and splitting to deform the circular tube, and the new structure was approximately 60% more efficient than a single-shrinkage energy absorber. Liu and Qiu [34] proposed a theoretical model to compare against the numerical simulation model, and in the range of different structures, it was found that the application ranges of this model are a cone angle of ≤40° and a diameter thickness ratio of ≥10. Guan [35] proposed a high-speed train anti-climbing device with a combined shrink-round tube and found that the increase in wall thickness led to a significant increase in Fmax and SEA, but with the increase in wall thickness, the growth rate of Fmax was much higher than that of SEA. Moreno [36] studied whether the anisotropic material model could improve the precision of the shrink-tube numerical model and found that the numerical model, with the addition of anisotropic materials, predicted a lower reaction force.
The three-stage energy-absorption structure of the front end of the train includes the coupler, the anti-climb device, and the main energy-absorption structure, each of which absorbs certain energies at different stages, and the anti-climb device is only one of the auxiliary structures. The main purpose of this paper is to design a shrink-tube energy-absorption structure to study its crashworthiness, which requires a stable crushing force and a stable and controllable deformation mode, and the technical requirement of energy absorption is 228 kJ.
Considering the limitations of energy-absorption travel and the requirements of the anti-climbing device with large energy absorption, a design scheme for the anti-climbing device with a simple structure, easy assembly, and no maintenance was selected. The MCF requirements of the energy-absorption structures at the ends of different models of trains vary, resulting in too much repetitive work for the research and development of a single product. In this paper, the effect of friction coefficient, wall thickness, and cone angle on the energy absorption characteristics is studied, and the variation of crashworthiness with structural parameters is obtained, which can provide guidance for the development of genealogy products with different MCF requirements.

2. Methodology

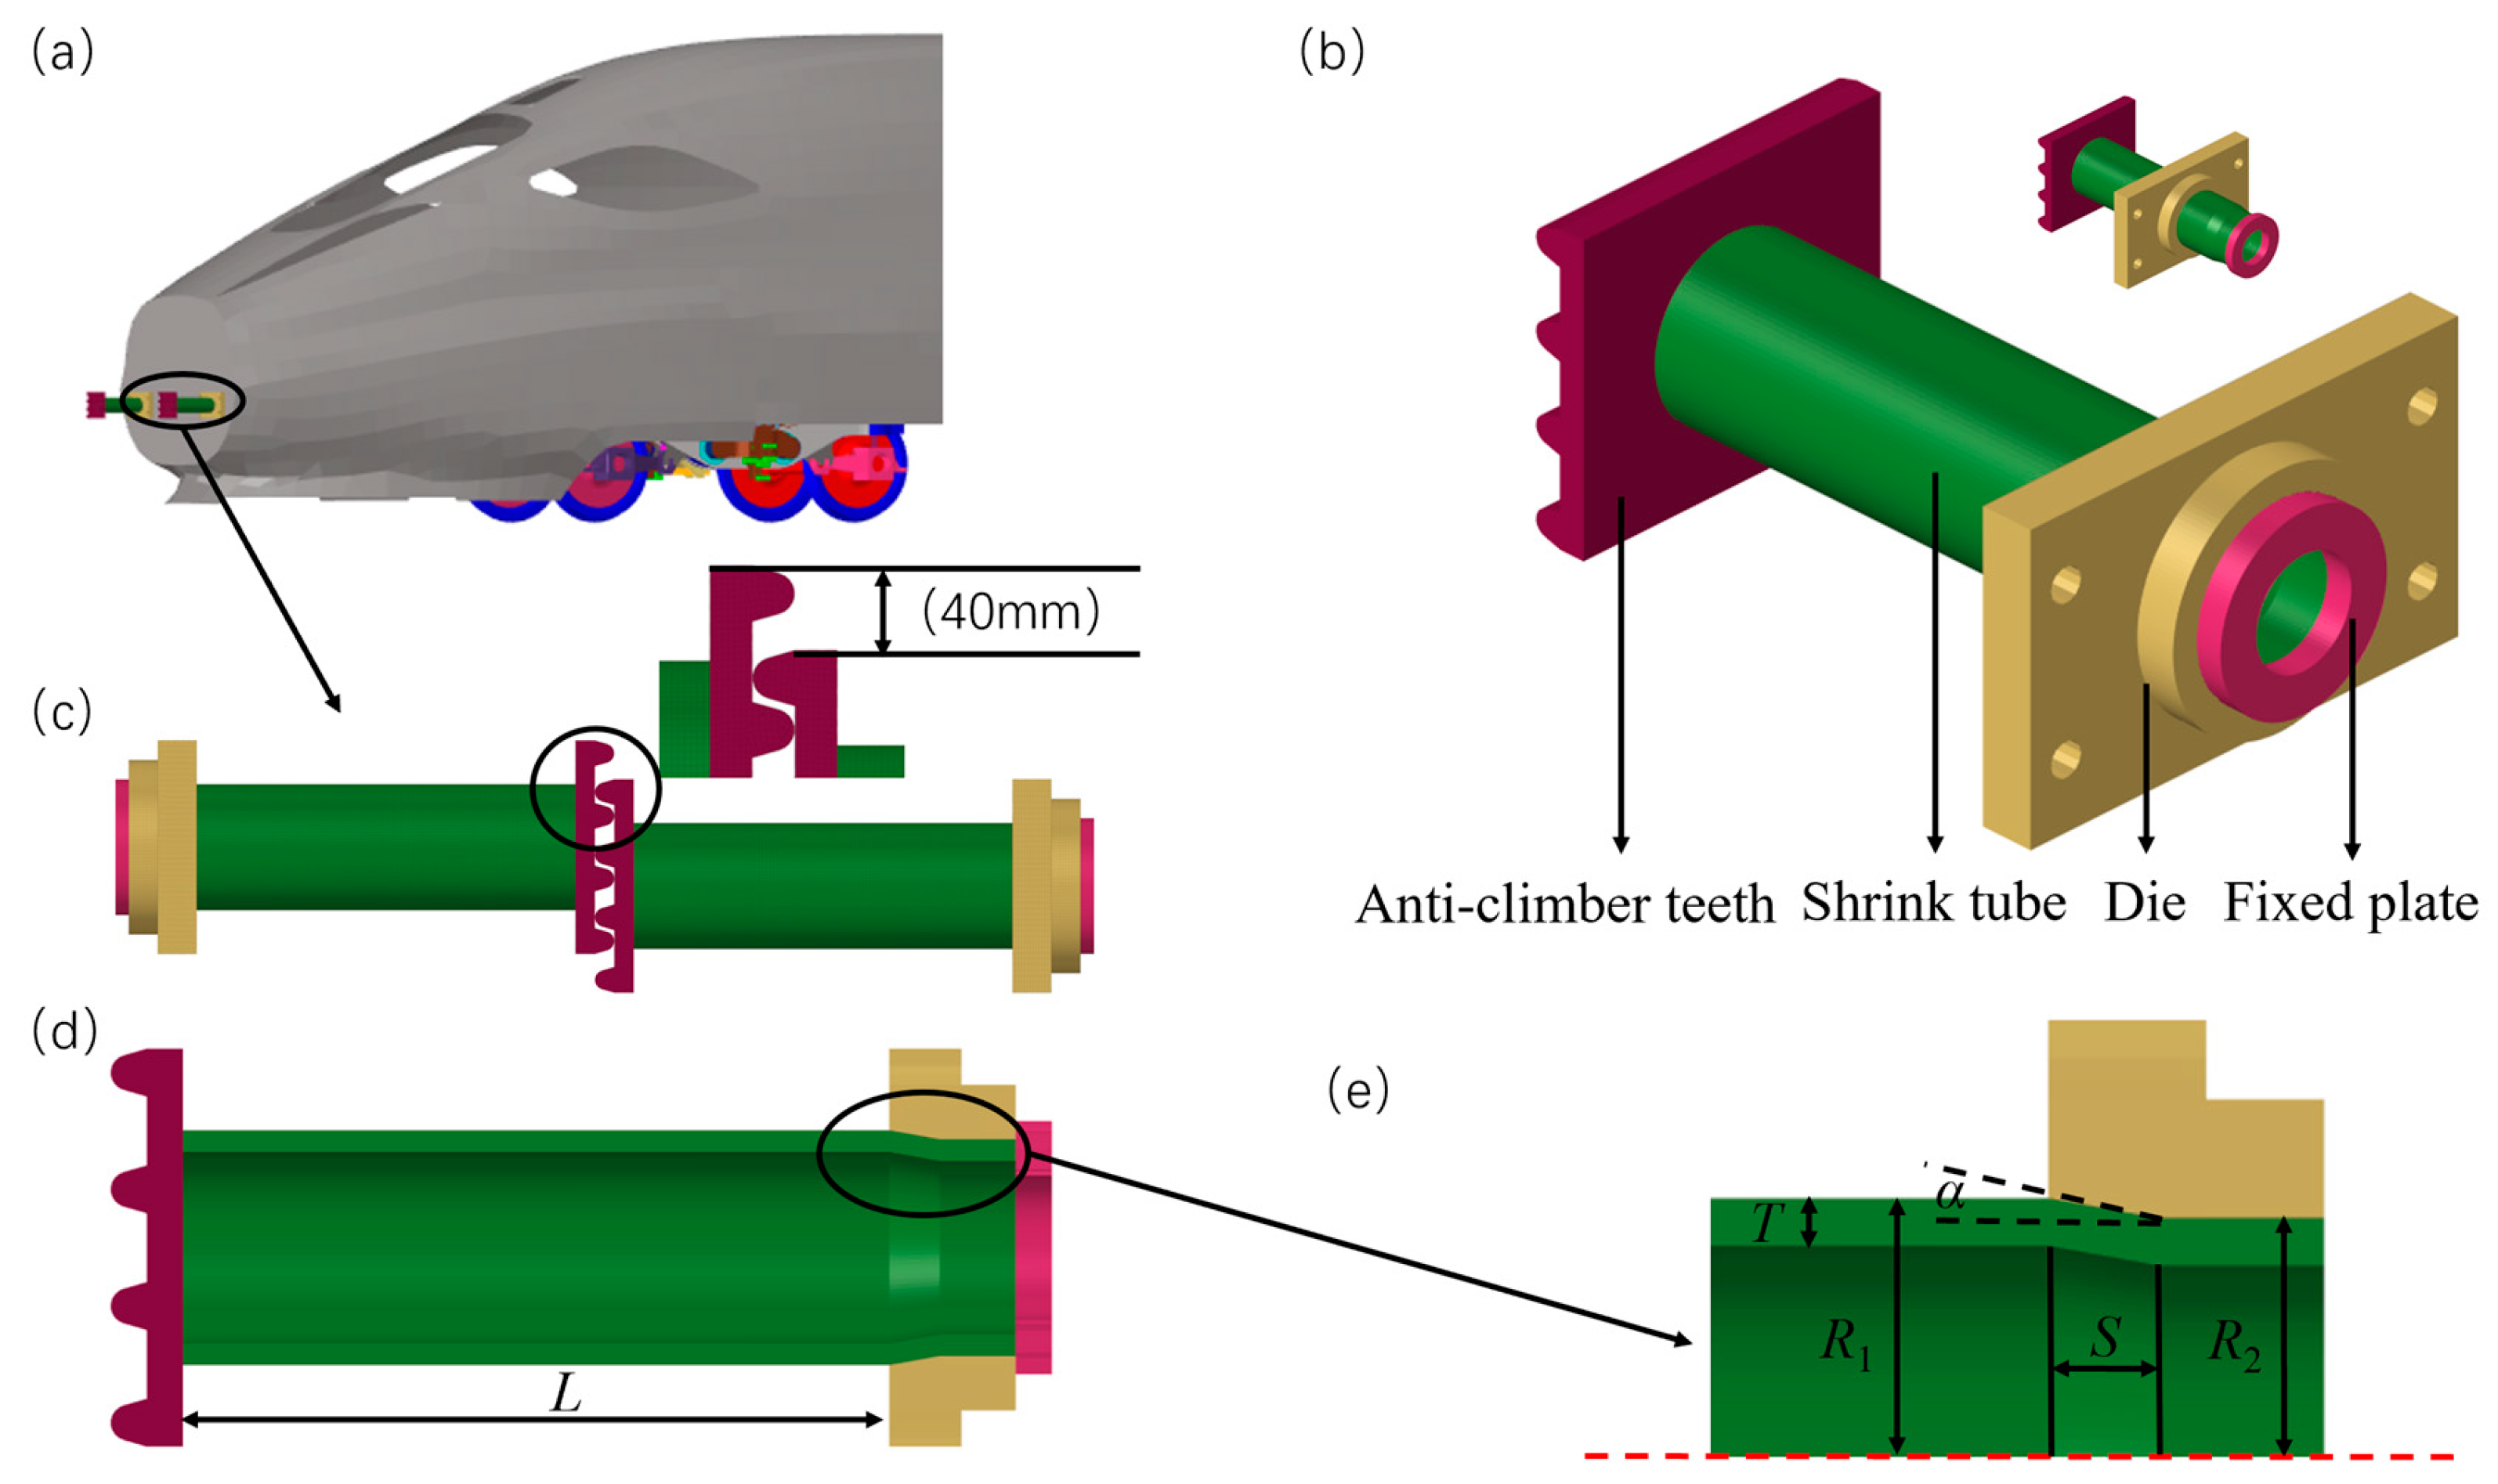
2.1. Geometry Description

In the energy absorption structure on the train, anti-climbing devices are installed in pairs at the front end, as shown in Figure 1a, to prevent the phenomenon of climbing in a collision accident. The action process of the shrink tube anti-climb device is that when a collision accident occurs between trains, the anti-climb teeth bear the impact and push the shrinkable tube into the inside of the contractile mold. The shrink tube is deformed by the extrusion of the conical surface of the contractile mold, and its outer surface has friction with the inner surface of the contractile mold. Through radial contractile plastic deformation and friction, the impact energy is absorbed to reduce the impact on other train structures and occupants.
The main structure consists of four parts, as shown in Figure 1b: anti-climber teeth, shrink tube, die, and fixed plate. The die is formed by combining shrink die and mounting flange and is fixed at the front end of the train. The purpose of the fixed plate is to fix the shrink tube and shrink die flange together during assembly. During the collision, the anti-climbing teeth of the two colliding trains limit each other to prevent climbing, as shown in Figure 1c. As a part of energy absorption, the shrink tube is squeezed by the flange of the shrink die to consume the collision energy, which requires a stable crushing force in the process of deformation and energy absorption. The shrink tube in the anti-climb device is processed with 45 steel, the shrink die flange is processed with 40Cr steel, and the anti-climber teeth and fixed plate are processed with Q235 steel.
Figure 1d shows the profile structure, where L is the maximum collision travel, and the design dimension parameters of key parts of the main structure are shown in Figure 1e: T represents the thickness of the shrink tube; R1 and R2 are the radius values of the large diameter and the small diameter of the shrink tube, respectively; α is the cone angle of the shrink tube; S represents the axial length of the friction cone, which is set to adjust the size of the cone angle within a certain range, and is defined as the projected length of the cone surface in the axial direction. In the case of a certain amount of shrinkage, the size of the cone angle α can be controlled by changing the length of S, which is more convenient to control the processing. In this scheme, the thickness, large diameter, small diameter, and axial length of friction cone are 14 mm, 65 mm, 60 mm, and 30 mm, respectively.

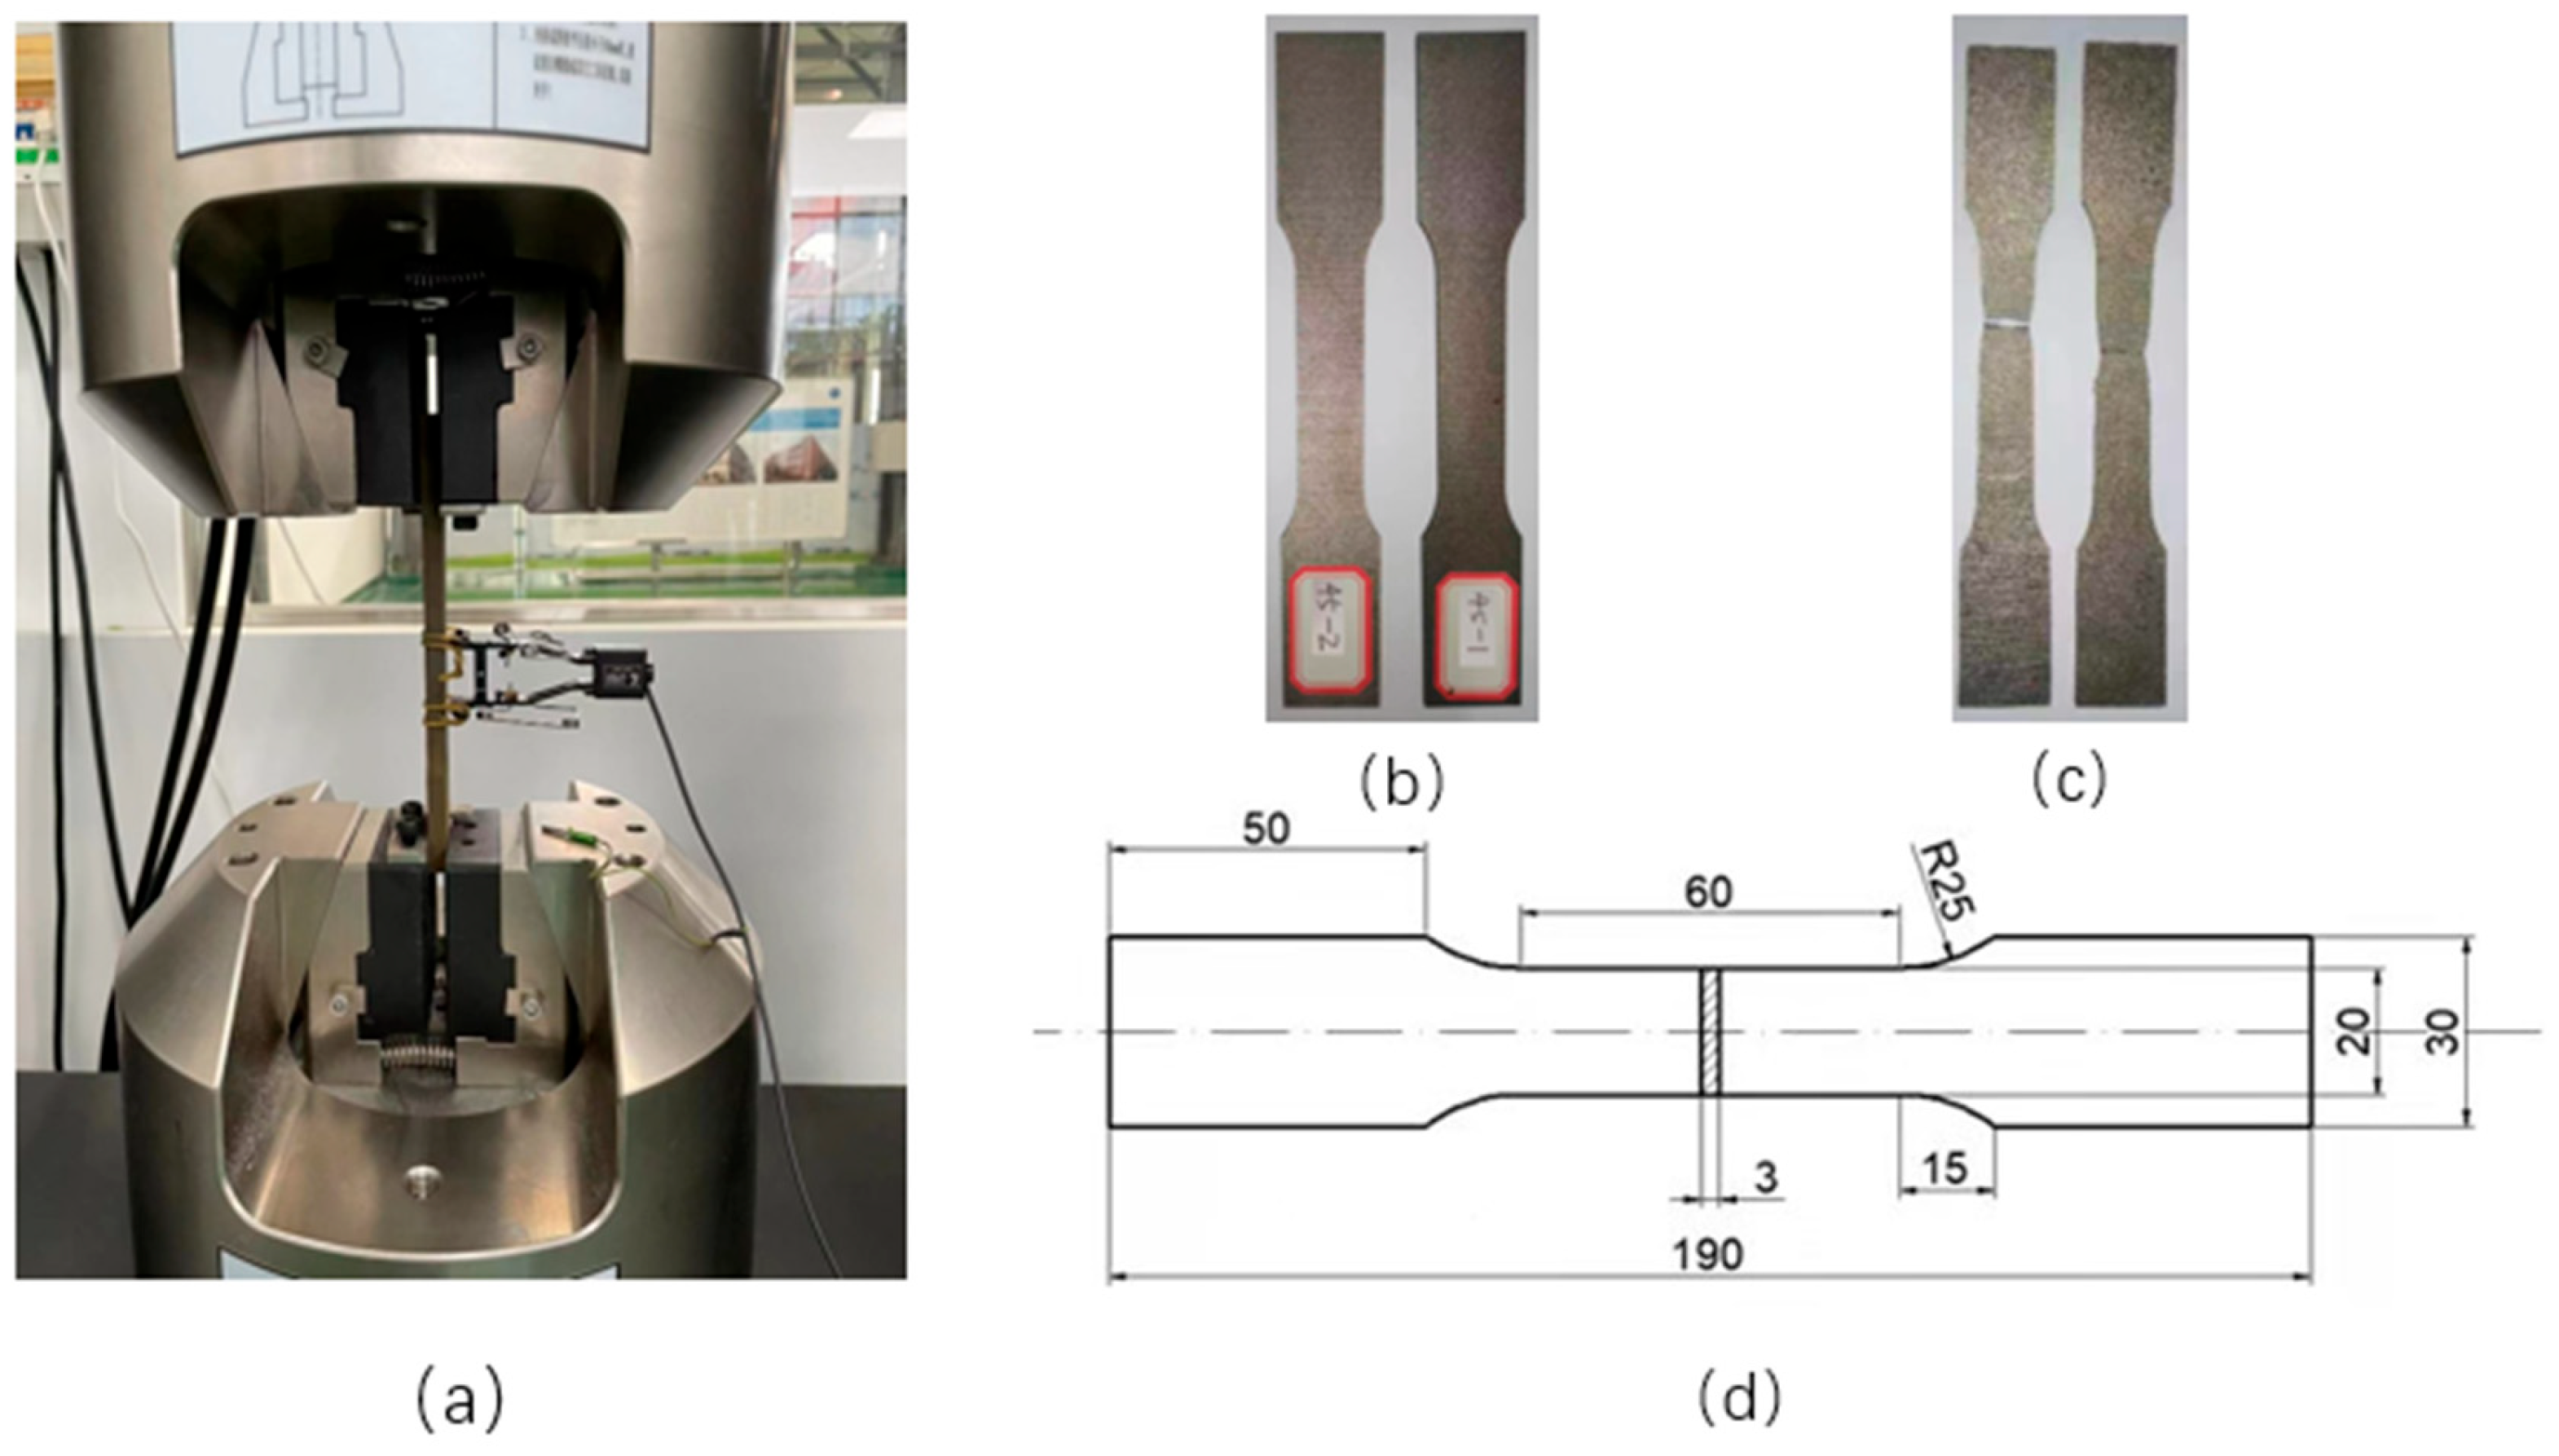
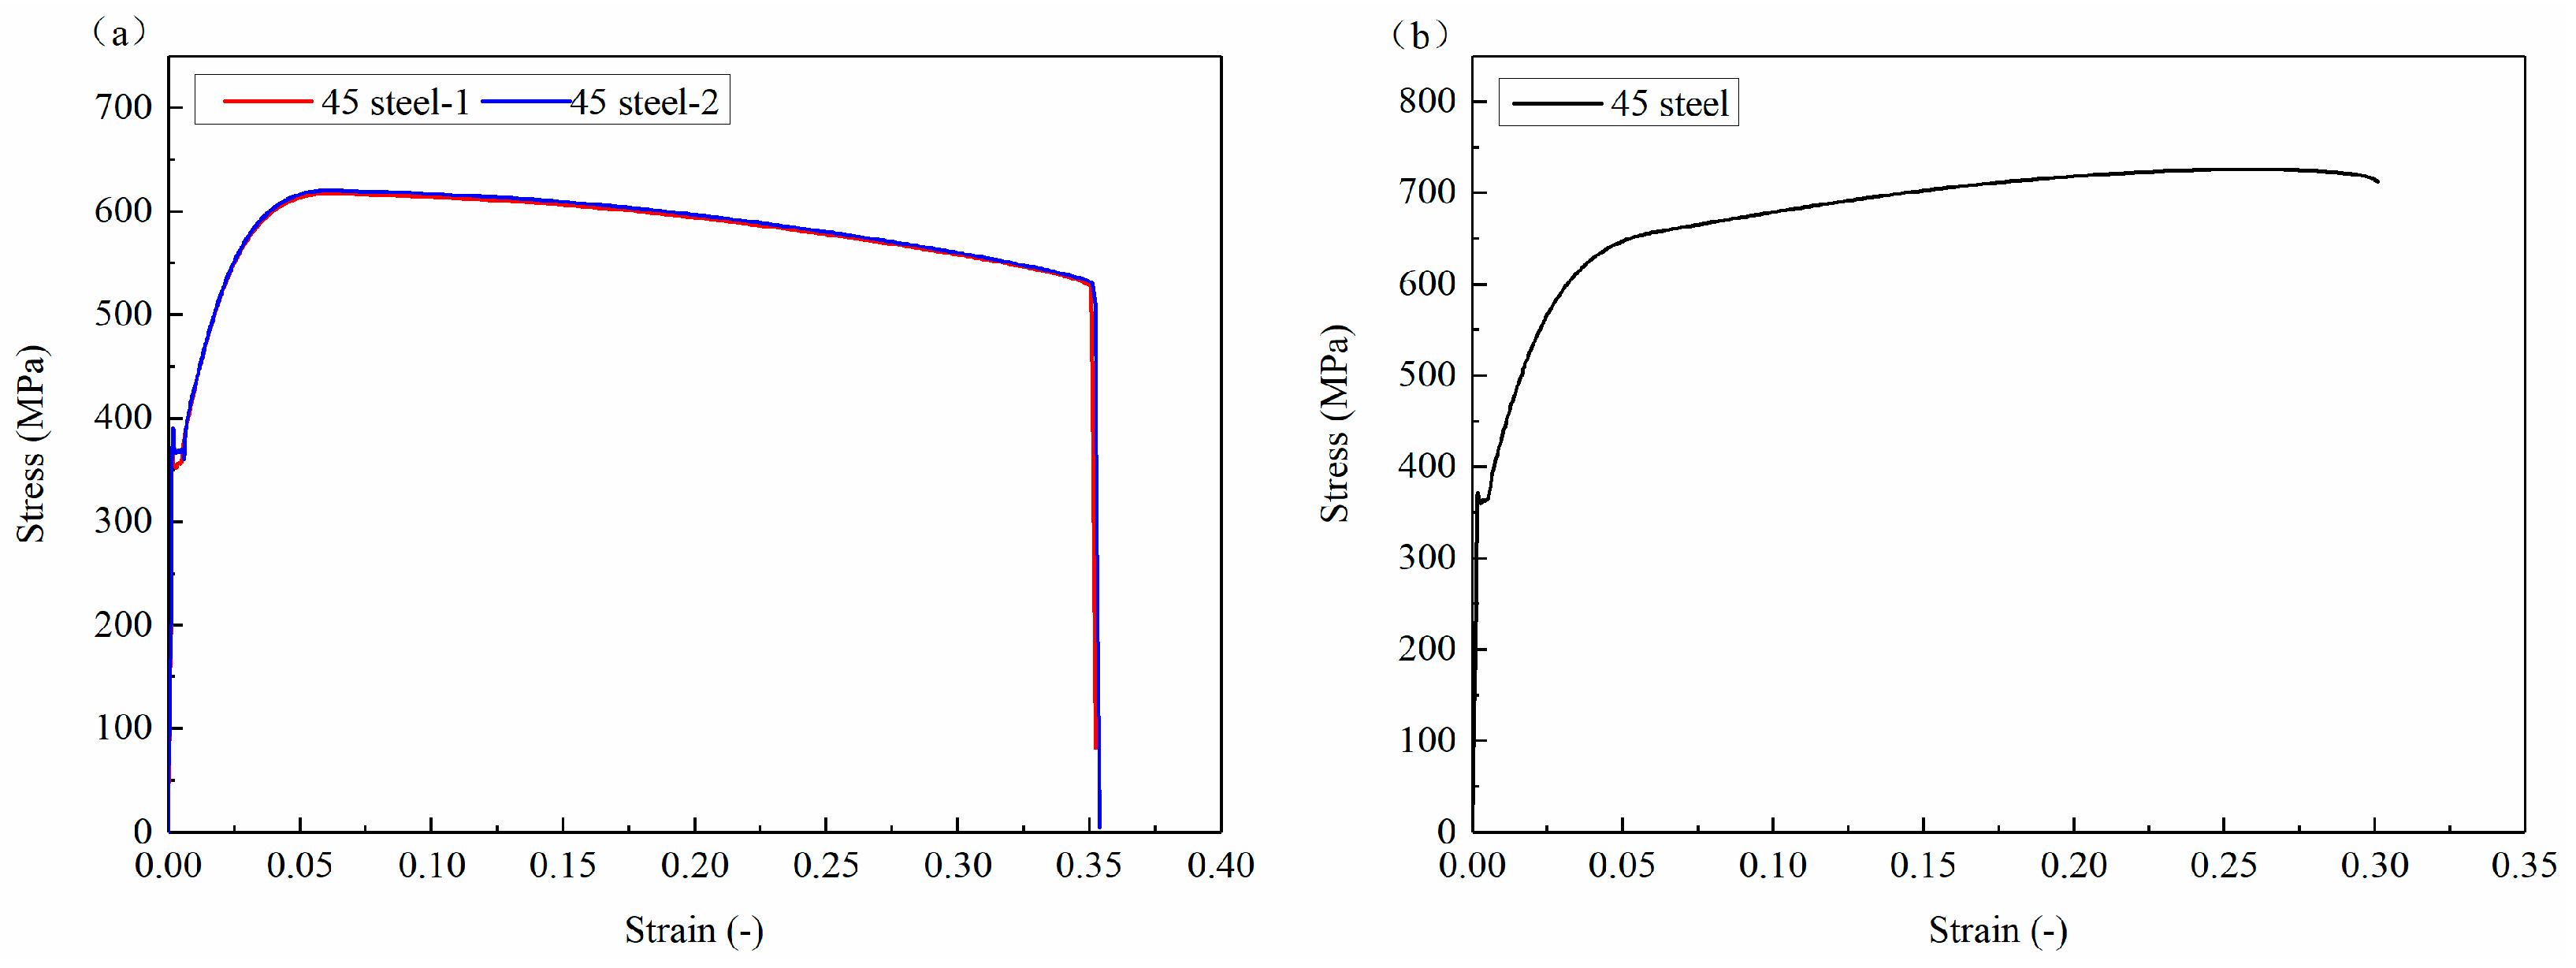
2.2. Material Properties

The material properties were obtained by using the MTS 647 (MTS, Eden Prairie, MN, USA) hydraulic wedge clamping and tensile testing machine [37]. First, the basic mechanical properties of 45 steel were obtained through quasi-static tensile test. Then, a constitutive model reflecting its loading characteristics was fitted, and the numerical simulation model was input for calculation. The test equipment is shown in Figure 2a, where the test tensile speed is 2 mm/min. The samples before and after the experiment are shown in Figure 2b,c, and the standard size of the material sample is shown in Figure 2d.
The engineering stress–strain curve of 45 steel is shown in Figure 3a, which was obtained by using an extensometer as indicated in Figure 2a. The true stress–strain curve correspondence is described by the following formula:
σ t = σ e 1 + ε e
ε t = ln ( 1 + ε e )
where σ t is the true stress, σ e is the engineering stress, ε t is the true strain, and ε e is the engineering strain.
The true stress–strain curve obtained through the transformation of engineering stress–strain curves is shown in Figure 3b, where the real value is the average value of several real stress–strain curves. The shrink tube in the numerical model adopts the real stress–strain curve of 45 steel.

2.3. Crashworthiness Index

In order to compare the advantages and disadvantages, the crashworthiness of the shrink tube anti-creep device needs to be evaluated quantitatively using the crashworthiness index. Before the test and simulation, some evaluation indexes of crashworthiness are explained. The following four index parameters for evaluation are used [38,39,40]: energy absorption (EA), specific energy absorption (SEA), mean crushing force (MCF), and peak force (Fmax).
EA represents the all energy absorbed during the collision deformation process, which can be expressed by the following formula:
E A = 0 s max F ( s ) d s
where F(s) is the force measured as a function of displacement, and s is the effective energy absorption travel.
SEA represents the amount of energy absorbed per unit mass of energy-absorbing structures and directly reflects the advantages and disadvantages of the design. The formula is expressed as follows:
S E A = E A W m = E A ρ π L T ( 2 R 1 T )
where W m , ρ , L , T, and R 1 , respectively, represent the mass, density, length, thickness, and outer radius of the shrink tube.
Fmax refers to the maximum force value in the deformation process of energy-absorbing structure. The Fmax has a great impact on the train structure safety, and requires to be as close to the MCF as possible.
MCF refers to the mean value of the impact force in the whole contraction displacement, which can be expressed by the following formula:
M C F = E A s

3. Trolley Test and Finite Element Modeling
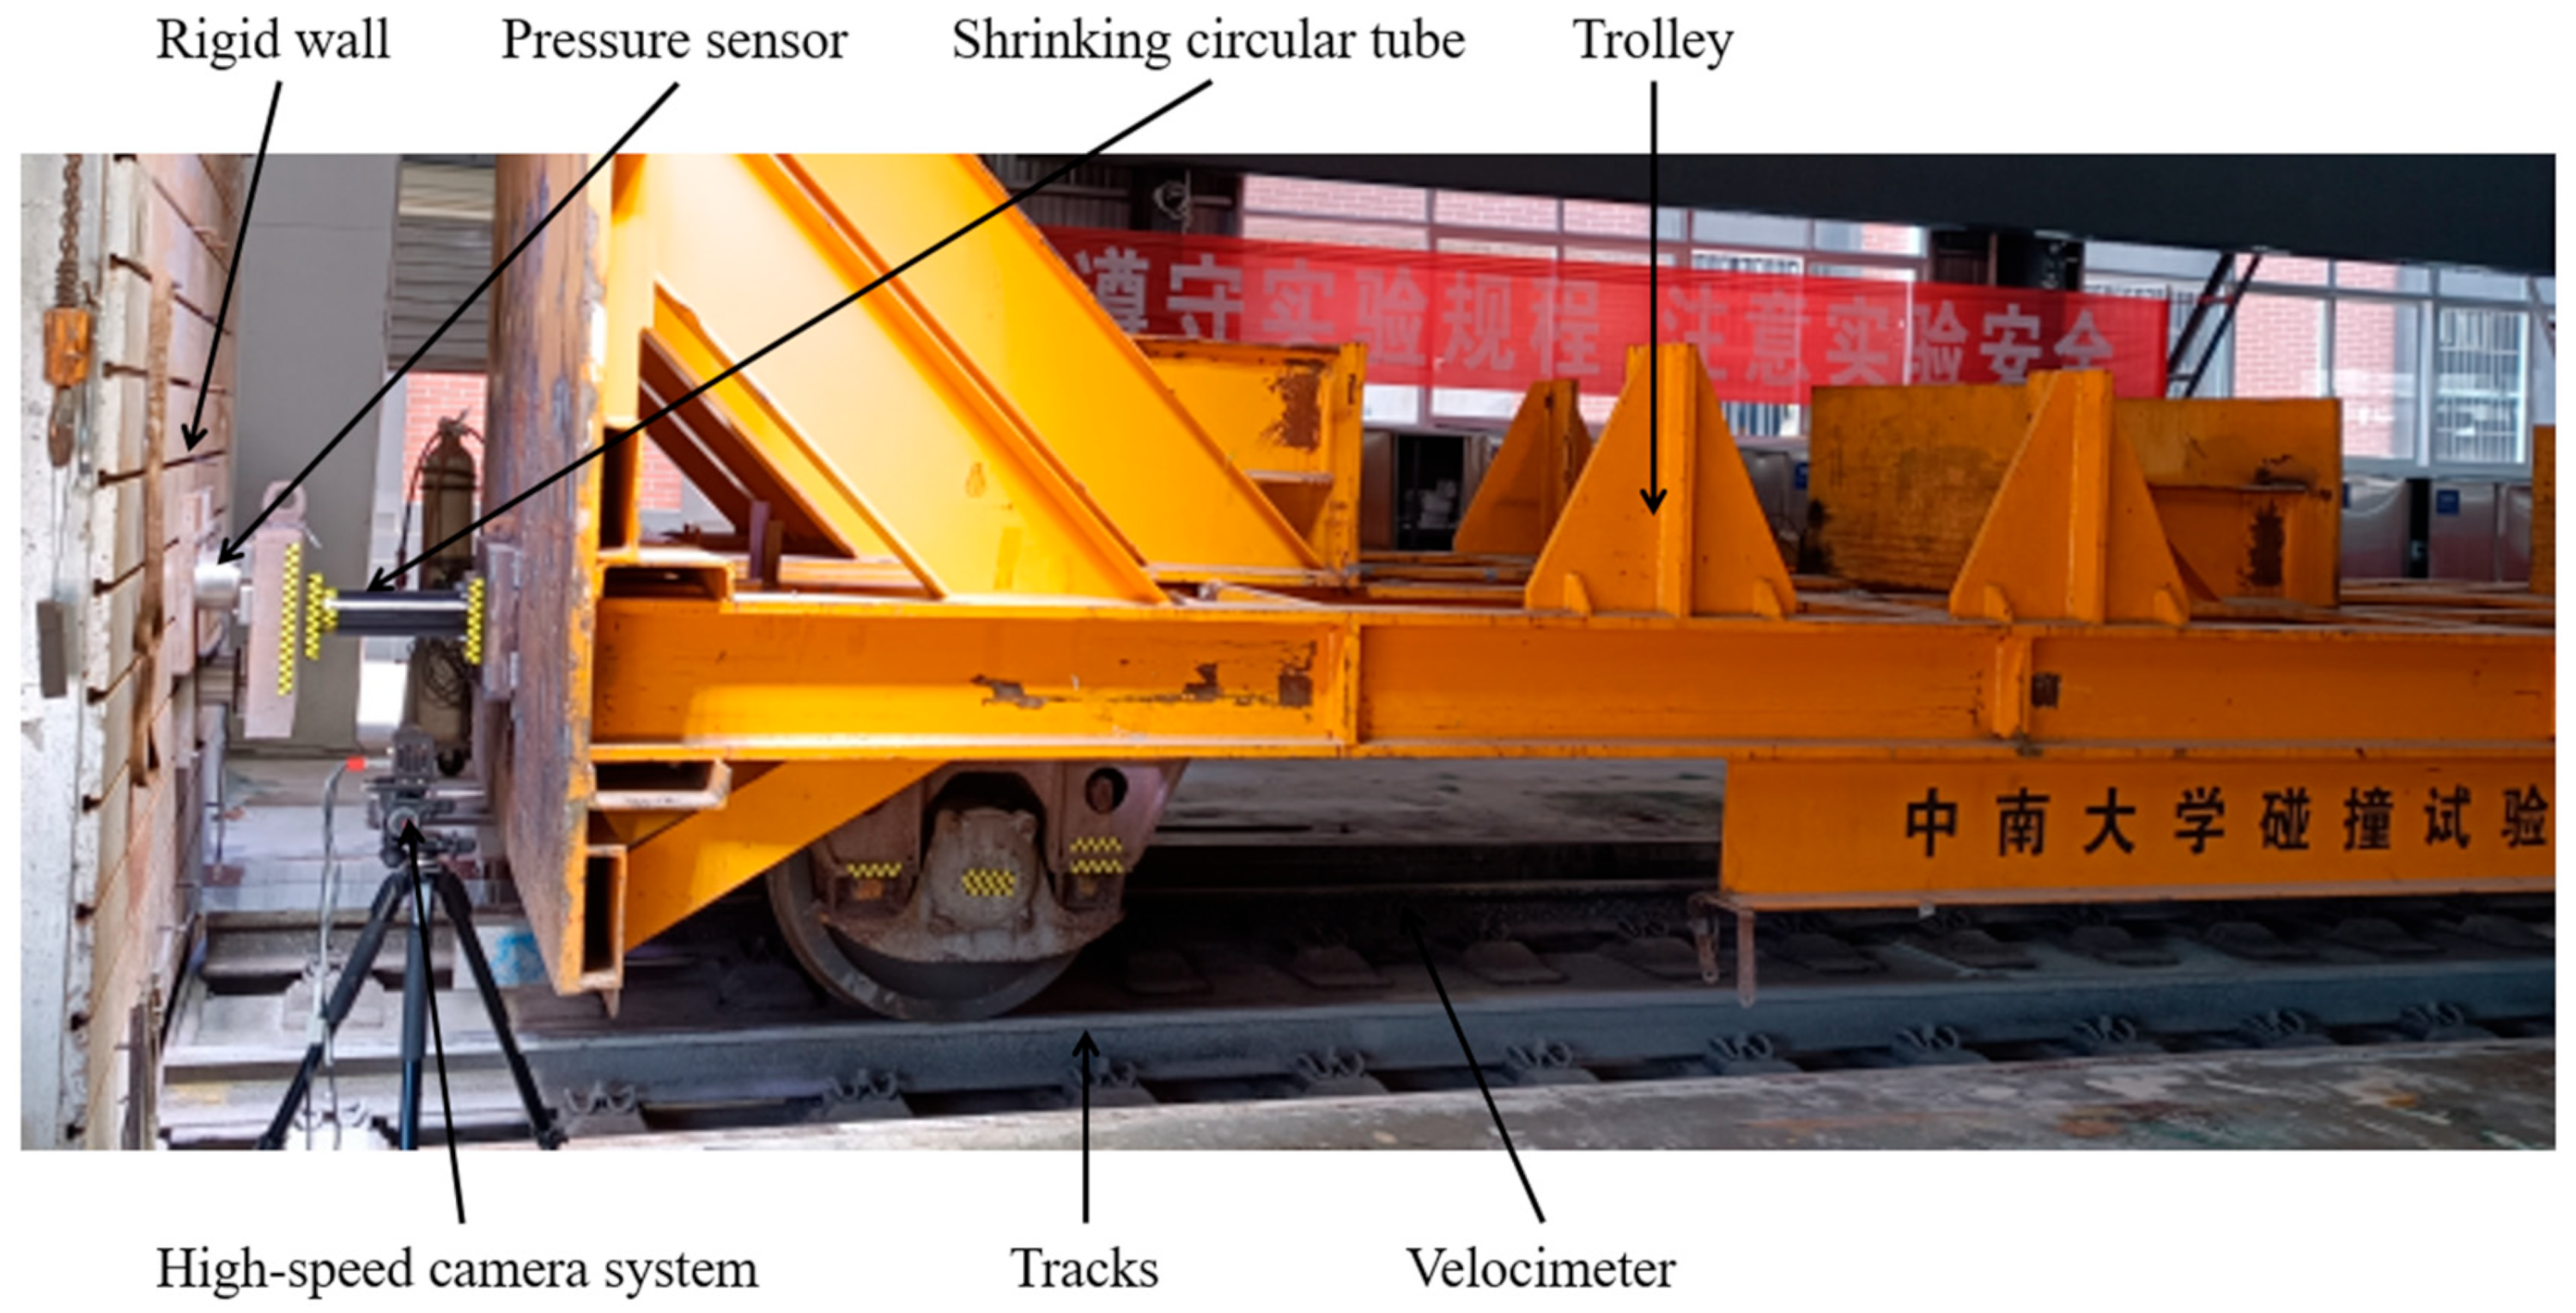
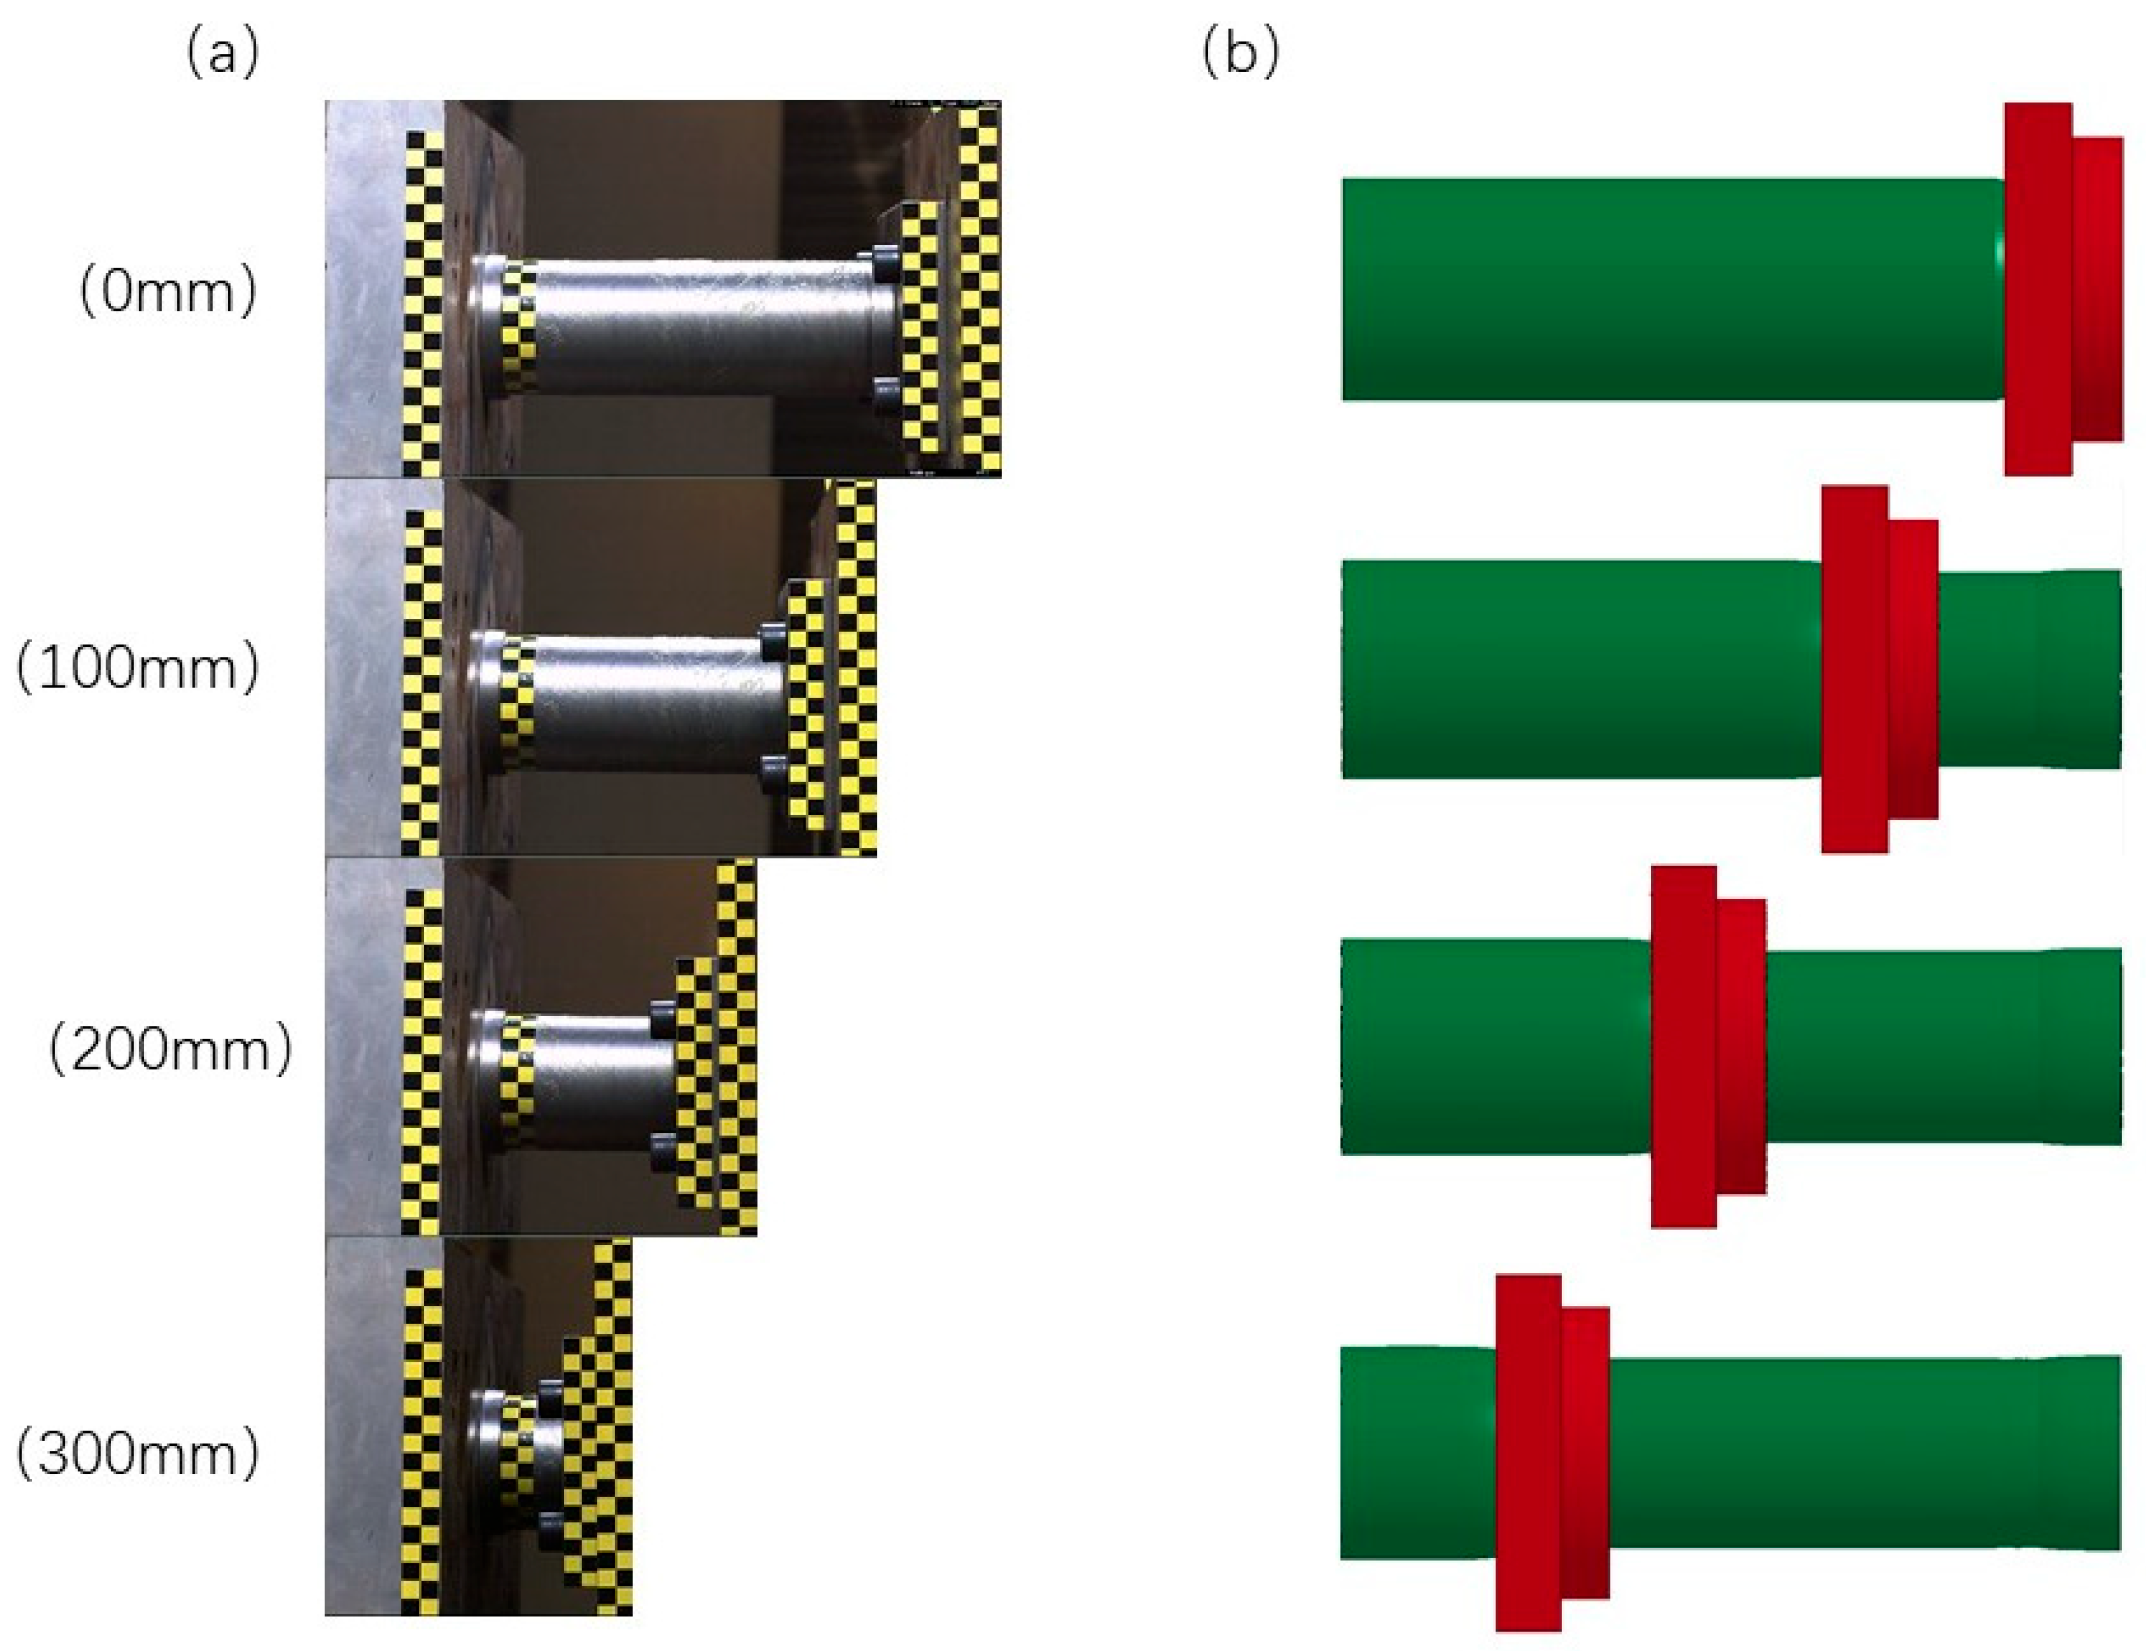
3.1. Test Scenario

The low-speed crash test is a common method used to verify the energy-absorbing structure of trains, but the crash test of actual running speed is almost impossible. As for the collision speed, the EN15227 standard [41] only puts forward that the energy absorption structure of the train end can meet the requirements of energy absorption at the running speed of 18 and 36 km/h, and the collision at higher speeds will inevitably lead to car body damage and casualties. To verify the crashworthiness of the shrink tube, the trolley test was carried out in the Key Laboratory of Traffic Safety on Track (Central South University). The schematic diagram of the test scene is shown in Figure 4. The anti-climbing device with shrink tube is fixed in the normal installation position of the trolley to impact the rigid wall at a certain speed after adjusting the counterweight according to the requirements of different energy absorptions. The impact speed of the trolley is obtained using the high-pressure air gun system. At the moment when the car touches the rigid wall, the trigger speedometer below the car can record the impact speed to ensure the accuracy of the impact energy. The pressure sensor records the process of force change during impact. A set of high-speed camera systems is arranged on the right side of the shrink tube to record the deformation process and displacement data of the shrink tube. The frequency of high-speed photography is 3000 Hz, and the frequency of pressure sensor is 500,000 Hz.

3.2. Finite Element Modeling

In this paper, the explicit nonlinear dynamic software LS-DYNA(12.1) is used to describe the dynamic behavior of circular tubes. In a train crash, the shrink tube is a deformed part. Material Type 24 is selected in LS-DYNA software (12.1), which is an elastoplastic material with an arbitrary stress versus strain curve, and arbitrary strain rate dependency can be defined. The employed plasticity model was *MAT_PIECEWISE_LINEAR_PLASTICITY. Considering the problem of large deformation, the SOLID164 unit was used for the shrink tube. The SOLID164 unit is an 8-node entity unit. By default, it applies reduced (single point) integration and viscous hourglass control to obtain faster unit algorithms. Single-point integration has the advantage of saving time and is suitable for large deformation cases. In order to speed up the calculation, the material model of “Mat.20 Rigid” is used to simulate the other parts. During the experiment, a trolley equipped with a shrink tube anti-climb device is used to crash with a rigid wall at an initial speed V, and in the simulation model, the front end of the trolley equipped with an anti-climb device of the same quality and speed is used to impact the fixed rigid wall, so that the simulation scene is completely consistent with the real test scene. As shown in Figure 5, the collision model of the trolley test is consistent with the actual test condition.
Grid convergence analysis was carried out to ensure both calculation accuracy and efficiency. As shown in Table 1, the convergence was compared under different mesh sizes. Considering the calculation time and precision requirements, the mesh size of the shrink tube and die is 3 mm. Because the other parts are not the main deformation part, the size of 5 mm is used for grid division. The size of 30 mm is used for grid division to trolley. The numerical simulation model of trolley test after grid division has a total of 518,540 nodes and 454,685 units.
The complete integral algorithm is adopted for deformed parts to prevent the hourglass phenomenon. The ‘Contact Automatic Surface-to-surface’ is set between the surfaces of different parts, and both the values of dynamic and static friction coefficient are 0.1. As a deformed part, the shrink tube is also set with the ‘Contact Automatic Single-surface’, and both the values of dynamic and static friction coefficient are 0.05 [42]. The ideal impact velocity of test trolley is 4.11 m/s with a mass of 27 t.

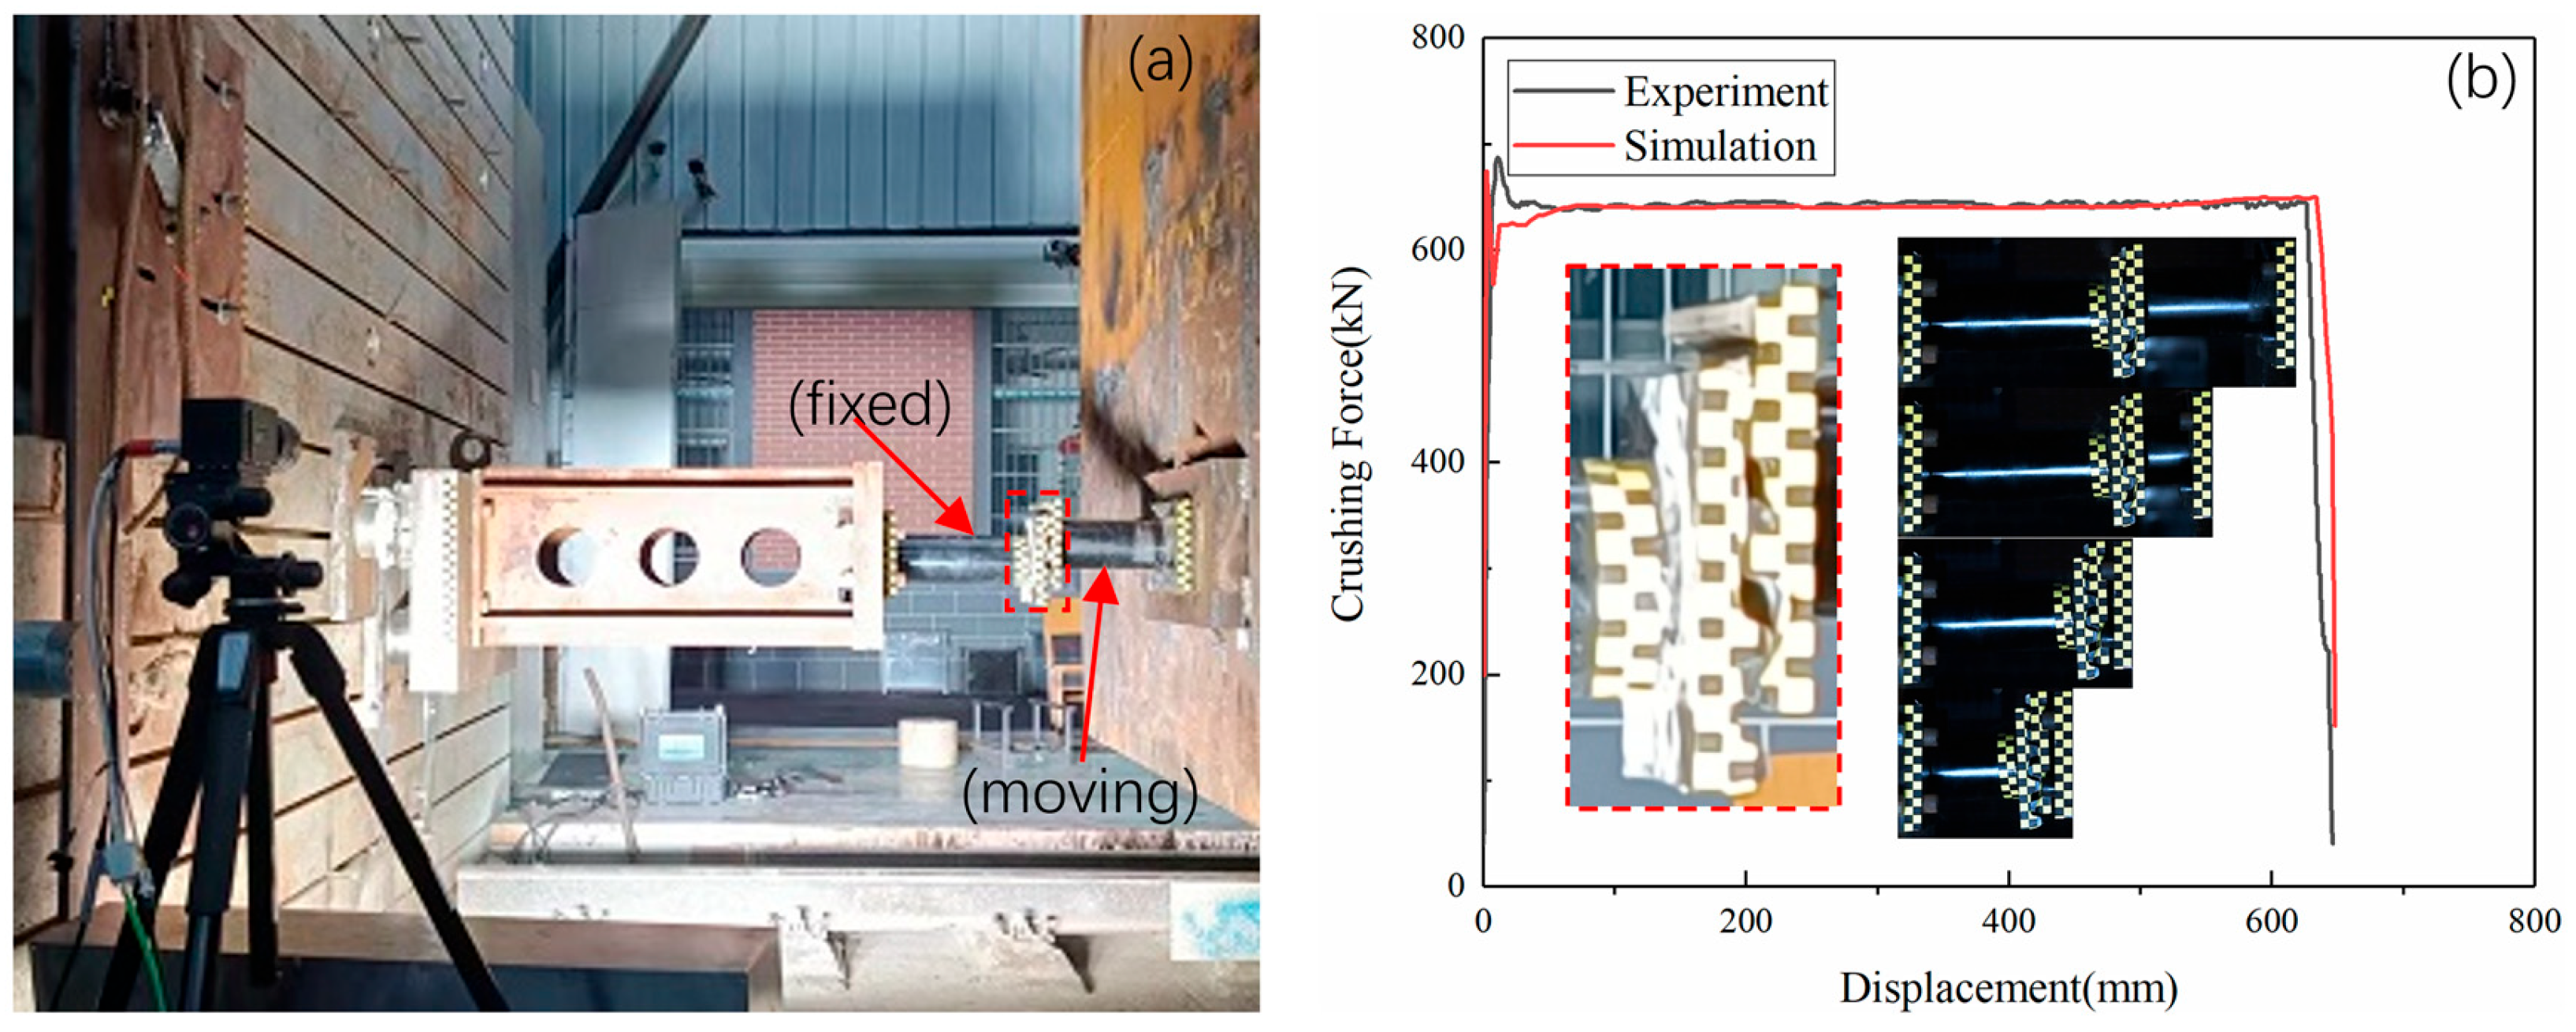
3.3. Verification of the Numerical Simulation Model

In the crash test, the shrink tube is pressed into the flange of the shrink mold, and the high-speed camera system cannot show the shrinkage deformation process, but it can observe that there is no shock and bending bias load during the compression process. Other parts have no plastic deformation AND no fracture, and the whole energy-absorption structure works well. As shown in Figure 6, the displacement of 0 mm, 100 mm, 200 mm, and 300 mm during the test and simulation are compared, which has a good agreement.
The comparison between test data and simulation data is shown in Figure 7. The impact force, displacement, and energy absorption curves are basically consistent. After the collision, the final displacement of the test and simulation are 303.64 mm and 307.86 mm, respectively. The energy absorption of experiment and simulation is 194.96 kJ and 198.55 kJ, respectively, and the relative error is 1.81%. The experimental and simulated MCF are 642.08 kN and 644.94 kN, respectively, and the relative error is 0.45%. The results of the experimental MCF and the simulation MCF in this model are almost identical, which shows that the numerical simulation model is reliable and effective and can be used for subsequent research. The impact force remains basically unchanged after the displacement reaches 100 mm, as shown in Figure 7c. To compare the MCF of the constricted tube more conveniently, the average impact force of the first 200 mm displacement was taken for analysis in subsequent studies.

3.4. Verification of Anti-Climber Device in Collision Condition

In order to verify the anti-climb capability, the anti-climbing device collision test was carried out in accordance with the requirements of EN15227. According to EN15227, the anti-climbing devices of the two trains in the opposite direction need to mesh together to ensure longitudinal compression and energy absorption so as to avoid the instability of the anti-climbing devices under partial load and the phenomenon of vertical train climbing in the collision accident. The shrink tube energy absorption device was installed on a 27 t test bench and a fixed, rigid wall, respectively, and the anti-climber teeth collision test was carried out to simulate the crawling phenomenon in collision accidents. In the test, the anti-climber teeth of the moving end are 40 mm higher than that of the fixed end, and the impact speed of the vehicle is 5.51 m/s. According to the test conditions, the test scene is arranged as shown in Figure 8a. By obtaining displacement data and impact force data through high-speed photography and pressure sensors, the total absorbed kinetic energy of the anti-climbing device is 409.18 kJ. By integrating the curve of force and displacement, the total deformation is 646.5 mm, and the mean crushing force in the whole collision stroke is 632.92 kN.
The mean crushing force is 638.67 kN for the numerical simulation model, the energy absorption stroke is 648 mm, and the energy absorption is 413.86 kJ. The energy error between the numerical simulation model and the vehicle test is 1.13%. The deformation sequence diagram and the force versus displacement curve of the sample are shown in Figure 8b. The collision process is divided into two stages. First of all, the shrink tube of the moving end shrinks and deforms. As the stroke of the moving end collapses, another shrink tube of the fixed end begins to deform until the impact energy is absorbed. Shrink tube deformation is stable and controllable, with no buckling instability, and the force value is stable during collision. It is proved that the shrink tube can effectively absorb energy in train collision accidents and prevent the phenomenon of climbing.

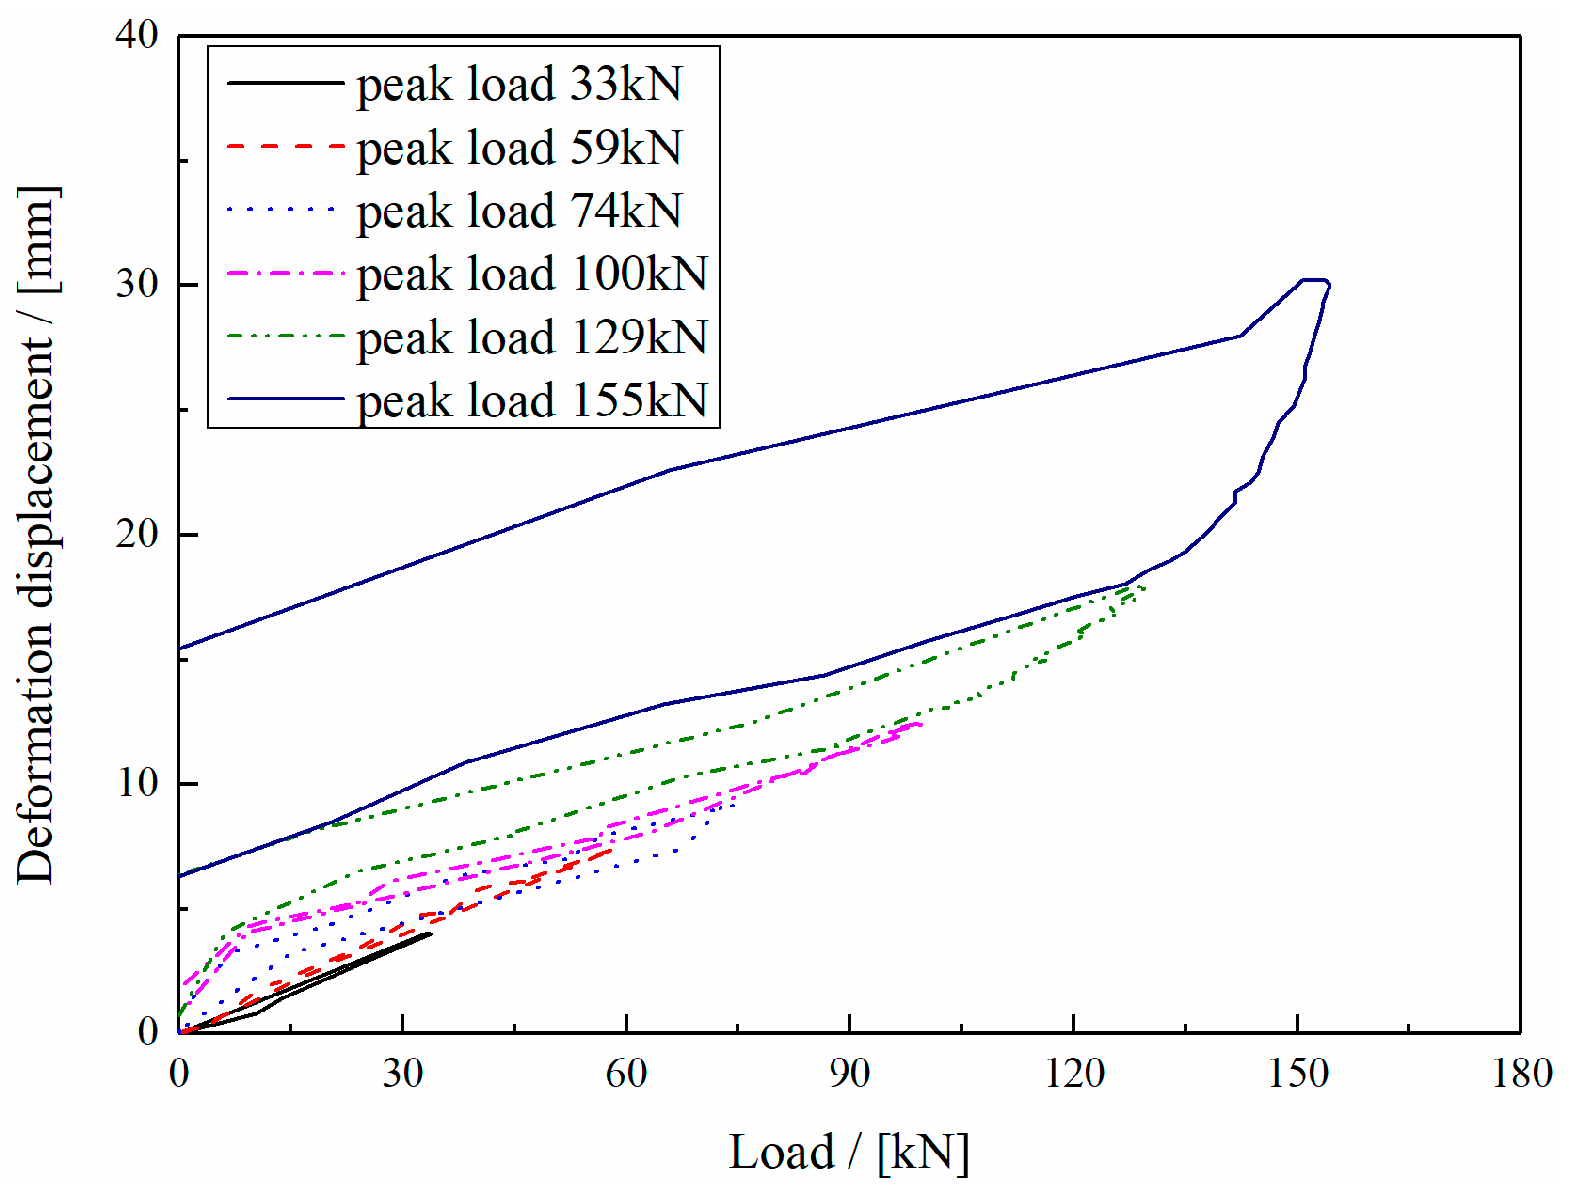
3.5. Verification of Vertical Bearing Capacity of Anti-Climber Device

To evaluate the vertical bearing capacity of the shrink tube anti-creep device, a set of test systems is designed. The test system includes tooling frame, pressure sensor, hydraulic cylinder, piston, displacement sensor, and anti-climber device, as shown in Figure 9. The pressure sensor, hydraulic cylinder, and piston are confined in a horizontal cylinder, and the end of the anti-climber device is fixed to the tooling frame base plate. During the test, the piston is driven to the right by the electric hydraulic pump, and the load is applied to the teeth plate of the anti-climb device. The anti-climb teeth plate moves to the right after the force, which drives the overall deformation of the shrink tube. The displacement sensor set on the tooth plate collects real-time displacement data, and the pressure sensor at the back of the cylinder collects real-time load data, which can synthesize displacement and load curves.
Vertical loading test was carried out on the anti-climb device, and the displacement and force curves during loading and unloading under different peak loads were obtained, as shown in Figure 10. When the peak load is below 100 kN, there is almost no residual deformation. When the peak load is 129 kN, the residual deformation is 6.5 mm, and when the peak load is 155 kN, the residual deformation is 15.5 mm, which meets the technical requirements of vertical load of ≥150 kN.

4. Analysis of Influencing Factors of Crashworthiness

Several main factors affecting the MCF, such as wall thickness, friction coefficient, cone angle, radius of contraction tube, and axial length of friction cone, were selected for parameter analysis to study the change of crashworthiness. A set of original parameters is taken here, in which the large diameter R1 is 65 mm, small diameter R2 is 60 mm, the thickness T is 12 mm, the cone angle α is 11.31°, the friction coefficient u is set to 0, and the axial length of the friction cone S is 25 mm. On this basis, the influence of changing a certain parameter is studied.

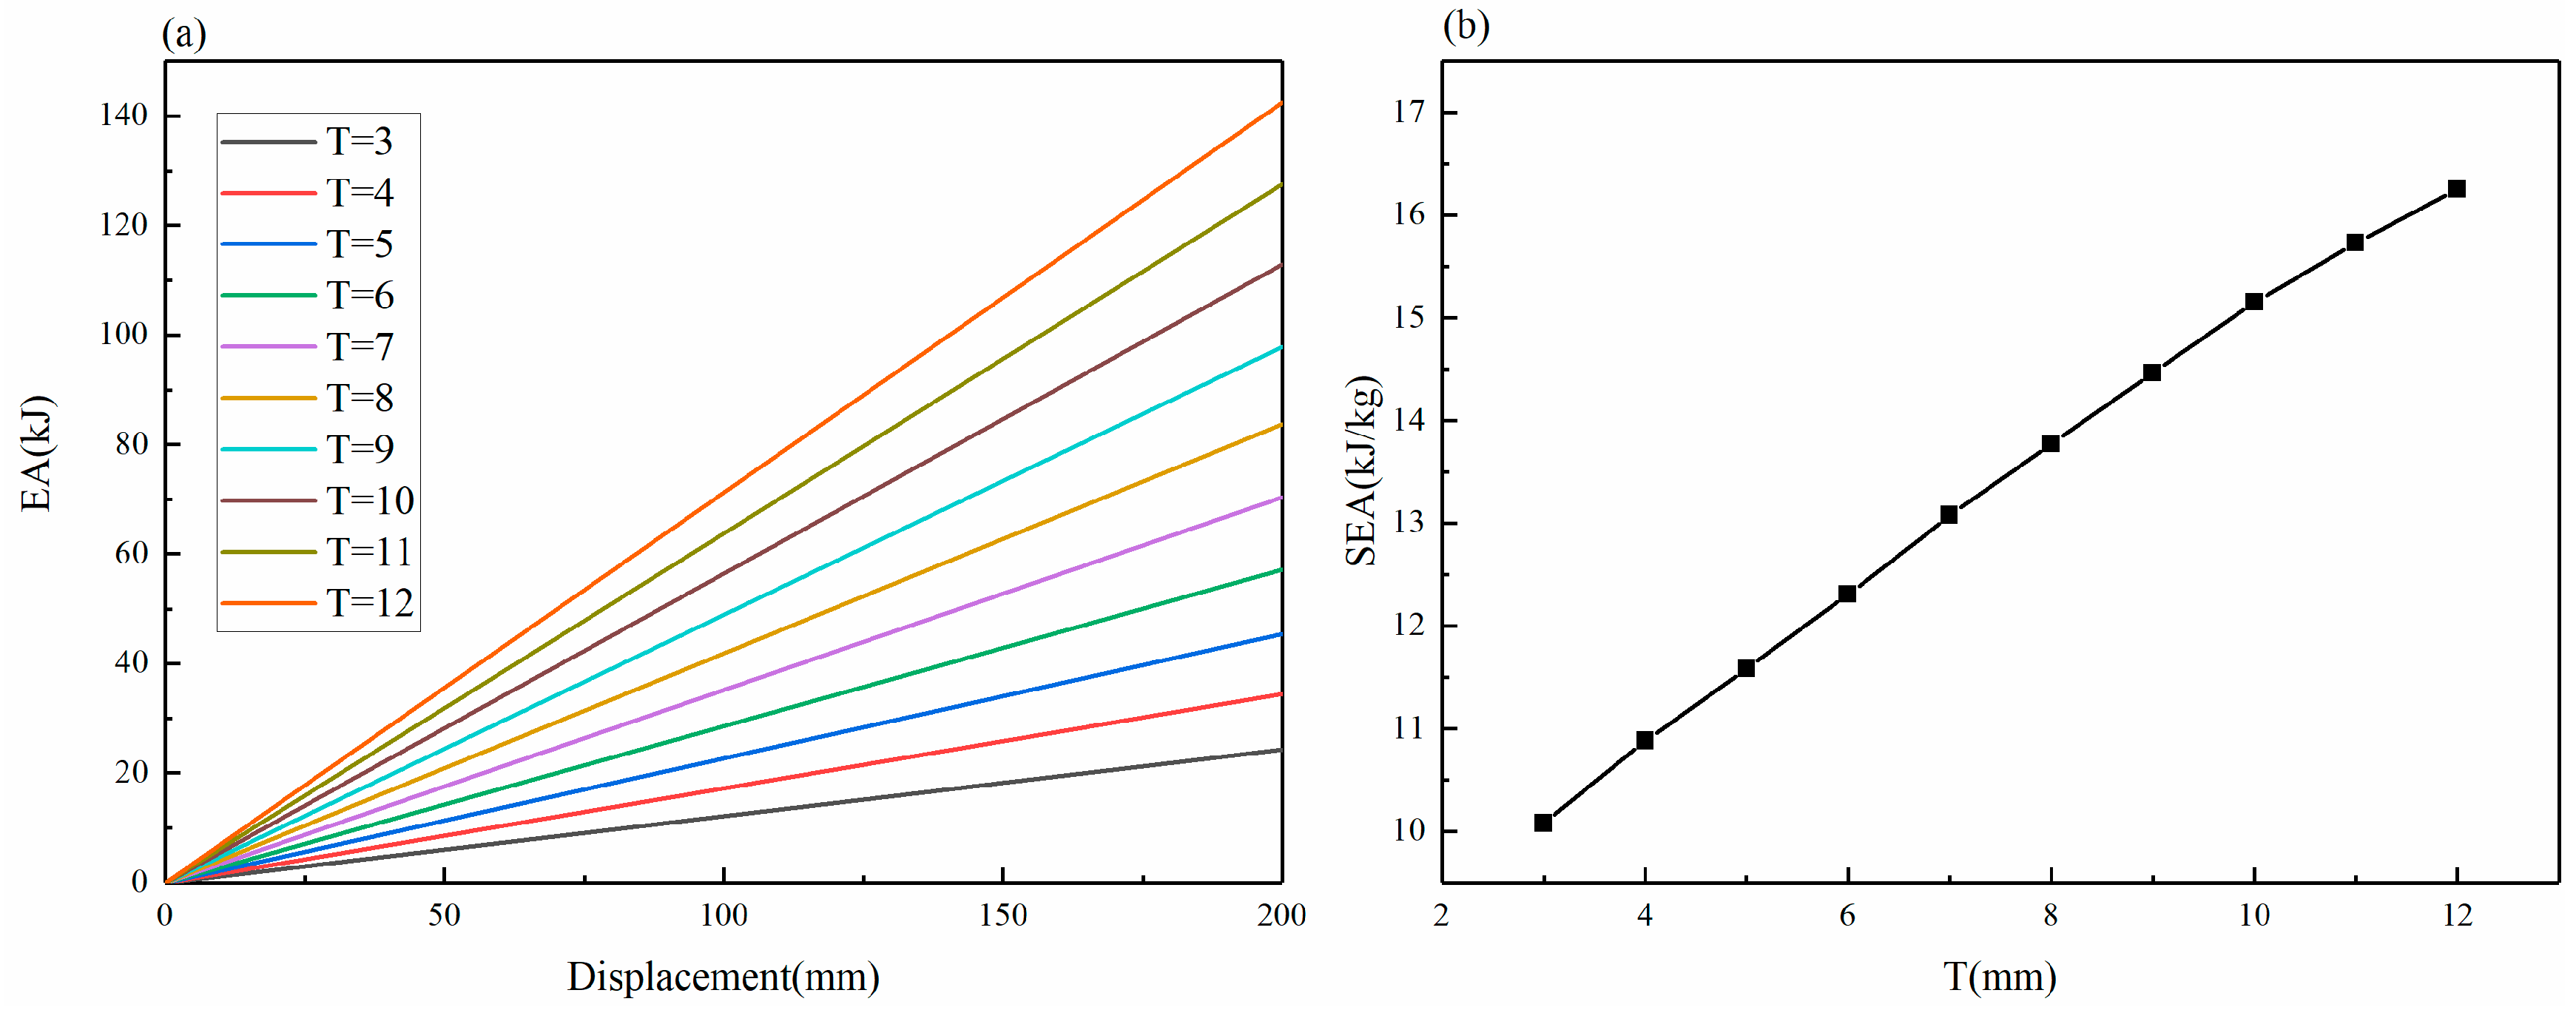
4.1. Effect of the Wall Thickness

To eliminate the uncertain influence of the friction coefficient, the friction coefficient is set to zero in this part, and the wall thickness T of the shrink tube is set to be 3–12 mm to study the influence of the above different wall thicknesses on the MCF of the shrink tube. The force and displacement curves under different wall thicknesses are shown in Figure 11a. They show that the MCF increases uniformly with the increase in wall thickness, and the shapes of the force and displacement curves are similar.
For each curve, the Fmax appears within the displacement of about 10 mm at the initial stage, rapidly decreases, and begins to increase after reaching the minimum value at about 20 mm until it no longer changes after reaching a stable platform force. It is shown in Figure 11a that the thinner the wall thickness, the shorter the gentle phase after the Fmax decline. With the increase in the wall thickness, the displacement to reach the platform force also increases. When the wall thickness is 3 mm, the platform force is 92.5 kN at the displacement of 32 mm, and when the wall thickness is 12 mm, the platform force is formed at the displacement of 55 mm, and the value is 543 kN. Further, it is shown in Figure 11b that there is a close linear relationship between the MCF and the increase in wall thickness. Under this design parameter, every 1 mm increase in the wall thickness increases the MCF by about 45.1 kN.
The energy absorption and displacement curves under different wall thicknesses are shown in Figure 12. It shows that with the increase in wall thickness, the energy absorption also increases linearly, and the SEA has a close linear relationship with the increase in wall thickness. Under this design parameter, every 1 mm increase in the wall thickness increases the SEA by about 0.618 kJ/kg.

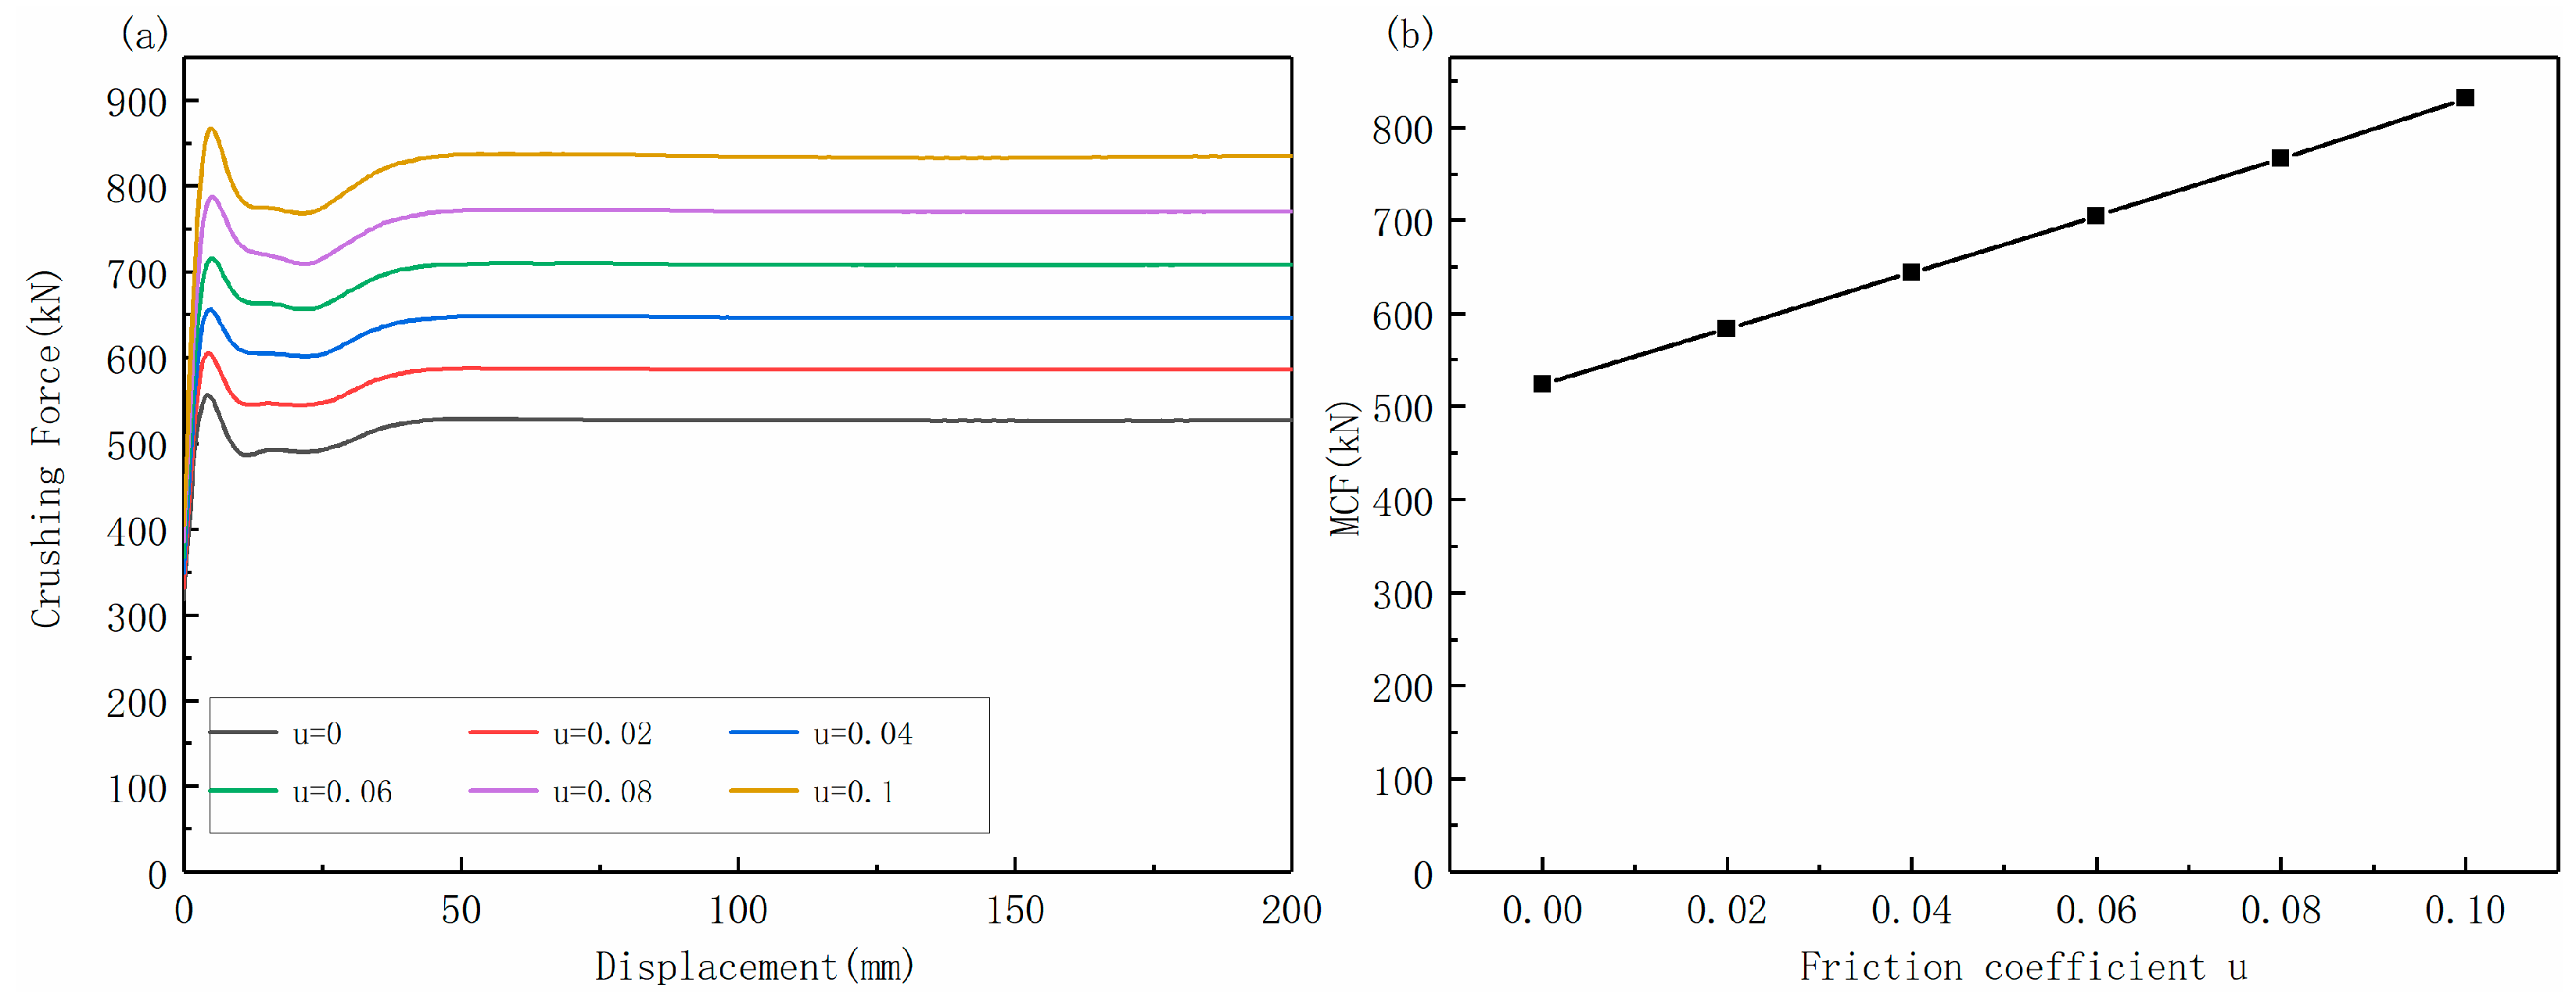
4.2. Effect of the Friction Coefficient

When the wall thickness T = 12 mm and other values are consistent with the above section, the effect of different friction coefficients on the MCF is studied. Friction is mainly related to material properties, surface treatment, and lubrication measures. It mainly occurs on the contact between the outer surface of the shrink tube and the inner surface of the shrink flange. The values of friction coefficients are 0, 0.02, 0.04, 0.06, 0.08 and 0.1, respectively. The force–displacement curves under different friction coefficients are shown in Figure 13a. With the increase in friction coefficient, the shape of the force–displacement curve remains basically the same, but the Fmax and MCF increase uniformly. The Fmax appears in each curve within the displacement of 3–5 mm at the initial stage, maintains a stable value after a slight decline, continues to increase, and increases to a stable force within 45–50 mm. For example, in the case of friction coefficient u = 0.04, the Fmax appears at the displacement of 4.7 mm. For the value of 656 kN, in the displacement range of 10–25 mm, the force value is small and then begins to increase until the displacement reaches 48.6 mm. The stable force reaches 647 kN and then maintains a stable state. Further, it is shown in Figure 13b that the increase in MCF and friction coefficient is close to a linear relationship. Under this design parameter, every 0.02 increase in friction coefficient increases the MCF by about 61 kN.
The energy absorption and displacement curves under different friction coefficients are shown in Figure 14a. With the increase in friction coefficient, the energy absorption also increases linearly. It is shown in Figure 14b that the SEA increases linearly with the increase in the friction coefficient. Under the design parameter, the SEA increases by 1.53 kJ/kg with an increase in the friction coefficient by 0.02.

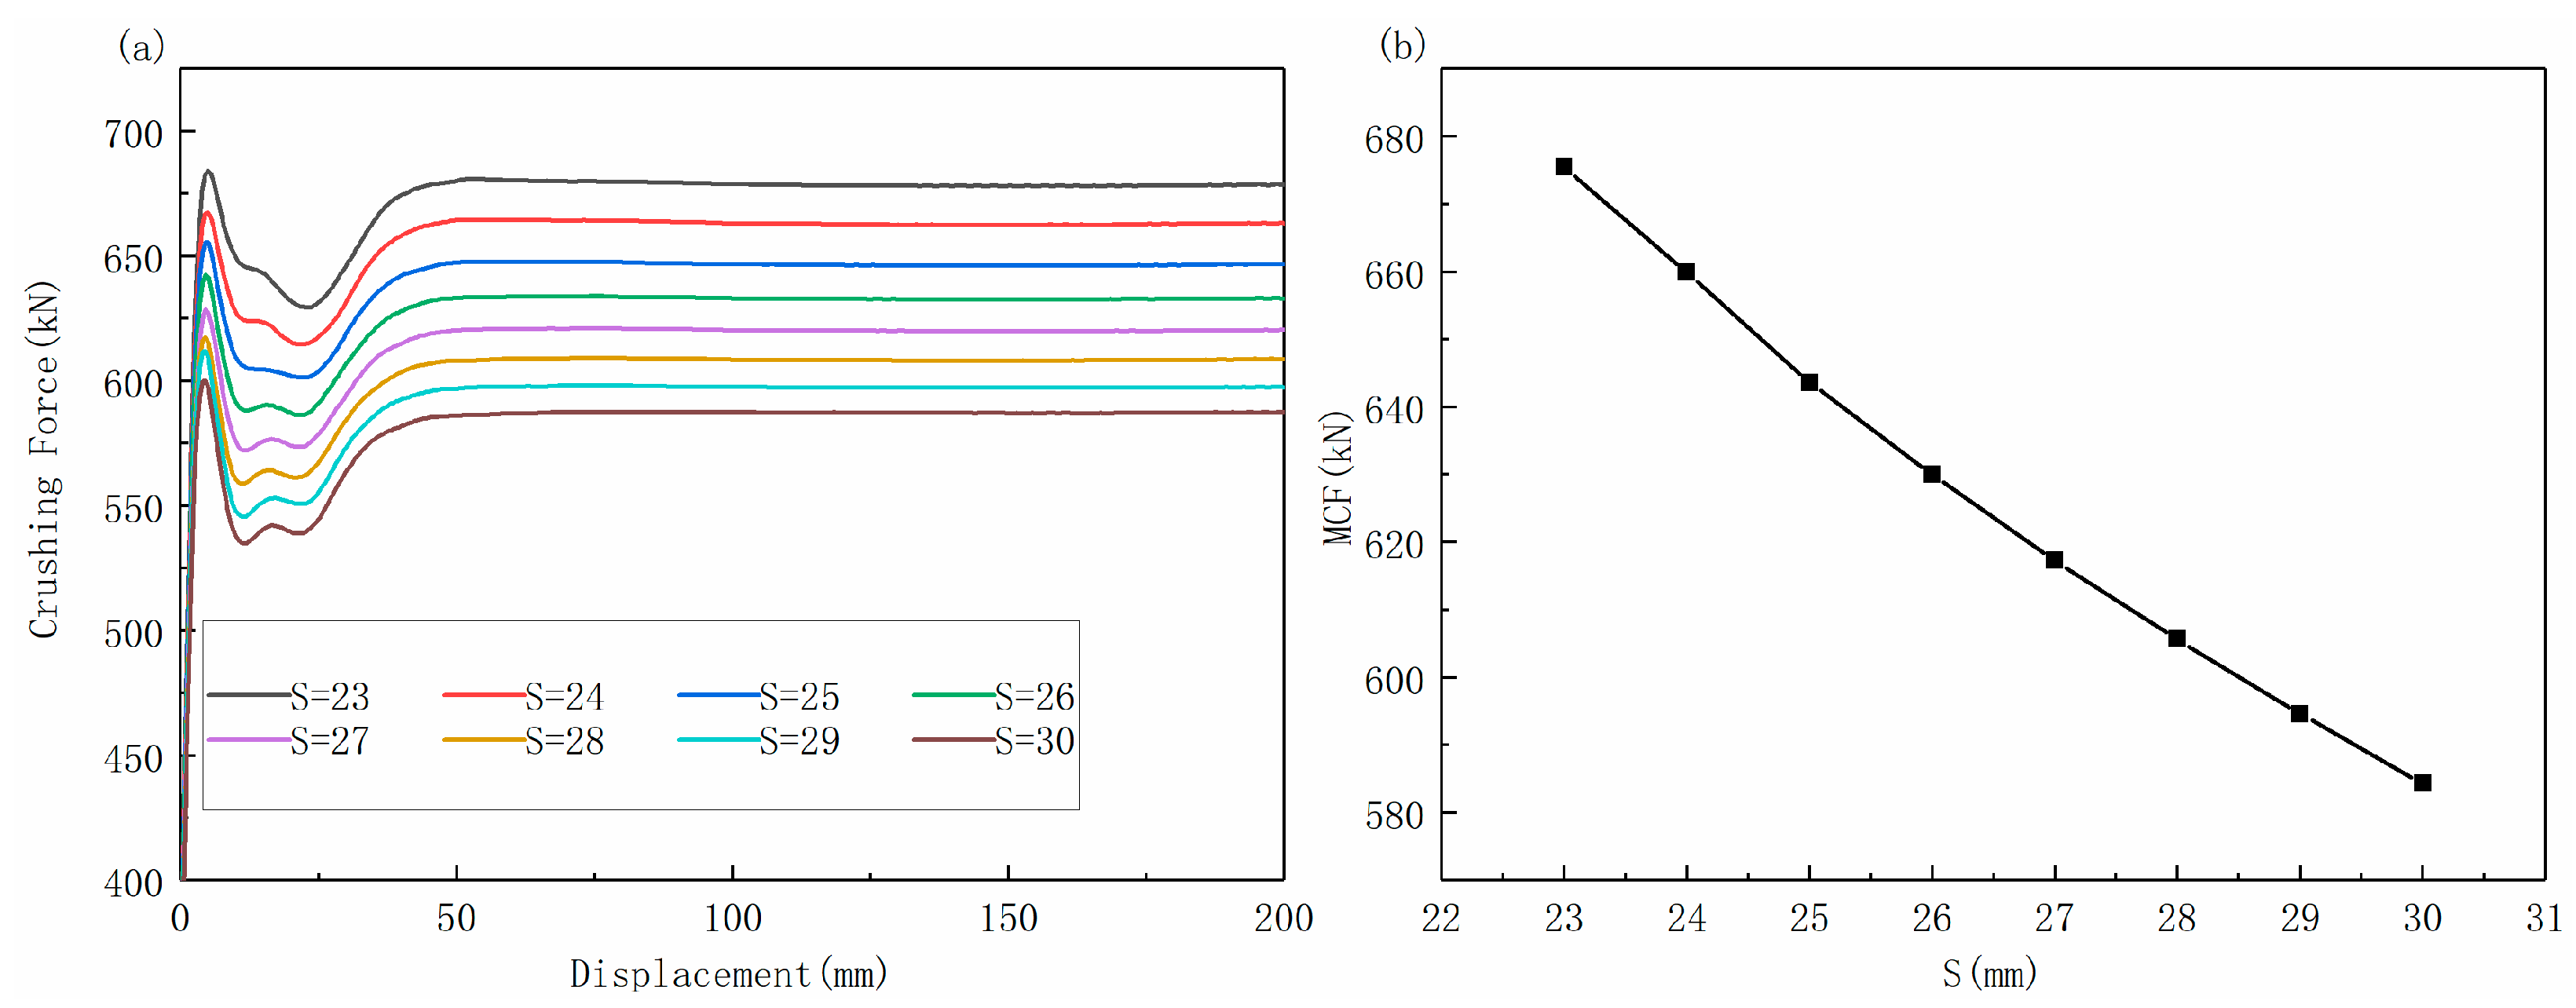
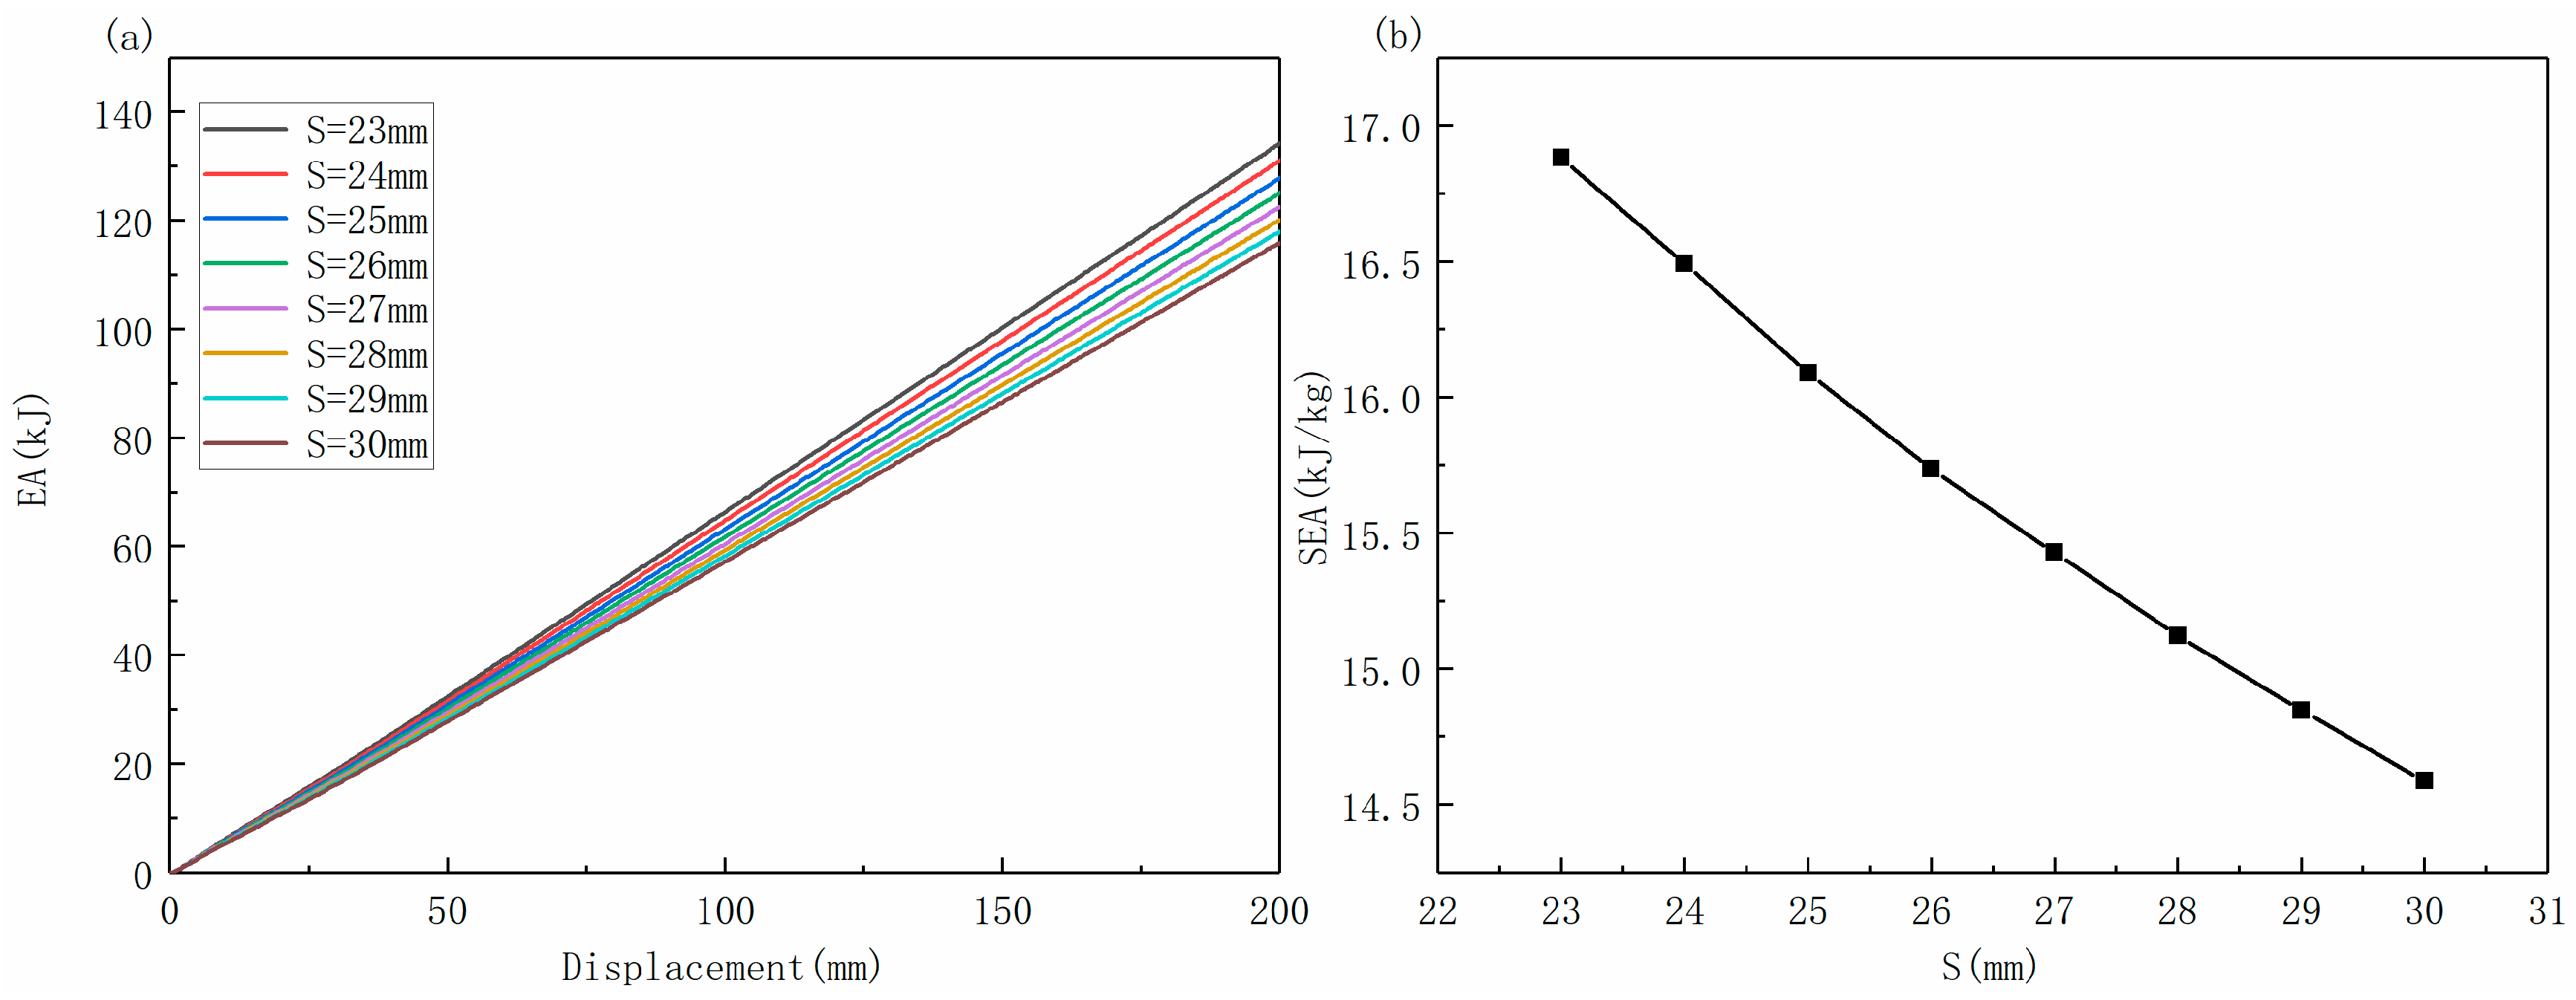
4.3. Effect of Axial Length of Friction Cone

In order to determine the effect of different axial lengths of friction cone S on the MCF, the other dimension parameters are consistent with the preceding section. The axial length of the friction cone S is 23, 24, 25, 26, 27, 28, 29, and 30 mm, respectively. The force–displacement curves under different S of the friction cone are shown in Figure 15a. It shows that the shape of the force–displacement curves remain basically the same with the increase in the axial length S of the friction cone, but the Fmax and MCF decrease successively. The reduction is small. Further, it is shown in Figure 15b that the MCF decreases by 13.5 kN when the axial length S of the friction cone increases by 1 mm, which does not have a linear relationship. The shape of each curve is basically the same as that of curve shapes under the change of the first two parameters. The Fmax appears at the displacement of 4 mm in the initial stage, maintains a stable value after a slight decline, then continues to increase, and then increases to a stable force within 45–50 mm.
The energy absorption and displacement curves under different axial lengths of the friction cone are shown in Figure 16a. With the increase in the axial length of the friction cone, the energy absorption decreases correspondingly, with a small reduction. At the same time, it is shown in Figure 16b that as the axial length of the friction cone increases, the SEA decreases correspondingly. When S is 23–26 mm, the growth is faster, and when S is 27–30 mm, the growth is slower.

4.4. Effect of Cone Angle

When the cone angle is 25°, the shrink tubes with different thicknesses can be stably deformed. The wall thickness T of the shrink tube is set to be 3–12 mm. The force and displacement curves are similar to those of the small cone angle shrink tubes, but the mean force is higher than the initial peak force. When the cone angle is 25° and 30°, the force and displacement curves of the shrink tubes with different thicknesses are compared, as shown in Figure 17. When the cone angle is 30°, the force value of the shrink tube with different thicknesses is no longer stable in the process of energy absorption, the force value is always in an increasing state, and there is no platform force. The force and displacement curves fluctuate in different amplitude in the whole process, indicating that the shrink tube has undergone buckling and instability.
The half-section view of the shrink tube at the displacement of 100 mm was taken to compare the deformation process, as shown in Figure 18. We can compare the black circles in the two figures; when the cone angle is 25°, the unshrunk part remains in the normal state. When the cone angle is 30°, the unshrunk part has an arch, and the shrink tube changes from the shrink mode to the folded mode.
According to the content in the above section, it can be found that adjusting the axial length S can only slightly adjust the MCF because the change of the cone angle is very small. Next, the influence of the change of the cone angle is directly studied. It was found that when the cone angle exceeded 25°, the shrink tube would be buckling and unstable and could not produce stable shrinkage deformation. Therefore, the cone angle variation range was 5° to 25° in the subsequent study of the influence of angle change.
As shown in Figure 19a, the SEA of shrink tubes with different thicknesses increases rapidly with the increase in cone angle. It can be seen in the slope of each curve that the SEA increases faster with the increase in angle. When the cone angle of the shrinkable tube increases from α = 5° to α = 25°, the increase in SEA of the shrinkable tube with different thickness is more than 600%, and the overall increase in SEA is little different. When the wall thickness is 5 mm, the increase in minimum is 604.38%, and when the wall thickness is 12 mm, the increase in maximum is 636.81%.
As shown in Figure 19b, the MCF of the shrink tube with different thicknesses increases rapidly with the increase in the cone angle. When the cone angle increases from α = 5° to α = 25°, the MCF of the shrink tube increases by about 600%; when the wall thickness is 6 mm, the increase rate is the smallest (595%); when the wall thickness is 12 mm, the increase rate is the largest (617%). In general, the greater the thickness, the faster the growth of the MCF. It can be seen from the slope of each curve that the MCF of the same thickness shrinkable tube increases faster with the increase in the angle range.
As shown in Figure 20a, the variation trend of SEA of shrink tubes at different cone angles with the thickness of shrink tubes is close to linear growth. From T = 3 mm to T = 12 mm, the increase in SEA of shrink tubes is about 160%. When the cone angle is 5°, the increase is the smallest, 157.26%, and when the cone angle is 15°, the increase is the largest, 161.71%. As shown in Figure 20b, the variation trend of the MCF with the increase in the thickness at different cone angles is close to linear growth. From T = 3 mm to T = 12 mm, the increase rate of the MCF of the shrink tube is more than 570%. When the cone angle is 5°, the increase rate is a minimum of 576%, and when the cone angle is 10°, the increase rate is a maximum of 587%.

4.5. Effect of Shrinking Tube Radius

The effect of the radius R1 change on the SEA and MCF is studied while the cone angle and tube wall thickness remain unchanged. When α = 15° and T = 6 mm are kept constant, the SEA changes greatly with the radius, as shown in Figure 21a, while the MCF changes little with the radius, as shown in Figure 21b. With the increase in the radius from 40 mm to 75 mm, the decrease in SEA is first faster and then slower, which decreases faster when the radius increases from 40 mm to 60 mm; the SEA decreases from 33.66 kJ/kg to 21.07 kJ/kg, and the decline is slower when the radius increases from 60 mm to 75 mm. The SEA only decreased from 21.07 kJ/kg to 17.08 kJ/kg. In the process of radius increase, the MCF is always in a relatively stable range, showing only a small fluctuation; the MCF first decreases and then increases. The starting and ending values are 348 kN and 346 kN, respectively, and the minimum value is 339 kN when the radius is 60 mm. This shows that the SEA decreases with the increase in the radius of the shrinkable tube, and the change of radius has little effect on MCF. Similarly, the change of radius has little effect on the absorption energy. The data of various types of energy extracted by LS-DYNA software (12.1) were compared, as shown in Figure 22. Internal energy and sliding energy account for the majority, with internal energy accounting for more than 80%, sliding energy accounting for about 15%, and other energy totals being less than 5%. The energy proportion fluctuates little with the change of the radius.

5. Discussion

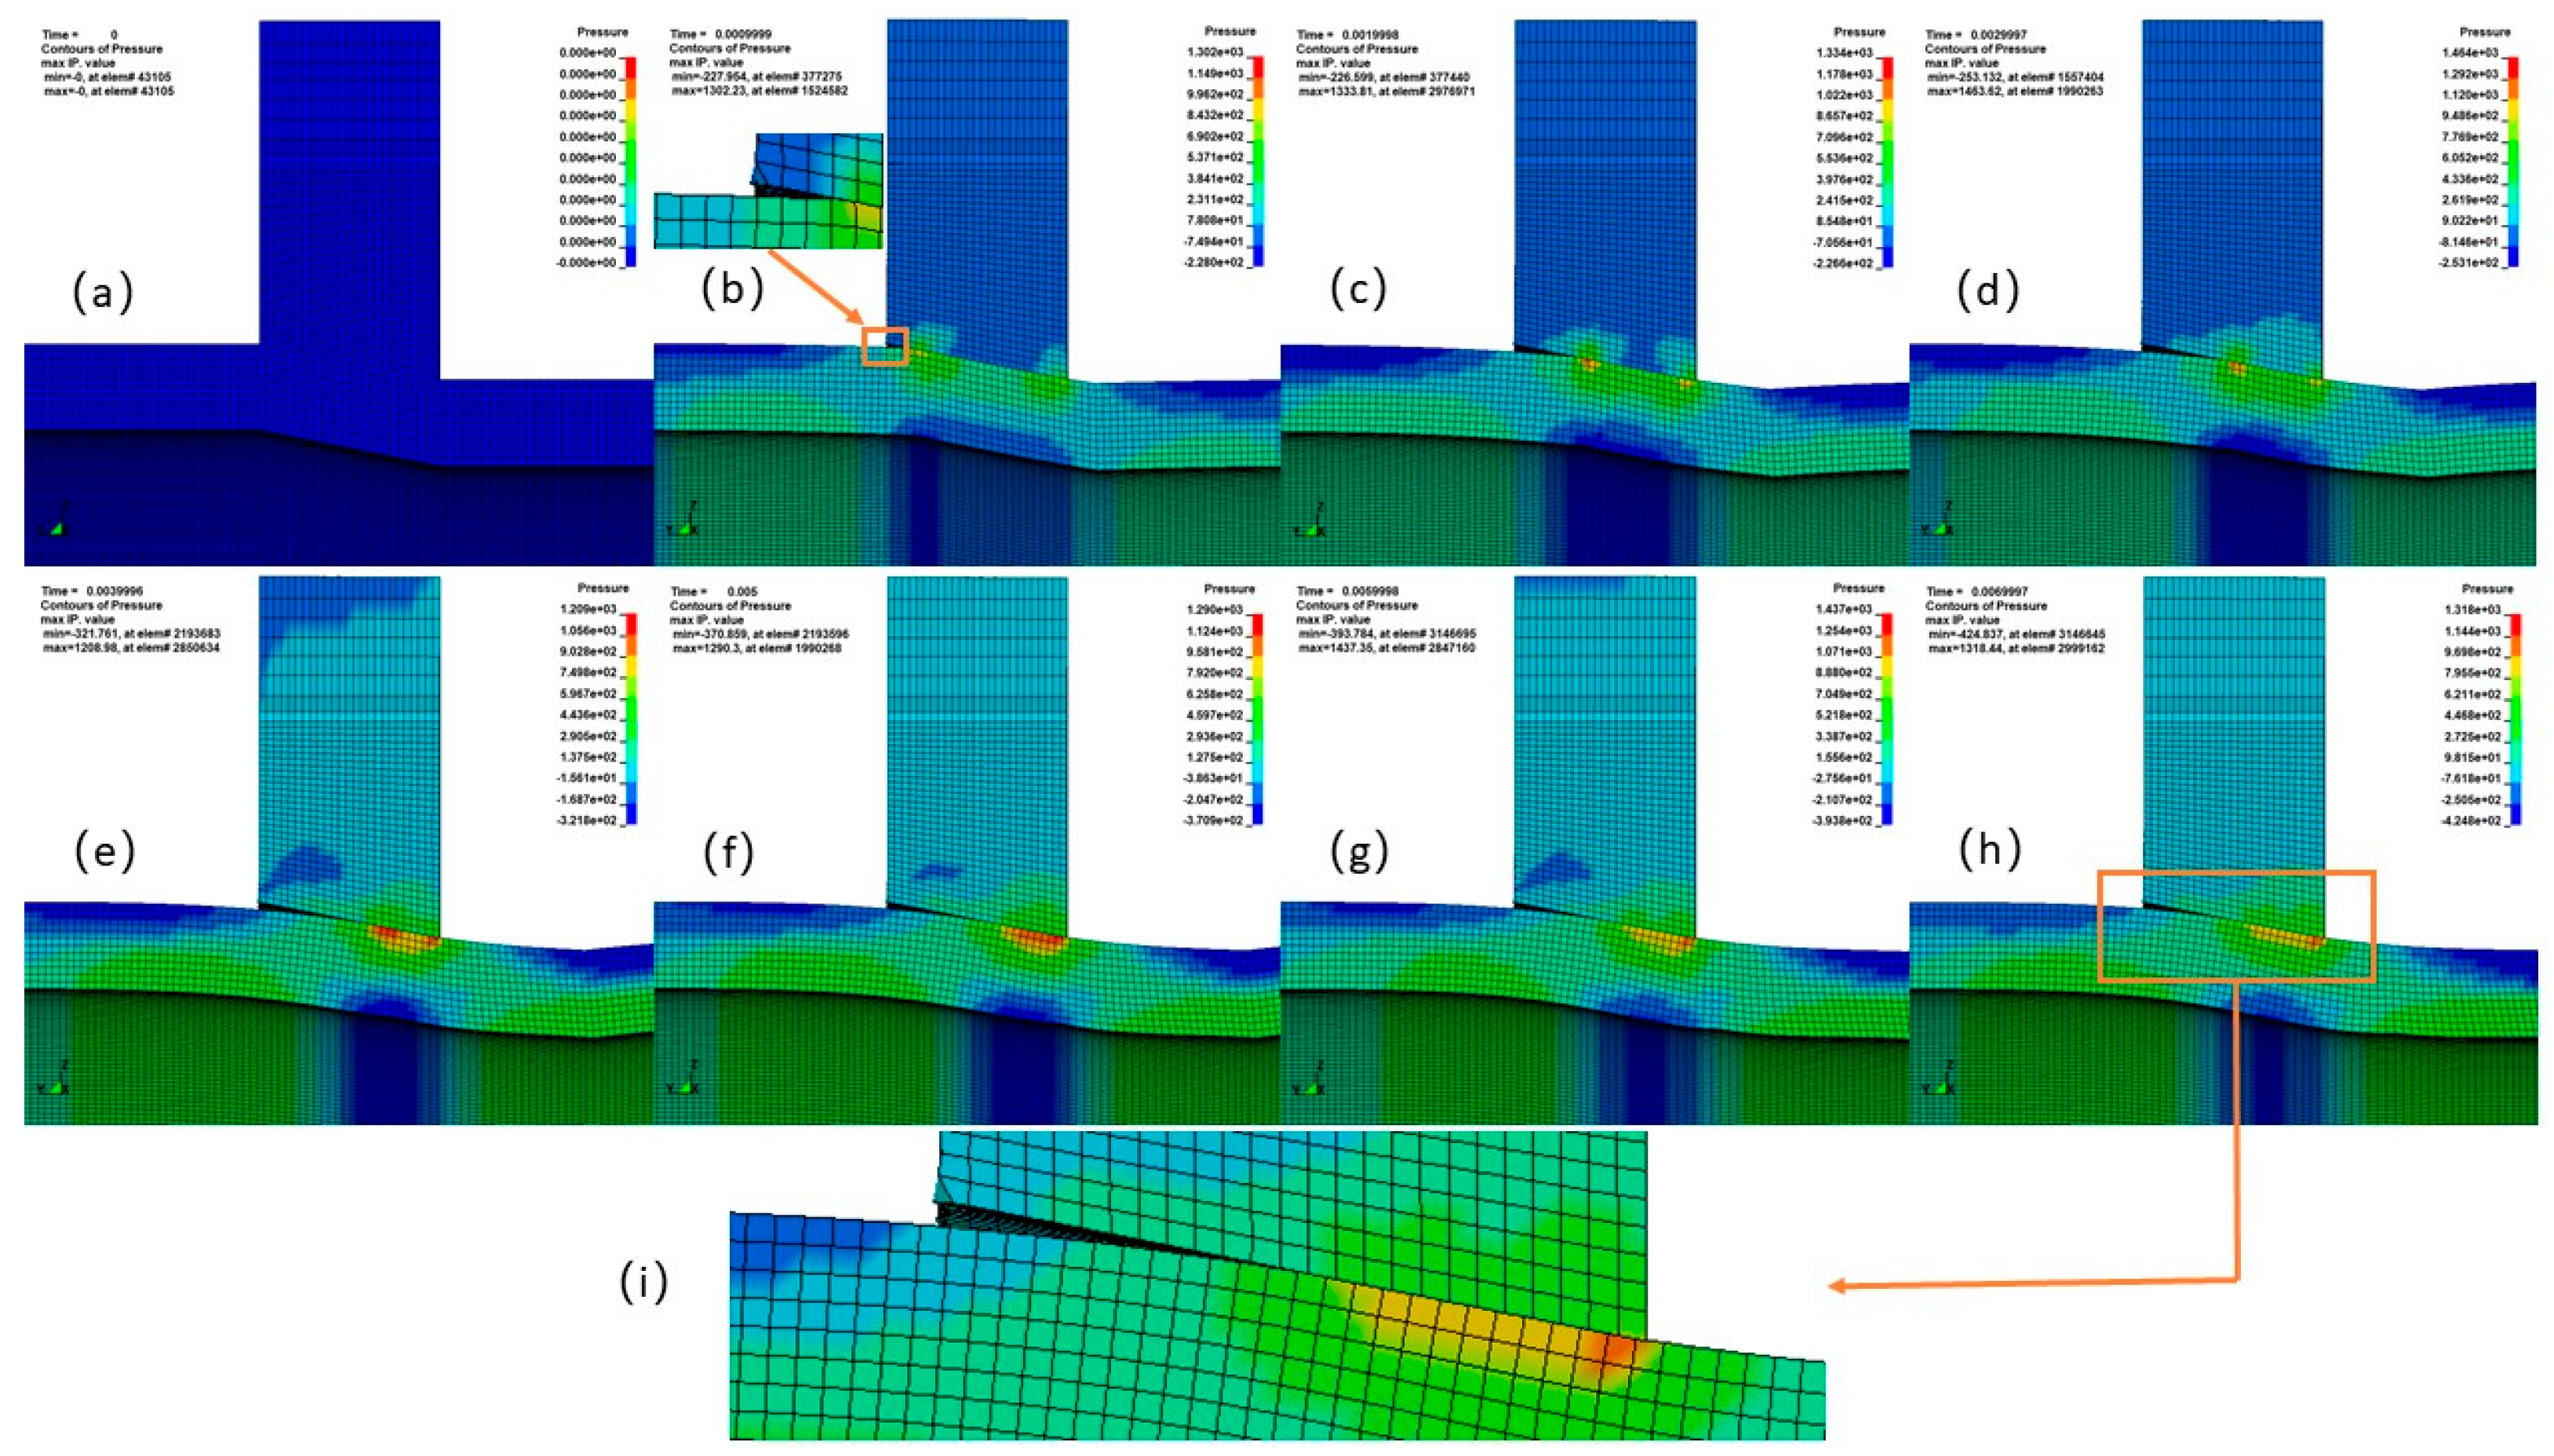
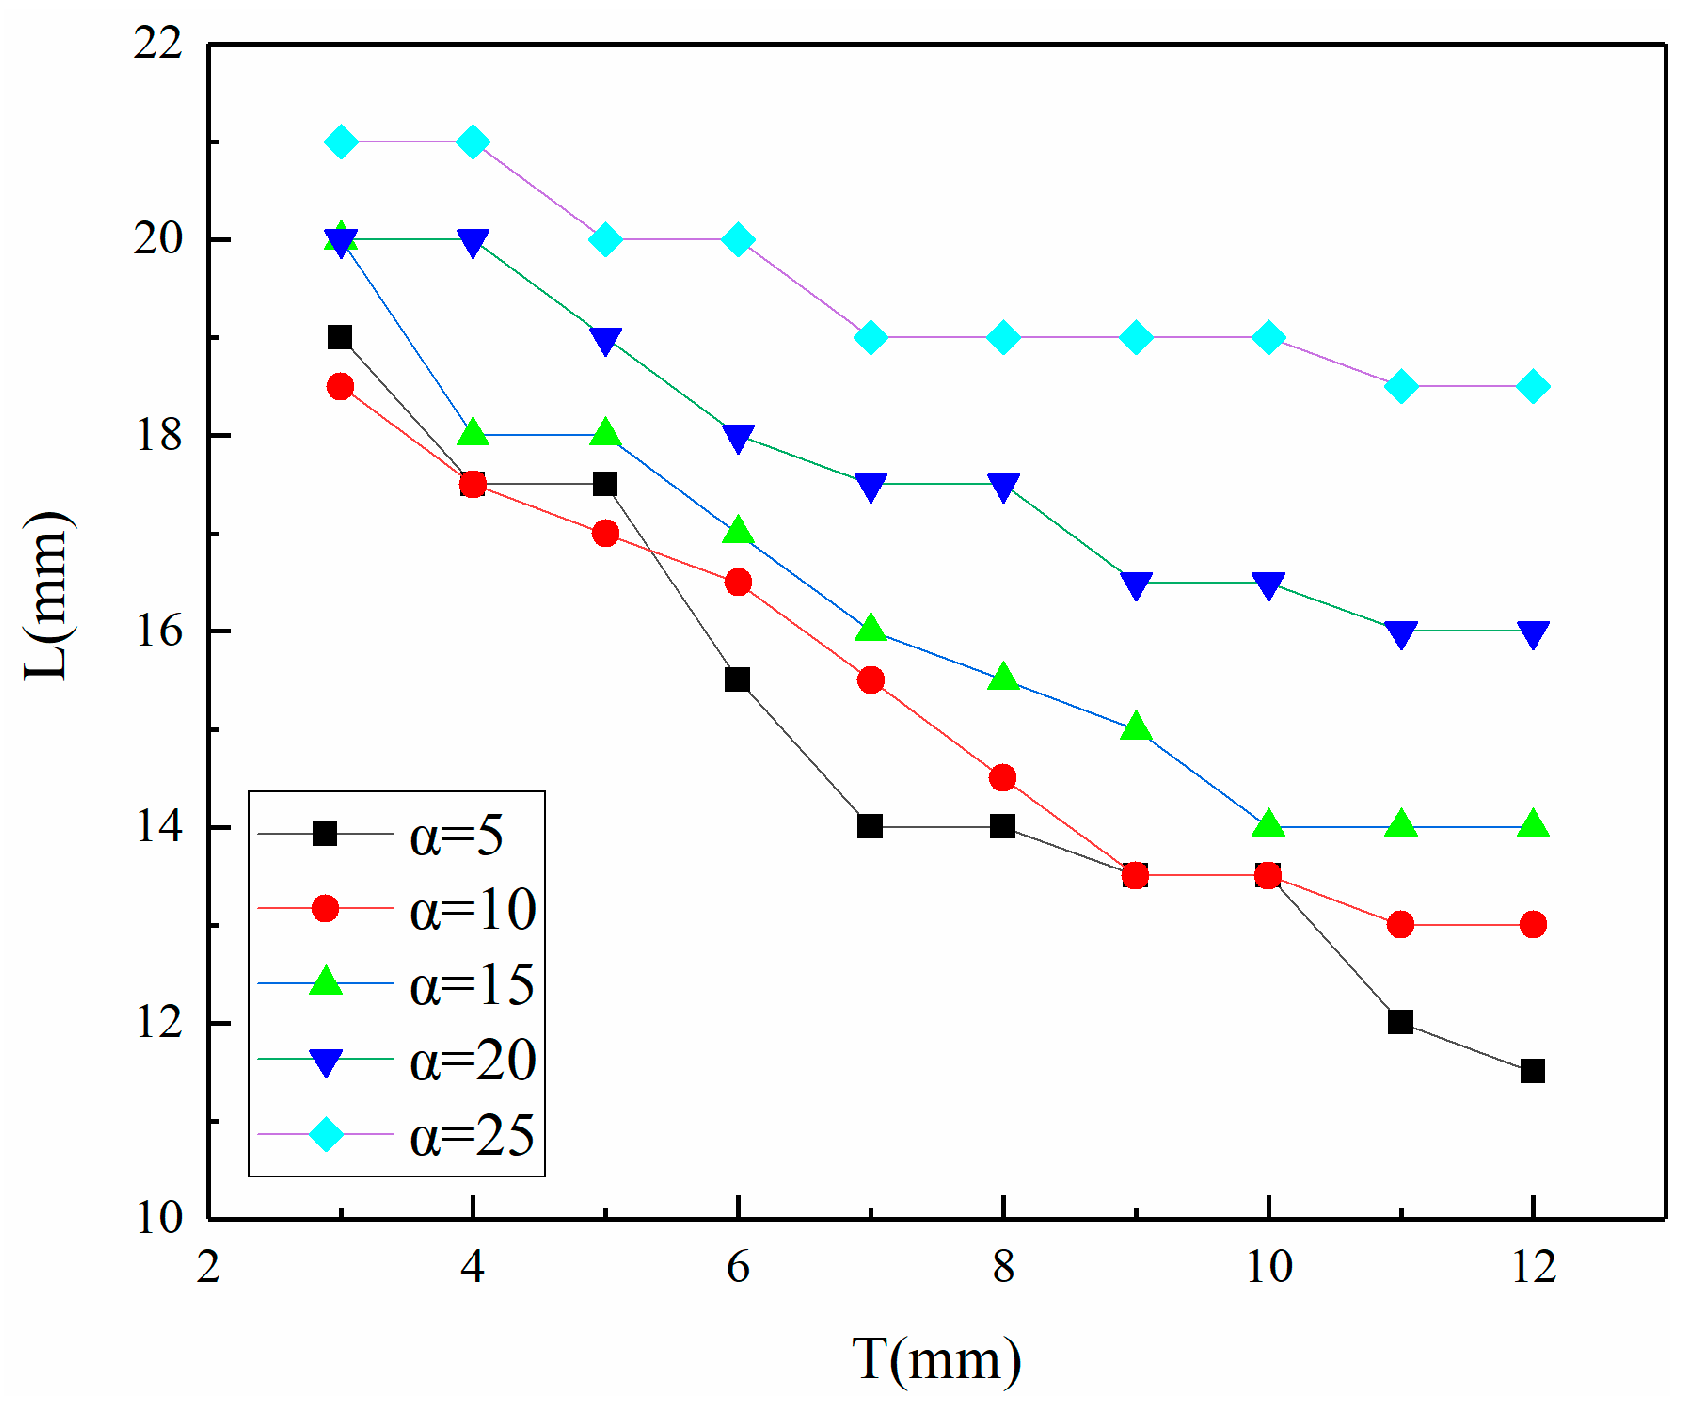
5.1. Conical Contact Length Analysis

During the shrinkage process, the conical surface of the flange will wear, the conical surface of the shrinkable tube will be squeezed and deformed, and the inner and outer conical surfaces will not completely fit together, resulting in a certain contact gap and a smaller contact length. Figure 23 shows the change process of contact length at the time of 0–7 ms, which occurs at the contact position between the shrink tube and the shrink flange, as shown in the local enlarged image. To facilitate the analysis of contact length, the mesh cell size of this simulation model is divided into 1 mm segments. In the original state, the inner and outer conical surfaces are the same length and are completely fitted together without gaps. At 1 ms, wear and damage occur at the largest diameter of the conical surface of the flange, and the conical surface of the shrink tube is squeezed to produce contraction and deformation, resulting in a contact gap of about 3 mm long at the largest diameter, as shown in the local enlarged figure in Figure 23b. With the progress of shrinkage, the contact gap extends to a smaller diameter, and the contact gap increases to 9 mm at 2 ms. At 3 ms, the contact gap increases to 12 mm, and at 4 ms, the contact gap increases to 15 mm. As shown in Figure 23e, the contact gap reaches its maximum value at this time and then gradually shrinks and finally stabilizes between 12 and 13 mm, as shown in Figure 23i. This gap size is maintained in the subsequent shrinking process. It shows that in the whole shrinkage process, the contact length of the conical surface is only about half of the original length of the conical surface most of the time, which is mainly caused by the overall contraction during the extrusion deformation of the shrink pipe. The contraction deformation caused by the compression at the small pipe diameter will lead to the following deformation at the large pipe diameter, resulting in the contact gap.

5.2. Contact Length Change Rule

As shown in Figure 24, the stable contact length of the friction cone of the shrinkable tube under different structural parameters decreases with the increase in wall thickness because the overall stiffness of the shrinkable tube increases with the increase in wall thickness. When the cone angle α = 5°, the stable contact length changes the most, from 19 mm to 11.5 mm, and when the cone angle α = 25°, the stable contact length changes the least, from 21 mm to 18.5 mm. In the case of the same thickness, except for the slight deviation when the cone angle α = 5°, the larger the cone angle, the larger the stable contact length, and the larger the change amplitude of the stable contact length with the cone angle. When the wall thickness T = 3 mm, the stable contact length changes the least, increasing from 19 mm to 21 mm with an increase of 10.5%. When T = 6 mm, the stable contact length increases from 15.5 mm to 20 mm, an increase of 29%. When T = 9 mm, the stable contact length increases from 13.5 mm to 19 mm, an increase of 40.7%. When T = 12 mm, the stable contact length changes the most, from 11.5 mm to 18.5 mm, an increase of 60.9%.

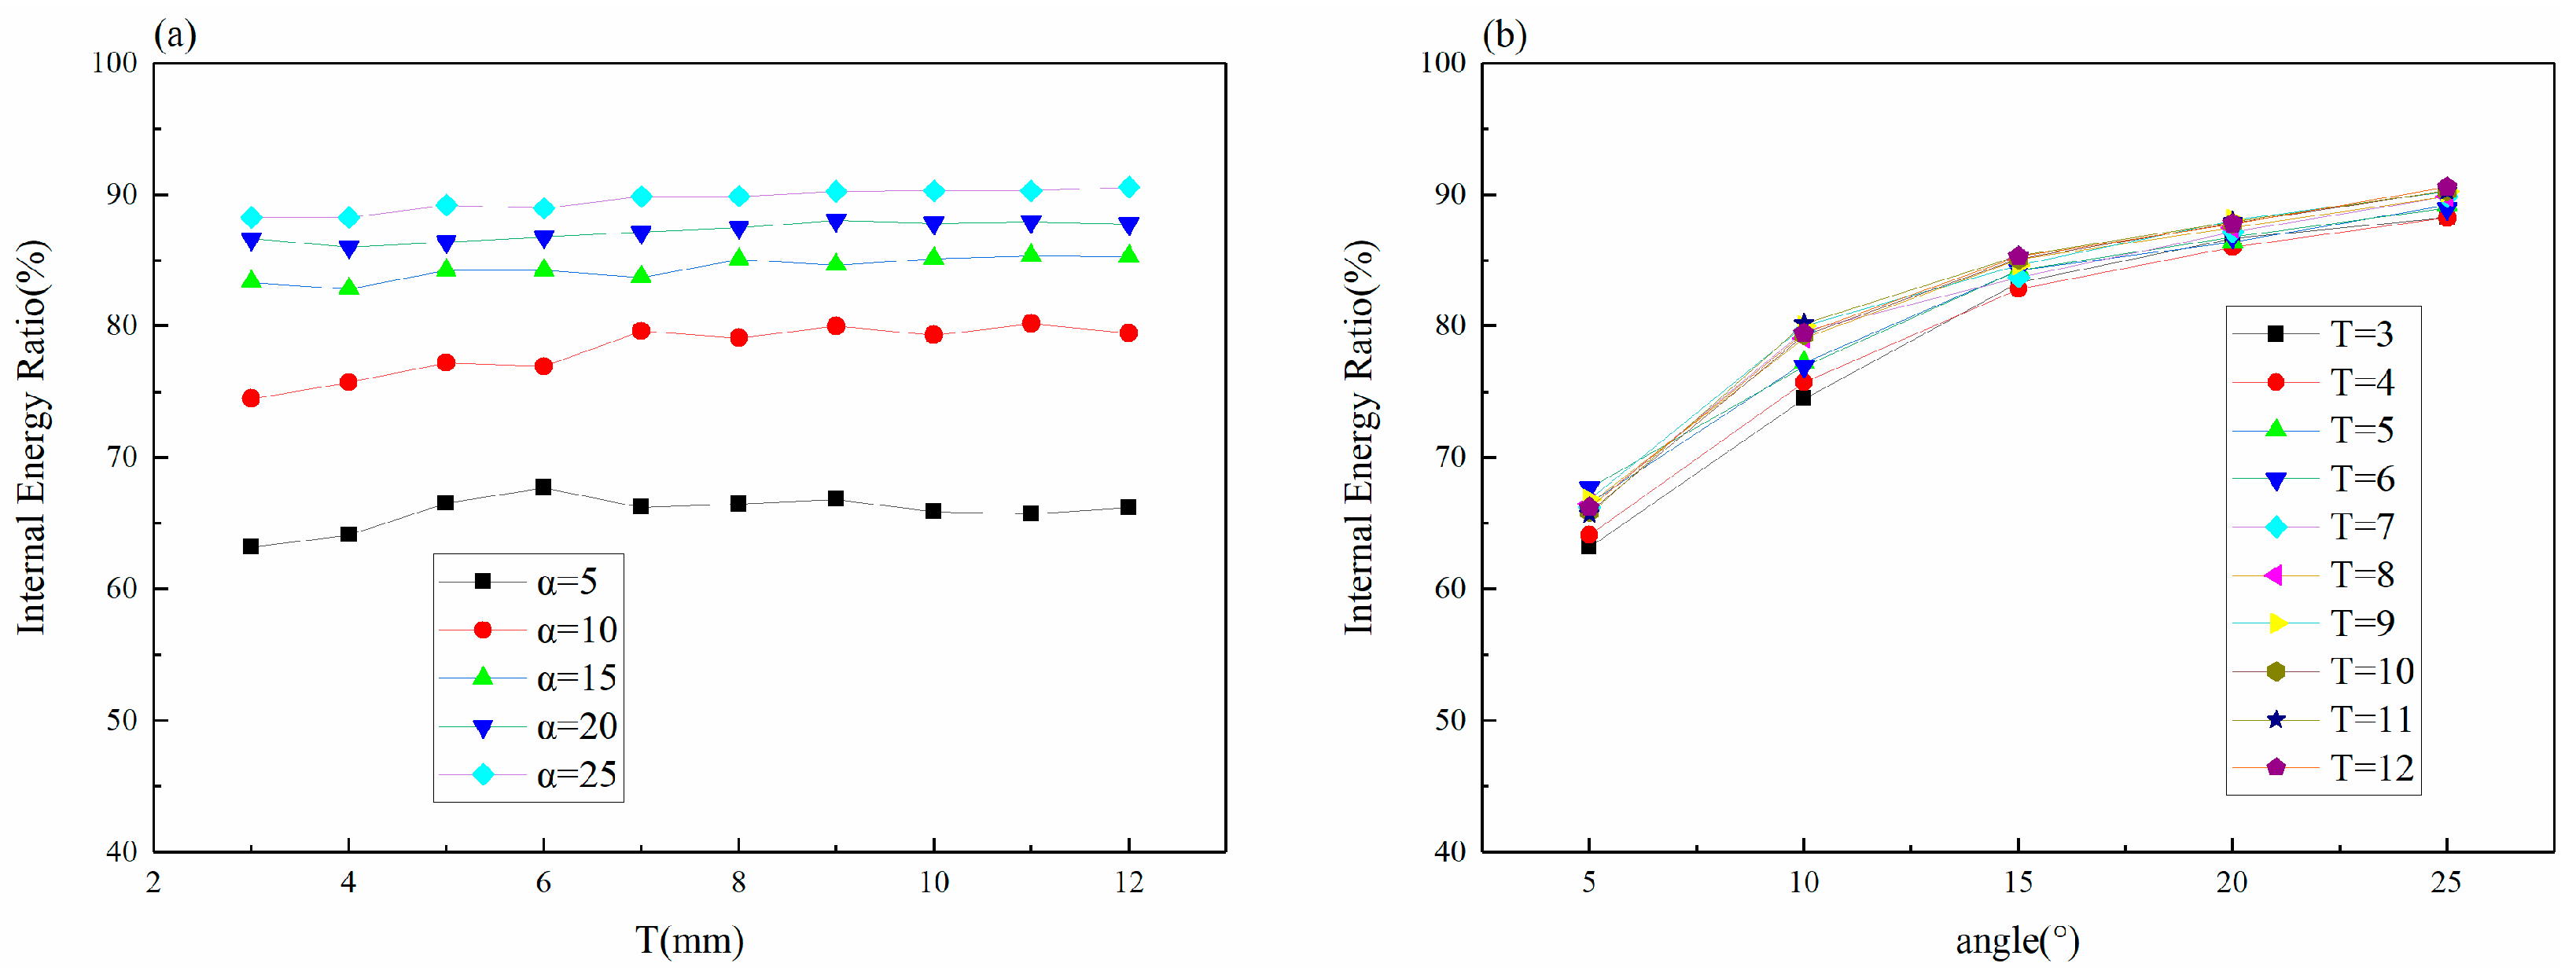
5.3. Analysis of Energy Composition

As shown in Figure 25, the proportion of internal energy in the total absorbed energy of the tube with different cone angles varies with the change in wall thickness. When the cone angle is 5°, the internal energy proportion increases rapidly as the thickness increases from 3 mm to 6 mm. When the cone angle is 10°, the internal energy proportion has a rapid rise during the increase in thickness from 3 mm to 7 mm. When the cone angle reaches more than 15°, the change of thickness has little effect on the internal energy ratio.
Under the same thickness, the internal energy ratio will increase with the increase in cone angle. When T = 3 mm and the cone angle increased from 5° to 15°, the internal energy ratio increased from 63.2% to 83.3%. When T = 3 mm, the cone angle increases from 15° to 25°, and the internal energy proportion increases slowly, from 83.3% to 88.3%. When T = 12 mm and the cone angle increased from 5° to 15°, the internal energy ratio increased from 66.2% to 85.3%. When T = 12 mm, the cone angle increases from 15° to 25°, and the internal energy proportion increases slowly, from 85.3% to 90.6%.

6. Conclusions

In this study, a shrink tube anti-creep device is designed. The finite element model is established and verified using the trolley test. The effect of structural parameters on crashworthiness was studied by numerical simulation, and the variation rule was obtained to provide a reference for the development of genealogical products. The variation of the contact length of the conical contact surface and the composition of absorbed energy during the shrinking process were analyzed. The main findings are listed as follows:
(1)
The MCF of the trolley test and the MCF of the numerical simulation are 642.08 kN and 644.94 kN, respectively, and they are almost consistent. The EA values of the trolley test and finite element simulation are 194.96 kJ and 198.55 kJ, respectively, and the relative error is 1.84%, which verifies the reliability of the finite element model.
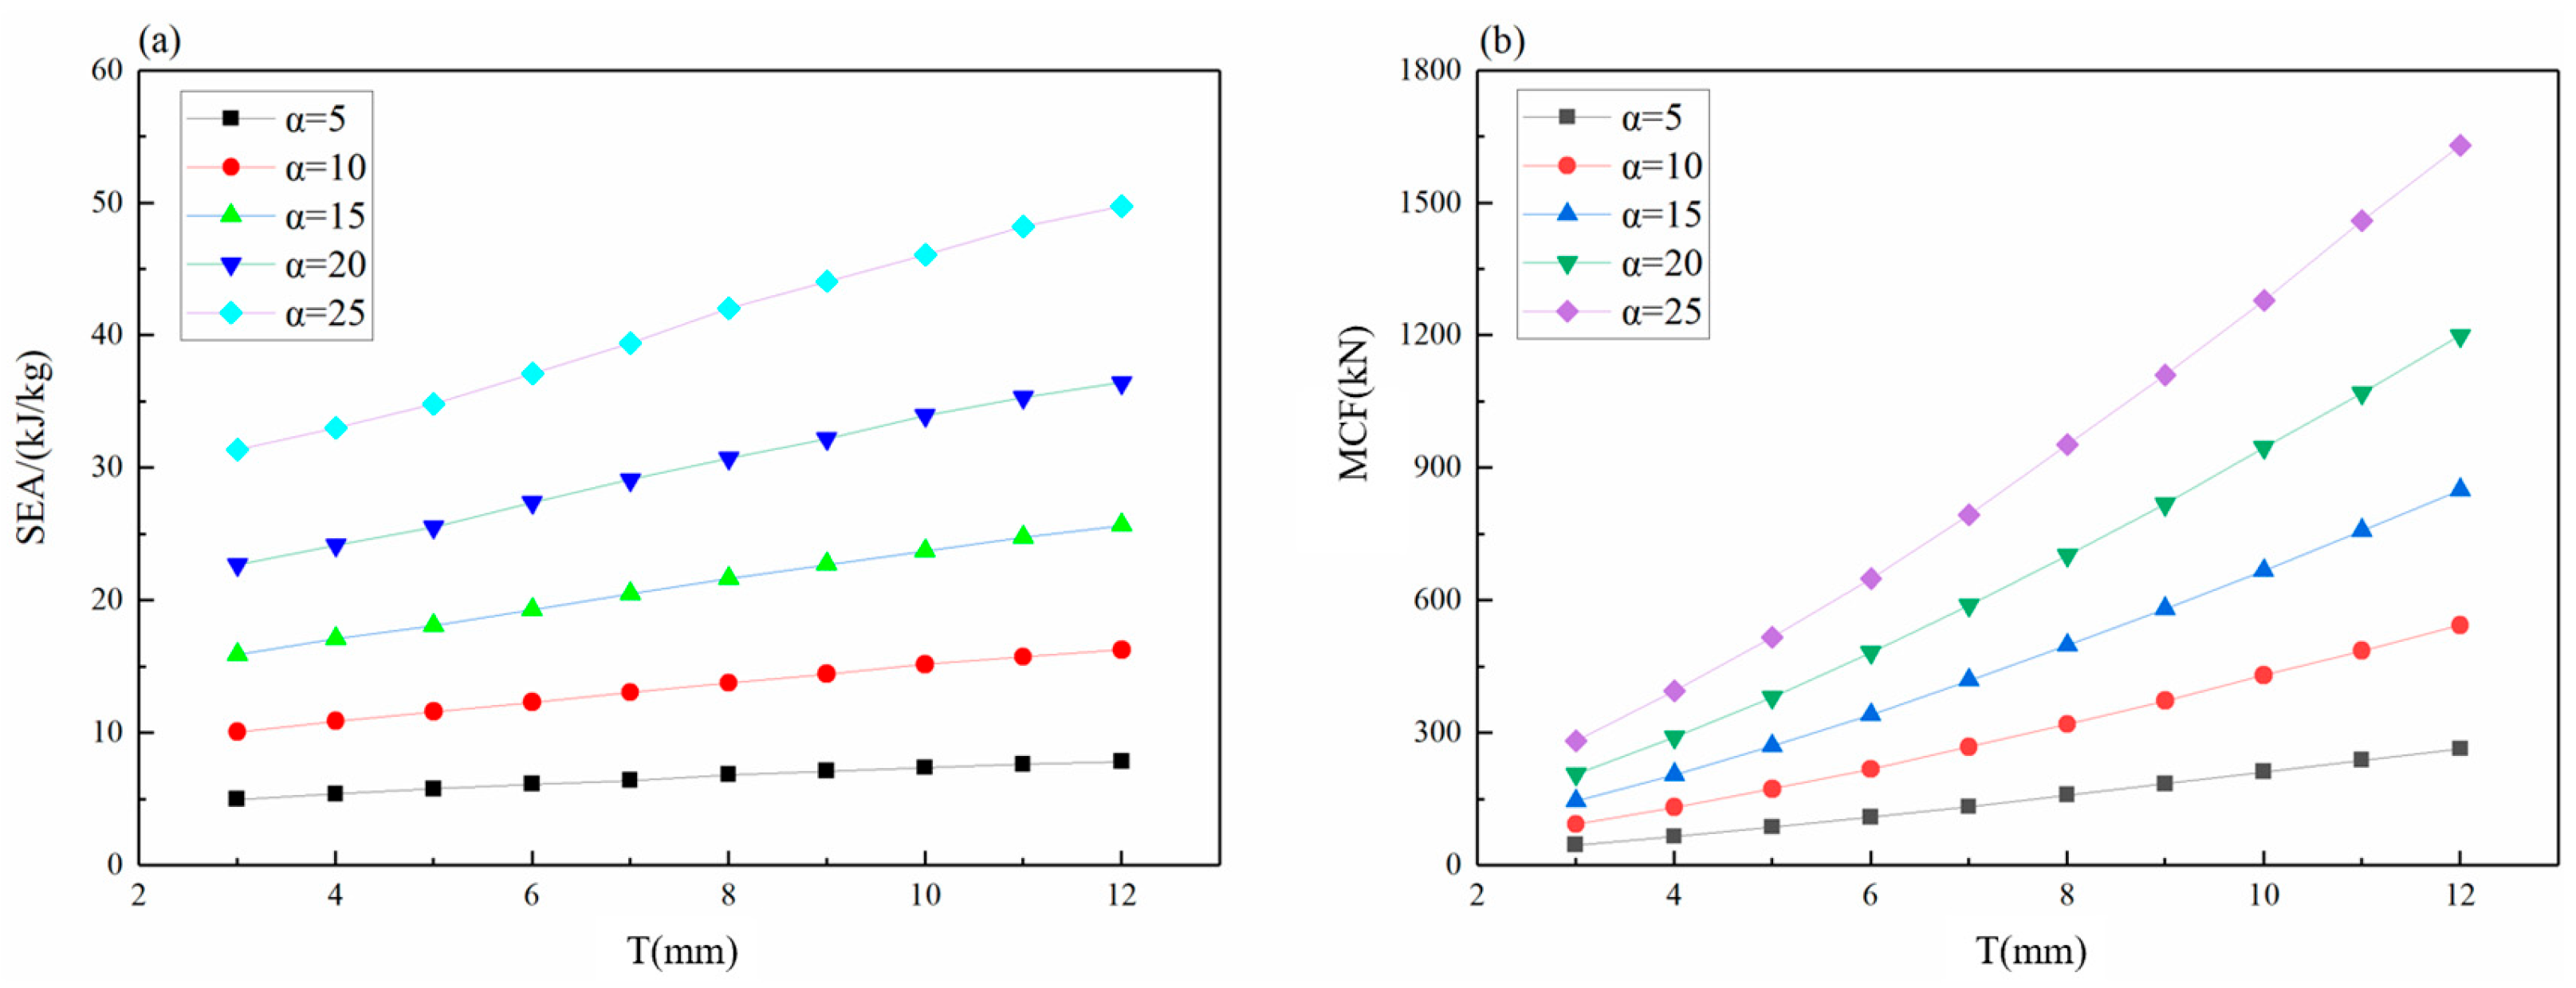
(2)
For every 1 mm increase in the wall thickness, the MCF increases by about 45.1 kN, and the SEA increases by about 0.618 kJ/kg. When the friction coefficient increases by 0.01, the MCF increases by 30.5 kN, and the SEA increases by 0.765 kJ/kg. When the axial length of the friction cone increases by 1 mm, the MCF decreases by 13.5 kN, and the SEA decreases nonlinearly. The MCF is greatly affected by the wall thickness and friction coefficient, and it is a linear increase relationship. In contrast, the axial length of the friction cone has the smallest effect and has no linear relationship.
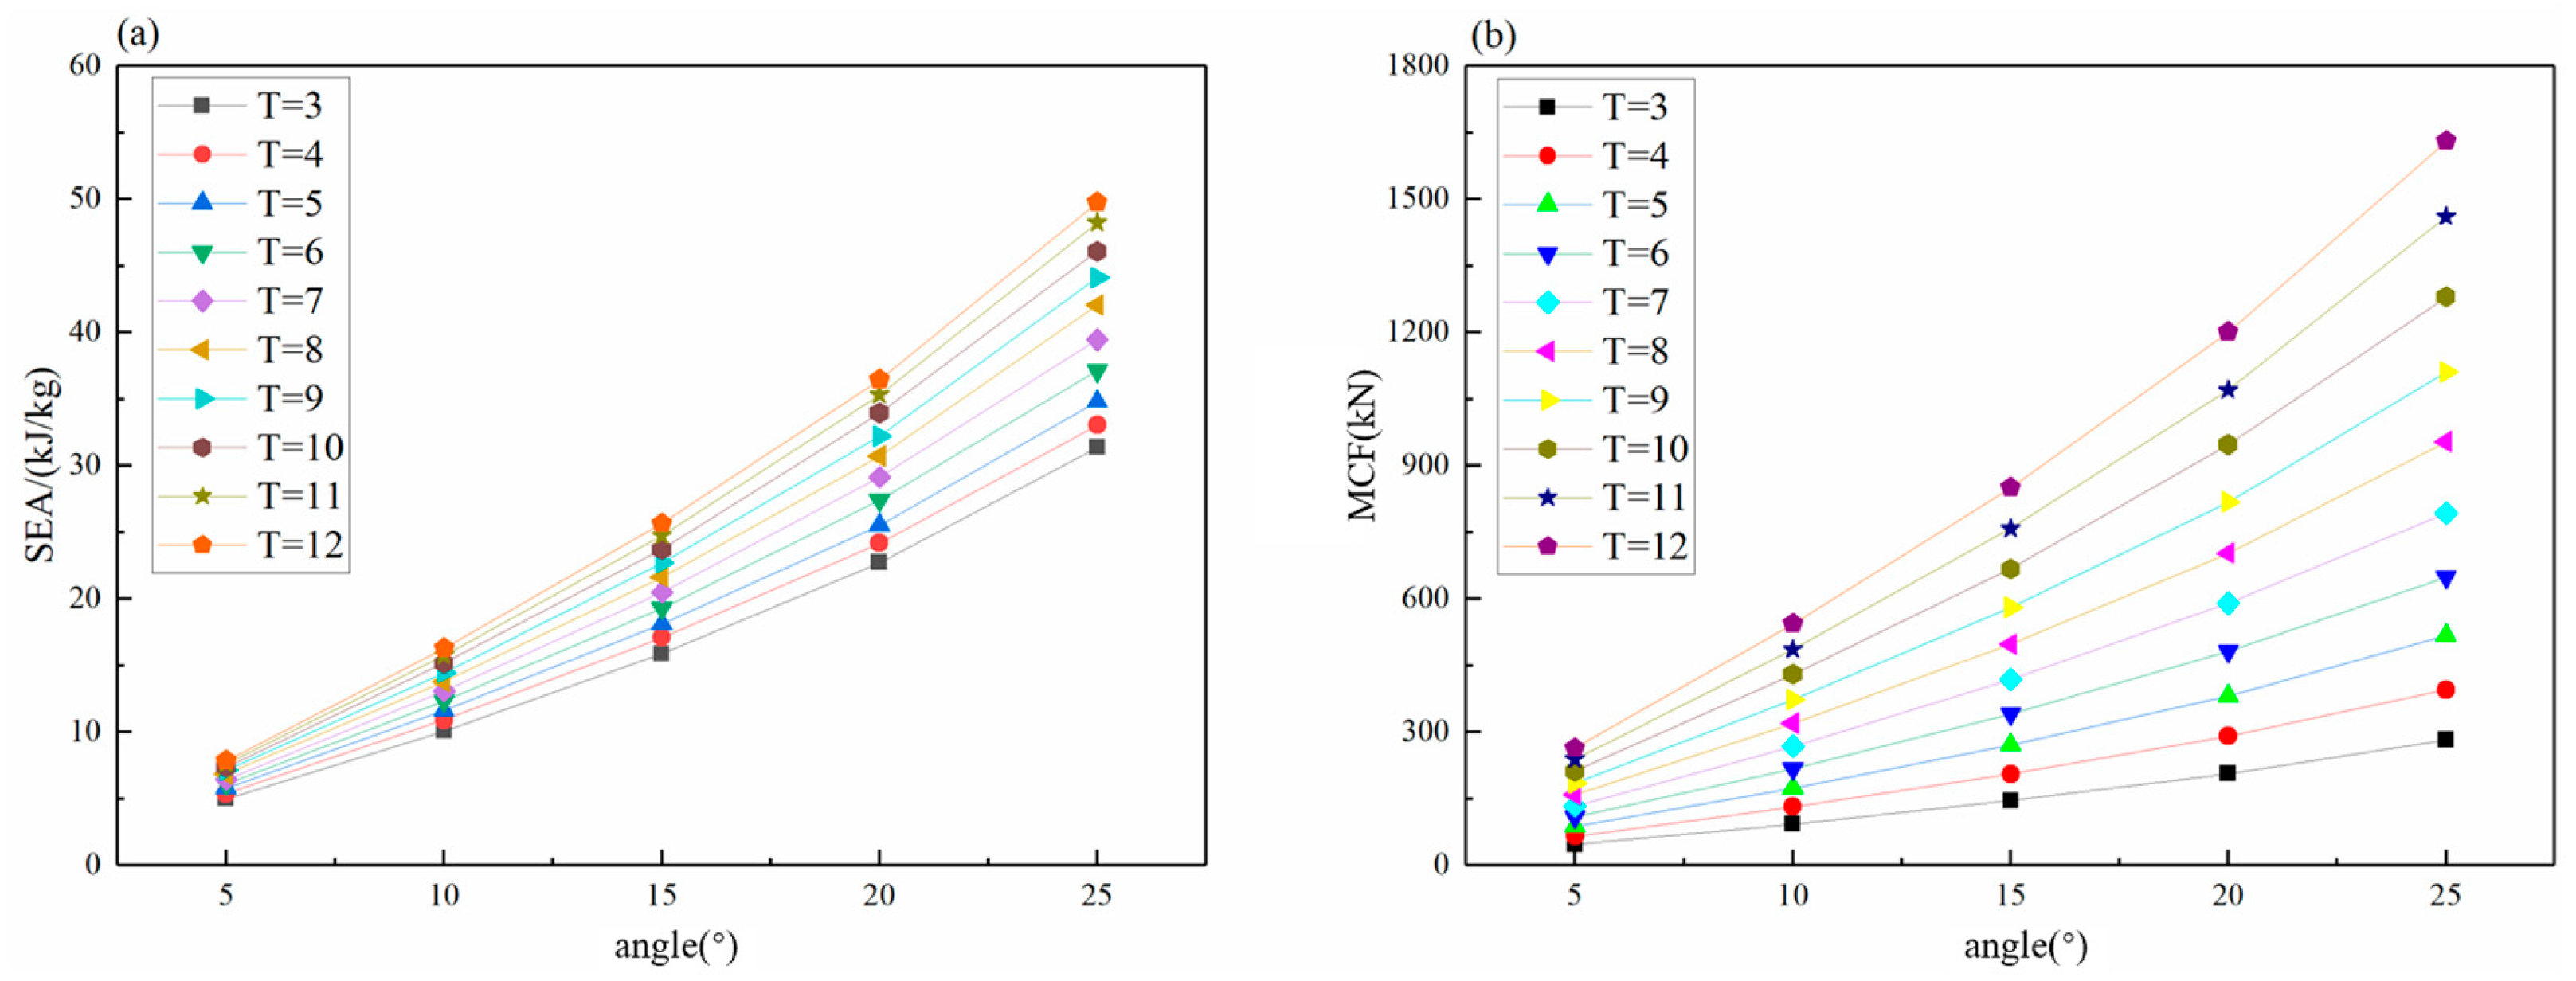
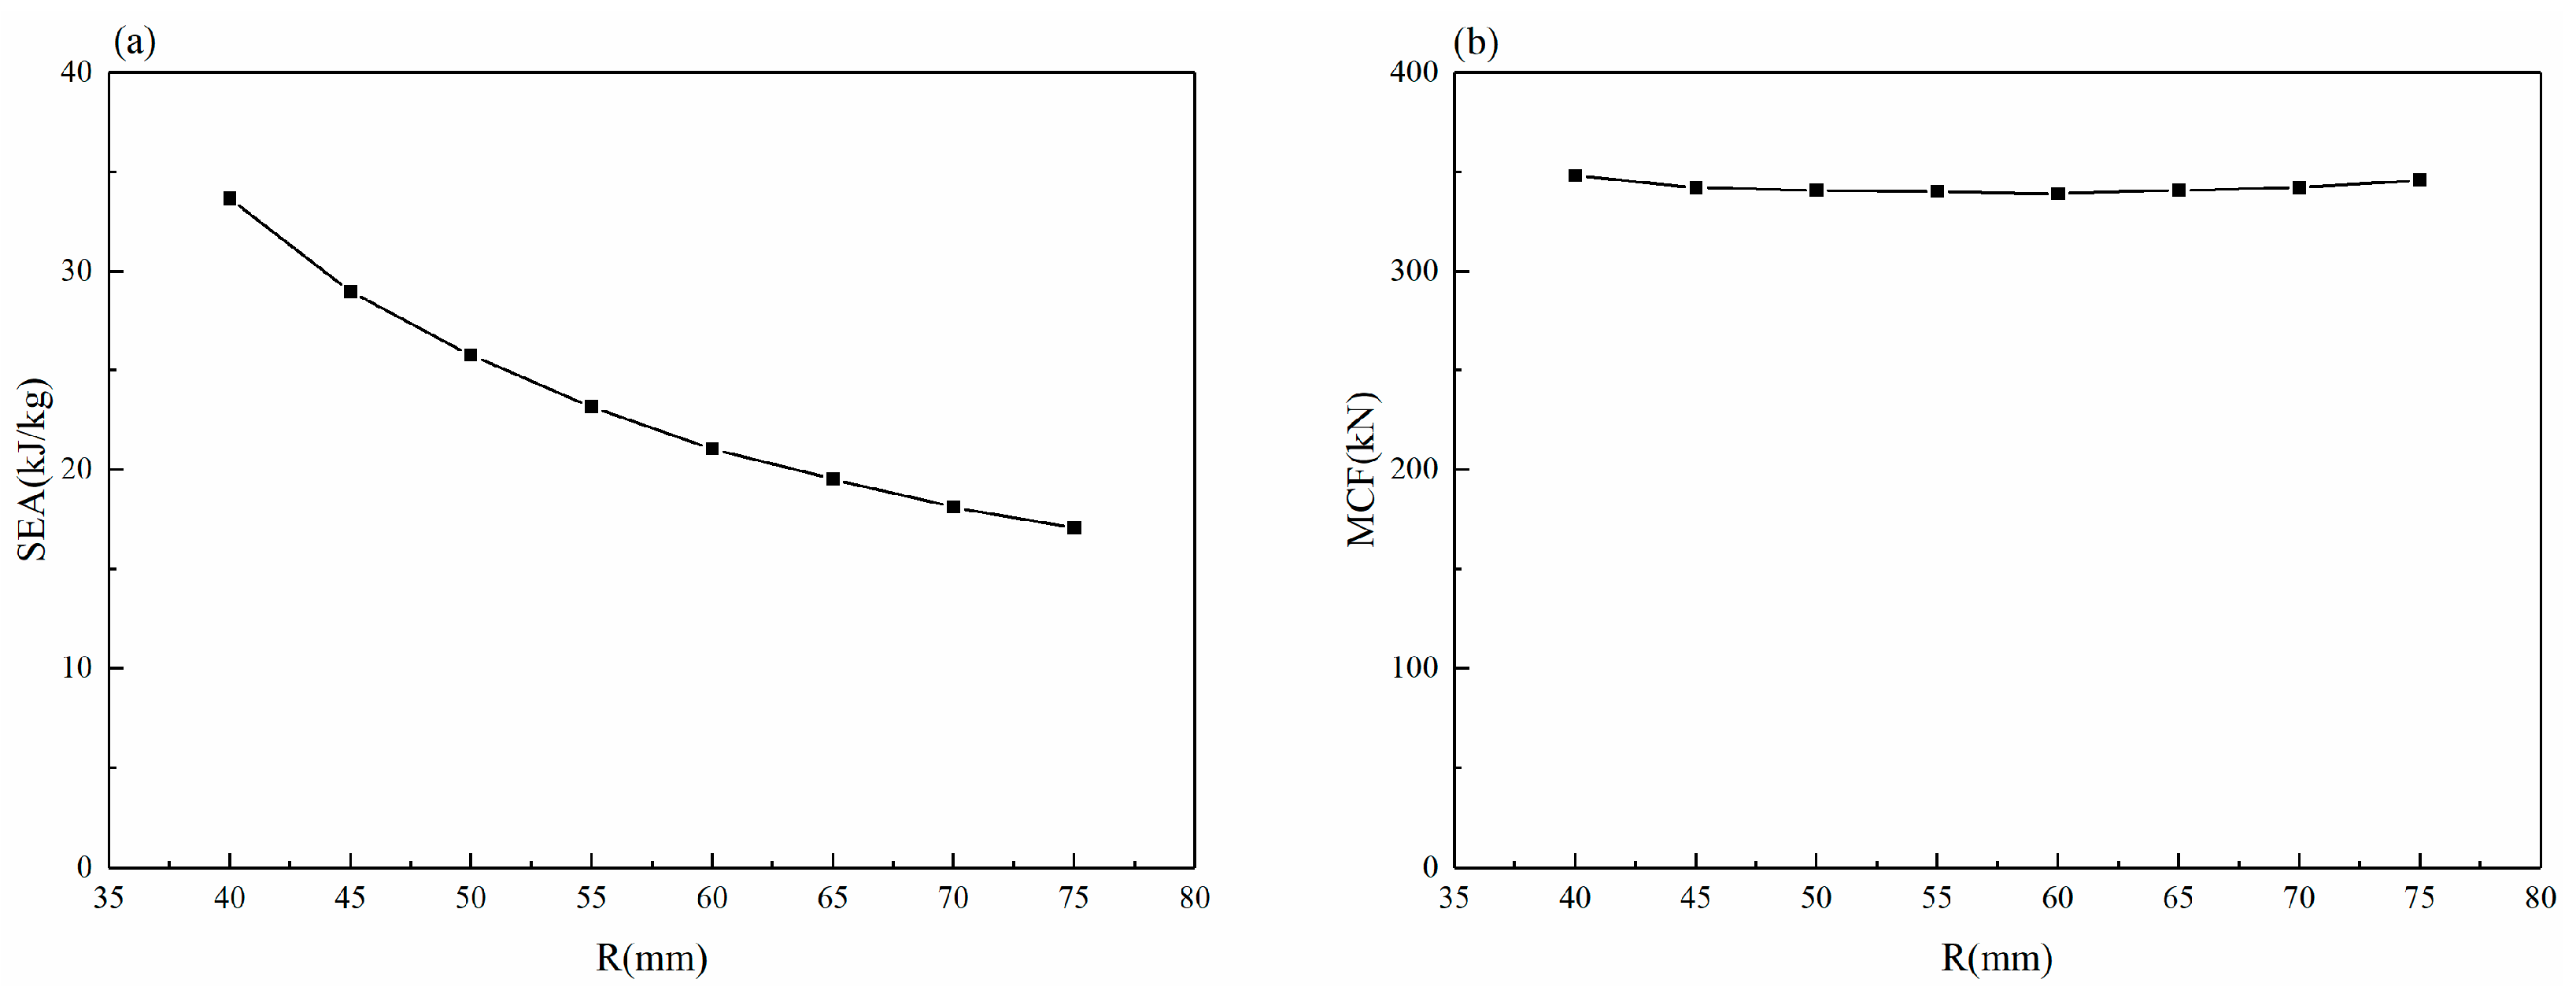
(3)
When the cone angle increases from α = 5° to α = 25°, the increase in the MCF with different thicknesses is about 600%, the increase in the SEA is more than 600%, and the MCF and SEA with the same thickness increase faster with the increase in the angle range. In the process of increasing the radius from 40 mm to 75 mm, the MCF is almost unchanged; the decrease in SEA is first faster and then slower. When the radius is increased from 40 mm to 60 mm, the decline is faster, the SEA is reduced from 33.66 kJ/kg to 21.07 kJ/kg, and the decline is slower when the radius is increased from 60 mm to 75 mm. The SEA only decreased from 21.07 kJ/kg to 17.08 kJ/kg.
(4)
The change of the contact length of the conical contact surface during shrinkage is analyzed, and it is found that the actual contact length of the conical surface decreases in most of the shrinkage process. The change of contact length of the friction cone under different structural parameters is compared. The contact length decreases with the increase in wall thickness, and the contact length increases with the increase in angle.
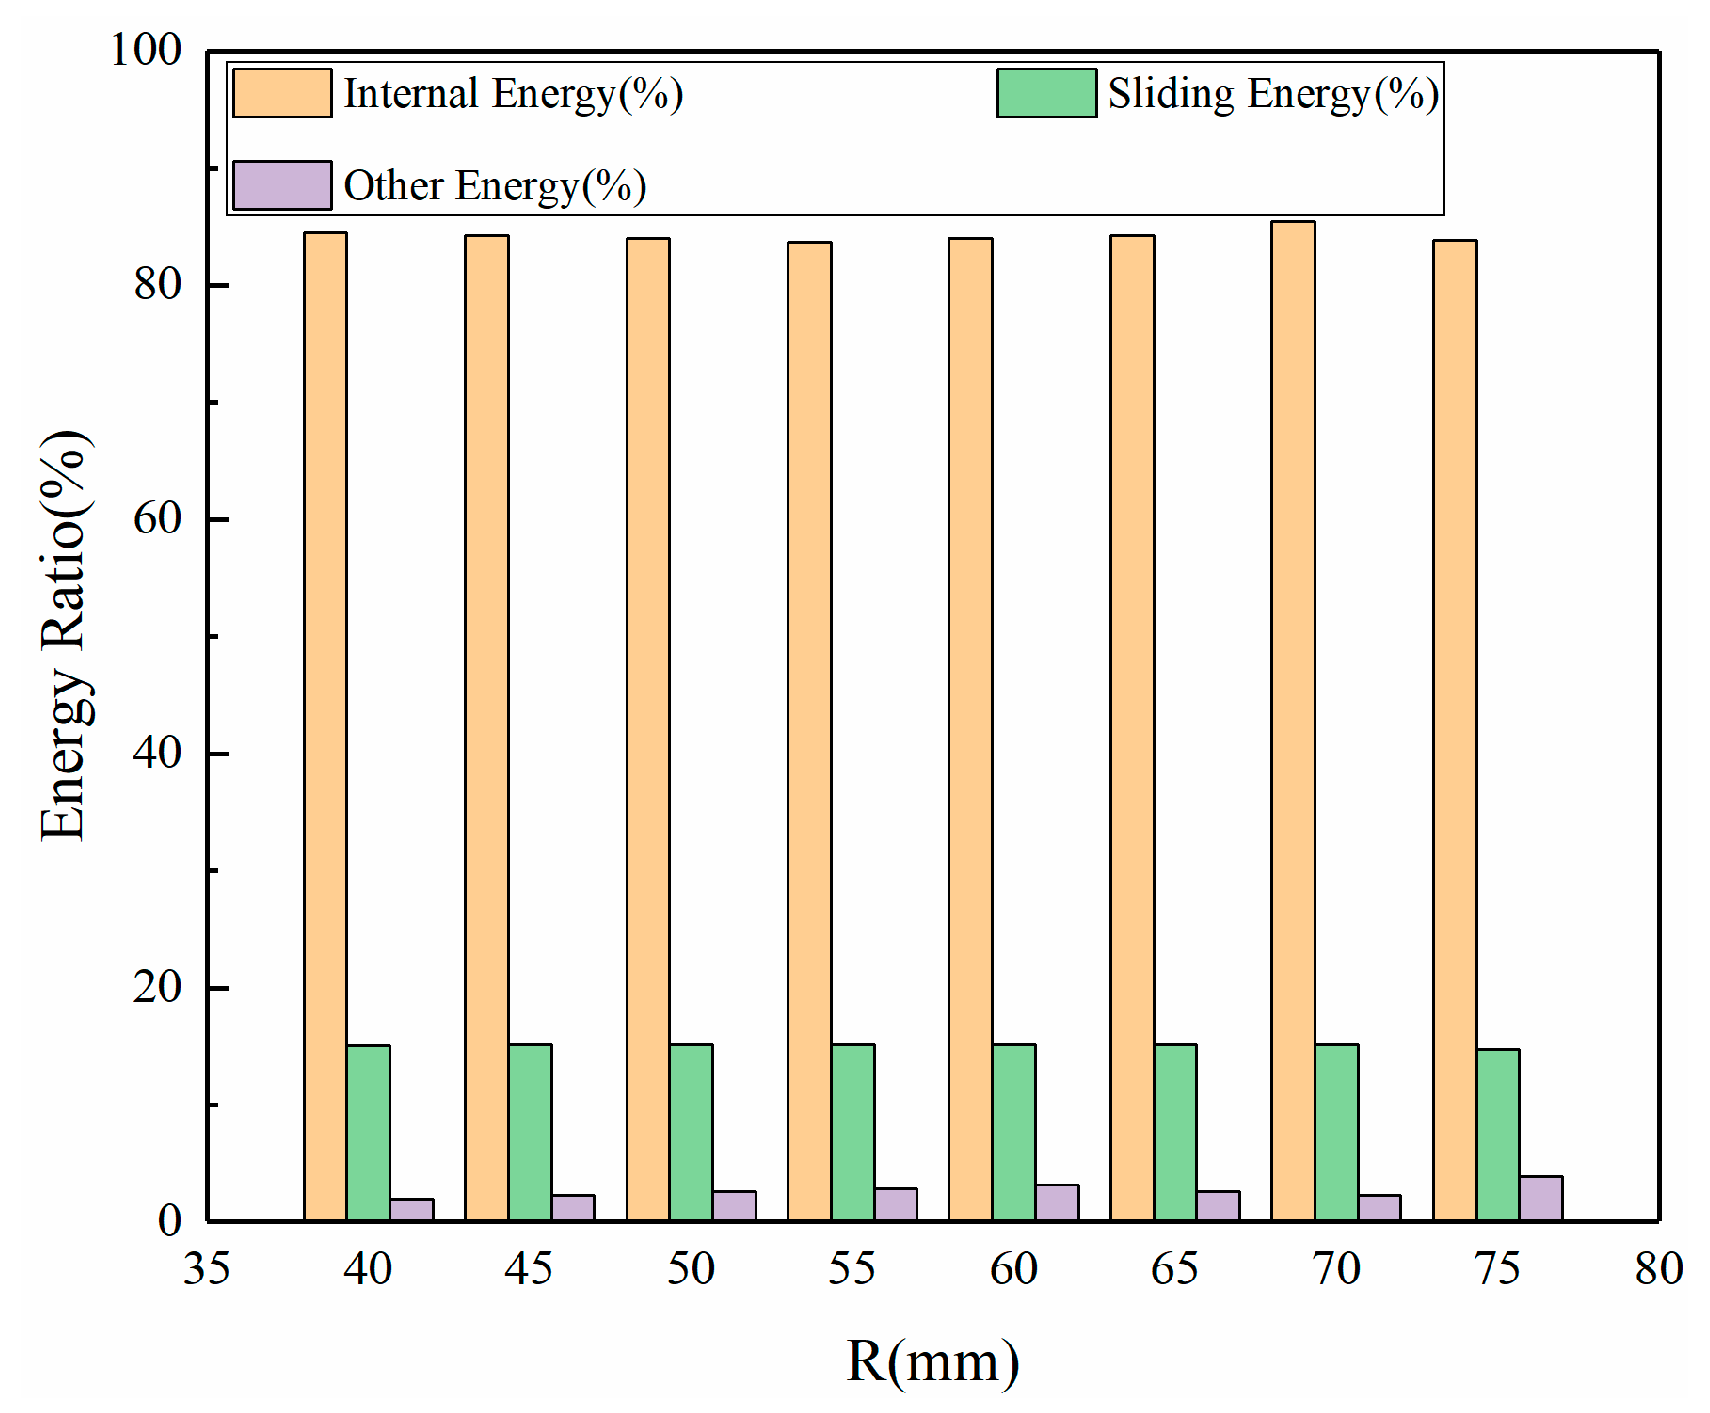
(5)
The internal energy accounts for most of the absorption energy of the tube, and the internal energy proportion has little effect with the change of thickness but rises rapidly with the increase in the cone angle, which can be divided into two stages. When the cone angle increases from 5° to 15°, the proportion of internal energy increases greatly, from more than 60% to more than 80%. When the cone angle increases from 15° to 25°, the proportion of internal energy increases slowly, and the maximum increase is less than 6%.

Author Contributions

Conceptualization, F.Z.; Data curation, L.Y.; Formal analysis, M.X.; Funding acquisition, S.Y.; Investigation, X.Z.; Methodology, F.Z.; Project administration, S.Y.; Resources, M.X.; Software, L.Y.; Supervision, S.Y.; Validation, X.Z.; Writing—original draft, F.Z.; Writing—review and editing, F.Z. All authors have read and agreed to the published version of the manuscript.

Funding

This research was funded by the National Key Research and Development Program of China, grant number 2021YFB3703801, and the APC was funded by the Natural Science Foundation of Hunan Province, 2021JJ30853.

Data Availability Statement

The original contributions presented in the study are included in the article; further inquiries can be directed to the corresponding author.

Acknowledgments

The authors would like to express their thanks for financially supported by the National Key Research and Development Program of China and the Natural Science Foundation of Hunan Province.

Conflicts of Interest

The authors declare no conflict of interest.

References

  1. Chen, Z.; Zhai, W.; Cai, C.; Sun, Y. Safety threshold of high-speed railway pier settlement based on train-track-bridge dynamic interaction. Sci. China-Technol. Sci. 2015, 58, 202–210. [Google Scholar] [CrossRef]
  2. Fang, J.; Gao, Y.; Sun, G.; Zhang, Y.; Li, Q. Crashworthiness design of foam-filled bitubal structures with uncertainty. Int. J. Non-Linear Mech. 2014, 67, 120–132. [Google Scholar] [CrossRef]
  3. Xiao, Z.; Fang, J.; Sun, G.; Li, Q. Crashworthiness design for functionally graded foam-filled bumper beam. Adv. Eng. Softw. 2015, 85, 81–95. [Google Scholar] [CrossRef]
  4. He, Q.; Ma, D.; Zhang, Z.; Yao, L. Mean compressive stress constitutive equation and crashworthiness optimization design of three novel honeycombs under axial compression. Int. J. Mech. Sci. 2015, 99, 274–287. [Google Scholar] [CrossRef]
  5. Ko, Y.; Ahn, K.; Huh, H.; Choi, W.; Jung, H.; Kwon, T. Evaluation of Crash Energy Absorption Capacity of a Tearing Tube. Exp. Appl. Mech. 2011, 6, 647–654. [Google Scholar]
  6. Lu, G.; Yu, T.X. Energy Absorption of Structures and Materials; Woodhead Publishing: Sawston, UK, 2003. [Google Scholar]
  7. Yan, J.; Yao, S.; Xu, P.; Peng, Y.; Shao, H.; Zhao, S. Theoretical prediction and numerical studies of expanding circular tubes as energy absorbers. Int. J. Mech. Sci. 2016, 105, 206–214. [Google Scholar] [CrossRef]
  8. Yao, S.; Yan, K.; Lu, S.; Xu, P. Prediction and application of energy absorption characteristics of thin-walled circular tubes based on dimensional analysis. Thin-Walled Struct. 2018, 130, 505–519. [Google Scholar] [CrossRef]
  9. Yao, S.; Li, Z.; Ma, W.; Xu, P. Crashworthiness analysis of a straight-tapered shrink tube. Int. J. Mech. Sci. 2019, 157–158, 512–527. [Google Scholar] [CrossRef]
  10. Liu, Y.; Qiu, X. A theoretical study of the expansion metal tubes. Int. J. Mech. Sci. 2016, 114, 157–165. [Google Scholar] [CrossRef]
  11. Liu, Y.; Qiu, X.; Wang, W.; Yu, T.X. An improved two-arcs deformational theoretical model of the expansion tubes. Int. J. Mech. Sci. 2017, 133, 240–250. [Google Scholar] [CrossRef]
  12. Yang, J.; Luo, M.; Hua, Y.; Lu, G. Energy absorption of expansion tubes using a conical–cylindrical die: Experiments and numerical simulation. Int. J. Mech. Sci. 2010, 52, 716–725. [Google Scholar] [CrossRef]
  13. Daxner, T.; Rammerstorfer, F.G.; Fischer, F.D. Instability phenomena during the conical expansion of circular cylindrical shells. Comput. Methods Appl. Mech. Eng. 2005, 194, 2591–2603. [Google Scholar] [CrossRef]
  14. Fischer, F.D.; Rammerstorfer, F.G.; Daxner, T. Flaring—An analytical approach. Int. J. Mech. Sci. 2006, 48, 1246–1255. [Google Scholar] [CrossRef]
  15. Shakeri, M.; Salehghaffari, S.; Mirzaeifar, R. Expansion of circular tubes by rigid tubes as impact energy absorbers: Experimental and theoretical investigation. Int. J. Crashworthiness 2007, 12, 493–501. [Google Scholar] [CrossRef]
  16. Seibi, A.C.; Al-Hiddabi, S.; Pervez, T. Structural Behavior of a Solid Tubular under Large Radial Plastic Expansion. J. Energy Resour. Technol. 2005, 127, 323–327. [Google Scholar] [CrossRef]
  17. Seibi, A.C.; Barsoum, I.; Molki, A. Experimental and Numerical Study of Expanded Aluminum and Steel Tubes. Procedia Eng. 2011, 10, 3049–3055. [Google Scholar] [CrossRef]
  18. Karrech, A.; Seibi, A. Analytical model for the expansion of tubes under tension. J. Mater. Process. Technol. 2010, 210, 356–362. [Google Scholar] [CrossRef]
  19. Liu, Y.; Qiu, X.; Yu, T.X. A theoretical model of the inversion tube over a conical die. Thin-Walled Struct. 2018, 127, 31–39. [Google Scholar] [CrossRef]
  20. Niknejad, A.; Moeinifard, M. Theoretical and experimental studies of the external inversion process in the circular metal tubes. Mater. Des. 2012, 40, 324–330. [Google Scholar] [CrossRef]
  21. Rosa, P.; Baptista, R.; Rodrigues, J.; Martins, P. An investigation on the external inversion of thin-walled tubes using a die. Int. J. Plast. 2004, 20, 1931–1946. [Google Scholar] [CrossRef]
  22. Rosa, P.A.R.; Rodrigues, J.M.C.; Martins, P.A.F. External inversion of thin-walled tubes using a die: Experimental and theoretical investigation. Int. J. Mach. Tools Manuf. 2003, 43, 787–796. [Google Scholar] [CrossRef]
  23. Yu, X.; Qiu, X.; Yu, T.X. Analysis of the free external inversion of circular tubes based on deformation theory. Int. J. Mech. Sci. 2015, 100, 262–268. [Google Scholar] [CrossRef]
  24. Yu, X.; Qiu, X.; Yu, T.X. Theoretical model of a metal tube under inversion over circular dies. Int. J. Mech. Sci. 2016, 108–109, 23–28. [Google Scholar] [CrossRef]
  25. Huang, X.; Lu, G.; Yu, T.X. On the axial splitting and curling of circular metal tubes. Int. J. Mech. Sci. 2002, 44, 2369–2391. [Google Scholar] [CrossRef]
  26. Moreno, C.; Beaumont, R.; Hughes, D.J.; Williams, T.; Dashwood, R. Quasi-static and dynamic testing of splitting, expansion and expansion-splitting hybrid tubes under oblique loading. Int. J. Impact Eng. 2017, 100, 117–130. [Google Scholar] [CrossRef]
  27. Moreno, C.; Williams, T.; Beaumont, R.; Hughes, D.J.; Dashwood, R. Testing, simulation and evaluation of a novel hybrid energy absorber. Int. J. Impact Eng. 2016, 93, 11–27. [Google Scholar] [CrossRef]
  28. Niknejad, A.; Rezaei, B.; Liaghat, G.H. Empty circular metal tubes in the splitting process—Theoretical and experimental studies. Thin-Walled Struct. 2013, 72, 48–60. [Google Scholar] [CrossRef]
  29. Rouzegar, J.; Karimi, M. Numerical and experimental study of axial splitting of circular tubular structures. Thin-Walled Struct. 2016, 105, 57–70. [Google Scholar] [CrossRef]
  30. Li, J.; Gao, G.; Guan, W.; Wang, S.; Yu, Y. Experimental and numerical investigations on the energy absorption of shrink circular tube under quasi-static loading. Int. J. Mech. Sci. 2018, 137, 284–294. [Google Scholar] [CrossRef]
  31. Almeida, B.P.P.; Alves, M.L.; Rosa, P.A.R.; Brito, A.G.; Martins, P.A.F. Expansion and reduction of thin-walled tubes using a die: Experimental and theoretical investigation. Int. J. Mach. Tools Manuf. 2006, 46, 1643–1652. [Google Scholar] [CrossRef]
  32. Alves, M.L.; Almeida, B.P.P.; Rosa, P.A.R.; Martins, P.A.F. End forming of thin-walled tubes. J. Mater. Process. Technol. 2006, 177, 183–187. [Google Scholar] [CrossRef]
  33. Tanaskovic, J.; Milkovic, D.; Lucanin, V.; Vasic Franklin, G. Experimental investigations of the shrinking–splitting tube collision energy absorber. Thin-Walled Struct. 2015, 86, 142–147. [Google Scholar] [CrossRef]
  34. Liu, Y.; Qiu, X. A theoretical model of the shrinking metal tubes. Int. J. Mech. Sci. 2018, 144, 564–575. [Google Scholar] [CrossRef]
  35. Guan, W.; Gao, G.; Yu, Y. Crushing analysis and multiobjective crashworthiness optimization of combined shrinking circular tubes under impact loading. Struct. Multidiscip. Optim. 2021, 64, 1649–1667. [Google Scholar] [CrossRef]
  36. Moreno, C.; Winnett, J.; Williams, T. On the effect of anisotropy on the performance and simulation of shrinking tubes used as energy absorbers for railway vehicles. Thin-Walled Struct. 2021, 161, 107513. [Google Scholar] [CrossRef]
  37. Fang, J.; Sun, G.; Qiu, N.; Kim, N.H.; Li, Q. On design optimization for structural crashworthiness and its state of the art. Struct. Multidiscip. Optim. 2017, 55, 1091–1119. [Google Scholar] [CrossRef]
  38. Gao, G.; Guan, W.; Li, J.; Dong, H.; Zou, X.; Chen, W. Experimental investigation of an active-passive integration energy absorber for railway vehicles. Thin-Walled Struct. 2017, 117, 89–97. [Google Scholar] [CrossRef]
  39. Xie, S.; Zhou, H. Analysis and optimisation of parameters influencing the out-of-plane energy absorption of an aluminium honeycomb. Thin-Walled Struct. 2015, 89, 169–177. [Google Scholar] [CrossRef]
  40. Aye, C.M.; Pholdee, N.; Yildiz, A.R.; Bureerat, S.; Sait, S.M. Multi-surrogate-assisted metaheuristics for crashworthiness optimisation. Int. J. Veh. Des. 2019, 80, 223–240. [Google Scholar] [CrossRef]
  41. EN 15227:2020; Railway Applications—Crashworthiness Requirements for Railway Vehicle. iTeh, Inc.: Newark, DE, USA, 2011.
  42. Guan, W.; Gao, G. Crashworthiness analysis of shrink circular tube energy absorbers with anti-climbers under multiple loading cases. Mech. Adv. Mater. Struct. 2022, 30, 1453–1469. [Google Scholar] [CrossRef]
Figure 1. Geometry description of main structure: (a) general location, (b) main structure, (c) collision attitude display, (d) half-section view, and (e) dimensional detail view.
Machines 12 00720 g001
Figure 2. Material properties: (a) test equipment, (b) the sample before test, (c) the sample after test, and (d) material specimen size.
Machines 12 00720 g002
Figure 3. Stress–strain curve of 45 steel: (a) engineering curve; (b) true curve.
Machines 12 00720 g003
Figure 4. Pre-collision test scenario.
Machines 12 00720 g004
Figure 5. Collision model of trolley test.
Machines 12 00720 g005
Figure 6. Comparison of deformation process under different energy absorption strokes. (a) Test condition; (b) simulation condition.
Machines 12 00720 g006
Figure 7. Comparison of test and simulation conditions: (a) force and time curve, (b) displacement and time curve, (c) force and displacement curve, and (d) energy absorption and displacement curve.
Machines 12 00720 g007
Figure 8. Vertical 40 mm height difference collision test: (a) test scene; (b) deformation sequence diagram and experimental and simulated force and displacement curves.
Machines 12 00720 g008
Figure 9. Test system composition.
Machines 12 00720 g009
Figure 10. Loading and unloading curves under different peak loads.
Machines 12 00720 g010
Figure 11. Influence of wall thickness: (a) force and displacement curves at different thicknesses; (b) MCF changes at different thicknesses.
Machines 12 00720 g011
Figure 12. Influence of wall thickness: (a) energy absorption and displacement curves at different thicknesses; (b) SEA changes at different thicknesses.
Machines 12 00720 g012
Figure 13. Influence of friction coefficient: (a) force and displacement curves under different friction coefficients; (b) variation trend of MCF under different friction coefficients.
Machines 12 00720 g013
Figure 14. Influence of friction coefficient: (a) energy absorption and displacement curves under different friction coefficients; (b) variation trend of SEA under different friction coefficients.
Machines 12 00720 g014
Figure 15. Influence of axial length of friction cone: (a) force and displacement curves under different friction lengths; (b) MCF changes under different friction lengths.
Machines 12 00720 g015
Figure 16. Influence of axial length of friction cone: (a) energy absorption and displacement curves under different friction lengths; (b) SEA changes under different friction lengths.
Machines 12 00720 g016
Figure 17. Comparison of force and displacement curves of tubes with different cone angles: (a) cone angle of 25°; (b) cone angle of 30°.
Machines 12 00720 g017
Figure 18. Comparison of deformation modes of tubes with different cone angles; the circles in the figure show different deformation modes. (a) Cone angle of 25°; (b) cone angle of 30°.
Machines 12 00720 g018
Figure 19. The crashworthiness of the tube with different thicknesses varies with the cone angle: (a) the SEA; (b) the MCF.
Machines 12 00720 g019
Figure 20. The crashworthiness of tubes with different cone angles varies with thickness: (a) the SEA; (b) the MCF.
Machines 12 00720 g020
Figure 21. Crashworthiness of the shrink tube varies with the radius: (a) the SEA; (b) the MCF.
Machines 12 00720 g021
Figure 22. Energy composition variation with the radius of the shrinkable tube.
Machines 12 00720 g022
Figure 23. The change process of the contact length of the conical surface in the initial stage of collision: (a) 0 ms; (b) 1 ms; (c) 2 ms; (d) 3 ms; (e) 4 ms; (f) 5 ms; (g) 6 ms; (h) 7 ms; (i) local enlarged view of contact surface.
Machines 12 00720 g023
Figure 24. The stable contact length of the tube with different cone angles varies with thickness.
Machines 12 00720 g024
Figure 25. The change trend of internal energy ratio of different shrinkage tubes: (a) thickness change; (b) cone angle change.
Machines 12 00720 g025
Table 1. MCF of different mesh sizes.
Mesh-Size (mm)MCF (kN)Relative Error (%)
5 × 5 × 570022.16
4 × 4 × 45872.44
3 × 3 × 3573-
Disclaimer/Publisher’s Note: The statements, opinions and data contained in all publications are solely those of the individual author(s) and contributor(s) and not of MDPI and/or the editor(s). MDPI and/or the editor(s) disclaim responsibility for any injury to people or property resulting from any ideas, methods, instructions or products referred to in the content.

