Abstract
Unmanned Aerial Vehicles (UAVs) have become essential tools in various industries for tasks such as inspection, maintenance, and surveillance. An Online Impedance Adaptive Controller (OIAC) is proposed for the online modulating of UAV control gains to obtain better performance and stability of tracking curved trajectories than the traditional methods, Model Reference Adaptive Controller (MRAC) and Proportional–Integral–Derivative (PID). Two UAV path planners with minimal jerk and snap were integrated into OIAC, MRAC, and PID. These six controllers were implemented and compared in a simulated UAV with perceptional noise, which follows curved pipelines and avoids obstacles. Experimental results show that the OIAC controller achieves at least an 80% improvement over the PID controller across all trajectory types in terms of the trajectory tracking error. Additionally, OIAC demonstrates an over 20% improvement in jerk trajectories and a more than 30% improvement in snap trajectories when compared to the MRAC controller. These results indicate that OIAC offers enhanced trajectory tracking accuracy and robustness against perceptual noise. Our work presents an advanced controller of a UAV and its preliminary validation in accurate and robust path tracking.
1. Introduction
Unmanned Aerial Vehicles (UAVs) have revolutionized fields such as inspection, maintenance, and surveillance, among others. These devices are characterized by their intelligence, lightweight design, cost-effectiveness, environmental friendliness (zero emissions), and user-friendly operation. However, UAVs face significant challenges, particularly in the form of disturbances. Factors such as sensor noise, wind, variations in pressure, and shifts in the center of gravity can perturb and potentially destabilize the drone, hindering its ability to perform its intended functions. In addition, certain UAVs, especially larger multirotor and fixed-wing models, face difficulties in executing tight turns during forward flight. Such maneuvers can impose stress and cause wear to the motors, propellers, and supporting arms. To address these challenges, adaptive controllers have been implemented in UAV systems to effectively reject both internal and external disturbances. For larger drones tasked with surveillance, achieving optimal performance necessitates the planning of efficient trajectories and precise adherence to these paths, even in the presence of environmental disturbances. This approach ensures that UAVs can operate with maximum efficiency and reliability.
Other Works
PID controllers are a foundational control architecture in UAV systems, valued for their simplicity and reliable performance in linear environments. For UAVs and other nonlinear systems, adaptive PID controllers have been developed to improve control flexibility and robustness. Chang et al. (2001) introduced a self-tuning PID control strategy grounded in Lyapunov stability theory, effectively addressing nonlinear behaviors where conventional PID tuning is inadequate [1]. Building on this, Xiong and Fan (2007) applied Model Reference Adaptive Control (MRAC) techniques to PID controllers in DC motor applications, allowing the real-time adaptability of PID parameters [2]. This adaptability enhances performance under changing system conditions, demonstrating the potential of MRAC in adaptive PID control. Sahputro et al. used adaptive PID controller to control a DC motor, where the adaptation is done through Recursive Least Square (RLS) [3].
Rothe et al. (2020) further advanced adaptive PID techniques with a Modified MRAC (M-MRAC) designed specifically for UAV altitude control. By incorporating an updated MIT rule, this approach significantly improves stability in UAV operations under variable payloads [4]. Mareels et al. used the MIT rule for adaptation of the MRAC [5]. Hanna et al. (2022) introduced an adaptive PID controller based on a Polynomial Weighted Output Recurrent Neural Network, reducing the number of tunable parameters and enhancing computational efficiency, thereby offering robust performance in uncertain environments [6]. Uçak and Arslantürk (2023) contributed an adaptive MIMO fuzzy PID controller that employs a peak observer to dynamically adjust parameters, improving tracking accuracy and disturbance rejection in complex multi-input systems [7]. Furthermore, Zhang et al. (2023) developed an intelligent adaptive PID controller for marine electric propulsion systems, using the evidential reasoning rule for optimizing PID parameter optimization in real time under nonlinear disturbances [8]. Maaloul et al. used Lyaponov theorem to create an adaptive PID controller to the quadrotors through modulation of the PID gains [9].
Model Reference Adaptive Control (MRAC) is another influential method that has evolved as a powerful solution for managing uncertainties and nonlinearities in dynamic systems. This technique offers robust performance across applications, including UAV control, industrial automation, and precision manufacturing. Gai et al. (2021) introduced the latest MRAC-PID configuration for CNC machine tools, significantly enhancing motion-control accuracy and noise suppression. Although not directly related to UAVs, Gai et al.’s work exemplifies the versatility of MRAC-PID in achieving high-precision control, relevant to adaptive control applications across various domains [10].
Further advancements in MRAC have been driven by integrating deep learning techniques. Joshi and Chowdhary (2019) pioneered a Deep MRAC framework that utilizes neural networks to model complex nonlinearities while ensuring stability in uncertain environments. This deep learning-enhanced MRAC architecture is a significant step forward, enabling high-performance adaptive control where conventional methods may struggle [11]. Huo and Dai (2023) extended MRAC applications to UAV trajectory tracking and collision avoidance, underscoring the role of adaptive control in maintaining safety and operational reliability in complex flight scenarios [12].
The Adaptive Neuro-Fuzzy Inference System (ANFIS), initially developed by Jang (1993), combines the learning ability of neural networks with the rule-based reasoning of fuzzy logic, providing a robust framework for adaptive control. Pham and Han (2022) applied ANFIS to marine rescue drones, improving trajectory tracking by mitigating environmental disturbances such as wind. This approach highlights ANFIS’s adaptability in dynamic and unpredictable environments, reinforcing its applicability beyond traditional PID-based methods [13,14].
Sliding Mode Control (SMC) techniques have also been widely applied to UAVs, enhancing control robustness and disturbance rejection capabilities. Noordin and Basri et al. developed an Adaptive PID integrated with Sliding Mode Control for micro air vehicles (MAVs), which outperformed traditional PID controllers in robustness against external disturbances, such as wind gusts [15]. They also created adaptive PID controller to control thrust with a fuzzy compensator [16]. Xiao et al. (2022) designed an SMC-based trajectory-tracking controller for aerial photography, significantly improving UAV stability and control in dynamic operations [17]. Zhao et al. (2020) addressed uncertain dynamics by employing high-order sliding mode observers for effective disturbance estimation, ensuring robust trajectory tracking under dynamic conditions [18]. Mechali et al. (2022) introduced a fixed-time nonlinear homogeneous sliding mode control strategy tailored for multirotor aircraft, providing guaranteed robust tracking with fixed-time convergence despite external perturbations and unmodeled dynamics [19]. In summary, these adaptive control strategies, particularly MRAC and its integration with deep learning, along with SMC and ANFIS approaches, underscore the ongoing advancements in control systems for UAVs and other complex systems. The increasing use of neural networks and fuzzy logic in adaptive control represents a shift towards more intelligent and robust solutions, paving the way for future innovations in this field.
The Online Impedance Adaptation Controller (OIAC) is a real-time adaptive control mechanism that, while not widely recognized for its application in UAVs, has gained significant traction in the fields of Human–Robot Interaction (HRI) and bio-robotic systems [20,21,22]. The OIAC exemplifies an advanced adaptive control strategy, wherein the control gains are automatically adjusted in real time to ensure system stability within dynamic environments. This adaptive capability is crucial for effectively managing the variability and unpredictability that often arise during UAV operations. Previous research has demonstrated the versatility of the OIAC across various applications, including the control of wearable robotic exoskeletons, the achievement of human-like motor control, and the management of a robotic arm manipulating a whip for precisely targeting in highly nonlinear systems, all while reducing computational complexity [23,24]. Furthermore, the OIAC has been utilized as a sensory feedback control mechanism for human arms within Sensorimotor Learning and Adaptation (SEED) systems [25]. Motivated by these findings, we propose to implement the OIAC in the control of drones to demonstrate their superior controllability in this context. The adaptive mechanisms inherent in the OIAC, combined with its integration into advanced control strategies, are expected to significantly enhance the performance, stability, and responsiveness of drones across a variety of operational conditions.
To optimize energy efficiency in UAV navigation for surveillance and inspection, this project explores two trajectory planning methods: Minimal jerk and minimal snap trajectories [26]. Minimal snap trajectories have been shown to be effective in prior studies on drone navigation [27], while minimal jerk trajectories are widely used in robotics for smooth motion and stability [23,24]. These trajectories are designed to minimize discontinuities, thereby preventing the motors from rapidly spooling to execute sharp turns. This approach not only conserves energy but also enhances the longevity of the UAV’s components. This study aims to identify the most suitable trajectory for UAV surveillance by comparing these two approaches in terms of efficiency and adaptability in complex, real-world environments. The project employs the CoppeliaSim (V4.6.0 EDU) [28] simulator for UAV modeling, with the controller implemented as a ROS 2 [29] node using Python, allowing for modular and real-time adjustments in trajectory control. Performance metrics are assessed by measuring the error distance between the ideal trajectories and the actual paths generated by three controllers: PID, MRAC, and OIAC. Additionally, an RRT* algorithm is integrated for obstacle avoidance, known for its efficient motion planning capabilities in dynamic environments. Building on Medhy Vinceslas’ UAV-Autonomous-Control repository [27], this project incorporates significant enhancements. These include the use of higher-order derivatives for optimized trajectory planning and an adapted RRT* algorithm capable of detecting and navigating around rotated cuboid obstacles. These improvements ensure that the navigation system can effectively handle the complex and confined environments typical of inspection. Furthermore, ren et al. incorporated an advanced path planning techniques involving dynamic mapping and real-time sensory feedback to evaluate path feasibility in changing environments [30]. To assess controller performance, this study utilizes integral error metrics, including the Integral of Squared Error (ISE), Integral of Absolute Error (IAE), Integral of Time-weighted Absolute Error (ITAE), and Integral of Time-weighted Squared Error (ITSE). These metrics provide a comprehensive evaluation of both transient- and steady-state performance, with particular emphasis on minimizing sustained and large errors, thereby ensuring efficiency and stability in UAV navigation. The OIAC’s performance is benchmarked against the PID and MRAC.
2. Methods
In this section, we define the controllers, the quadcopter dynamics, optimal trajectories, and the use of integral errors for performance measurements. The drone, being simulated in CoppeliaSim, is controlled by external ROS2 script through messaging communication system. Figure 1 shows how the ROS 2 controller node and CoppeliaSim’s drone communicate with each other.

Figure 1.
CoppeliaSim and ROS 2 node communication diagram.
2.1. Controllers
2.1.1. OIAC
To set up the Online Impedance Adaptive Controller (OIAC), a control law is given by:
where is the resulting control output, is force, is stiffness impedance, and is damping impedance. The impedance parameters have t as the input parameter, as they all change with respect to time, hence why the controller can tune its gains online to adapt in a given environment. Additionally, a is introduced as an I-term:
and are position and velocity errors, respectively. and are desired position and velocity, respectively. is the tracking error usually used in robot control. The is a positive constant that controls the tracking error. To allow adaptation to occur in real time, a set of adaption laws are given:
The is the adaptation scalar controlled by tracking error and two positive constants a and b. By looking at Equation (8), increasing a will slow the response time, and b controls the convergence of the tracking error. The input parameters for OIAC are a, b, and . The stability proof of the OIAC is found in Appendix B.
2.1.2. MRAC
The Model Reference Adaptive Control (MRAC) system comprises a system model and a reference model (see Equations (9)–(12)).
In these equations, represents the state of the reference model, is the reference state matrix, is the reference input vector, is the reference input, is the reference output matrix, and is the reference output. Given that a quadcopter is a highly nonlinear system, a nonlinear plant model is utilized to provide a more accurate state-space representation. Here, denotes the actual plant state, and , , and are the state, input, and output matrices, respectively. These matrices are dependent on the state due to the system’s nonlinear nature.
Unlike the traditional MRAC, where we control one adaptation parameter, we instead implement it on the PID controller [31], where MRAC is used to update the P-, I-, and D-term continuously in real time in order to adapt against continuous changes in both the system and the environment, so that is why we using a PID controller for the control input , as shown in Equation (13). Consequently, the MRAC-PID control law is expressed in Equation (14):
Here, the error is calculated as , where is the reference signal and is the system output. To achieve adaptation, we choose the MIT rule [4] as it is the simplified version of Lyapunov’s stability criterion. The objective of the MIT rule is to minimize the squared error cost function using gradient descent, given by , to determine the optimal gains for , , and . By applying the chain rule in the gradient descent process, we derive the following adaptation laws:
where are the learning rates for the proportional, integral, and derivative terms. See Appendix A for the step-by-step method to obtain these results.
2.2. Quadcopter
The quadcopter is a highly nonlinear, underactuated system. Pitch and roll influence the x and y movements, while yaw changes the drone’s orientation, misaligning its body reference frame with the Earth’s reference frame. The researchers behind IHODFC [32] used Euler angles for rotation, valued for their intuitive representation and simplicity. However, Euler angles are susceptible to singularities, leading to the phenomenon known as gimbal lock, where the system loses a degree of freedom. Additionally, trigonometric functions in rotation matrices are computationally expensive, slowing down the system.
Luckily, quaternions have resolved these issues. As four dimensional numbers, , they provide numerical stability and computational efficiency by adhering to this multiplication rule:
They are also compatible with ROS2’s attitude publisher, which uses them to determine the orientation of the drone.
The dynamics of a UAV can be described below:
where:
- is a symmetric, positive definite mass matrix expressed aswhere
- −
- is the identity matrix;
- −
- is the zero matrix;
- −
- m is the mass of the drone;
- −
- is the inertia matrix.
The inertia matrix is expressed asFor quadcopters, the inertia matrix is typically - is a Coriolis matrix expressed aswhere
- −
- m is the mass of the drone;
- -
- is the zero matrix;
- −
- is the inertia tensor;
- −
- is a vector of angular velocities in the body reference frame defined as
- −
- is a function that creates skew-symmetric matrix of vectors defined as
- is a transformation matrix defined aswhere is a rotation matrix derived from the quaternion . can be expressed as
- is a position vector in the Earth’s reference frame given aswhere is the position in the Earth reference frame.
- is a velocity vector in the body reference frame given aswhere is the velocity in the body reference frame.
- is the force vector acted upon the quadcopter which consist of thrust, gravity, and aerodynamics.
2.2.1. Thrust Control
To complete the quadcopter model, we define the thrust matrix M, thrust coefficient , moment coefficient , and the squared motor speeds for each motor. Each motor i generates a thrust and moment based on its angular speed :
The total thrust T along the quadcopter’s body frame z-axis is the sum of the thrusts from all motors:
To relate to the total thrust and torques, based on the free body diagram in Figure 2, we define a thrust matrix M:
where
- d is the distance from the quadcopter’s center to each motor.
- The first row gives the total thrust T.
- The subsequent rows provide the torques , , and around the roll, pitch, and yaw axes, respectively.
Using this thrust matrix, we can control the quadcopter by adjusting motor speeds, thereby producing the desired thrust and torque outputs. The control torque vector and thrust vector T can be expressed as
This enables us to solve for motor speeds to achieve the desired thrust and torques in the quadcopter control system. Consequently, to obtain motor speed squared, we inverse the thrust matrix and multiply it with the force vector:
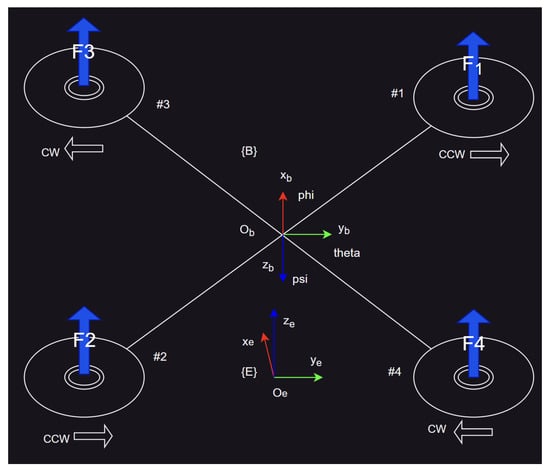

Figure 2.
Free body diagram of a quadcopter.
2.2.2. Control Schema
The multirotor UAV operates with four primary control inputs: throttle, roll, pitch, and yaw. As an underactuated system, adjusting roll influences the drone’s position along the y-axis, while adjusting pitch affects its x-axis position within the body frame. This coupling of axes requires a cascade control approach to maintain precise x and y positions in the global (world) frame.
In this experiment, the setup was simplified by aligning the drone’s body frame with the world frame in the XY plane, allowing us to disregard world-to-body transformations, which is why the yaw angle was set to zero.
In typical multicopter control setups, six controllers are often used: two for position, one for yaw, two for altitude, and one for thrust. However, in this project, these controllers were vectorized and simplified to reduce their number to three: throttle, position, and angle. Figure 3 illustrates the control diagram for this.
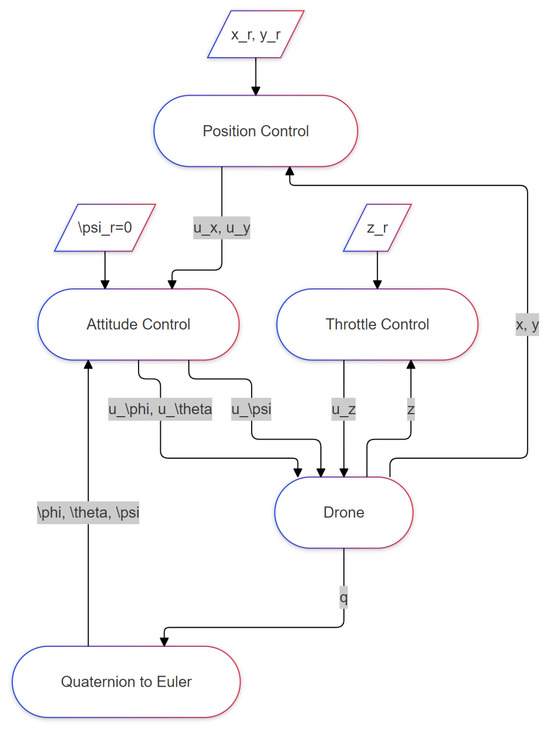
Figure 3.
Control diagram used in simulation. (Yaw is set to 0.)
The throttle controller independently regulates the drone’s altitude. The position and angle controllers, however, are cascaded, forming outer- and inner-loop controls. The outer-loop (position) controller has two elements, while the inner-loop (angle) controller has three elements, with the third element dedicated to yaw control. For optimal responsiveness, the inner-loop controllers must operate significantly faster than the outer loop—a principle that holds across all control techniques.
2.3. Path and Motion Planning
To generate an optimal, collision-free path from the start to the goal, the RRT* planner was combined with an optimal trajectory generator. Since the RRT* algorithm typically considers only two points at a time, while the trajectory generator requires an optimal path across multiple points (more than seven in this case), the RRT* algorithm was run iteratively for each waypoint. This approach connected local points effectively while also benefiting from the RRT* algorithm’s inherent obstacle avoidance capabilities.
The objective for using minimal jerk is to minimize this cost function:
where J is the cost function representing the total jerk. is the position as a function of time. is the jerk, the third derivative of position with respect to time. and are the initial and final times of the trajectory. Minimizing this cost function results in .
The solution to this optimization problem, assuming boundary conditions for position, velocity, and acceleration at the start and end of the movement, is a fifth-degree polynomial:
The coefficients , , , , , and are determined based on the boundary conditions. This polynomial ensures that the trajectory is smooth, with continuous derivatives up to the third order.
Similarly, the minimal snap trajectory minimizes this cost function:
where is the snap, the fourth derivative of position with respect to time. Furthermore, the solution is a septic polynomial, assuming that position, velocity, acceleration, and jerk are given boundary conditions:
2.4. Minimal Jerk Trajectory Planning
To design a minimal jerk trajectory, we represented the position over time t as a 5th-degree polynomial in Equation (38). This polynomial allowed us to control position, velocity, and acceleration at the start and end of the trajectory, while minimizing jerk throughout the motion.
To ensure smooth transitions, we defined boundary conditions for position x, velocity , and acceleration at the start time and end time . These conditions are as follows:
Using these boundary conditions, we substitute and into the polynomial and its derivatives, resulting in the following system of equations:
- Position Constraints:
- Velocity Constraints:
- Acceleration Constraints:
We can instead write these equations in matrix form , where
- x is the vector of polynomial coefficients ;
- b is the vector of boundary conditions ;
- A is the matrix formed by substituting and into the polynomial equations.
Thus, we have
Solving for Coefficients
To find the coefficients, , that define the minimal jerk trajectory, we solve the linear system
where x represents the polynomial coefficients, which provide the desired minimal jerk trajectory from the start- to the endpoint.
2.5. Artificial Disturbances
To further prove why OIAC is a well-performing controller for a real world applications compared to MRAC and PID, 2 copies of the optimal trajectories were distorted with Gaussian noise (with stds of 0.05 and 0.1). This matches the measurement noise of the instruments and uncertainty from the environment. The controllers got fed not only a noisy positional trajectory but also a noisy velocity trajectory, since the Gaussian noise was applied on every derivative of the optimal trajectory. This bumps the total number of experimentations up to 18. Furthermore, an additional 18 experimentation were created with doubled velocity to make trajectory tracking more difficult for the controllers and to make it easier to differentiate the performance between them. With added doubled velocity for all trajectories, the total number of experimentation was 36.
2.6. Performance Measurements
To actually estimate the performance for each controller in their trajectory tracking performance, we measured their mean and std errors. The error, e, is the difference between the reference signal and system output (). The mean error is the average of all error data points in the recorded time frame:
where at calculating the standard deviation is calculated as
We also used Integral Absolute Error (IAE), Integral Square Error (ISE), Integral Time Absolute Error (ITAE), and Integral Absolute Square Error (ITSE) to evaluate the performance of a control system:
- Integral Absolute Error (IAE): Measures the cumulative absolute error over time:where is the error at time t. IAE penalizes the overall error without emphasizing the magnitude of individual errors.
- Integral Squared Error (ISE): Measures the cumulative squared error over time, penalizing larger errors more heavily.This metric is useful for applications where minimizing larger deviations is critical, but it may allow small persistent errors.
- Integral of Time-weighted Absolute Error (ITAE): Weights the absolute error by time, penalizing errors that persist longer and encouraging faster error reduction.ITAE is ideal for applications where prompt settling is important, as it emphasizes reducing error over time.
- Integral of Time-weighted Squared Error (ITSE): Combines the time-weighting of ITAE with the squared error term of ISE, penalizing both large errors and errors that last over time.This metric promotes a smooth response and penalizes both large and persistent errors.
These metrics were chosen based on the specific performance objectives of the control system, such as minimizing the transient response and steady-state error.
3. Results
To conduct the simulations and obtain meaningful results, it is essential to understand the physical properties of both the drone and its environment. In this setup, the drone’s characteristics were already defined within a Lua script in CoppeliaSim. The Lua script models the quadcopter dynamics by simulating accelerated particles. The parameters used for these particles are detailed in Table 1.

Table 1.
Particle parameters.
We excluded parameters such as particle lifetime, maximum particle count, and scattering angle, as they do not influence the force exerted on the drone. To compute the total force exerted on the drone by the moving particles, we utilized Equation (50) provided below.
where is the particle diameter, is the particle density, is the particle count per second, and is the average velocity for all particles exerted by the drone.
We assumed the average velocity of each particle to be 9.2 m s−1. Using the calculation from Equation (50), the combined mass of all four propellers was approximately 2.2 kg. Assuming that the gravitational acceleration in the simulator was 9.8 N kg−1, the thrust force was calculated as 2.2 kg × 9.8 N kg−1 = 21.56 N. According to the CoppeliaSim Lua script, the feedforward control gain was set to 5.45, which we interpreted as 5.45 N per propeller. For all four propellers, this resulted in a total thrust of 5.45 N × 4 = 21.8 N. The slight difference in forces (0.24 N) causes the drone to descend slowly, facilitating easier control of its position and attitude by the controllers. Sadly, the information of the drone mass was roughly estimated and not defined directly in the Lua script. The arm length of the drone was also not shown, so obtaining the inertia tensor was also not possible.
3.1. Environment
The environment was set up in CoppeliaSim’s simulator, and, as shown in Figure 4, had multiple cylinders and boxes arranged in an orderly manner, so it closely resembled pipelines in the real world.
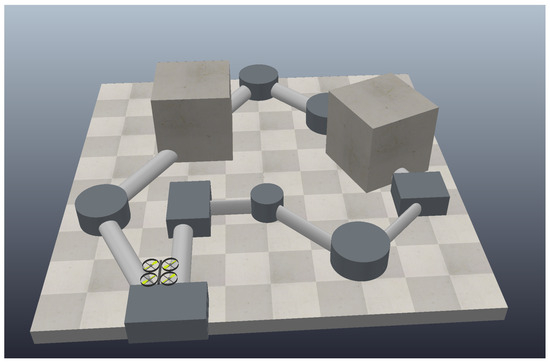
Figure 4.
The environment where the drone is simulated.
To prevent the drone from flying too far off or getting flipped upside-down, boundaries were set up as shown in Table 2. These boundaries were given because CoppeliaSim’s ground dimension is 2.8 × 2.8 m2. The maximum z axis was chosen to be higher than the structures and to maintain consistency.

Table 2.
Boundary constraints.
Exceeding those boundaries stopped the simulation. This implementation made debugging easier and sped up the project development. Since the simulator itself could be controlled by ROS 2, modifying, debugging, and running the simulation was much easier and more streamlined.
3.2. Controller Parameters
The PID gains were taken from Coppeliasim’s simulation presets for quadcopters. The presets are shown in Table 3.

Table 3.
PID controller parameters with FF (feedforward), LS (lower saturation), and US (upper saturation).
Table 4 and Table 5 display the selected parameters for OIAC and MRAC, respectively, used in this simulation. These values were obtained experimentally and fine-tuned to achieve optimal and satisfactory performance.

Table 4.
OIAC controller parameters with FF (feedforward), LS (lower saturation), and US (upper saturation).

Table 5.
MRAC controller parameters with FF (feedforward), LS (lower saturation), and US (upper saturation).
3.3. Simulation Results: Slow Speed
After running the controllers in the simulation, the recorded data were plotted for analysis and comparison.
Figure 5 illustrates the minimal jerk trajectory without distortion, alongside the drone paths for all controllers. The results indicate that the OIAC controller achieves the best tracking performance, with minimal deviation from the desired trajectory. The MRAC controller exhibits some initial deviation but subsequently aligns closely with the trajectory. In contrast, the PID controller experiences significant initial deviation and takes considerably longer to converge to the desired path, reflecting its slower response to trajectory tracking.
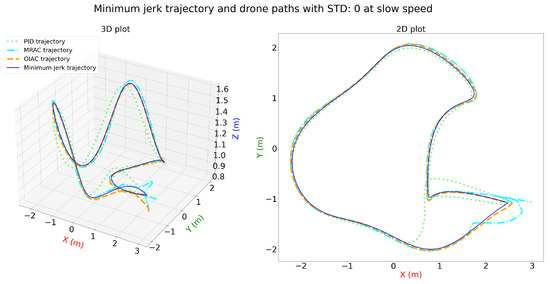
Figure 5.
Three-dimensional and two-dimensional plots for minimum jerk trajectory and drone paths with STD: 0 for PID, MRAC, and OIAC at slow speed.
With added distortion in Figure 6 and Figure 7, the OIAC controller remains robust and effectively controls the drone despite the disturbances. The MRAC controller exhibits some difficulties but performs reasonably well overall. In contrast, the PID controller struggles significantly, showing chaotic deviations and difficulty in maintaining trajectory tracking under these conditions.
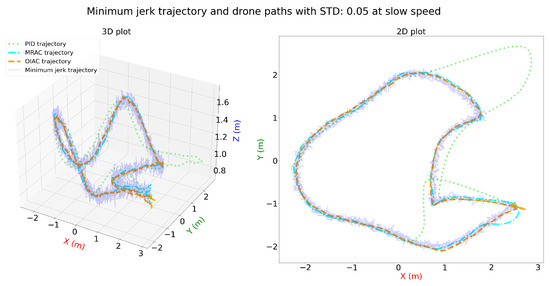
Figure 6.
Three-dimensional and two-dimensional plots for minimum jerk trajectory and drone paths with STD: 0.05 for PID, MRAC, and OIAC at slow speed.

Figure 7.
Three-dimensional and two-dimensional plots for minimum jerk trajectory and drone paths with STD: 0.1 for PID, MRAC, and OIAC at slow speed.
In the minimal snap trajectory shown in Figure 8, the OIAC controller performs exceptionally well, maintaining close adherence to the desired path with minimal deviation. The MRAC controller experiences a slight deviation at startup but quickly aligns with the trajectory. The PID controller also performs reasonably well, though it exhibits noticeable deviation during the final turn as it approaches landing.

Figure 8.
Three-dimensional and two-dimensional plots for minimum snap trajectory and drone paths with STD: 0 for PID, MRAC, and OIAC at slow speed.
The distorted snap trajectories in Figure 9 and Figure 10 demonstrate varying levels of controller performance under increased distortion. In Figure 9, the OIAC controller maintains close adherence to the trajectory with stable performance, while the MRAC controller follows reasonably well, despite some minor deviations. The PID controller, however, struggles to track the trajectory accurately. In Figure 10, OIAC continues to show robust stability, but MRAC experiences significant instability, resulting in a loss of trajectory tracking, likely due to crashes. The PID controller remains unable to handle the increased distortion effectively, exhibiting chaotic behavior. Despite that, it reaches the end.
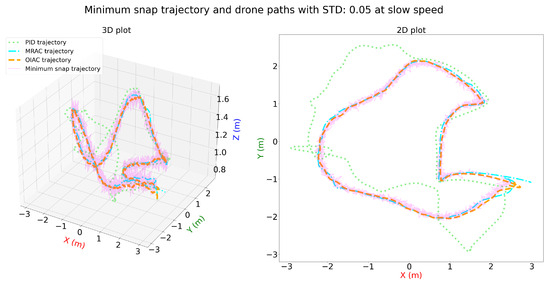
Figure 9.
Three-dimensional and two-dimensional plots for minimum snap trajectory and drone paths with STD: 0.05 for PID, MRAC, and OIAC at slow speed.
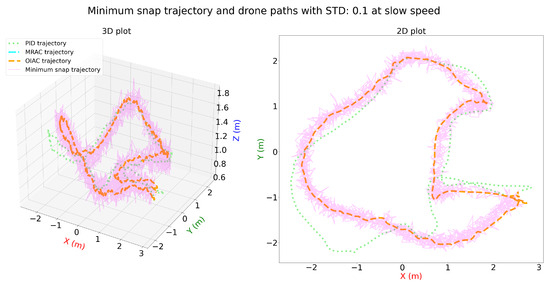
Figure 10.
Three-dimensional and two-dimensional plots for minimum snap trajectory and drone paths with STD: 0.1 for PID, MRAC, and OIAC at slow speed.
To assess the performance of each controller, we analyzed the error data obtained by subtracting the drone’s path data from the reference trajectory: . Figure 11 and Figure 12 illustrate the controllers’ tracking errors across different levels of distortion for both minimal jerk and snap trajectories. The results show that the OIAC controller consistently outperforms the other controllers, maintaining the lowest error in nearly all scenarios, except for the minimal jerk trajectory with a 0.1 standard deviation distortion, where its performance slightly decreases.
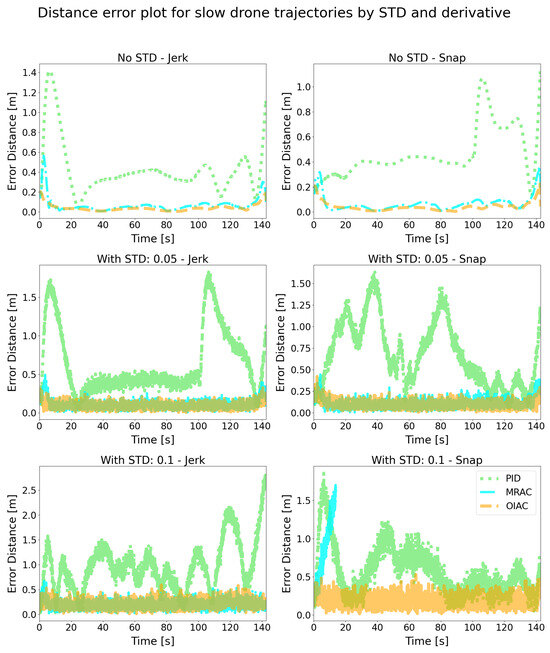
Figure 11.
Error distance plot for slow flight in simulation.
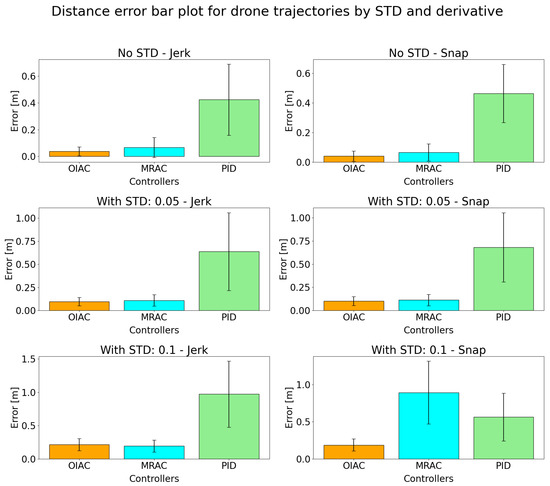
Figure 12.
Error distance bar plot for simulated slow flight in simulation.
Table 6 provides a detailed summary of the mean and standard deviation for the tracking errors across all trajectories and distortion levels. These metrics confirm that OIAC achieves the most robust performance overall, followed closely by MRAC, while the PID controller exhibits significantly higher tracking errors, particularly under increased distortion.

Table 6.
Drone error values for slow minimal jerk and snap trajectories.
It should be noted that the abbreviation STD is not same as std . The former is used to distort the reference signal with Gaussian noise and the latter is the standard deviation of the error trajectory.
Table 7 presents the measured performance in IAE (46), ISE (47) ITAE (48), and ITSE (49) for the controllers.

Table 7.
Integral errors for slow speed—Minimal Jerk and Snap Trajectories.
The results show that OIAC consistently achieves the lowest error across most metrics, particularly under lower distortion (STD: 0 and 0.05). MRAC also performs well, although it exhibits higher errors than OIAC, especially as distortion increases. PID, however, has significantly higher error values in all categories, indicating poorer tracking performance and increased sensitivity to distortion. These data align with earlier observations, where OIAC demonstrated superior robustness and stability in trajectory tracking.
3.4. Simulation Results: Fast Speed
Figure 13 compares the performance of PID, MRAC, and OIAC controllers in tracking a minimum jerk trajectory at fast speed with no added distortion (STD: 0). The 3D and 2D plots reveal that the OIAC controller achieves the most accurate tracking, staying closely aligned with the target path with minimal deviation. The MRAC controller shows moderate performance, initially diverging but gradually aligning with the trajectory, though with some visible deviations. The PID controller performs the poorest, exhibiting significant deviations, especially around sharp turns, indicating difficulty in maintaining stability at a high speed. Overall, this comparison demonstrates that OIAC is the most effective controller for high-speed tracking, offering robust and precise path adherence compared to MRAC and PID under these conditions.

Figure 13.
Three-dimensional and two-dimensional plots for minimum jerk trajectory and drone paths with STD: 0 for PID, MRAC, and OIAC at fast speed.
Figure 14 and Figure 15 display the performance of the PID, MRAC, and OIAC controllers on a minimum jerk trajectory at fast speed with added distortions (STD: 0.05 and STD: 0.1). In both the 3D and 2D plots, the OIAC controller maintains robust tracking, closely following the desired trajectory despite the increasing distortion levels. The MRAC controller performs reasonably well but shows more deviation than OIAC, particularly as the standard deviation increases. The PID controller struggles the most under these conditions, exhibiting significant deviations from the target path, especially in sections with sharp turns.
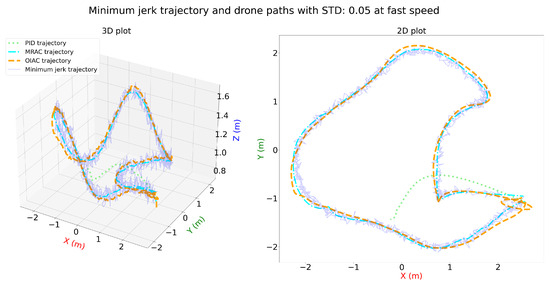
Figure 14.
Three-dimensional and two-dimensional plots for minimum jerk trajectory and drone paths with STD: 0.05 for PID, MRAC, and OIAC at fast speed.
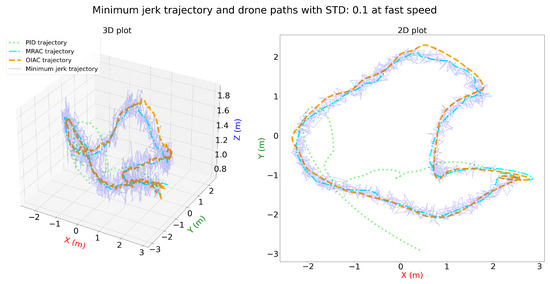
Figure 15.
Three-dimensional and two-dimensional plots for minimum jerk trajectory and drone paths with STD: 0.01 for PID, MRAC, and OIAC at fast speed.
Figure 16, Figure 17 and Figure 18 illustrate the performance of PID, MRAC, and OIAC controllers on a minimum snap trajectory at fast speed under varying distortion levels (STD: 0, 0.05, and 0.1). In the undistorted scenario (STD: 0), OIAC achieves the best tracking accuracy, closely following the desired trajectory with minimal deviation. MRAC performs moderately well, with minor deviations, while PID exhibits noticeable tracking errors, especially in turns. With a slight distortion (STD: 0.05), OIAC remains robust, though minor deviations appear. MRAC shows slightly increased deviations but generally tracks the trajectory adequately. PID, however, struggles significantly, especially around sharp turns, indicating difficulty in handling even moderate disturbances. At a higher distortion level (STD: 0.1), OIAC still demonstrates the most stable performance, though its deviation grows with the disturbance. MRAC struggles further to maintain trajectory alignment, and PID shows substantial errors, failing to maintain the path reliably.
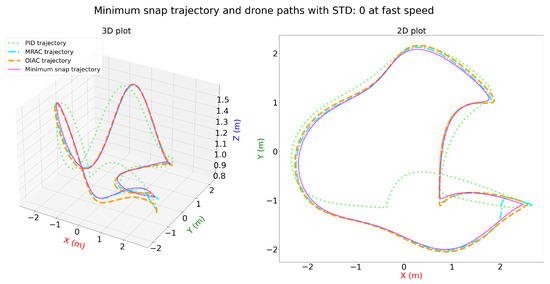
Figure 16.
Three-dimensional and two-dimensional plots for minimum snap trajectory and drone paths with STD: 0 for PID, MRAC, and OIAC at fast speed.
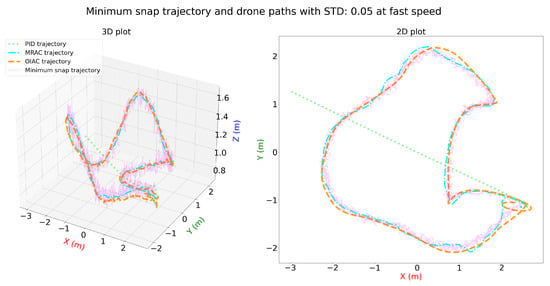
Figure 17.
Three-dimensional and two-dimensional plots for minimum snap trajectory and drone paths with STD: 0.05 for PID, MRAC, and OIAC at fast speed.
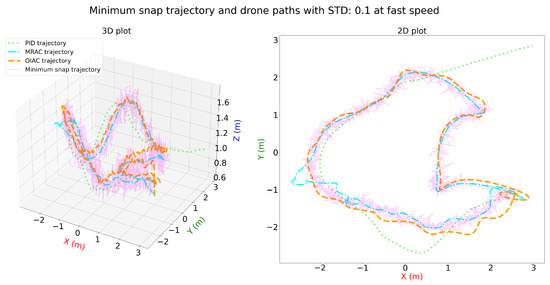
Figure 18.
Three-dimensional and two-dimensional plots for minimum snap trajectory and drone paths with STD: 0.01 for PID, MRAC, and OIAC at fast speed.
For fast trajectory simulations, Figure 19 and Figure 20 show that the OIAC controller consistently achieves the lowest tracking errors across all levels of distortion (STD: 0, 0.05, and 0.1) in both jerk and snap trajectories, demonstrating superior robustness and stability. MRAC performs moderately well, with error levels that increase slightly with higher distortion, yet it generally maintains effective tracking. In contrast, the PID controller exhibits the highest error and significant variability, especially in conditions with increased distortion, indicating its difficulty in handling fast trajectories under disturbance.
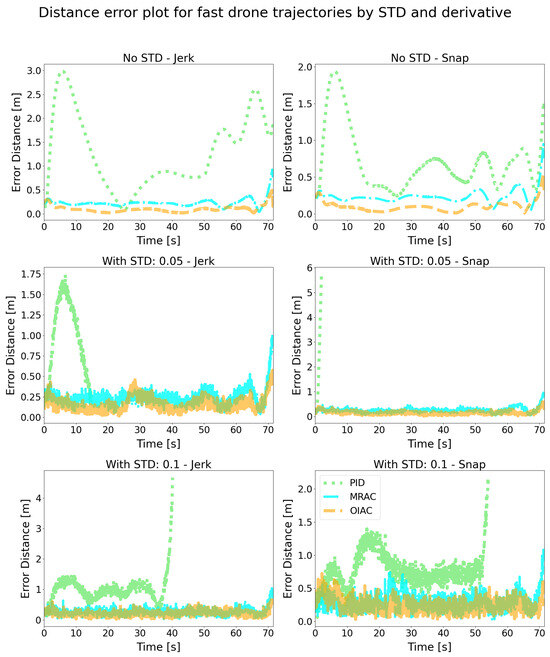
Figure 19.
Error distance plot for fast flight in simulation.
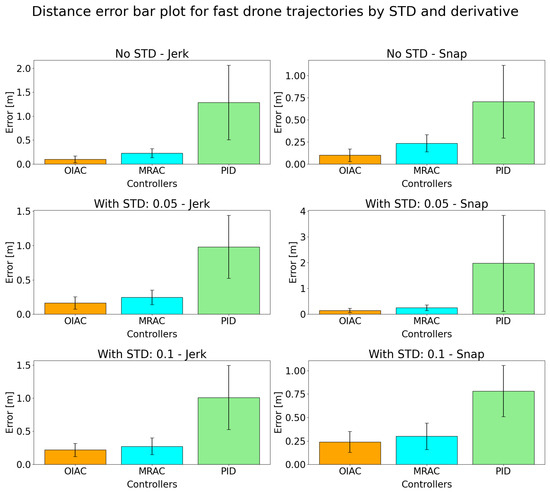
Figure 20.
Error distance bar plot for simulated fast flight in simulation.
Table 8 provides a quantitative summary, confirming that OIAC has the lowest mean and standard deviation of errors across all conditions, followed by MRAC. PID, however, shows the highest mean errors and standard deviations, underscoring its instability and sensitivity to disturbances at fast speeds.

Table 8.
Drone error values for fast speed—minimal jerk and snap trajectories.
The four error metrics (IAE, ISE, ITAE, and ITSE) further demonstrate that OIAC consistently achieves the lowest error values across all conditions, showcasing its robustness and stability in accurately tracking fast-speed trajectories, even as disturbance levels increase. These metrics also highlight the PID controller as the weakest performer, with consistently high error values, indicating its limited effectiveness, particularly in noisy environments. MRAC performs better than PID, with moderate error levels across metrics; however, its performance declines under higher noise, especially in time-weighted error metrics (See Table 9).

Table 9.
Integralerrors for fast speed—minimal jerk and snap trajectories.
Table 10 shows the percentage improvement of the OIAC over the PID and MRAC controllers in terms of trajectory tracking. The OIAC performs, on average, approximately better than PID, with a standard deviation of . Compared to MRAC, the OIAC shows an average improvement of around , with a standard deviation of .

Table 10.
Average and standard deviation of OIAC Improvement over PID and MRAC in slow and fast trajectories.
4. Discussion
The performance evaluation of error trajectories clearly demonstrates that the OIAC controller consistently outperforms the PID controller and performs better than the MRAC controller. Although MRAC provides comparable performance to OIAC, its reliability is notably lower, as multiple attempts were required to achieve successful simulations, whereas OIAC achieved success on the first attempt. However, initial data from simulations often included outliers, which needed to be pruned before analysis and plotting.
The native PID controller in CoppeliaSim displayed commendable tracking performance, but its effectiveness significantly decreased when exported as a ROS2 node. Due to this discrepancy, different parameters were used for the outer and inner loop controllers, refined through extensive debugging. The export to ROS2 was necessary because there is currently no reliable way to import generated trajectories directly for a fair comparison or to implement OIAC in a Lua script effectively, as Lua lacks vector norm math operations. Additionally, ROS2 has become a standard framework for UAV and robotic control, making it suitable for this project.
The PID controller was tested with various proportional (K), integral (I), and derivative (D) gains, resulting in 27 possible combinations across three controllers. Unfortunately no stable trials were found so all of them were discarded.
Initially, the experiment was intended to be conducted using PX4 SITL (Software In the Loop) with custom controllers. However, adjusting the PX4 firmware to handle angle control proved to be complex, time-consuming, and high-risk, leading to MATLAB-based testing as an alternative. MATLAB offers a well-established quadcopter simulation environment, complete with real-time dynamics and sensor emulation. Simple hover control tests showed that all three controllers performed satisfactorily. However, with active disturbances in position-holding tasks, OIAC showed superior stability. For trajectory tracking, OIAC was the only controller to follow the designated path accurately, although with some difficulty. Performance issues prevented reliable results in the Simulink visual mode. This simulation used the model of Parrot Minidrone, which was unsuitable for PX4 and ROS 2 due to its size and hardware constraints. These limitations necessitated a shift to CoppeliaSim as the primary simulation environment.
While CoppeliaSim facilitated OIAC evaluation effectively, it used particle-based dynamics rather than rigid-body dynamics. Despite this fundamental difference, drone behavior in CoppeliaSim closely approximated that of rigid-body dynamics, making it a viable testing environment.
Field tests were originally planned for validation with a DJI F450 quadcopter frame and a PX4 flight controller (see Figure 21). However, the project faced several constraints, including limited empirical testing capabilities, constant trial and errors, and many revisions, which ultimately prevented full implementation.
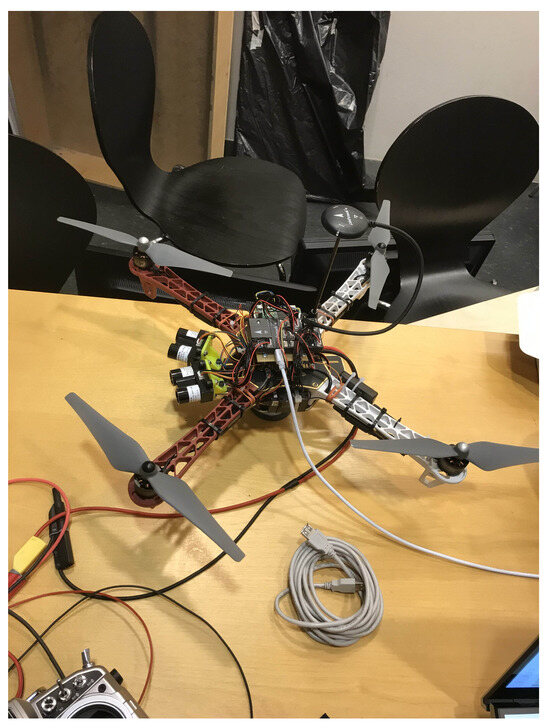
Figure 21.
Experiment setup of DJI F450.
5. Future Work
In future, this project will focus on validating the OIAC controller on a physical drone. Specifically, experimentation on a DJI F450 frame equipped with a PX4 flight controller is recommended. A controlled setup can be employed by mounting the drone on a 2D gimbal to limit angular displacement and suspending it to restrict vertical movement and yaw. This configuration, illustrated in Figure 21, allows for safe tuning and benchmarking without risking hardware damage, and enables continuous power supply via a power supply unit. Programming the PX4 flight controller can be achieved using Simulink, which offers an accessible alternative to modifying the source code directly, avoiding the need for custom firmware. Building on previous studies, such as IHODFC experiments in simulation and real-world settings [32], this setup will allow cross-comparison and performance benchmarking of OIAC against established controllers like IHODFC. Furthermore, the ANFIS controller [13] could serve as another viable benchmark, given its established use within the Simulink environment. The MNHOUNSADR controller [33] shows strong potential as a candidate for UAV testing and benchmarking against the OIAC. However, a key takeaway is its primary focus on third-order dynamics and beyond, whereas multirotor systems are typically characterized by second-order dynamics. The OIAC is a relatively modern controller, with improved versions currently under development. These advancements are expected to further enhance the OIAC’s disturbance rejection capabilities and adaptation speed, making it an even more effective choice for UAV performance comparisons and analysis.
6. Conclusions
The OIAC controller was implemented on a drone inside CoppeliaSim to evaluate its viability for real-world applications, specifically for pipeline surveillance. Experiments were conducted using minimal jerk and snap trajectories under two speed levels and three Gaussian noise levels across three controllers (PID, MRAC, and OIAC), resulting in a total of 36 experiments.
Based on the test results, the OIAC controller outperformed the PID controller significantly, exhibiting lower mean errors and deviations. While its performance was comparable to that of the MRAC controller, the OIAC demonstrated higher reliability; MRAC required multiple restarts for successful experimentation, while OIAC succeeded consistently in a single attempt. It should be noted that the PID controller did not perform as effectively in this test as the default PID preset in CoppeliaSim, though the MRAC controller was rigorously tested for fair comparison.
The results suggest that the OIAC controller is well suited for real-world UAV applications due to its superior performance and reliability. Its consistent accuracy and low error rates under various conditions, coupled with fewer operational issues than MRAC, make it a viable candidate for practical deployment.
Performance Analysis
- OIAC vs. PID: The OIAC controller consistently shows a significant average improvement over PID, with an overall improvement of approximately 82.94% and a standard deviation of 7.81%. For both slow and fast trajectories, in metrics of jerk and snap, the OIAC has substantial advantages over PID, indicating that it provides smoother control with lower error accumulation in various conditions.
- OIAC vs. MRAC: The OIAC also outperforms MRAC but to a lesser extent, with an average improvement of about 31.76% and a standard deviation of 19.40%. Although MRAC achieves reasonably low errors, its higher standard deviation indicates less consistency, especially under noisy conditions, compared to OIAC.
- Integral Error Metrics: In both slow and fast trajectories (Table 7 and Table 9), the OIAC achieves the lowest values across all error metrics, including Integral Absolute Error (IAE), Integral Squared Error (ISE), Integral Time-weighted Absolute Error (ITAE), and Integral Time-weighted Squared Error (ITSE). These values highlight the OIAC’s capability to maintain low cumulative errors over time, demonstrating its robustness against disturbances and noise.
- Reliability: OIAC’s reliability is further underscored by the requirement for only one experimental setup, whereas MRAC needed multiple restarts. This suggests that OIAC is more robust in maintaining consistent performance without frequent recalibration.
In summary, the OIAC controller exhibits superior performance, particularly in terms of error reduction and reliability, making it highly suitable for deployment in UAV applications such as pipeline surveillance, where stability and precision are crucial.
Author Contributions
Conceptualization, X.X.; Methodology, Z.A.; Software, X.X.; Validation, Z.A.; Formal analysis, Z.A.; Writing—original draft, Z.A.; Writing—review & editing, X.X.; Supervision, X.X. All authors have read and agreed to the published version of the manuscript.
Funding
The research was partially funded by Fabrikant Mads Clausens (2023-0210), P.A. Fiskers (2024-0613) and EnergiFyn (2024-0325).
Data Availability Statement
The original contributions presented in the study are included in the article, further inquiries can be directed to the corresponding author.
Conflicts of Interest
The authors declare no conflict of interest.
Appendix A. Calculation of MIT Rule
- Define the Error:where is the reference model output and is the plant output.
- Cost function:The cost function quantifies the error to be minimized.
- Parameter Update Law:where is the adaptation gain, and represents the PID gains.
- Partial Derivative of the Cost function:
- Control law for PID:
- Error Sensitivity for PID Gains: Compute the sensitivity of the error with respect to each PID gain:
- (a)
- Proportional Gain ():
- (b)
- Integral Gain ():
- (c)
- Derivative Gain ():
- Parameter Update Laws: Applying the MIT rule, the update laws for the PID gains are as follows:
- (a)
- Proportional Gain ():
- (b)
- Integral Gain ():
- (c)
- Derivative Gain ():
Appendix B. Adaptation Law and Stability of OIAC
The feedforward force F and impedance are online-optimized to modulate the control input to the UAV (see Equation (1)). Its objective is to minimize the tracking error e (see Equation (4)) of following curved lines. Specifically, the force (F) and impedance adaptations are online-tuned by minimizing task errors and maintaining control stability [20,34]:
utilizing a linear second order impedance model [21] where and are the weight norms and column vectorization, while maintaining control stability due to the UAV dynamics through
the overall minimized cost function is given by
a sufficient condition for the OIAC control stability is .
Let , , and be the expected force, stiffness, and damping matrices for achieving stable joint motions and task adaptation:
combining with Equation (A12) yields
where , , and are symmetric positive-definite matrices, and stands for the column vectorization. Now, Equations (5)–(7) can be written as
where all functions are unknown and periodic with T. Consider the difference between (see Equation (A16)) of two consecutive periods
where stands for the trace of a matrix. Using the symmetry of and Equation (A17), the first term of Equation (A18) can be written as,
then, similarly, the second and third terms can be
substituting Equations (A19), (A20), and (A21) into Equation (A18),
where the matrices and Q are given by
similarly, using the skew symmetry of UAV dynamics, Equation (A15), of Equation (A13) can be written as
combining Equations (A22) and (A24), the derivative of Equation (A14) can be given by
a sufficient condition for is that is a positive-definite matrix and
the scalars a and b in are set as
References
- Chang, W.-D.; Hwang, R.-C.; Hsieh, J.-G. A self-tuning PID control for a class of nonlinear systems based on the Lyapunov approach. J. Process Control. 2001, 11, 1–10. [Google Scholar] [CrossRef]
- Xiong, A.; Fan, Y. Application of a PID Controller using MRAC Techniques for Control of the DC Electromotor Drive. In Proceedings of the 2007 International Conference on Mechatronics and Automation, Harbin, China, 5–9 August 2007; pp. 2616–2621. [Google Scholar] [CrossRef]
- Sahputro, S.D.; Fadilah, F.; Wicaksono, N.A.; Yusivar, F. Design and implementation of adaptive PID controller for speed control of DC motor. In Proceedings of the 2017 15th International Conference on Quality in Research (QiR): International Symposium on Electrical and Computer Engineering, Nusa Dua, Bali, Indonesia, 24–27 July 2017; pp. 179–183. [Google Scholar] [CrossRef]
- Rothe, J.; Zevering, J.; Strohmeier, M.; Montenegro, S. A Modified Model Reference Adaptive Controller (M-MRAC) Using an Updated MIT-Rule for the Altitude of a UAV. Electronics 2020, 9, 1104. [Google Scholar] [CrossRef]
- Mareels, I.M.Y.; Anderson, B.D.O.; Bitmead, R.R.; Bodson, M.; Sastry, S.S. Revisiting the MIT Rule for Adaptive Control. In IFAC Workshop Series, Adaptive Systems in Control and Signal Processing 1986; Åström, K.J., Wittenmark, B., Eds.; Pergamon: Oxford, UK, 1987; pp. 161–166. ISBN 9780080340852. [Google Scholar] [CrossRef]
- Hanna, Y.; Khater, A.; El-Nagar, A.; El Bardini, M. Polynomial Recurrent Neural Network-Based Adaptive PID Controller with Stable Learning Algorithm. Neural Process. Lett. 2022, 55, 1–26. [Google Scholar] [CrossRef]
- Uçak, K.; Arslantürk, B. Adaptive MIMO fuzzy PID controller based on peak observer. Int. J. Optim. Control. Theor. Appl. (IJOCTA) 2023, 13, 139–150. [Google Scholar] [CrossRef]
- Zhang, X.; Xu, X.; Xu, X.; Hou, P.; Gao, H.; Ma, F. Intelligent Adaptive PID Control for the Shaft Speed of a Marine Electric Propulsion System Based on the Evidential Reasoning Rule. Mathematics 2023, 11, 1145. [Google Scholar] [CrossRef]
- Maaloul, B.; Elloumi, S. Adaptive PID Controller of a Quadrotor. In Proceedings of the 2023 IEEE International Conference on Advanced Systems and Emergent Technologies (IC_ASET), Hammamet, Tunisia, 29 April–1 May 2023; pp. 1–6. [Google Scholar] [CrossRef]
- Gai, H.; Li, X.; Jiao, F.; Cheng, X.; Yang, X.; Zheng, G. Application of a New Model Reference Adaptive Control Based on PID Control in CNC Machine Tools. Machines 2021, 9, 274. [Google Scholar] [CrossRef]
- Joshi, G.; Chowdhary, G. Deep Model Reference Adaptive Control. In Proceedings of the 2019 IEEE 58th Conference on Decision and Control (CDC), Nice, France, 11–13 December 2019; pp. 4601–4608. [Google Scholar] [CrossRef]
- Huo, D.; Dai, L.; Chai, R.; Xue, R.; Xia, Y. Collision-Free Model Predictive Trajectory Tracking Control for UAVs in Obstacle Environment. IEEE Trans. Aerosp. Electron. Syst. 2023, 59, 1–15. [Google Scholar] [CrossRef]
- Pham, D.-A.; Han, S.-H. Design of Combined Neural Network and Fuzzy Logic Controller for Marine Rescue Drone Trajectory-Tracking. J. Mar. Sci. Eng. 2022, 10, 1716. [Google Scholar] [CrossRef]
- Jang, J.-S.R. ANFIS: Adaptive-Network-Based Fuzzy Inference System. IEEE Trans. Syst. Man Cybern. 1993, 23, 665–685. [Google Scholar] [CrossRef]
- Noordin, A.; Mohd Basri, M.A.; Mohamed, Z. Adaptive PID Control via Sliding Mode for Position Tracking of Quadrotor MAV: Simulation and Real-Time Experiment Evaluation. Aerospace 2023, 10, 512. [Google Scholar] [CrossRef]
- Noordin, A.; Mohd Basri, M.A.; Mohamed, Z. Real-Time Implementation of an Adaptive PID Controller for the Quadrotor MAV Embedded Flight Control System. Aerospace 2023, 10, 59. [Google Scholar] [CrossRef]
- Xiao, M.; Liang, J.; Ji, L.; Sun, Z.; Li, Z. Aerial photography trajectory-tracking controller design for quadrotor UAV. Meas. Control. 2022, 55, 738–745. [Google Scholar] [CrossRef]
- Zhao, Z.; Cao, D.; Yang, J.; Wang, H. High-order sliding mode observer-based trajectory tracking control for a quadrotor UAV with uncertain dynamics. Nonlinear Dyn. 2020, 100, 1–20. [Google Scholar] [CrossRef]
- Mechali, O.; Xu, L.; Xie, X.; Iqbal, J. Fixed-time nonlinear homogeneous sliding mode approach for robust tracking control of multirotor aircraft: Experimental validation. J. Frankl. Inst. 2022, 359, 1971–2029. [Google Scholar] [CrossRef]
- Burdet, E.; Ganesh, G.; Yang, C.; Albu-Schäffer, A. Interaction Force, Impedance and Trajectory Adaptation: By Humans, for Robots. In Experimental Robotics: The 12th International Symposium on Experimental Robotics; Khatib, O., Kumar, V., Sukhatme, G., Eds.; Springer: Berlin/Heidelberg, Germany, 2014; pp. 331–345. [Google Scholar] [CrossRef]
- Hogan, N. On the stability of manipulators performing contact tasks. IEEE J. Robot. Autom. 1988, 4, 677–686. [Google Scholar] [CrossRef]
- Xiong, X.; Fang, C. An Online Impedance Adaptation Controller for Decoding Skill Intelligence. Biomim. Intell. Robot. 2023, 3, 100100. [Google Scholar] [CrossRef]
- Xiong, X.; Manoonpong, P. Adaptive Motor Control for Human-like Spatial-temporal Adaptation. In Proceedings of the 2018 IEEE International Conference on Robotics and Biomimetics (ROBIO), Kuala Lumpur, Malaysia, 12–15 December 2018; pp. 2107–2112. [Google Scholar] [CrossRef]
- Xiong, X.; Nah, M.C.; Krotov, A.; Sternad, D. Online Impedance Adaptation Facilitates Manipulating a Whip. In Proceedings of the 2021 IEEE/RSJ International Conference on Intelligent Robots and Systems (IROS), Prague, Czech Republic, 27 September–1 October 2021; pp. 9297–9302. [Google Scholar] [CrossRef]
- Xiong, X.; Manoonpong, P. Online sensorimotor learning and adaptation for inverse dynamics control. Neural Netw. 2021, 143, 525–536. [Google Scholar] [CrossRef]
- Kyriakopoulos, K.J.; Saridis, G.N. Minimum jerk path generation. In Proceedings of the 1988 IEEE International Conference on Robotics and Automation, Philadelphia, PA, USA, 24–29 April 1988; Volume 1, pp. 364–369. [Google Scholar] [CrossRef]
- Vinceslas, M. AV-Autonomous-Control. Available online: https://github.com/Mdhvince/UAV-Autonomous-control/tree/master?tab=readme-ov-file (accessed on 3 May 2023).
- Coppelia Robotics. 2023. Available online: https://www.coppeliarobotics.com/ (accessed on 10 October 2023).
- Open Source Robotics Foundation. ROS 2 Humble Hawksbill. 2022. Available online: https://docs.ros.org/en/humble/index.html (accessed on 10 October 2023).
- Ren, J.; Miller, H.; Feigh, K.M.; Coogan, S.; Zhao, Y. LTL-D*: Incrementally Optimal Replanning for Feasible and Infeasible Tasks in Linear Temporal Logic Specifications. arXiv 2024. [Google Scholar] [CrossRef]
- Iqbal, U.; Samad, A.; Nissa, Z.; Iqbal, J. Embedded control system for AUTAREP—A novel autonomous articulated robotic educational platform. Tehnički Vjesnik 2014, 21, 1255–1261. Available online: https://www.researchgate.net/publication/280641667_Embedded_control_system_for_AUTAREP_-_A_novel_AUTonomous_Articulated_Robotic_Educational_Platform (accessed on 8 November 2024).
- Li, X.; Qi, G.; Guo, X.; Chen, Z.; Zhao, X. Improved high order differential feedback control of quadrotor UAV based on improved extended state observer. J. Frankl. Inst. 2022, 359, 4233–4259. [Google Scholar] [CrossRef]
- Yang, G.; Yao, J. Multilayer neurocontrol of high-order uncertain nonlinear systems with active disturbance rejection. Int. J. Robust Nonlinear Control. 2024, 34, 2972–2987. [Google Scholar] [CrossRef]
- Tee, K.P.; Franklin, D.; Kawato, M.; Milner, T.; Burdet, E. Concurrent adaptation of force and impedance in the redundant muscle system. Biol. Cybern. 2009, 102, 31–44. [Google Scholar] [CrossRef] [PubMed]
Disclaimer/Publisher’s Note: The statements, opinions and data contained in all publications are solely those of the individual author(s) and contributor(s) and not of MDPI and/or the editor(s). MDPI and/or the editor(s) disclaim responsibility for any injury to people or property resulting from any ideas, methods, instructions or products referred to in the content. |
© 2024 by the authors. Licensee MDPI, Basel, Switzerland. This article is an open access article distributed under the terms and conditions of the Creative Commons Attribution (CC BY) license (https://creativecommons.org/licenses/by/4.0/).