Abstract
This article proposes a progressive frequency domain-guided depth model with adaptive preprocessing to solve the problem of defect detection with weak features based on X-ray images. In distinct intuitive surface defect detection tasks, non-destructive testing of castings using X-rays presents more complex and weak defect features, leading to lower accuracy and insufficient robustness on the part of current casting defect detection methods. To address these challenges, the proposed method establishes four specialized mechanisms to improve model accuracy. First, an adaptive image contrast enhancement method is proposed to enhance the features of defects in casting images to promote subsequent feature extraction and prediction. Second, a subtle clue mining module based on frequency domain attention is proposed to fully extract the discriminative features of casting defects. Third, a feature refinement module based on progressive learning is proposed to achieve a balance between feature resolution and semantic information. Finally, a refined deep regression supervision mechanism is designed to improve defect detection accuracy under strict intersection-to-union ratio standards. We established extensive ablation studies using casting defect images in GDXray, conducted detailed comparative experiments with other methods, and performed experiments to analyze the robustness of the resulting models. Compared with other X-ray defect detection methods, our framework achieves an average +4.6 AP. Compared to the baseline, our proposed refined deep regression supervision mechanism results in an improvement of 5.3 AP.
1. Introduction
Castings are widely used in large-scale manufacturing systems such as aerospace, automotive processing, and special equipment systems [1,2,3]. Due to the complexity of the casting process, various shapes of defects are inevitably generated during the production and processing of castings. When these defects occur inside the castings, traditional surface defect detection techniques are not able to identify them [4,5]. X-ray technology, as an effective non-destructive testing method, can be used to detect defects inside metal structures. In the actual non-destructive testing process, the most commonly used technique is digital X-ray direct imaging (DR), which can directly present the contour and internal effects of castings in digital images. In [6], an improved aluminum casting was proposed that enables clearer X-ray imaging with higher spatial resolution and better signal-to-noise ratio in a novel method. In [7], an X-ray-based tomography (CT) method was proposed for non-destructive testing analysis while integrating key attributes such as defect detection and wall thickness information. In [8], a typical real-time image acquisition method was proposed that can clearly capture the internal effects of the workpiece. In [9], a careful evaluation of the effectiveness of the CT ray method in non-destructive testing was proposed and a detailed comparison and description were presented to demonstrate the advantages of the X-ray method in the quality assessment process. The above methods have made significant progress in X-ray imaging systems. However, in terms of defect assessment, the current quality inspection methods mainly rely on manual expert experience for manual evaluation. Furthermore, using a large number of manual experts to carefully observe casting images in front of a computer for a long time is laborious and inefficient [10,11,12,13]. In addition, due to the extremely subtle features of defects in X-ray images, prolonged human gaze at the monitor can impose a significant burden on vision. Therefore, designing an automatic defect detection method based on DR technology is particularly necessary to improve the efficiency of defect detection [14,15].
Computer vision technology is a comprehensive discipline that combines image acquisition and analysis; it is widely used in intelligent industrial vision systems. In recent years, influenced by the powerful feature expression tools and end-to-end technological advantages available under the deep learning paradigm, the vast majority of work has shifted from traditional manual features to deep neural networks such as convolutions or transformers [16,17,18,19,20]. In addition, considering the real-time and lightweight nature of industrial systems, unlike the mainstream transformer paradigm in natural scenarios, most detection methods currently rely mainly on fully convolutional neural networks (FCNN) [21,22,23]. Furthermore, universal object detection frameworks based on FCNN, such as YOLO, provide a strong baseline, making it possible to achieve DR casting defect detection based on end-to-end frameworks [24,25,26].
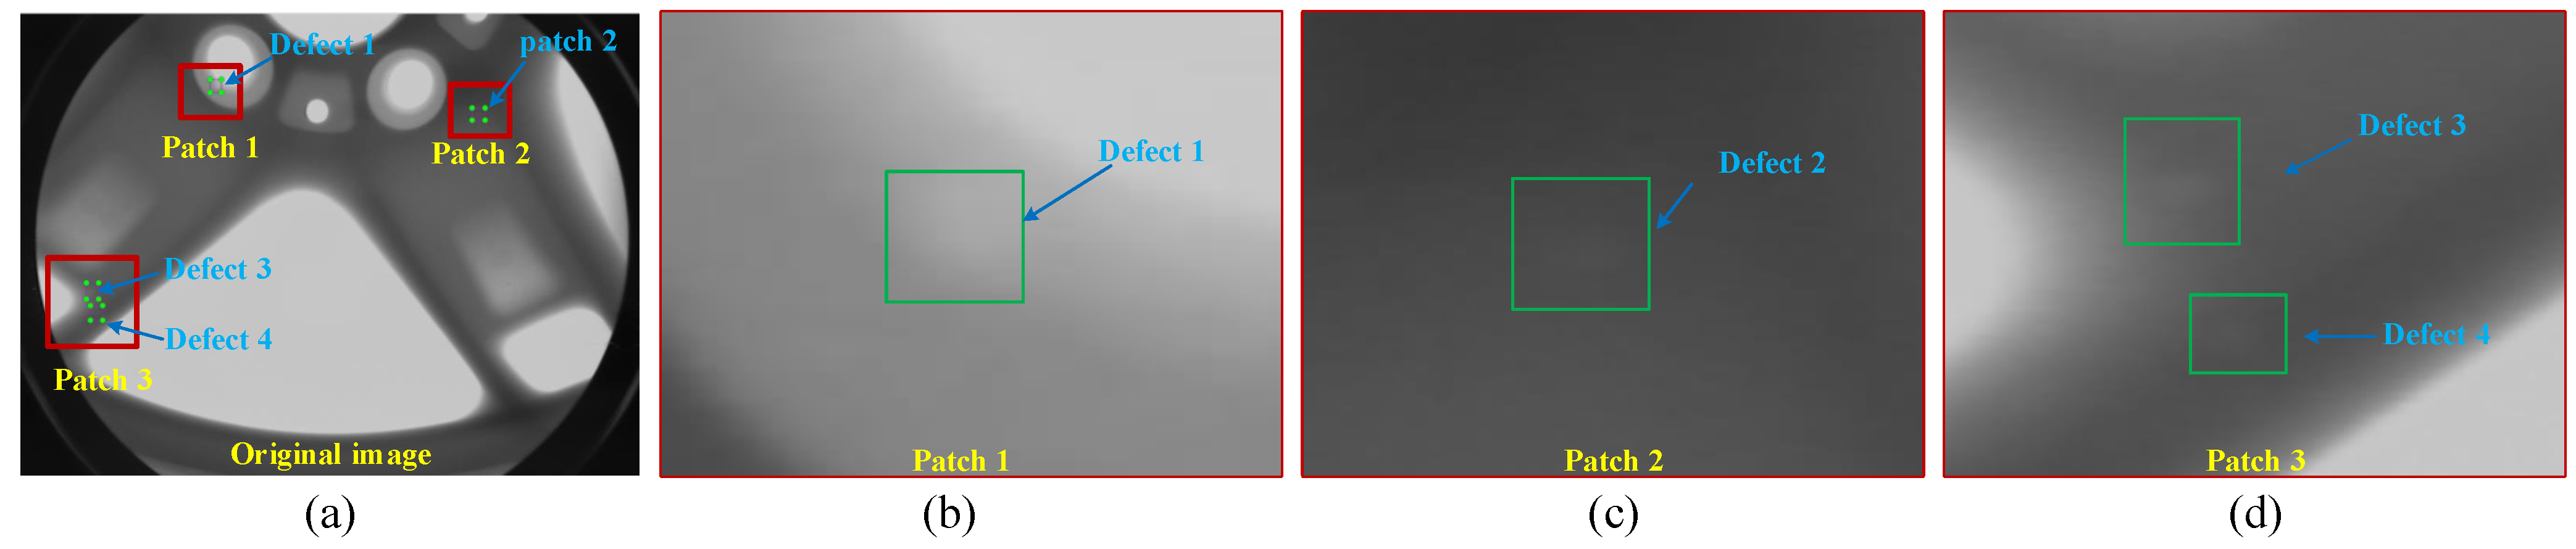
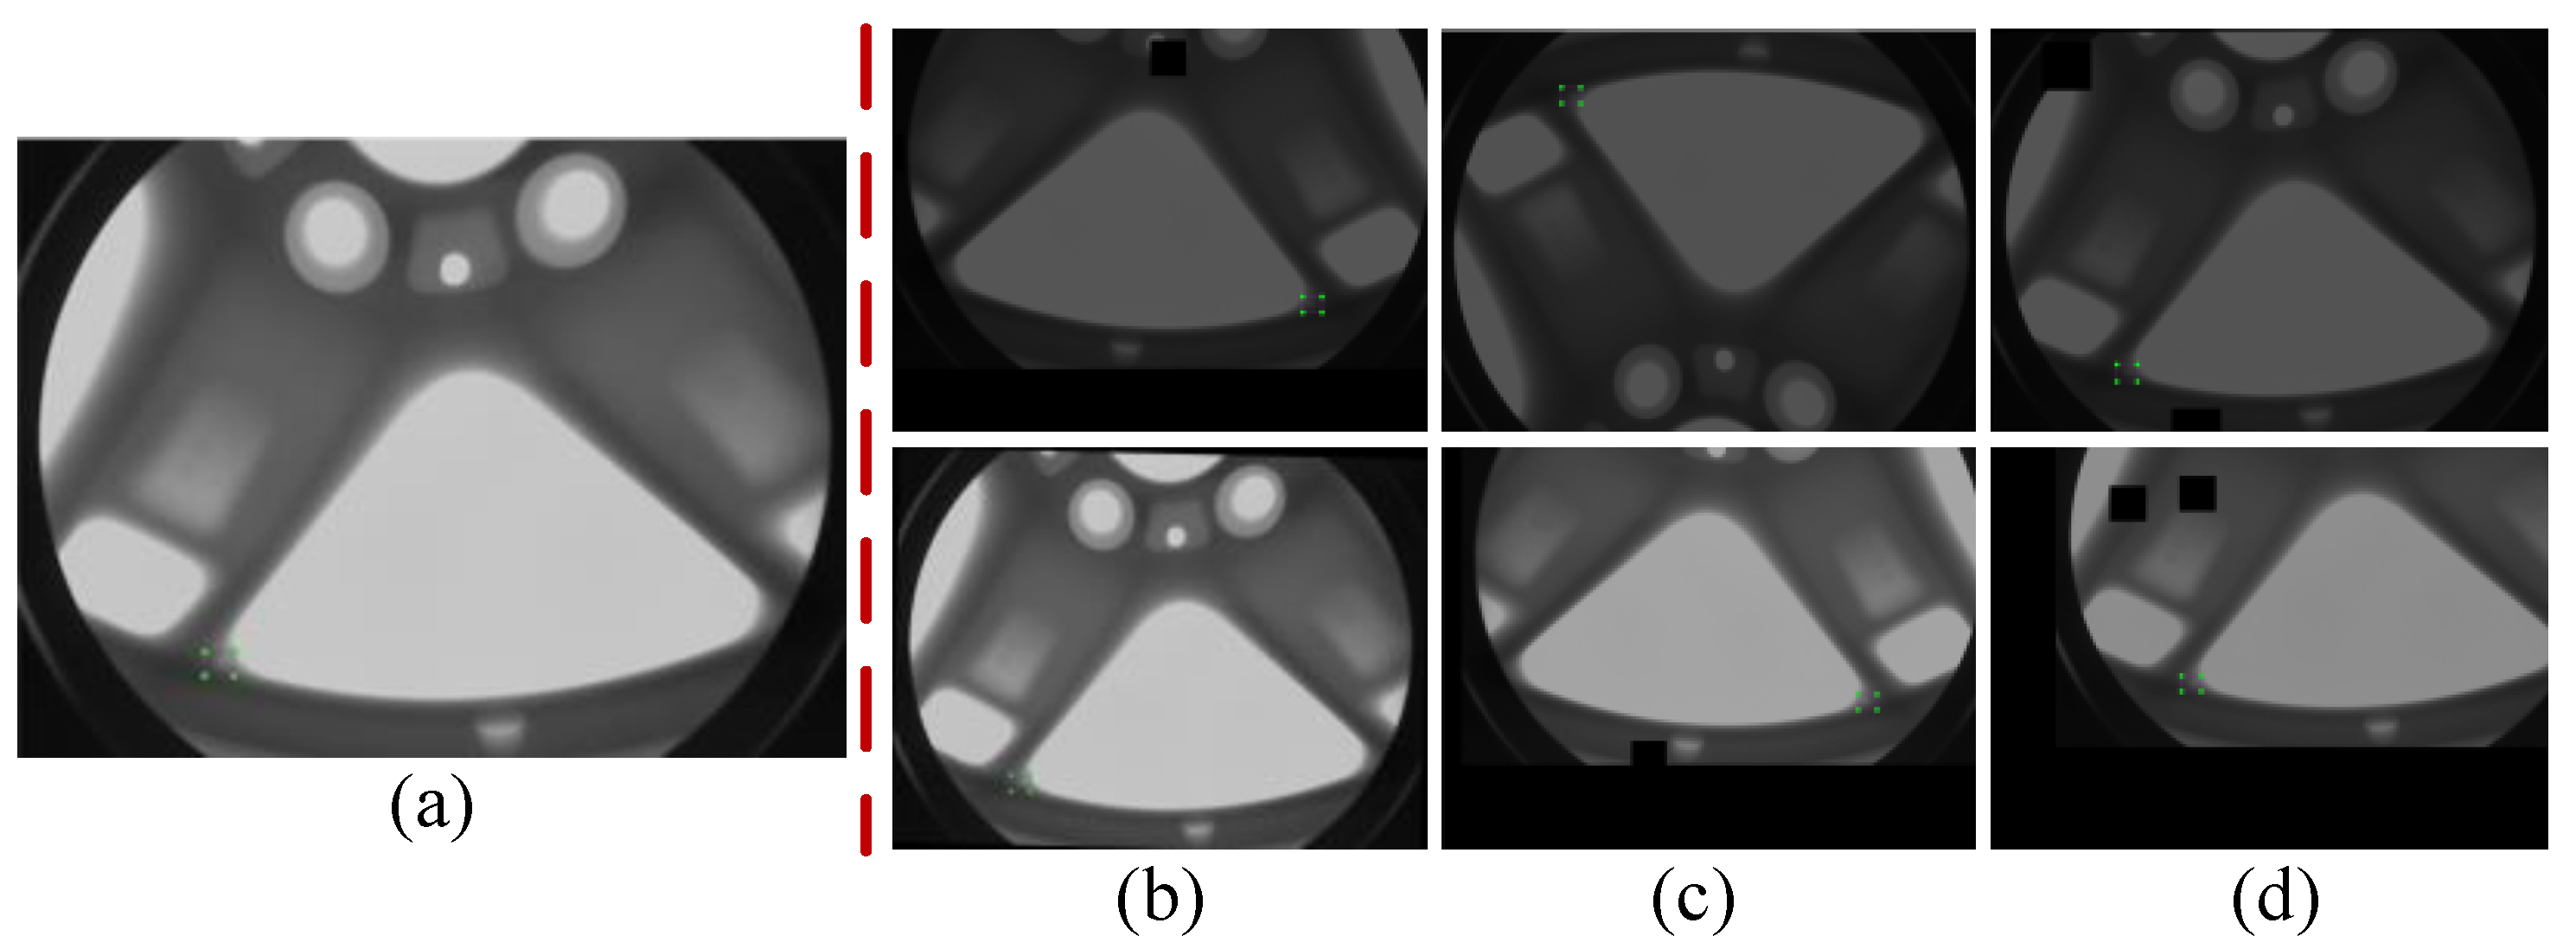
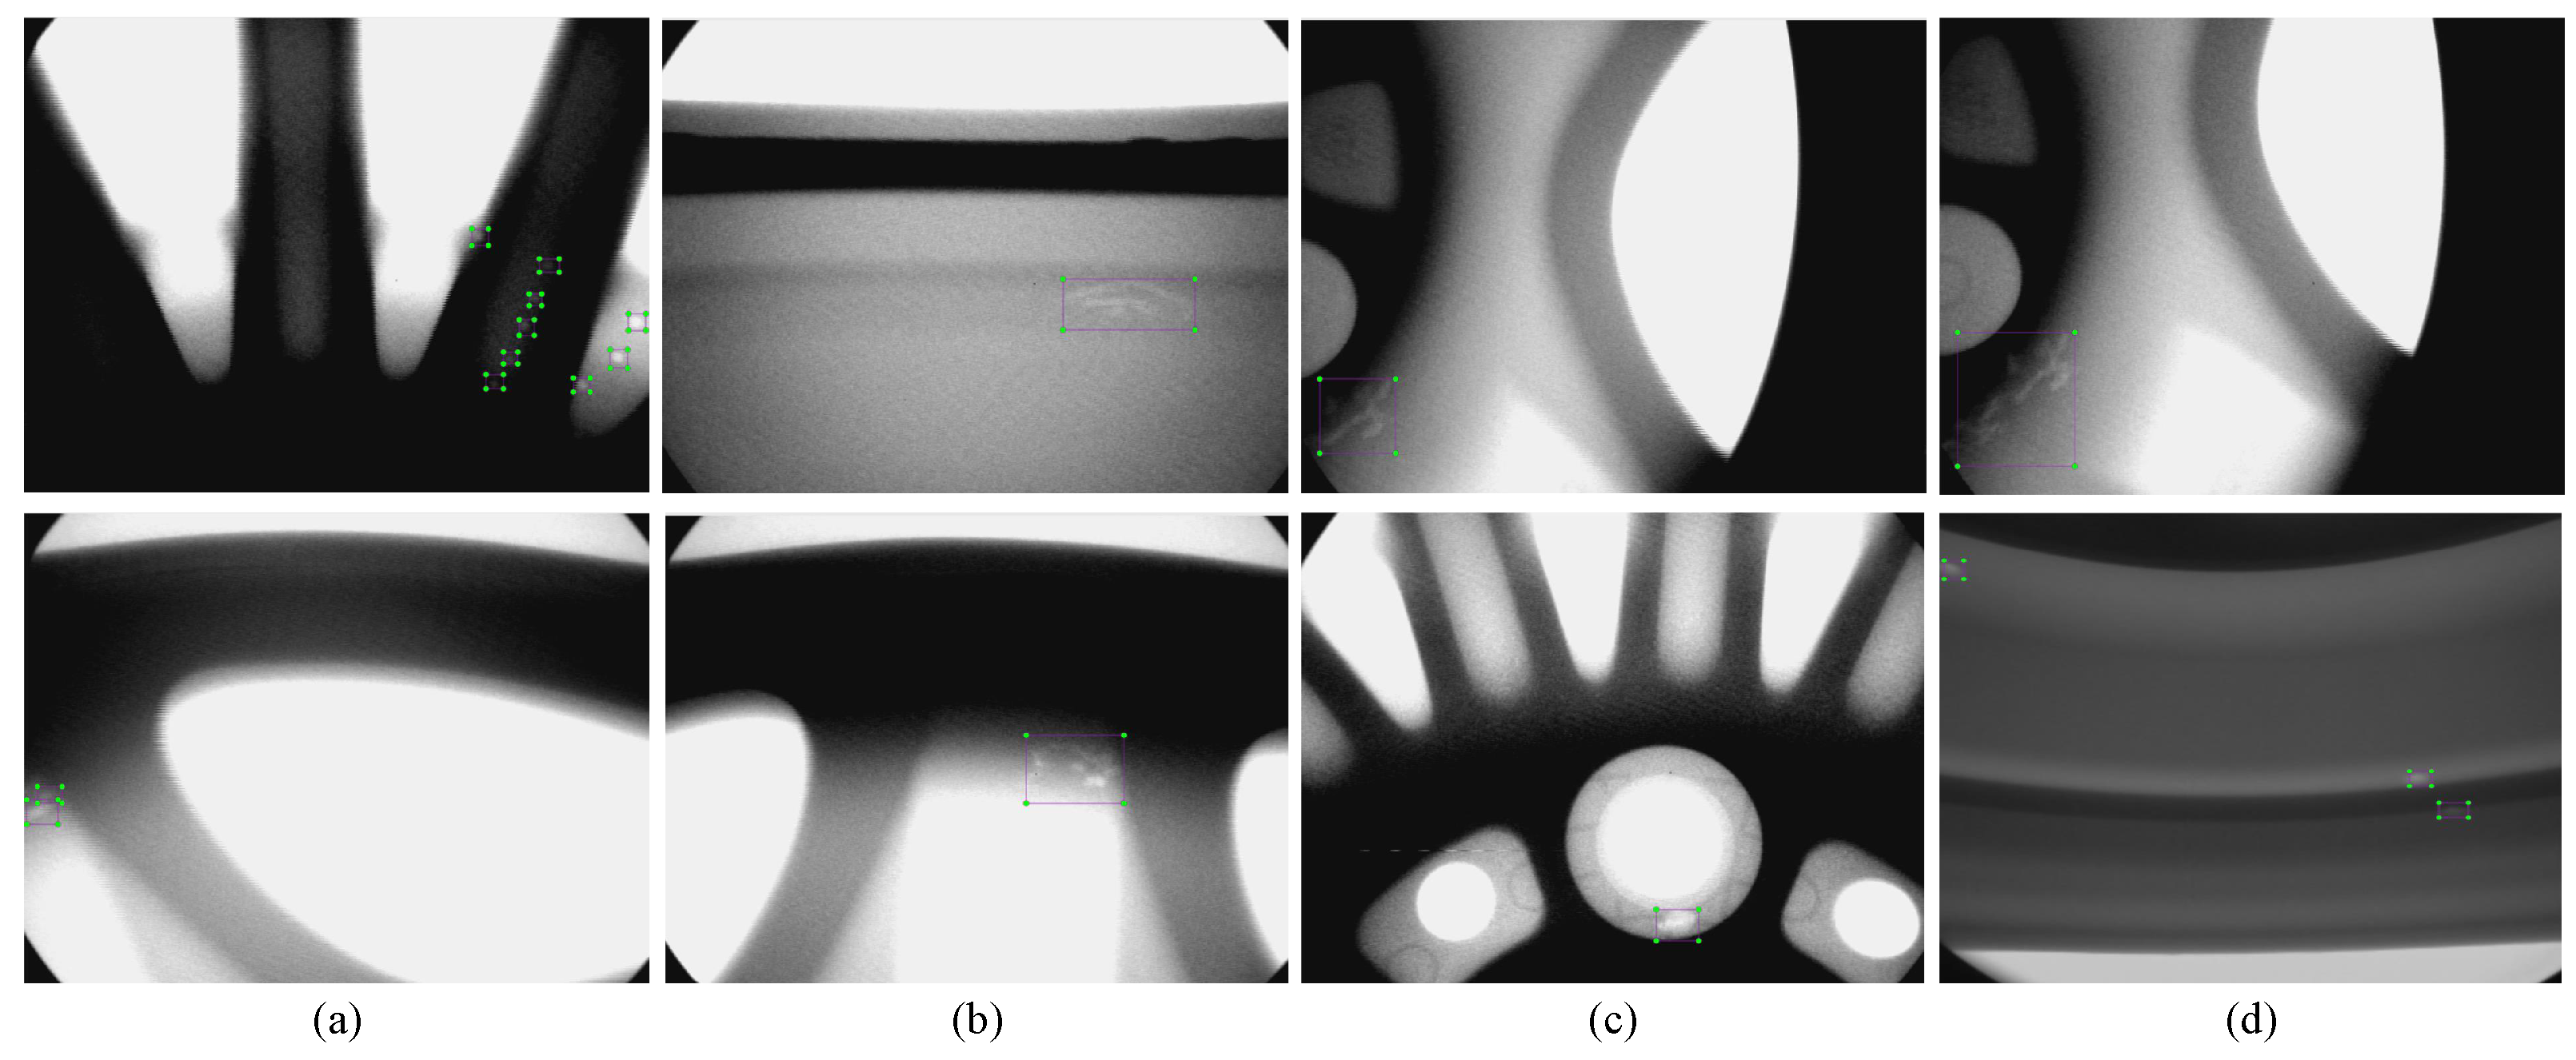
At present, object detection methods based on the YOLO series have made breakthrough progress in surface defect detection tasks for products such as strip steel, PCB boards, and ceramic tiles [27,28,29]. However, non-destructive casting defect detection based on X-ray images is more challenging compared to surface defect detection tasks. The reason for this is that automatic detection of surface defects usually relies on industrial cameras to collect surface information on the inspected workpiece, which is usually more direct and has clearer imaging. In contrast, non-destructive testing based on X-ray technologies is closely related to the thickness, appearance, and material of the workpiece, which leads to subtle and variable defects in digital images. The resulting casting defect features are extremely weak, posing a serious challenge to automatic defect detection methods. Figure 1 shows an example of defect areas in a casting image. In this image, it can be observed that the extremely small features in the defect area are very similar to the background of the casting. Therefore, it is urgently necessary to find a method for extracting discriminative clues from X-ray images with weak defect features in order to achieve high-precision automatic casting defect detection.
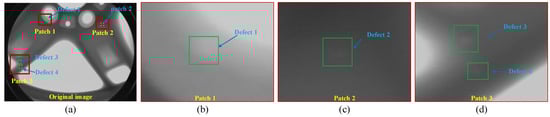
Figure 1.
Casting defect features based on X-ray images: (a) original image of casting defects; (b–d) show three sets of defect examples from different defect areas.
Recently, attention-based methods have received widespread attention, leading to the possibility of improving the generalization performance of model inference by learning the diversity of training datasets [30]. In this process, attention weights can be learned from diverse input data, and the resulting models usually have advantages over convolutional structures based on fixed weights [31,32]. Furthermore, a number of excellent studies have introduced mechanisms such as spatial attention to improve the accuracy of casting defect detection [30,33]. These methods have made breakthrough progress in achieving region-level detection tasks using only image-level labels. However, the vast majority of attention methods rely on global average pooling and other operations to calculate the global feature representation, which is insufficient and prone to information loss. In this paper, we take inspiration from the frequency characteristics of image features to further expand attention from low-frequency features to the full frequency space, which can help to further capture the features of the region of interest. In addition, we establish a feature refinement mechanism based on progressive learning and a deep regression supervision mechanism to further refine and guide the extraction of frequency features [34,35]. We have verified the effectiveness of this method in experiments; the specific contributions are as follows:
- A highly effective casting defect detection method based on DR images, providing a strong baseline for non-destructive testing of industrial castings and greatly alleviating the problem of low detection accuracy for weak defects.
- We carefully establish four specialized components: adaptive preprocessing, subtle clue mining based on frequency-domain attention, feature refinement based on progressive learning, and a deep regression supervision mechanism for refinement. These modules are interrelated, and work together to improve the overall performance of the model.
- We have carried out a large number of experiments, including ablation studies, comparisons with other methods, and image parameter analysis to establish and demonstrate the effectiveness of the proposed method.
2. Related Work
2.1. Automatic Defect Detection Methods
Automatic defect detection methods play a crucial role in the field of industrial quality monitoring. Early methods typically utilized manual prior knowledge and shallow machine learning techniques to achieve rough defect recognition. In [16], the Otsu method, which applies the local pixel unevenness factor (LPIF) to reduce noise and improve contrast, was introduced to extract the weld area. In [36], adaptive Wiener filtering and a Gaussian low-pass filter were used to further enhance the X-ray contrast. In terms of pattern recognition, Ref. [17] designed a Support Vector Machine (SVM)-based classification system using gray contour analysis. In [18], the Multilayer Perceptron (MLP) technique was applied to the design of a defect classification system, achieving an accuracy of 88.6%.
With the development of end-to-end object detection technology, the YOLO architecture has attracted widespread attention from the industrial detection community. In [20], an efficient casting defect detection method based on YOLOv5 was proposed to achieve intelligent detection of casting defects based on X-ray images. In [21], a multi-scale prediction method based on deformable convolution was proposed to achieve multi-scale information exchange, achieving advantageous results. In [22], an adaptive receptive field mechanism was proposed for casting defect recognition based on X-ray images. In [23], a cascaded prediction method was proposed to achieve accurate defect detection of wheel hubs while meeting real-time requirements.
2.2. Attention Mechanisms in Casting Defect Detection
Humans rely on attention to focus on observing targets in areas of interest when identifying related areas. Inspired by biological vision systems and brain science, attention mechanisms have been found to be particularly suitable for casting defect detection tasks involving subtle defect features. Many excellent works have recently been dedicated to designing reliable attention mechanisms in order to identify casting defects in X-ray images, leading to significant breakthroughs being made. In [31], an efficient deep network model based on target-level attention was proposed, utilizing image-level labels for instance-level prediction using subtle features. In [32], a novel network model with spatial attention and bilinear pooling was proposed to improve the feature representation ability of CNNs. In [30], a novel self-attention mechanism was embedded into the network model to improve the network’s ability to detect weak defects in complex X-ray backgrounds. In order to improve the diversity of the casting dataset, an attention-guided data augmentation method was proposed in [33] to effectively improve the generalization performance of a casting defect detection model. However, most of the above methods use global average pooling to generate global feature representations when using attention, which is insufficient and can easily lead to the loss of attention information. Here, we aim to expand global average pooling attention to a wider frequency domain and to further refine defect detection results in the form of progressive fusion.
3. Methodology
3.1. System Overview
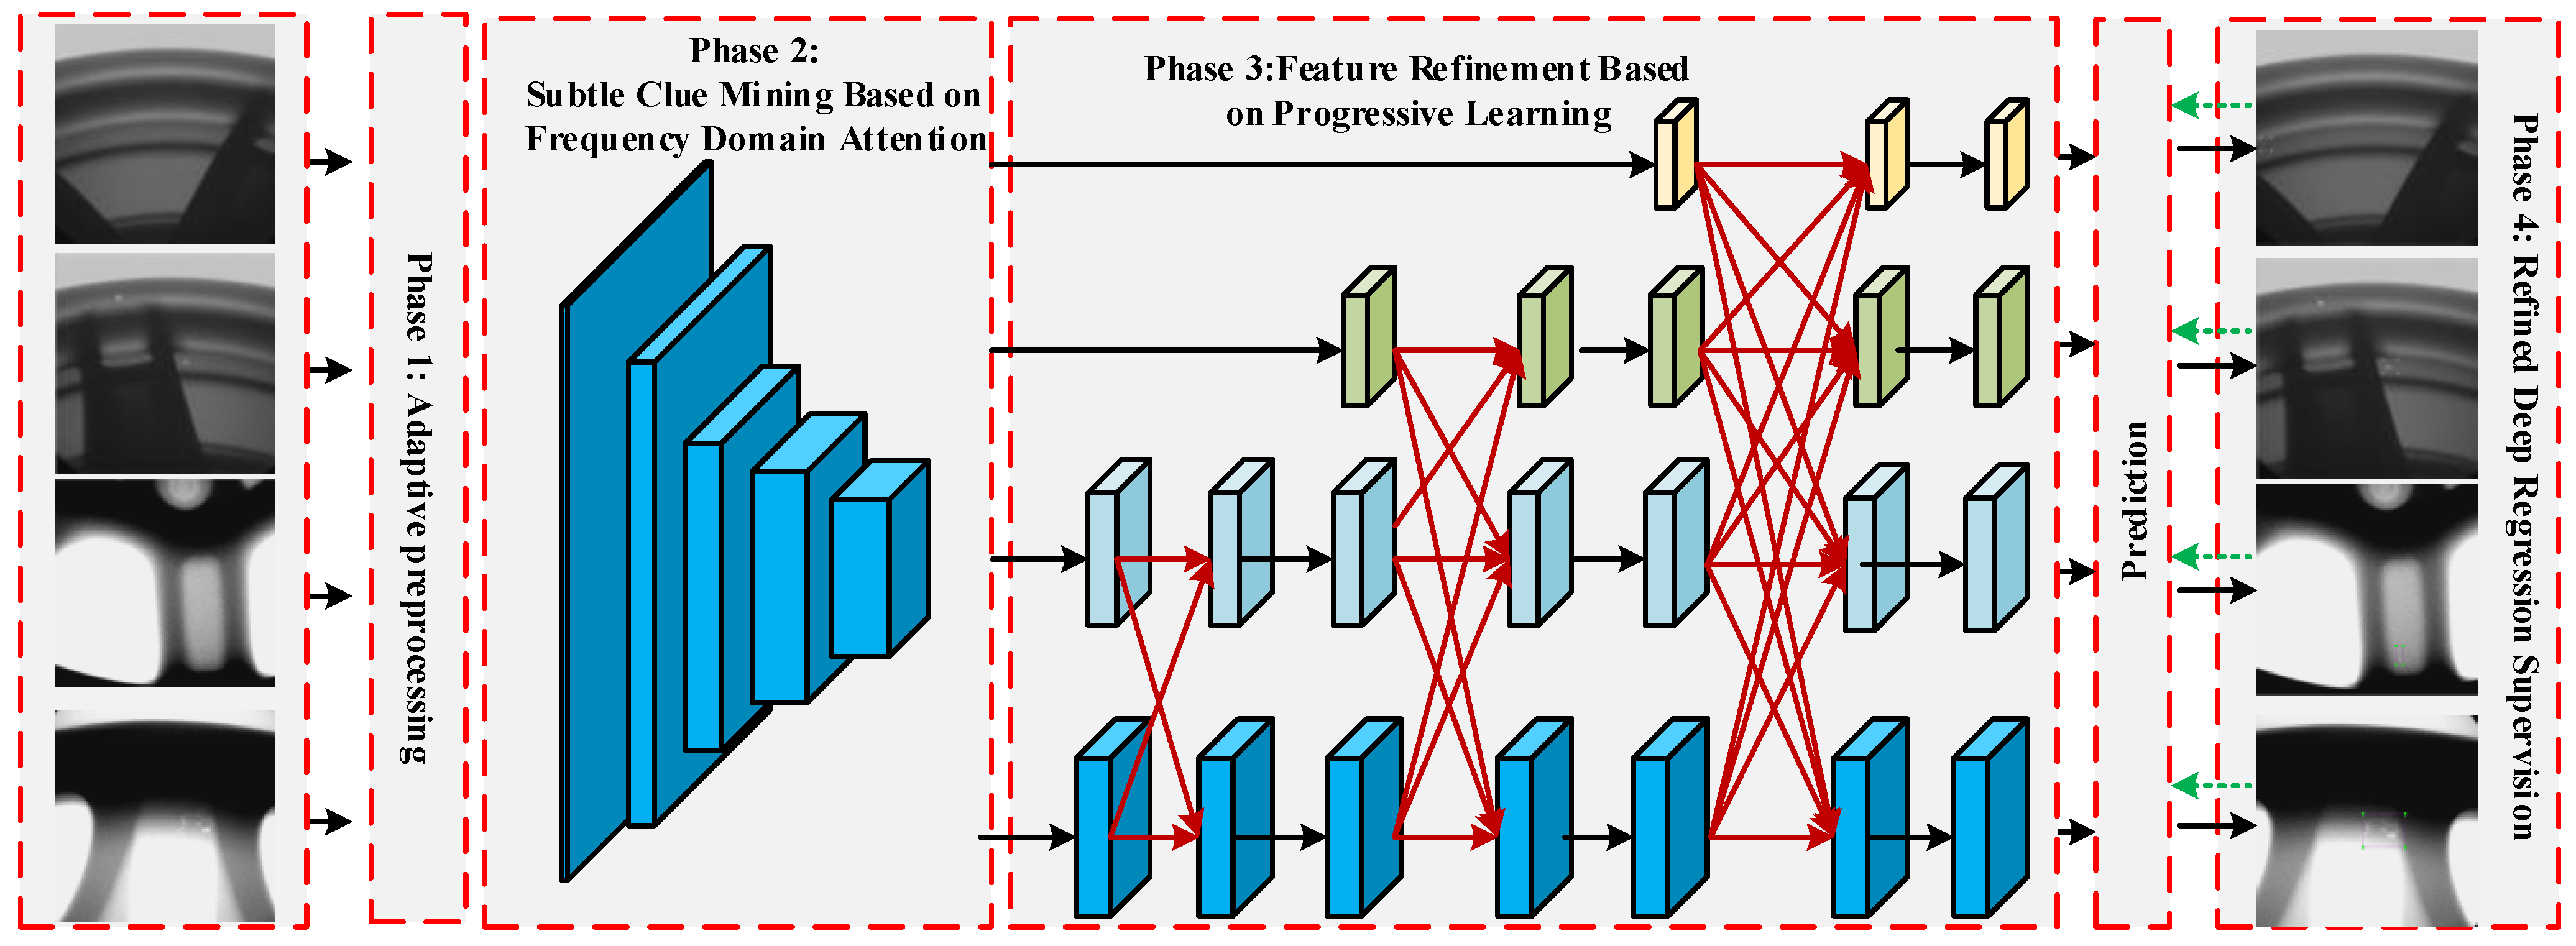
Figure 2 shows the overall framework of the proposed method. Specifically, we establish four key stages for the casting defect detection task. First, we establish an adaptive preprocessing method to fully highlight defect features by adaptively enhancing the contrast of the original casting image. Second, a subtle clue mining module based on frequency domain attention is designed to extract casting features with discriminative properties, ensuring that weak defect details are effectively utilized. Then, a feature refinement module based on progressive learning is designed to fully connect multi-level semantic and resolution information in a gradual and progressive manner to avoid information conflicts during the fusion process. Finally, a refined deep regression supervision mechanism is established to constrain the bounding boxes in the regression process, ensuring the fast convergence and stability of the network.
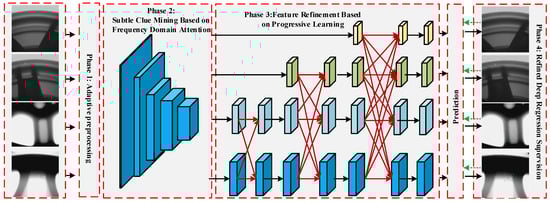
Figure 2.
The proposed method framework. First, the original image is sent to stage 1 to enhance defect features. Next, the casting image with defect instance-level annotations is sent to stage 2 to extract key features with discriminative characteristics. Then, based on stage 3, progressive feature fusion and utilization are completed and multi-level prediction is achieved. Finally, the overall network parameters are optimized through detailed deep supervision in stage 4. In the inference stage, the accurate pixel positions of the casting defects are obtained.
3.2. Adaptive Preprocessing
Adaptive contrast enhancement methods are usually used to process image pixels to enhance image details based on spatial domain filtering. For a pixel in an image in the local window with the size of , the local mean and local variance of the point are calculated according to Equations (1) and (2):
where the local mean can be regarded as the background part of the image. Then, the detail part is calculated according to the difference between the original image and the background part, with the background image and the difference reconstructed to obtain the optimized ACE image according to Equation (3):
where M is the global mean, a is the coefficient parameter , the local standard deviation is introduced into the gain function , and reflects the uniformity of the pixel value distribution in the window while controlling the change of the gain function, which ensures that the contrast of the defective image is improved adaptively.
The generalization ability of current deep learning models usually depends on the diversity and richness of the training samples. To this end, we have established a powerful data augmentation method. We fully considered enhancement methods such as brightness, contrast, translation, scaling, and patching that can be used in the actual detection process and potential testing scenarios encountered. At the same time, we applied the same treatment for the labels. The specific transformation image is shown in Figure 3.
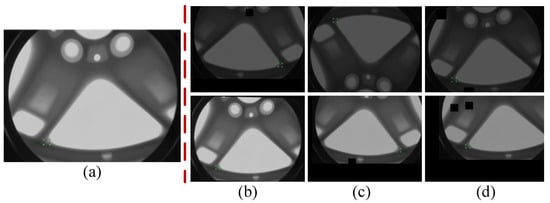
Figure 3.
Example of casting defect data augmentation: (a) the original casting image. (b) brightness-adjusted image, and (c,d) example of occluded image generalization.
3.3. Subtle Clue Mining Based on Frequency Domain Attention
Because internal casting defects are usually very small compared to the entire casting, the detailed features of defects usually exhibit very subtle features when viewed through X-ray imaging. Therefore, in order to improve the accuracy of casting defect detection based on X-ray images, we sought to design a powerful mechanism for mining subtle clues based on frequency domain attention to improve the weak defect feature representation ability. The key features extracted by this powerful feature extraction network have a significant impact on the subsequent progressive feature fusion and deep supervision mechanism.
Specifically, the backbone network is divided into five stages to extract multi-level features of casting defect images. We injected a frequency domain-aware clue mining mechanism based on the classic CSPBlock to gradually obtain a series of semantic information , containing low-level textures and abstractions. These discriminative features are then used as the input in the next step for progressive fusion and utilization. In the following section, we specifically introduce the frequency attention block.
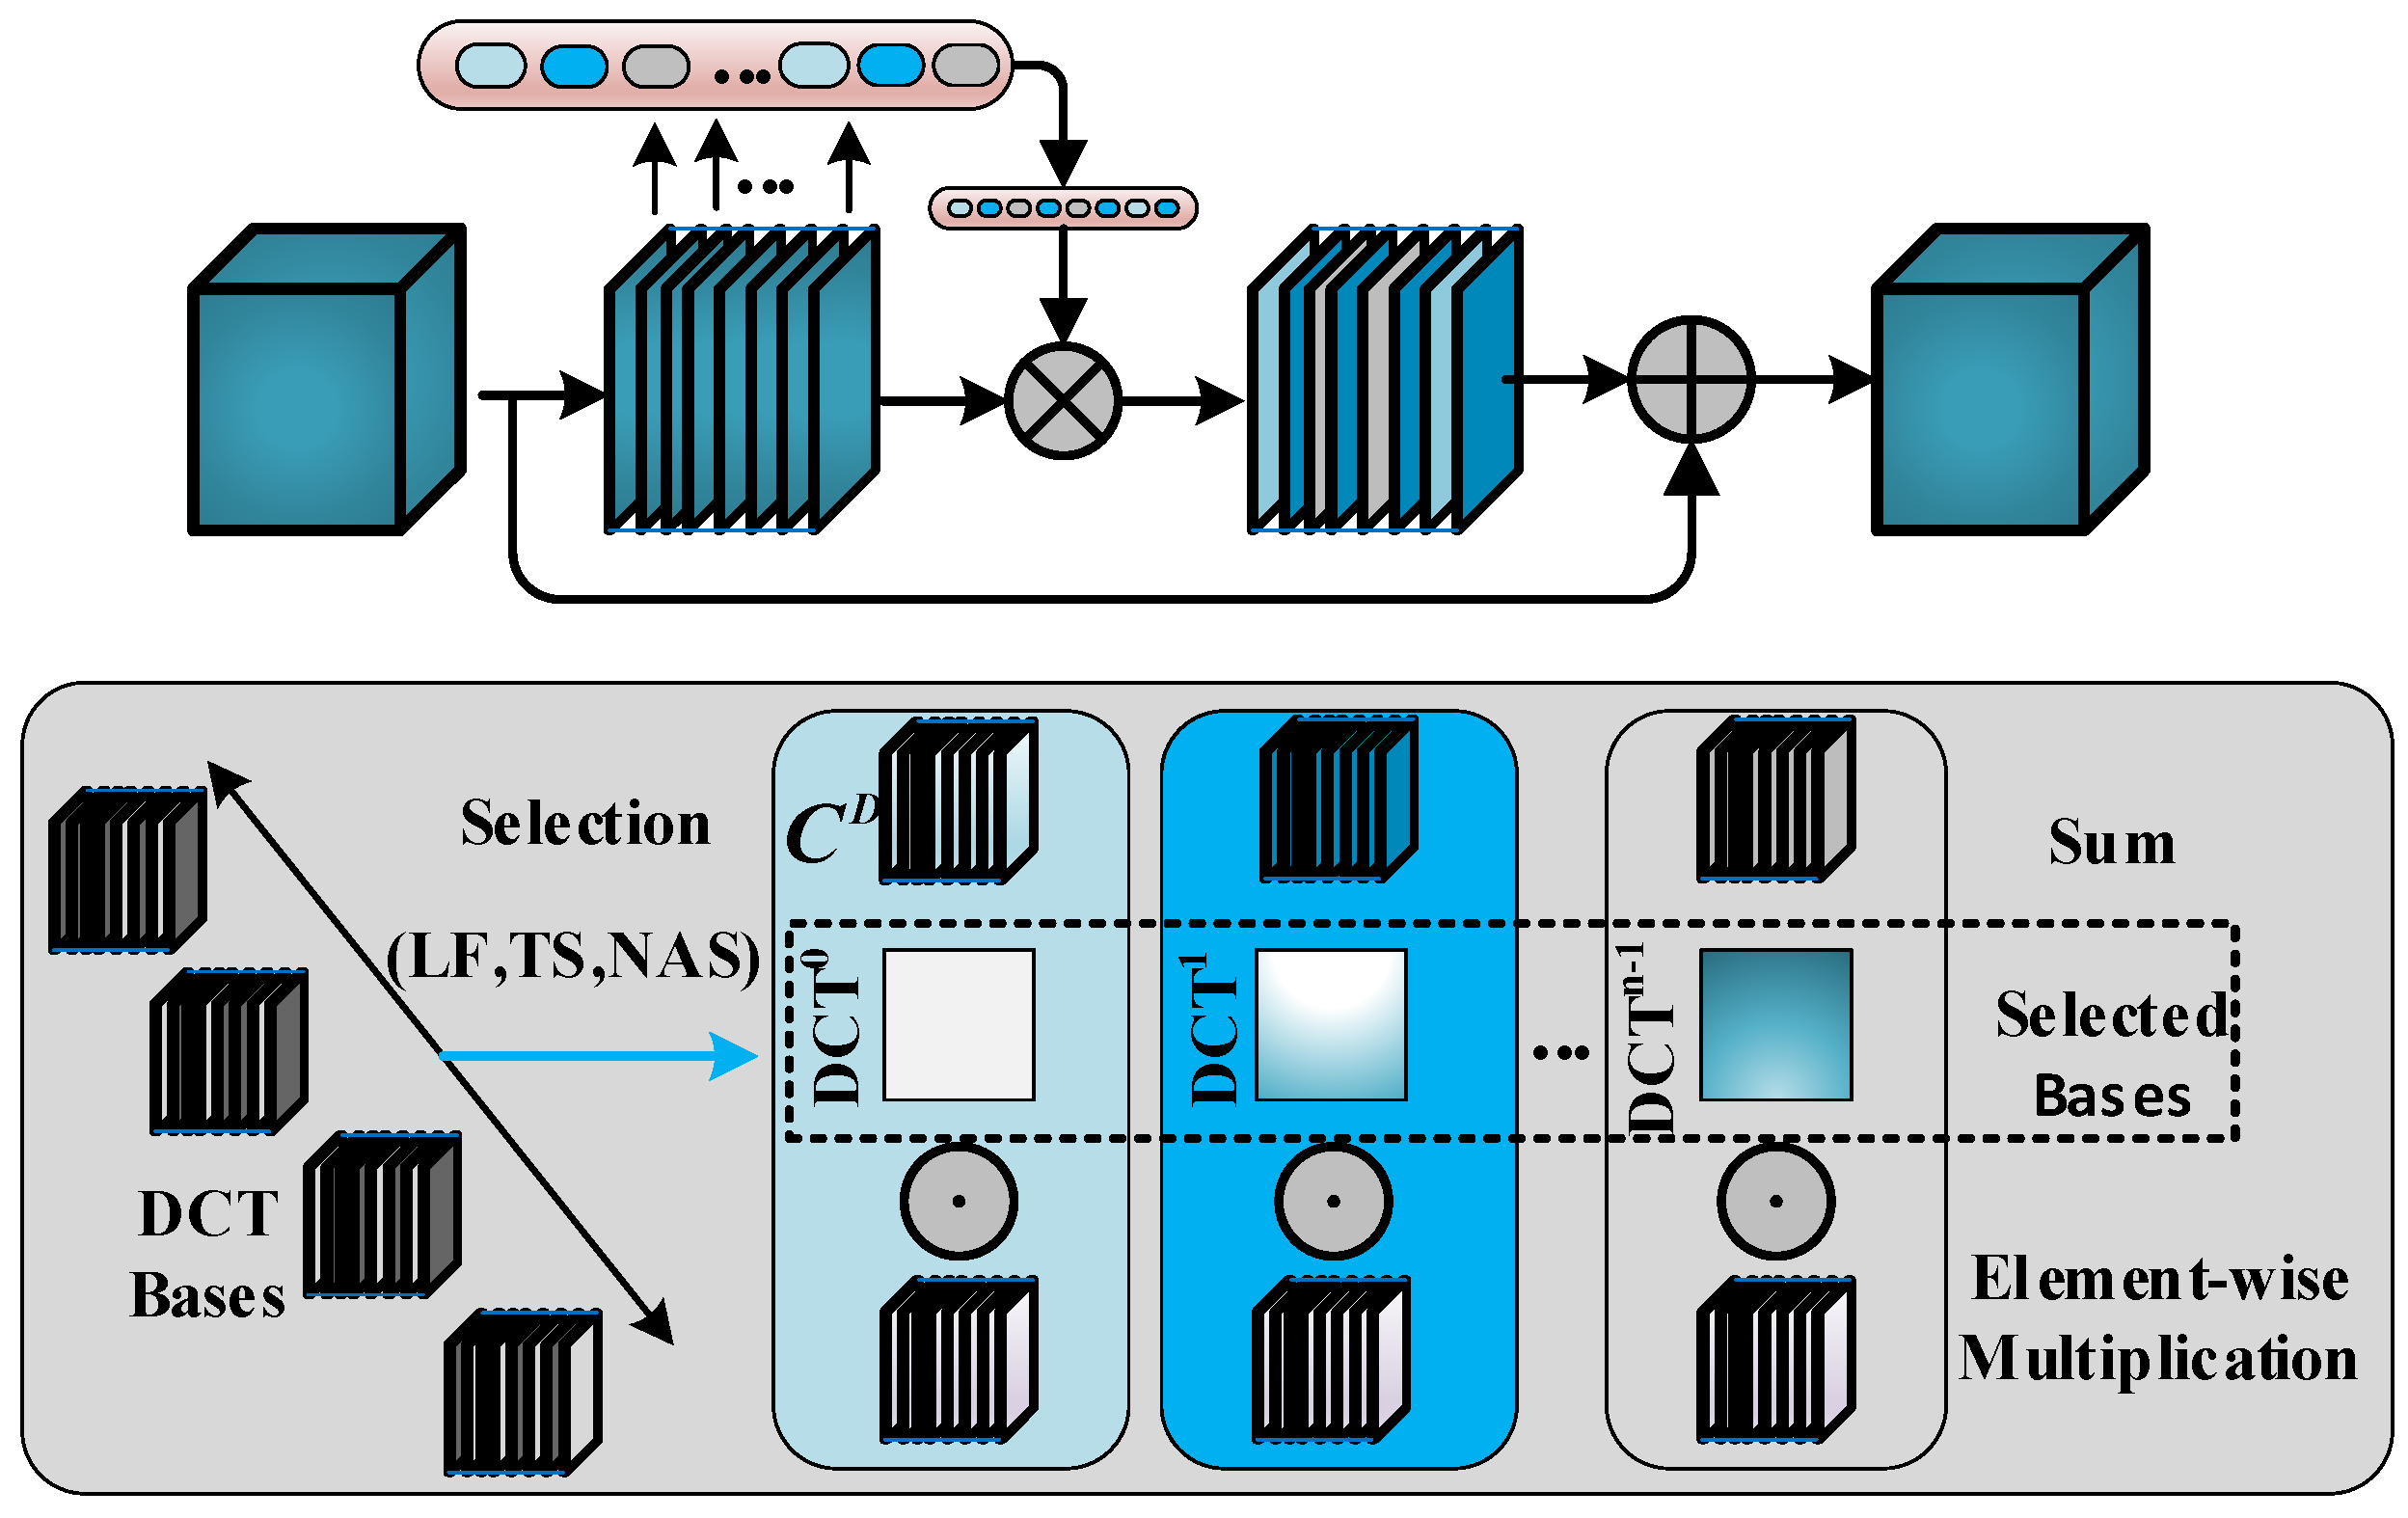
Most previous attention mechanisms have used GAP to generate the attention weights’ however, this approach only utilizes low-frequency feature information, with information from other frequencies being discarded. As shown in Figure 4, in our study, frequency domain attention is introduced into the CSP bottleneck to fully utilize the full frequency information of features, which is significantly different from simple GAP. We believe that this rich full frequency information is necessary for casting defect detection tasks with weak features. In order to better explore the subtle clues of weak defects, we suggest extending GAP using the 2D Discrete Cosine Transform (2D DCT) in order to better preserve and utilize more feature frequency components.

Figure 4.
Frequency domain attention (FA) network framework. The upper side shows the combination of frequency domain attention and bottleneck; for each CSP bottleneck input , the frequency domain attention is enhanced to obtain . The details of frequency domain attention are shown below. Our method can select multi-frequency classification of DCT, where previous attention can only utilize global average pooling.
First, the input defect feature is divided into many partial features along the channel dimension. We define a subset of each component as , where , , . For each component , a operation is assigned. The generated results preserve richer defect details, which is very beneficial in the model’s prediction process.
Here, are the frequency component 2D indices corresponding to , is the -dimensional vector after compression, and represents the basis function, i.e,
Then, the compression vector is obtained as follows:
where represents the multispectral vector. The overall frequency domain attention can be formulated as
In order to select the appropriate frequency component, we introduce neural architecture search technology to determine the optimal component for each channel. For each section , a continuous set of variables is introduced to search for components:
where O is the set containing all of the 2D DCT frequency component indices. After training, the frequency component for is derived by . The above process describes the details of frequency domain attention. Considering that the process of feature extraction in neural networks involves high-level semantics from low-level to abstract, we introduce the FA mechanism for the bottleneck features in the latter three stages, namely, .
By introducing frequency domain attention into the bottleneck, the detailed characteristics of weak defects are effectively maintained, which is more conducive for capturing subtle casting defect clues and improving model accuracy. The detailed feature extraction structure is shown in Table 1.

Table 1.
Feature extraction network structure details.
3.4. Feature Refinement Based on Progressive Learning
Casting defects typically exhibit diverse scales. Therefore, we introduce a progressive feature refinement mechanism to improve the accuracy of multi-scale defect target detection. As shown in Figure 2, in the bottom-up feature extraction process of the backbone network with frequency domain attention mentioned above, the framework asymptotically integrates low-level, high-level, and top-level features. Due to the semantic differences between nonadjacent hierarchical features being greater than that between adjacent hierarchical features, especially for bottom and top features, this leads to poor fusion performance on nonadjacent hierarchical features. Therefore, we suggest an asymptotic structure to bring the semantic information of different levels of features closer together during the asymptotic fusion process in order to alleviate the aforementioned problem.
Considering that the resolution size of each feature level is different, different levels are upsampled and downsampled during the fusion process. First, in order to maintain the unity of the feature dimensions, we use convolution for dimensional integration. Then, during the downsampling process, we use a progressive progressive fusion scheme that utilizes convolution for gradual fusion, using with a step size of k to achieve k-fold downsampling. Similarly, the upsampling process utilizes bilinear interpolation to gradually improve resolution. After feature fusion, the influence of frequency aliasing is eliminated using three residual units.
We leverage adaptive feature fusion to assign varying spatial weights to the different levels of features during the multi-level feature fusion process, thereby enhancing the significance of pivotal levels and mitigating the impact of contradictory information from different objects. As depicted in Figure 2, we fuse the features of the four levels. Let denote the feature vector at position from level n to level l. The resultant feature vector, denoted as , is obtained through the adaptive spatial fusion of multi-level features, and is defined by the linear combination of feature vectors , , and , as follows:
where , , and represent the spatial weights of the features of the three levels at level l subject to the constraint that . Considering the difference in the number of fused features at each stage of the progressive refinement process, we completed the adaptive feature fusion process for different numbers of specific feature stages.
3.5. Refined Deep Regression Supervision
Next, we aimed to establish a refined deep regression supervision mechanism to guide the gradient updating of the aforementioned deep network. In the training phase, each bounding box predicted by the model is forced to approach its ground truth box by minimizing the loss function below:
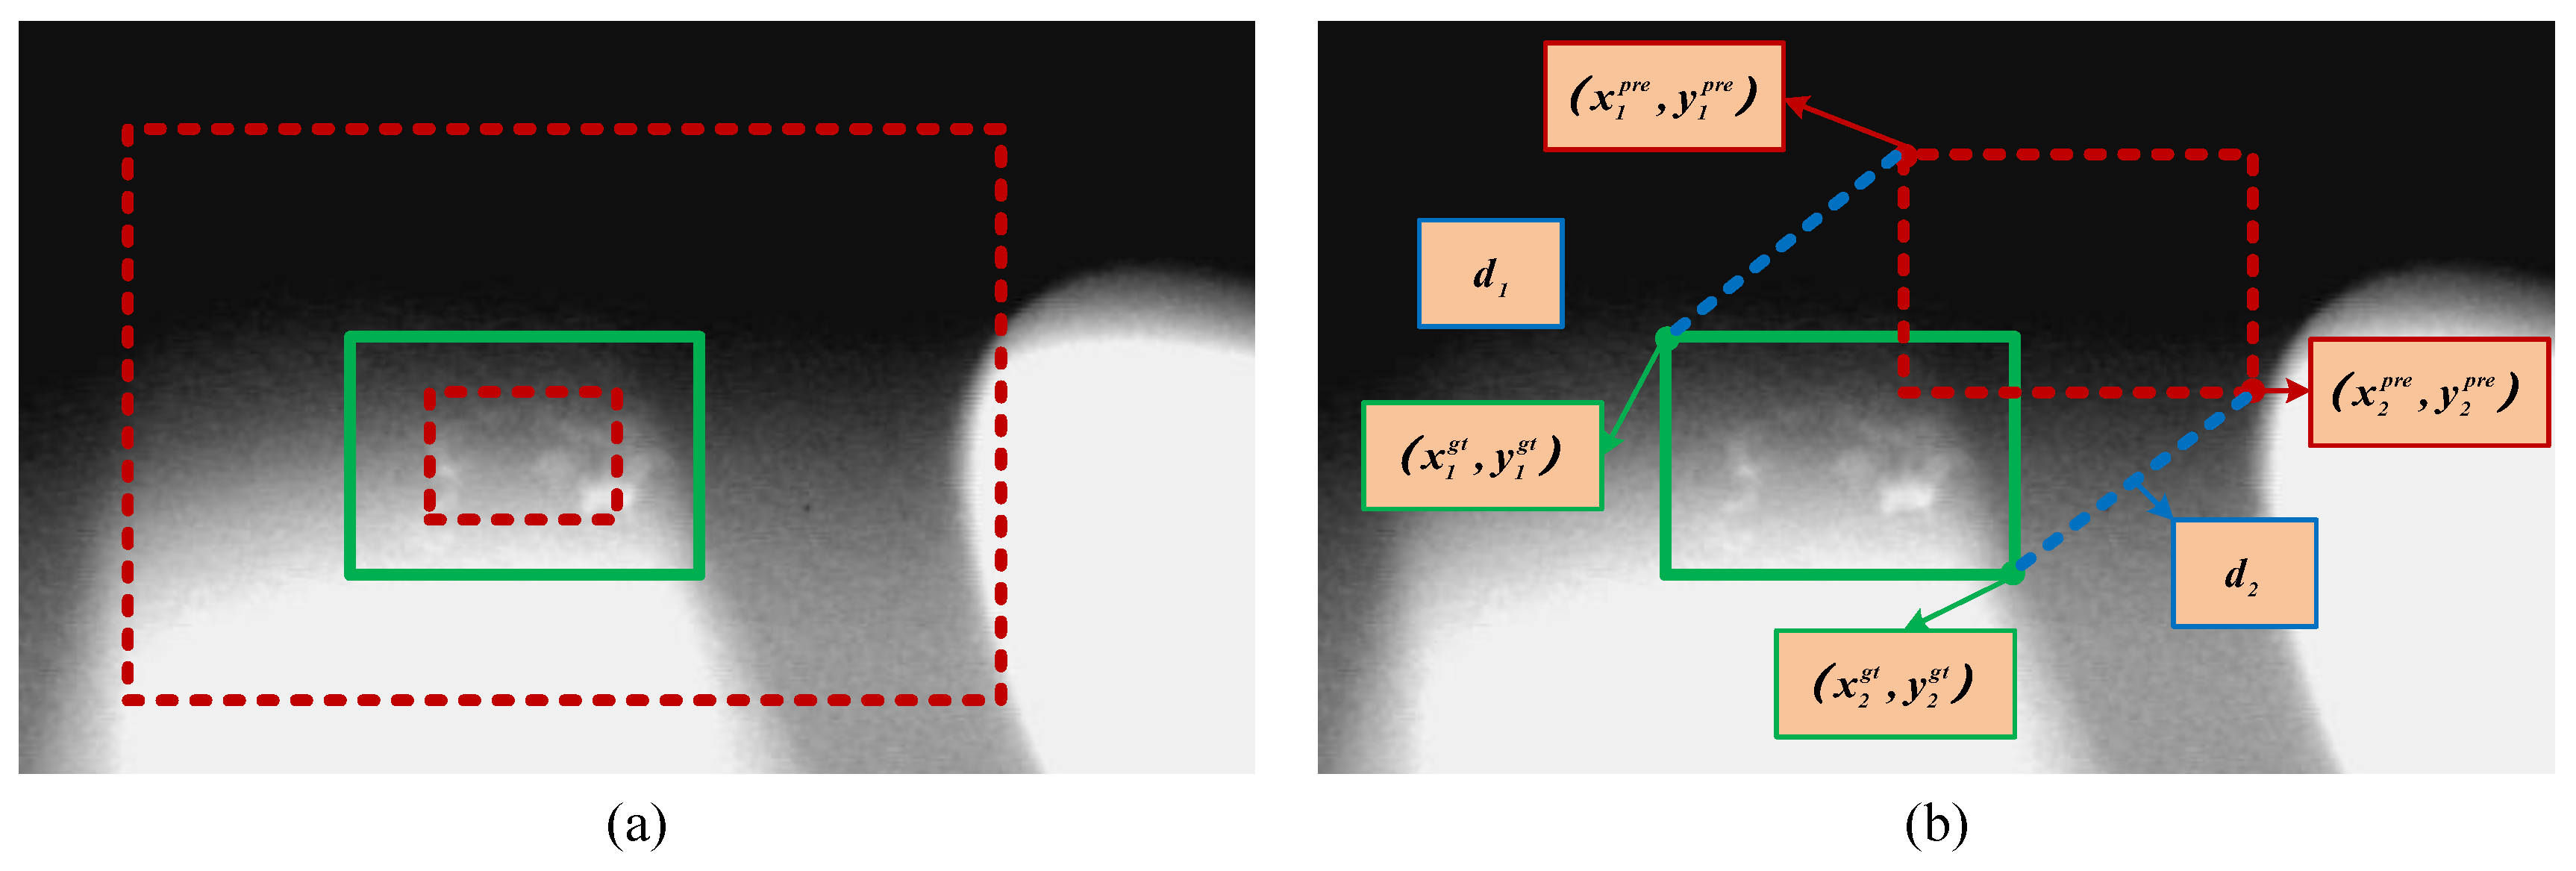
where is the set of ground truth boxes and is the parameter of the deep model used for regression. Typical forms of include -norm or IoU-based loss functions. However, as discussed in [35], the existing IoU-based losses are closely related to the aspect ratio of the target. Thus, as shown on the left side of Figure 5, when the predicted candidate for casting defects is similar to the ground truth, it does not have a good constraining effect. Therefore, in order to improve the accuracy when obtaining more detailed bounding box regressions, we introduce the coordinates of the upper left and lower right corners to define a unique rectangle, that is, the MDPIoU. Inspired by the geometric characteristics of the bounding box, we injected a more detailed IoU based metric into the entire objective function to directly minimize the distance between the upper left and lower right points between the predicted bounding box and the ground truth bounding box, as is shown on the right side of Figure 5. Specifically, the refined deep regression process can be formulated as follows:
where and represent the Euclidean distance between the predicted box and the ground truth, respectively, and A and B represent the rectangular area of the two, i.e,
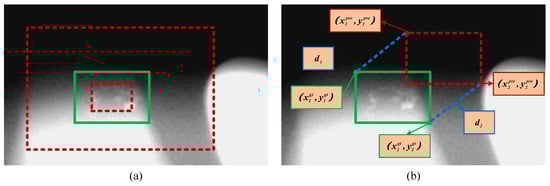
Figure 5.
Refined deep regression supervision mechanism: (a) shows an example of defect benchmarks (where the red dashed lines represent anchors of different scales and the green solid lines represent ground truth), while (b) shows the defect regression process.
In addition to the regression loss mentioned above, we further used the binary cross-entropy loss to determine the foreground and background, which can be described as follows:
where represents the predicted probability on the i-th anchor and is the ground truth. The total loss can be expressed as , where N is the number of images and and represent the loss coefficients for regression and foreground background classification, respectively.
4. Experiment and Discussion
4.1. Experimental Setup
4.1.1. Dataset
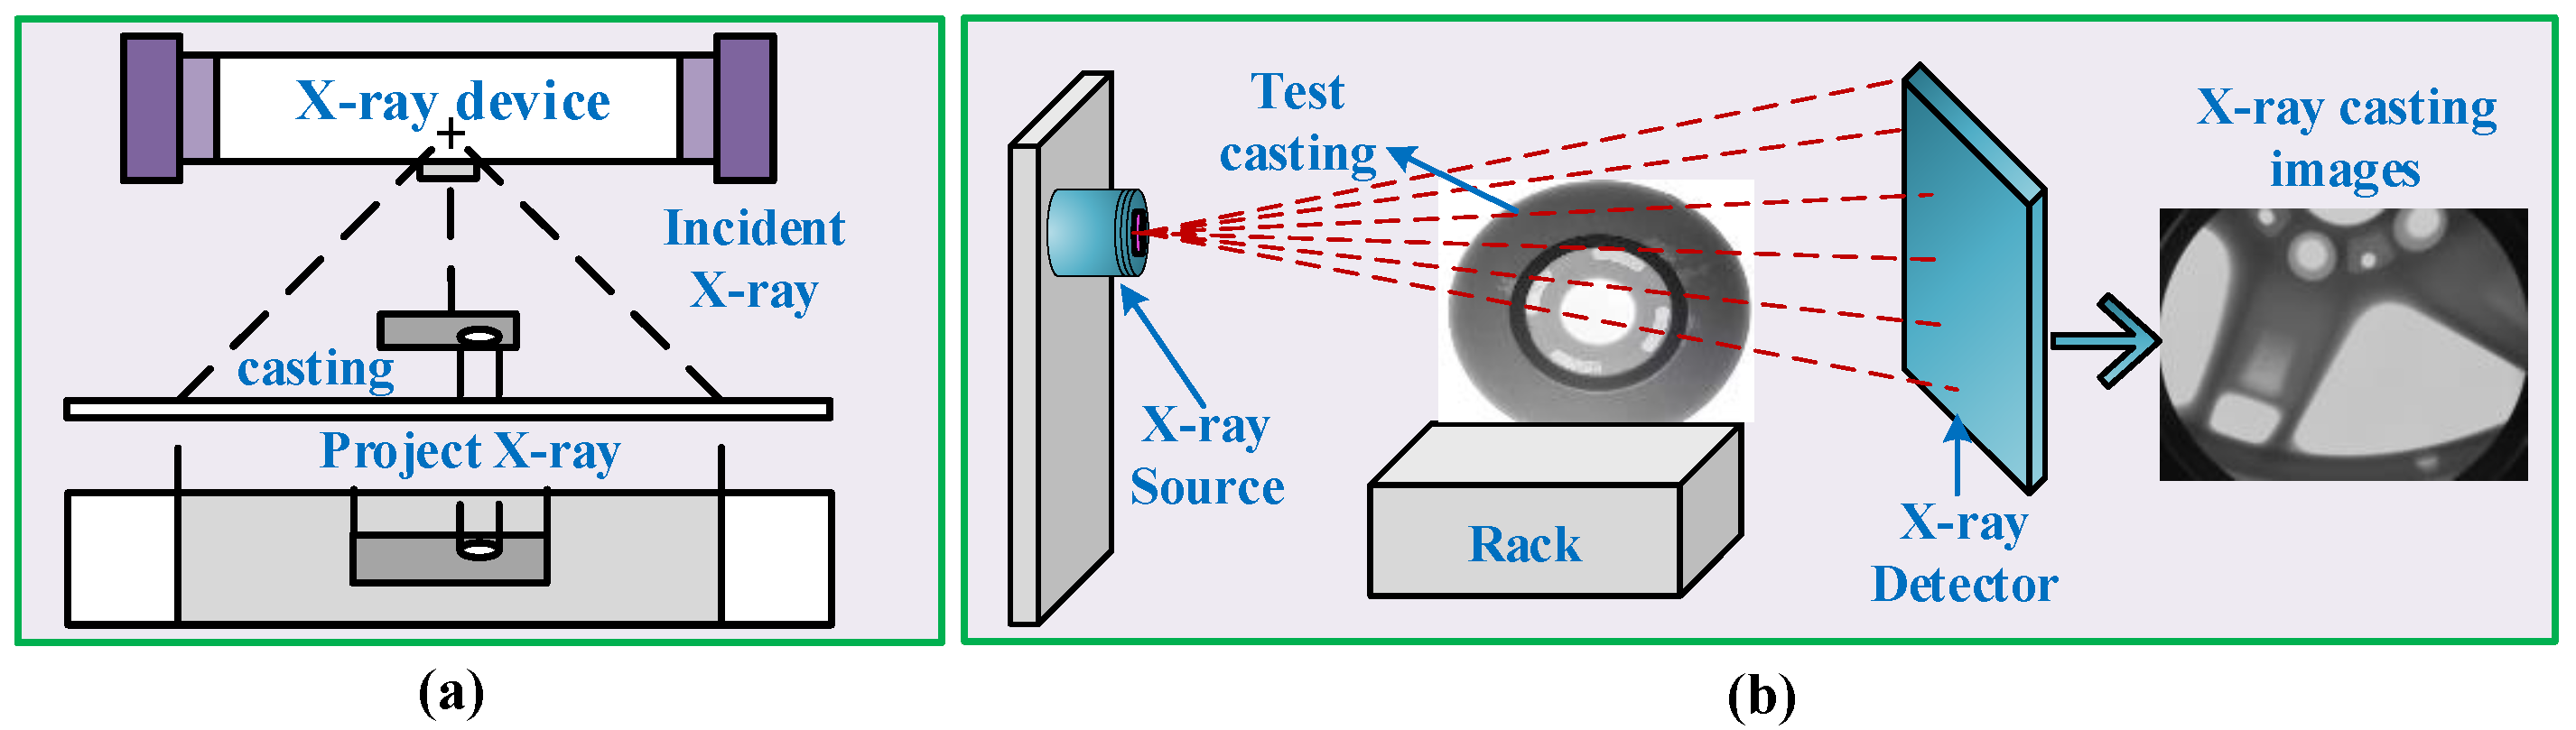
We utilized the casting image dataset from GDXray in our experiments. This dataset contains 2727 X-ray images. The object of the casting is an automobile wheel hub. The data source used in this study comes from the casting branch in [37] (link: https://domingomery.ing.puc.cl/material/gdxray, accessed on 7 October 2023). The wheel hub material is an aluminum alloy and the corresponding inspection method follows the settings in [37]. Figure 6 shows the acquisition process used to obtain the X-ray images. Non-destructive testing was performed by placing the hub object on a support platform using an X-ray source, then the X-ray image was obtained. Figure 7 shows examples of X-ray casting images with defect bounding box annotations. In these datasets, we used 80% as the training set and the remaining images as the test set to guide all experiments.
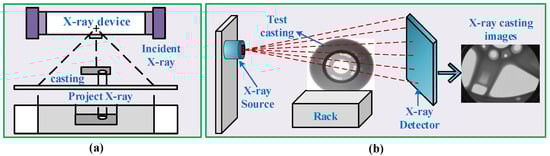
Figure 6.
The process of generating X-ray casting images: (a) the principle of X-ray projection and (b) the process of casting inspection.
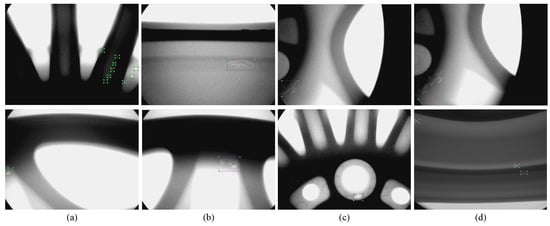
Figure 7.
X-ray casting images: (a–d) show several sets of defect examples with bounding box annotations.
In order to improve the generalization ability of the model in practical applications, we performed Data Augmentation (DA) processing on all images in the training set, including flipping, shifting, and scaling, and performed the same processing on the corresponding labels.
4.1.2. Parameter Settings
The initialization parameters of the backbone were transformed from the object detection task on the COCO dataset [38]. The batch size was set to 32, the image training and inference size was 640, and a single training cycle consisted of 300 rounds. The initial learning rate was , the bounding box regression loss coefficient was , and the foreground–background classification coefficient was .
4.1.3. Evaluation Metrics
In this section, we introduce commonly used detection and evaluation indicators, including Recall (Rec), Precision (Pre), accuracy at an intersection-to-union ratio threshold of 0.5 (AP), and average accuracy at an intersection-to-union ratio threshold of 0.5 to 0.95 (Acc):
where TP stands for true positive, FP for false positive, FN for false negative, AP represents the area of the PR curve, and K represents the number of IoU threshold settings.
4.2. Ablation Experiments
In this section, we provide a detailed evaluation of the effectiveness of each module in the methodology framework. Specifically, we chose the popular YOLOv8 single-stage rapid detection framework as the baseline model and gradually introduced the proposed sub-modules, including adaptive contrast enhancement (ACE) and data augmentation (DA), frequency domain attention (FDA), the progressive feature refinement module (PFRM), and refined deep regression supervised loss (MDPIoU).
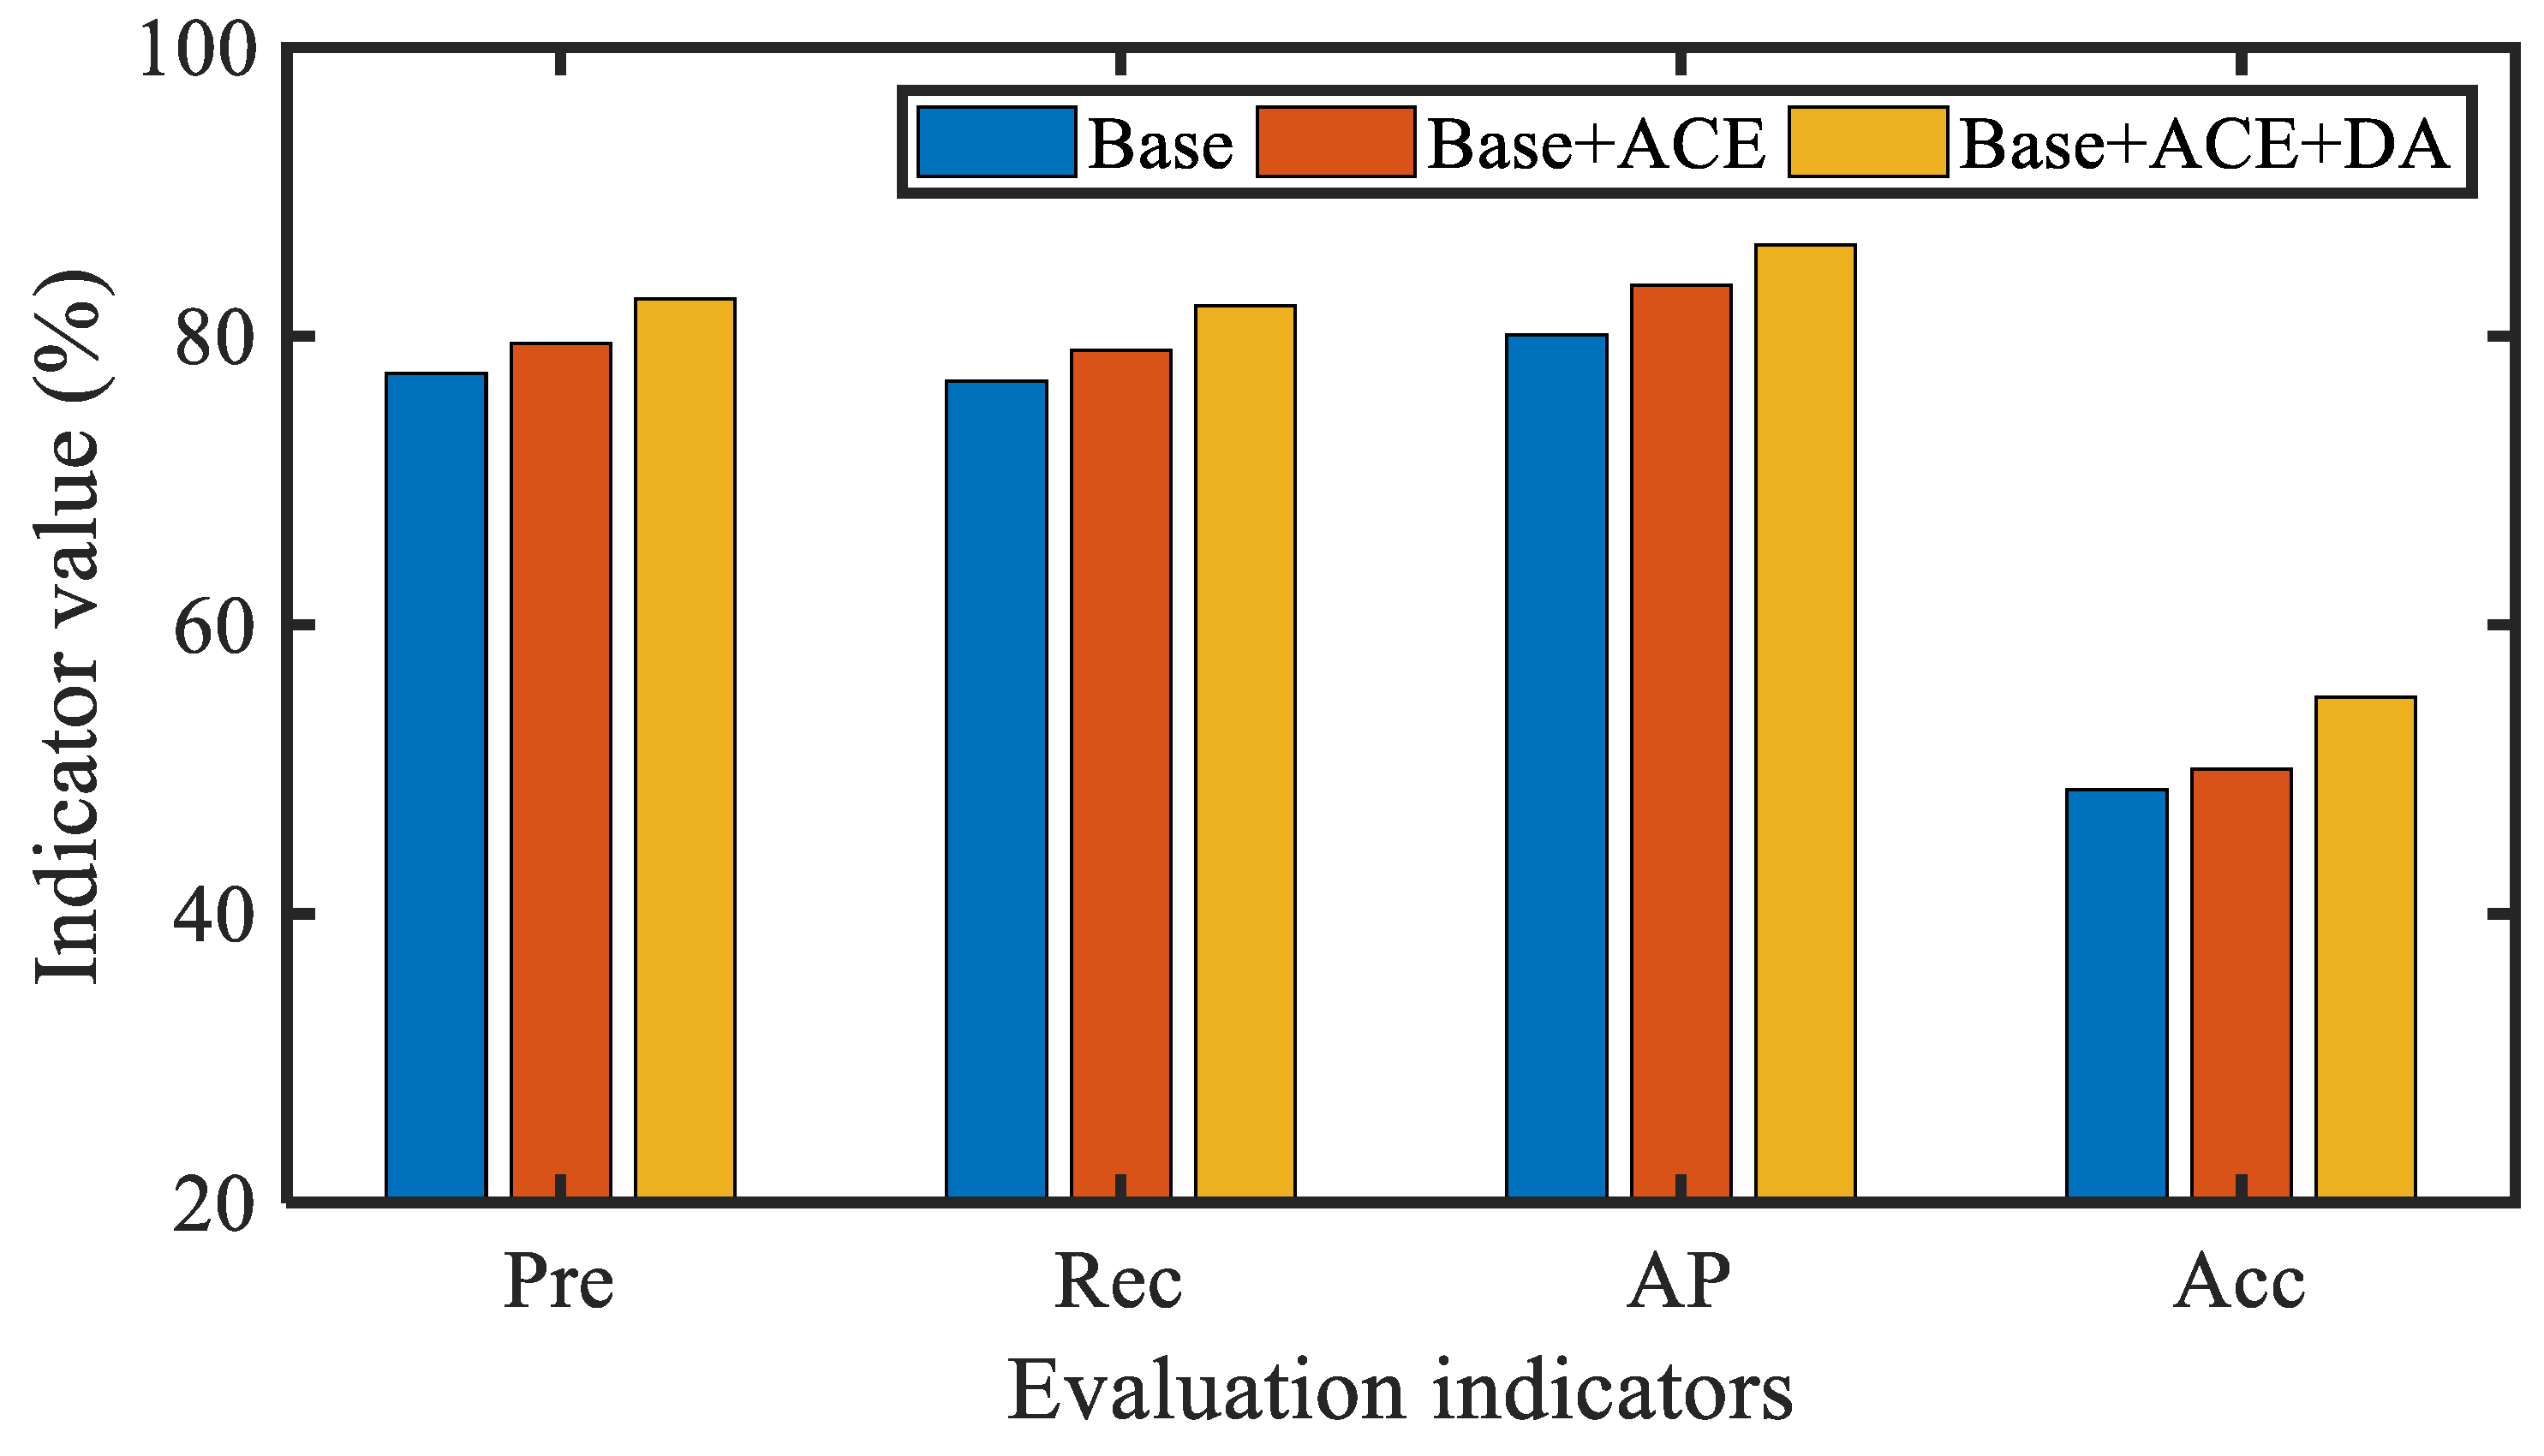
We first analyzed the impact of adaptive preprocessing on model accuracy. We conducted detailed experiments using baseline models on the original casting images, images generated using ACE method, and data augmentation images. From the performance of various indicators in Figure 8, it can be seen that adaptive preprocessing of the original casting image plays a positive role in the performance of the model.

Figure 8.
The impact of adaptive preprocessing on model accuracy.
Unlike target images in natural scenes, casting defects based on X-ray images often have weak features; thus, the baseline method did not achieve high accuracy. As shown in Table 2, the baseline method obtained a Pre of 0.826 and Rec of 0.821 on the casting defect detection task, indicating a certain number of missed and false alarms with respect to defects in the baseline with considerable room for improvement. After gradually introducing the proposed modules, it can be observed that all four evaluation indicators are improved. Finally, when using all the proposed modules, increases from 0.863 to 0.940, an increase of approximately 7.7%. Furthermore, under stricter IoU standards the AP increases from 0.550 to 0.608, indicating that the proposed method can achieve more accurate defect detection results.
Table 2.
Results of the modular ablation experiment.
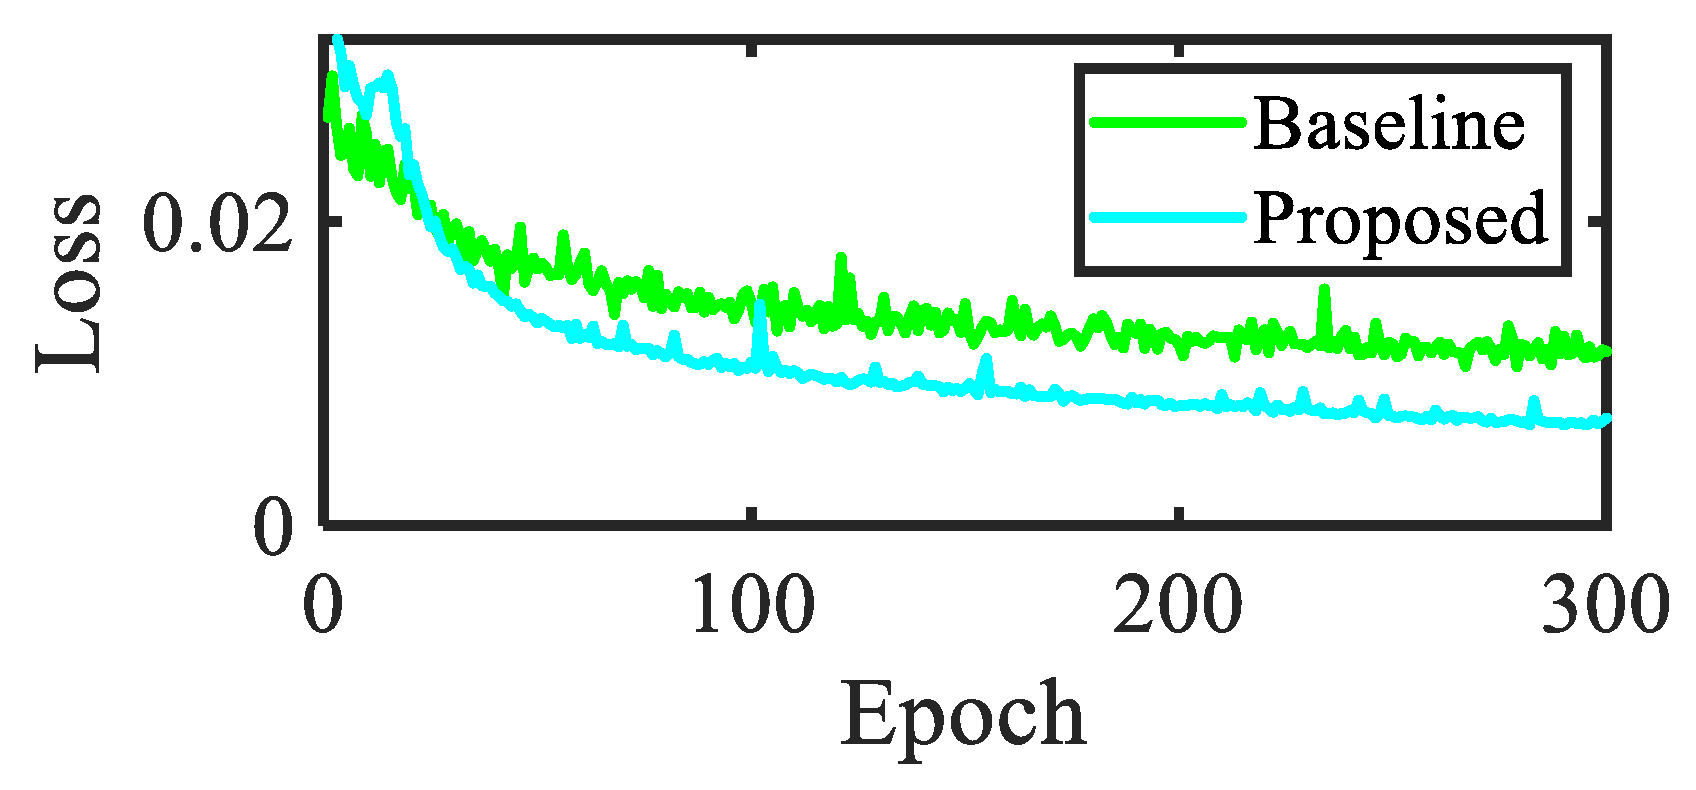
In order to analyze the effectiveness of the model training process, we compared the convergence degree of the model. The convergence of the loss function is crucial for evaluating the fitting and generalization ability of the model. Figure 9 shows the overall loss comparison. From this figure, it can be seen that the proposed method can achieve a more stable convergence interval in a shorter period of time compared to the convergence of the baseline.
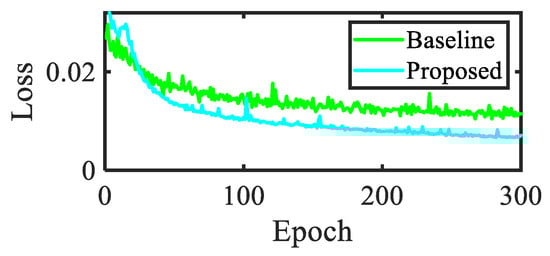
Figure 9.
Comparison of loss curves.
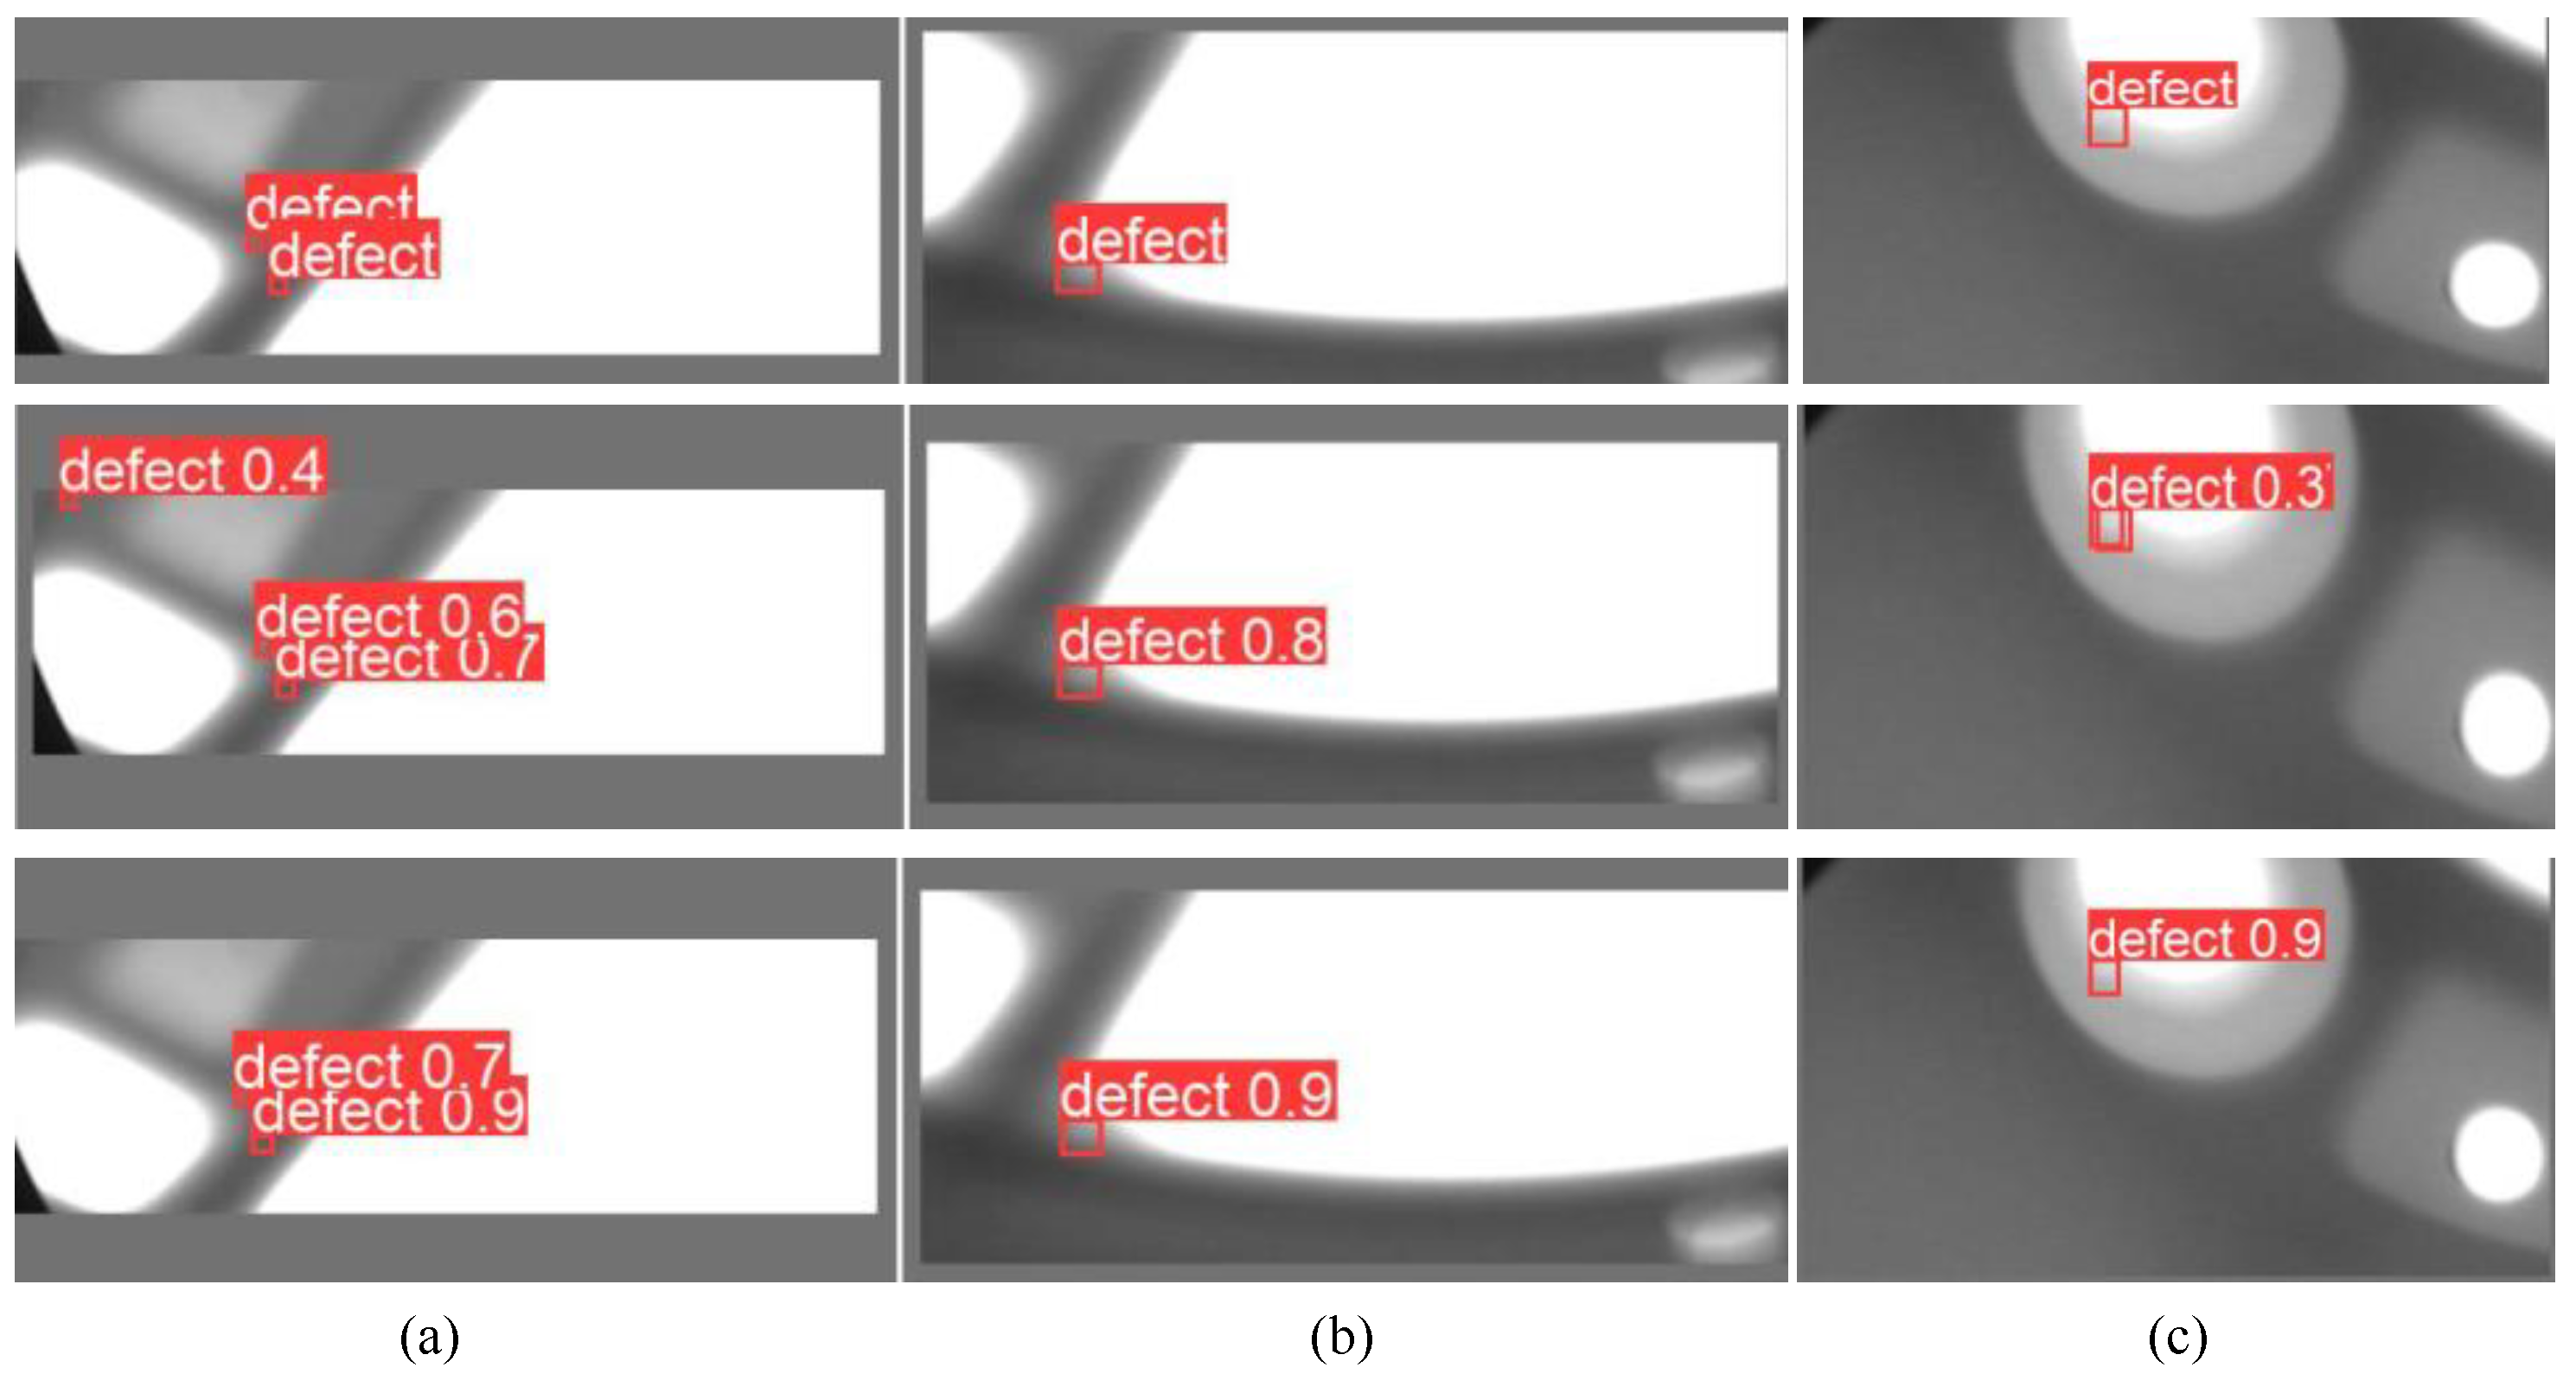
Finally, we visualized several representative casting defect detection results. As shown in Figure 10, the baseline method contains false positives and has provides confidence in the related defects. The proposed method can achieve better detection results with higher confidence. Therefore, in the casting defect detection task based on X-ray images, the various modules introduced in this study effectively improve the performance of the model.

Figure 10.
Visualization of the results, with the top, middle, and bottom three lines respectively displaying the ground truth, baseline results, and proposed method results: (a–c) present three sets of defect detection examples.
4.3. Comparison with Other Casting Defect Detection Methods
In this section, we compare the performance of the proposed method to other casting defect detection methods. The compared methods include attention-based methods [30,39], multiscale-based methods [20,21], adaptive receptive field-based methods [22], and cascading prediction mechanism-based detection methods [23]. We conducted detailed experiments according to the hyperparameters in the corresponding literature, and obtained the results shown in Table 3. From Table 3, it can be observed that the proposed framework has competitive advantages compared to other defect detection methods. Below, we conduct a detailed evaluation of the defect detection performance of the proposed method on the radiographic image task with respect to casting defects.
Table 3.
Performance comparison with state-of-the-art methods.
Overall, the proposed method outperforms other defect detection methods in terms of various indicators. For example, the Precision accuracy indicator reflects the accuracy of defect detection; the other methods average below 0.9, while the method proposed in this paper achieves 0.950. This indicates that the proposed model can extracted discriminative details of casting defects, resulting in less hasty reasoning (i.e., the model is not very sensitive to noise). In addition, our method shows advantages in terms of the comprehensiveness of defect detection, achieving 0.903 on the Rec metric. In terms of the accuracy of the detection box, our proposed model achieves 0.608 Acc on the stricter IoU standard. Therefore, the above experimental results fully demonstrate the advantages of our method in casting defect detection tasks. Furthermore, we visualized the defect detection results and generated a network attention graph using GradCam. From Figure 11, it can be seen that our method is able to accurately locate the defect area and provide reasonable predictions.
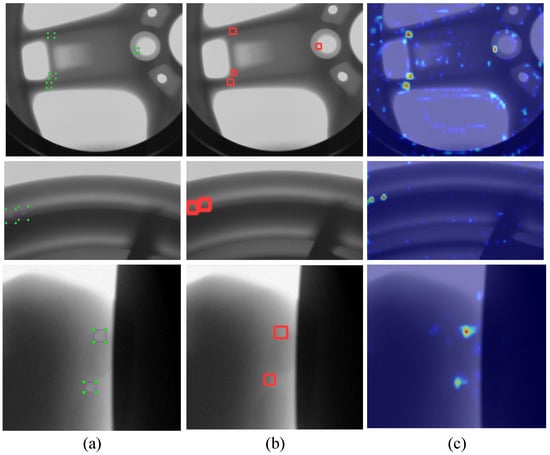
Figure 11.
Visualization of casting inspection results based on X-ray images: (a) ground truth, (b) model reasoning results, and (c) attention maps.
4.4. Model Robustness Analysis
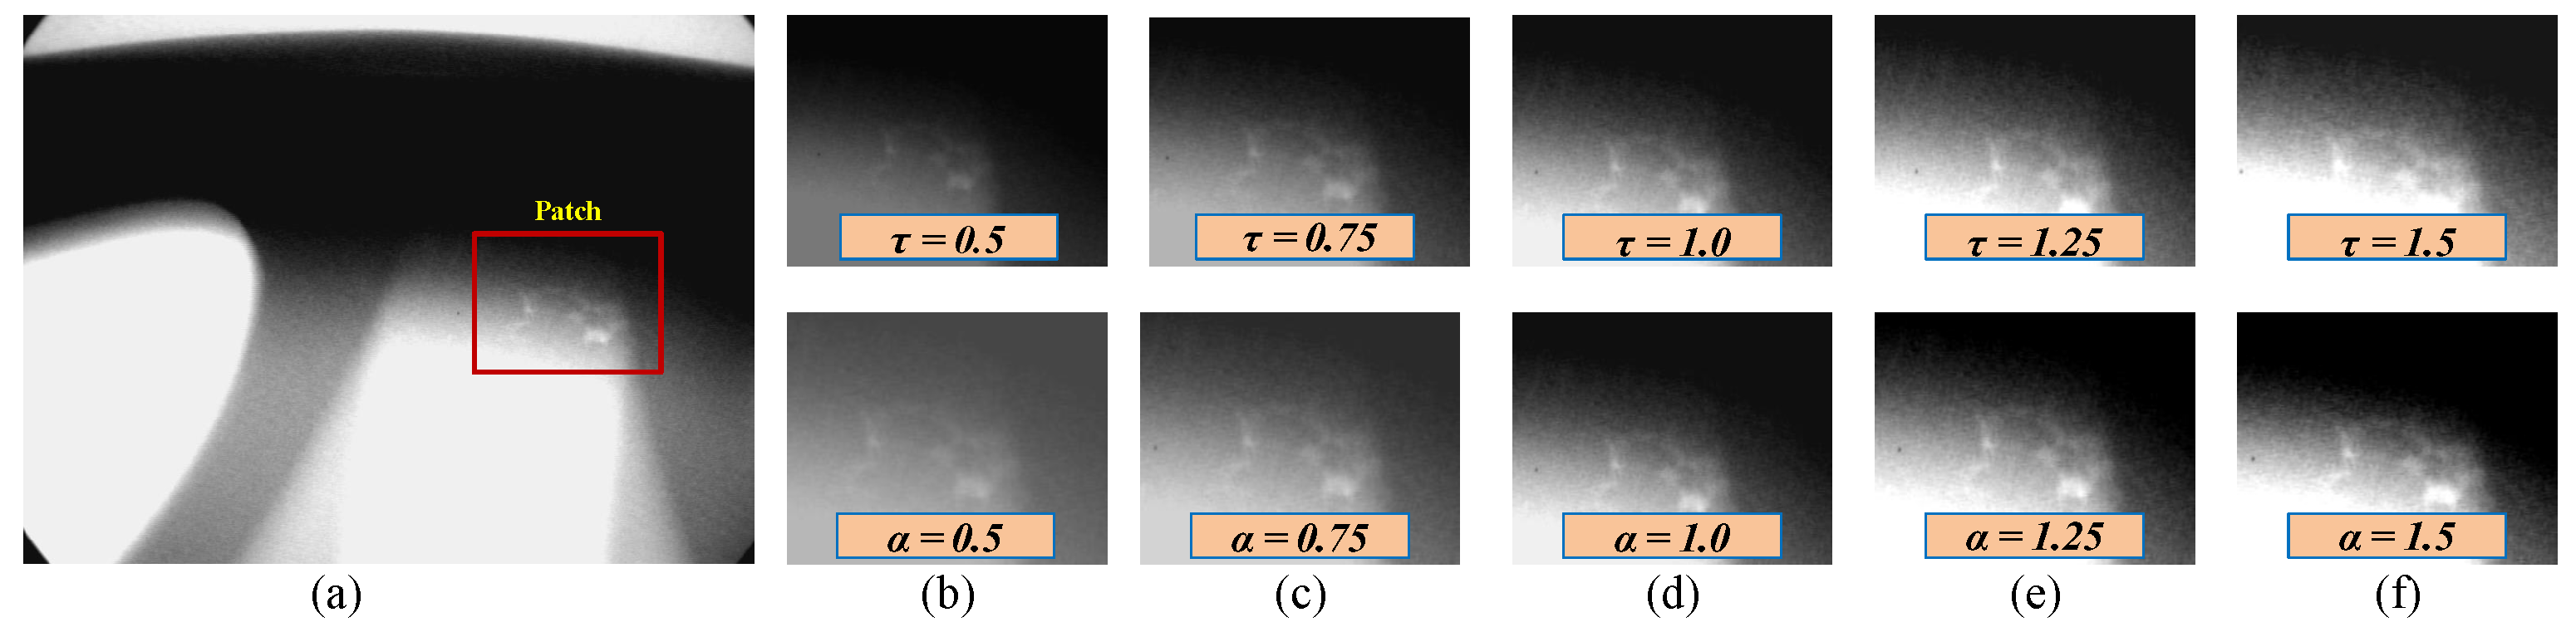
The robustness of a model is crucial for applications in practical industrial systems. The above experimental results have demonstrated that the proposed model has good detection performance on the test set. However, a powerful casting defect detection model should be robust as well, that is, it should have the ability to resist changes in image parameters. In the process of detecting casting defects, the brightness, contrast, and other parameters of the image are sensitive and closely related to the thickness, shape, and other parameters of the casting. Therefore, in this section we explore the impact of image brightness and contrast parameters on model performance. We simulated different levels of automatic adjustment to the brightness and contrast parameters in order to analyze the robustness of the model, i.e., for changes of and in the brightness parameter and contrast parameter , respectively. Figure 12 shows the visualization results after adjusting the image parameters. We adjusted the image parameters of all test images and directly used them for model testing to verify the stability of the model’s performance. We obtained two detection results after adjusting the image parameters.

Figure 12.
Visualization example after adjusting the brightness and contrast parameters of an image: (a) the original defect image and (b–f) several sets of defect examples after adjusting the brightness and contrast parameters.
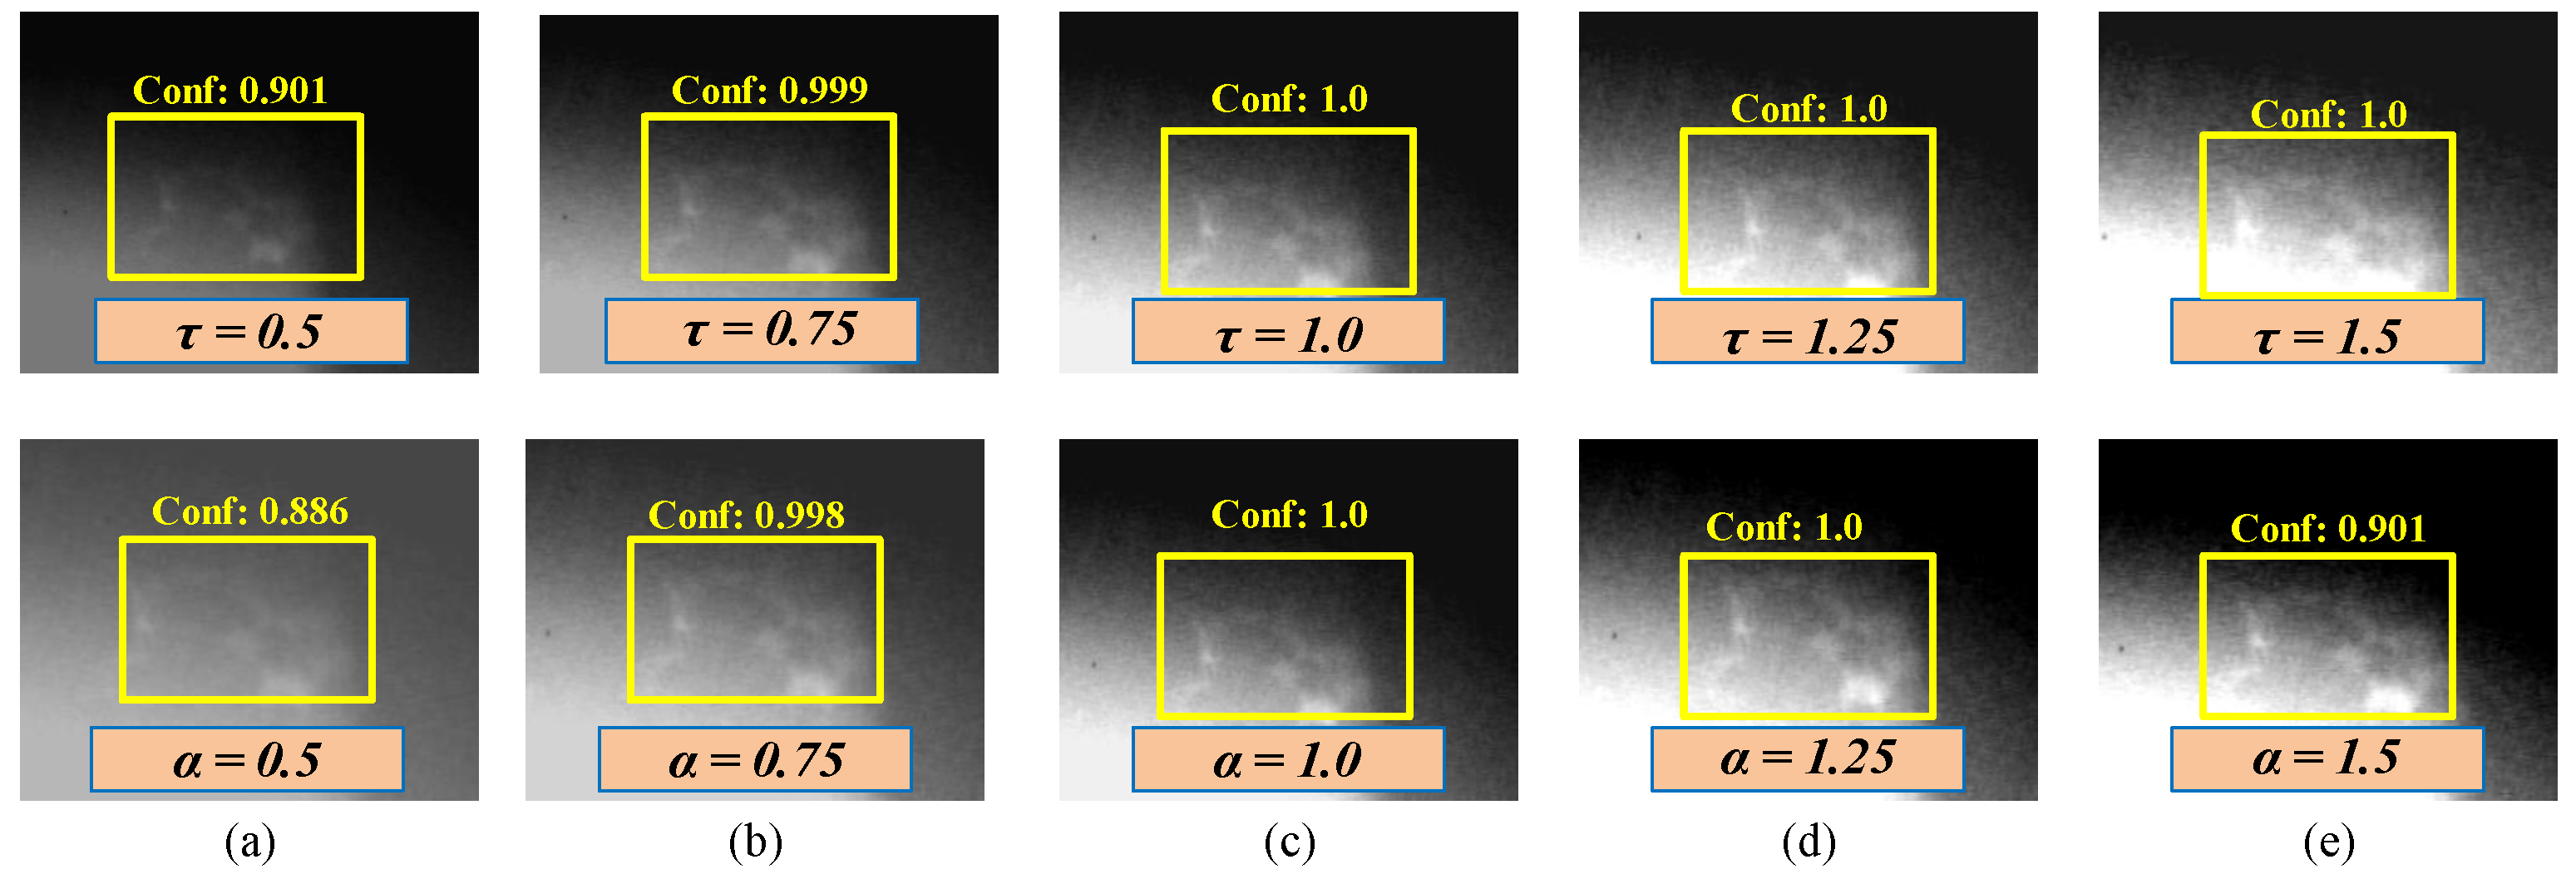
From the results in Table 4 and Table 5, it can be seen that adjusting the image parameters results in a certain fluctuation in model performance, with contrast adjustment having a higher impact than brightness adjustment. However, it is worth noting that after training all model parameters, the convolutional weights of the model will be fixed except for the attention weights. Therefore, for any nonlinear function, if the input changes, the result inevitably changes as well. Our model fluctuates within a reasonable range, indicating that it has practical application value. The defect results with different parameters are shown in Figure 13, demonstrating that the proposed model can accurately locate defects even when there are parameter changes in the on-site X-ray images.
Table 4.
Impact of the brightness parameter on the performance of the model during the testing phase.
Table 5.
Impact of the image contrast parameter on the performance of the model during the testing phase.
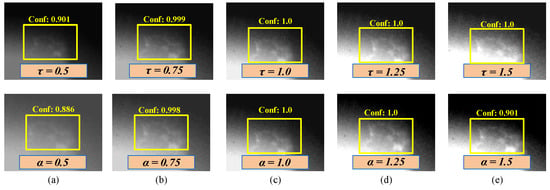
Figure 13.
Visualization example of model inference results after adjusting the brightness and contrast parameters of the image: (a–e) show the defect detection results for several sets of adjusted parameters.
4.5. Structural Analysis
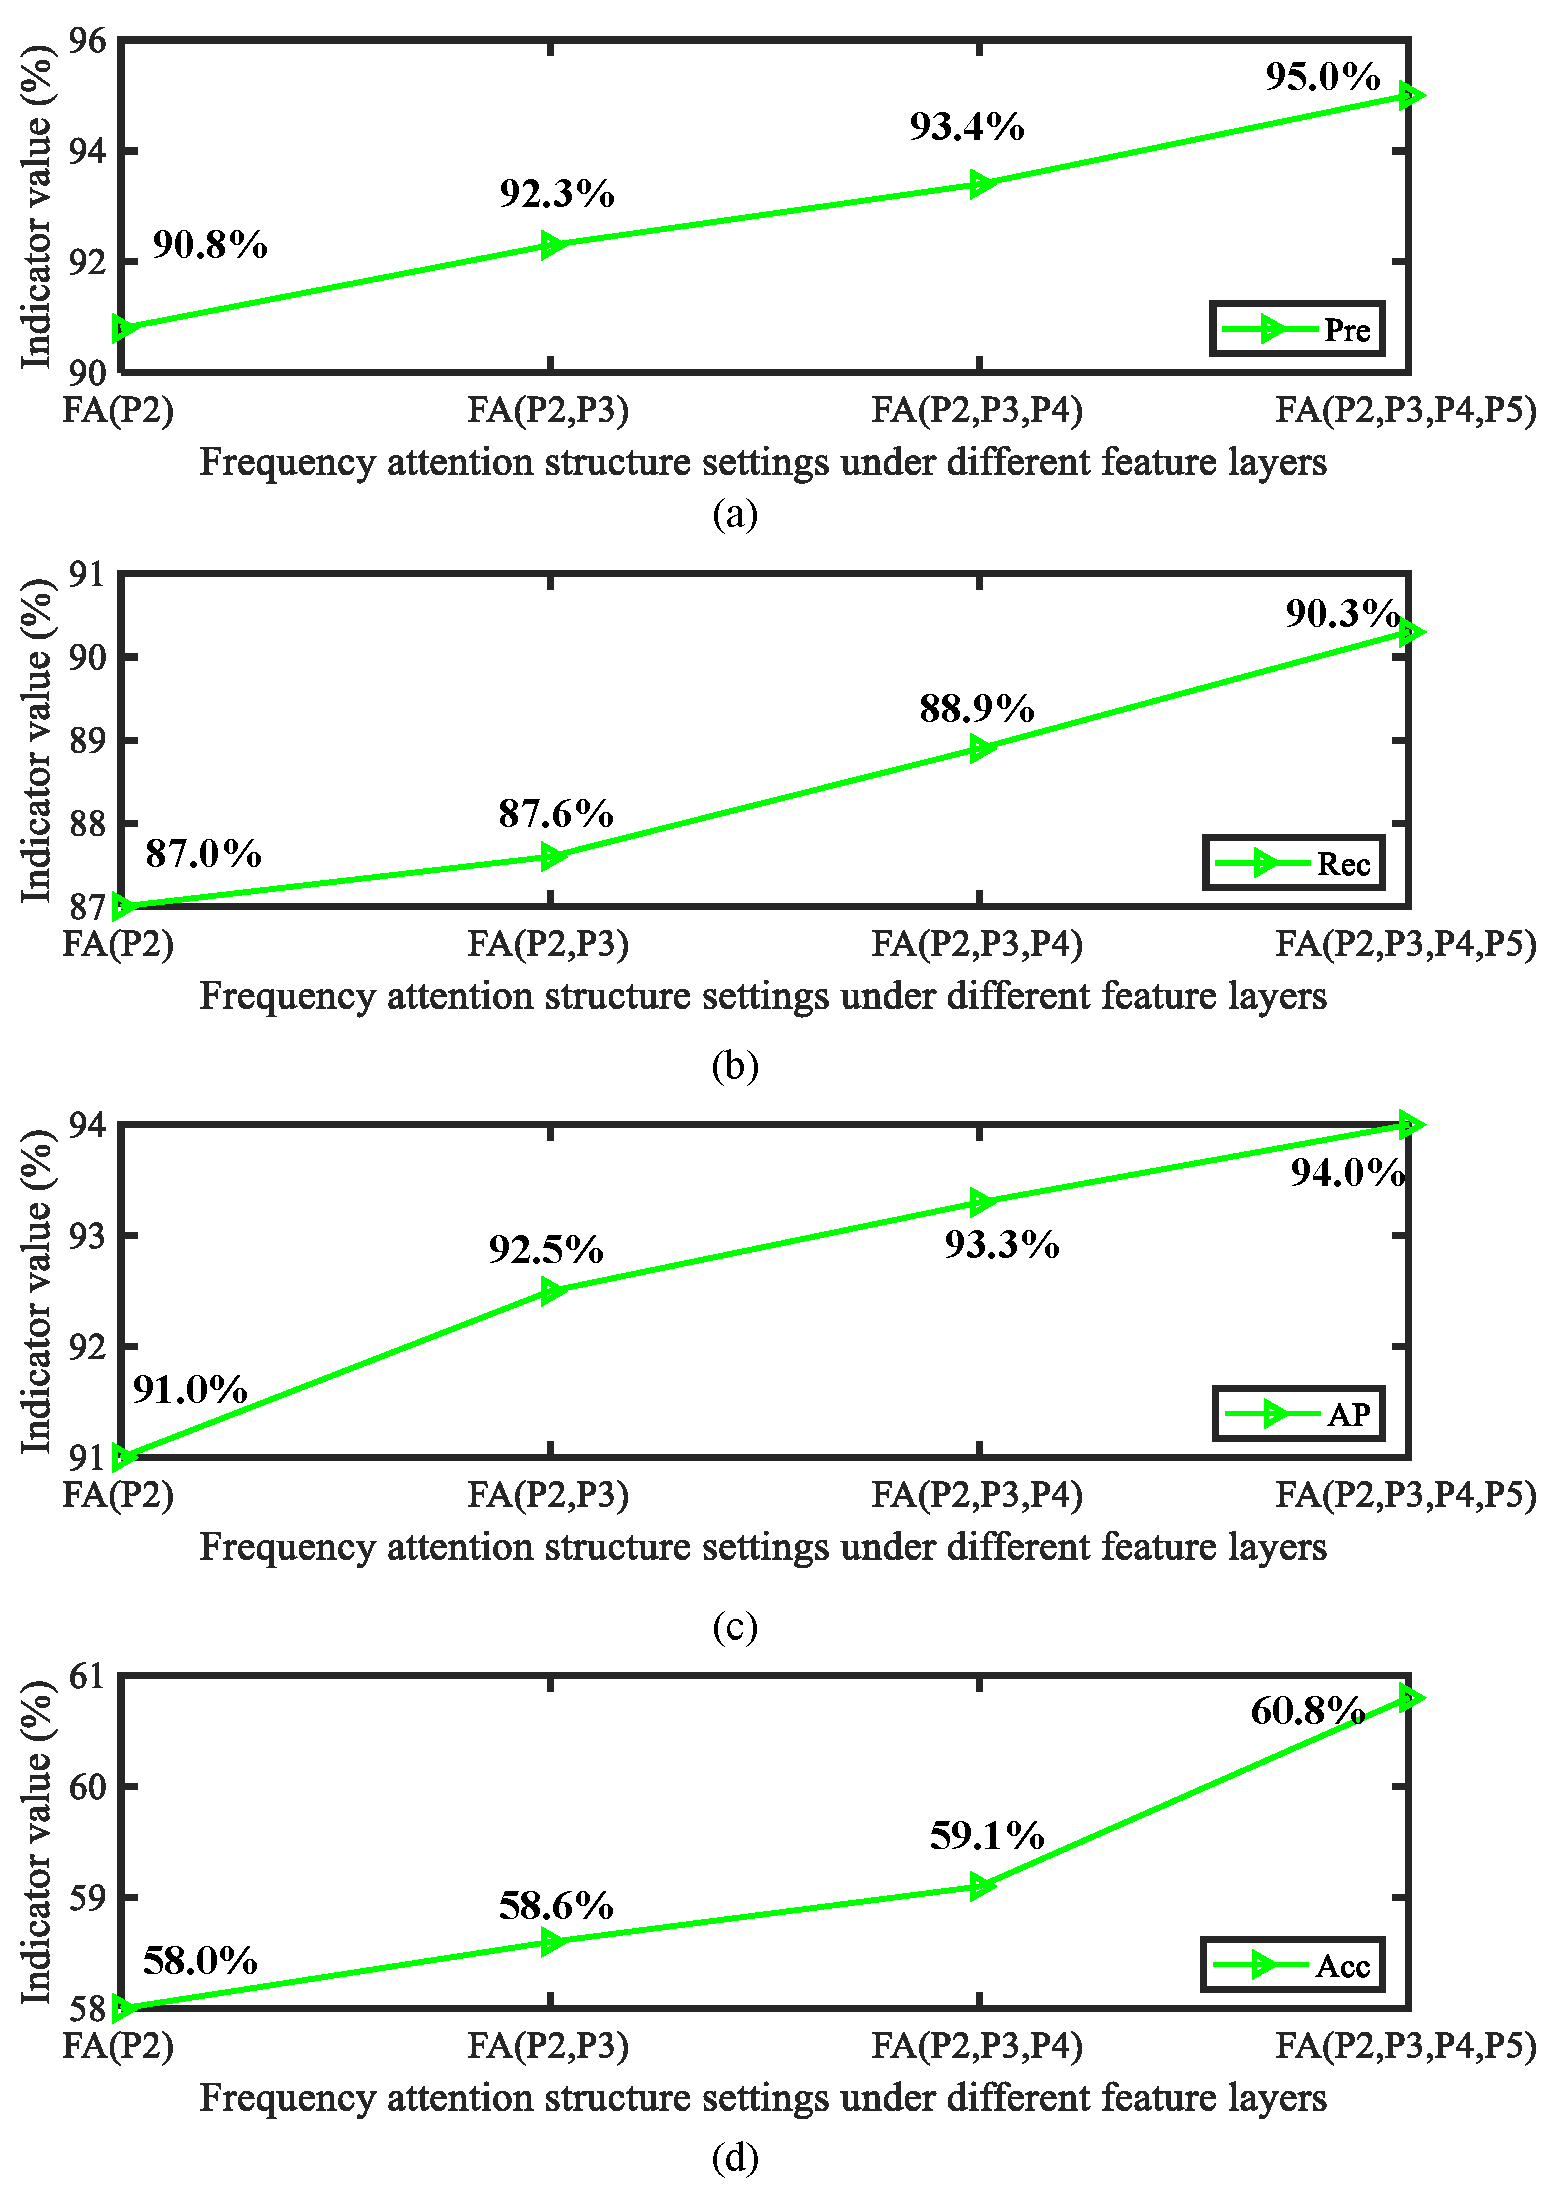
In this section, we focus on analyzing the role of the proposed frequency domain attention and asymptotic feature fusion mechanism at different positions in the model structure. As is well known, the performance of downstream tasks achieved by inserting attention and other modules into different positions in the feature extraction network varies greatly. Therefore, we carefully evaluated the performance of frequency domain attention in different feature layers (P2 to P5). In addition, we evaluated the impact of different feature layer fusion quantities on overall accuracy during the progressive feature fusion process. The obtained detection results are shown in Figure 14 and Figure 15.
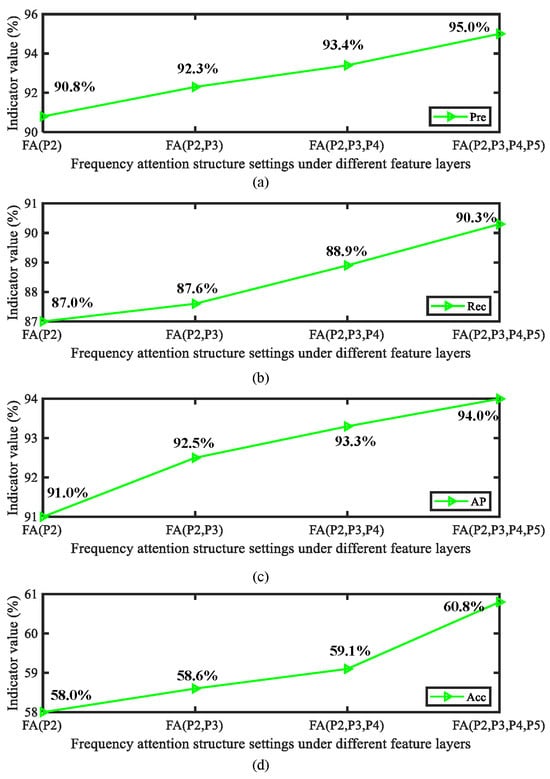
Figure 14.
Analysis of model performance results when frequency domain attention is inserted into different feature layers: (a) Precision (Pre) indicators, (b) Recall (Rec) indicators, (c) AP indicators, and (d) Acc indicators.
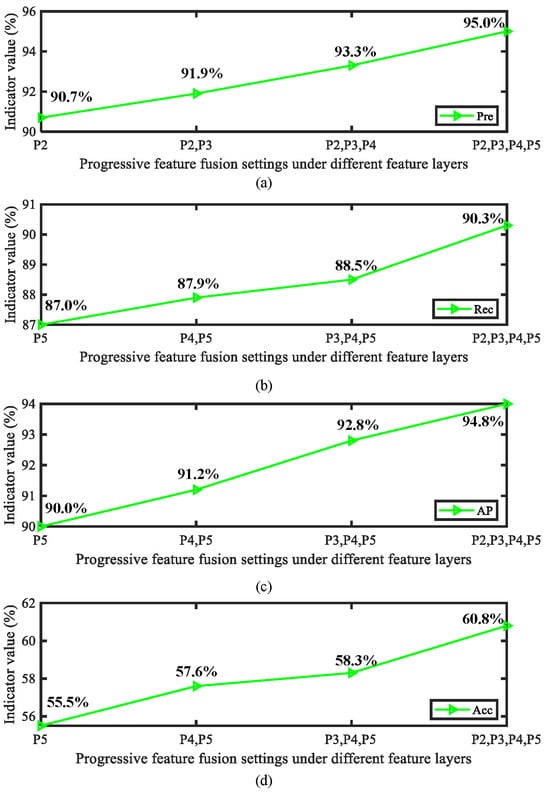
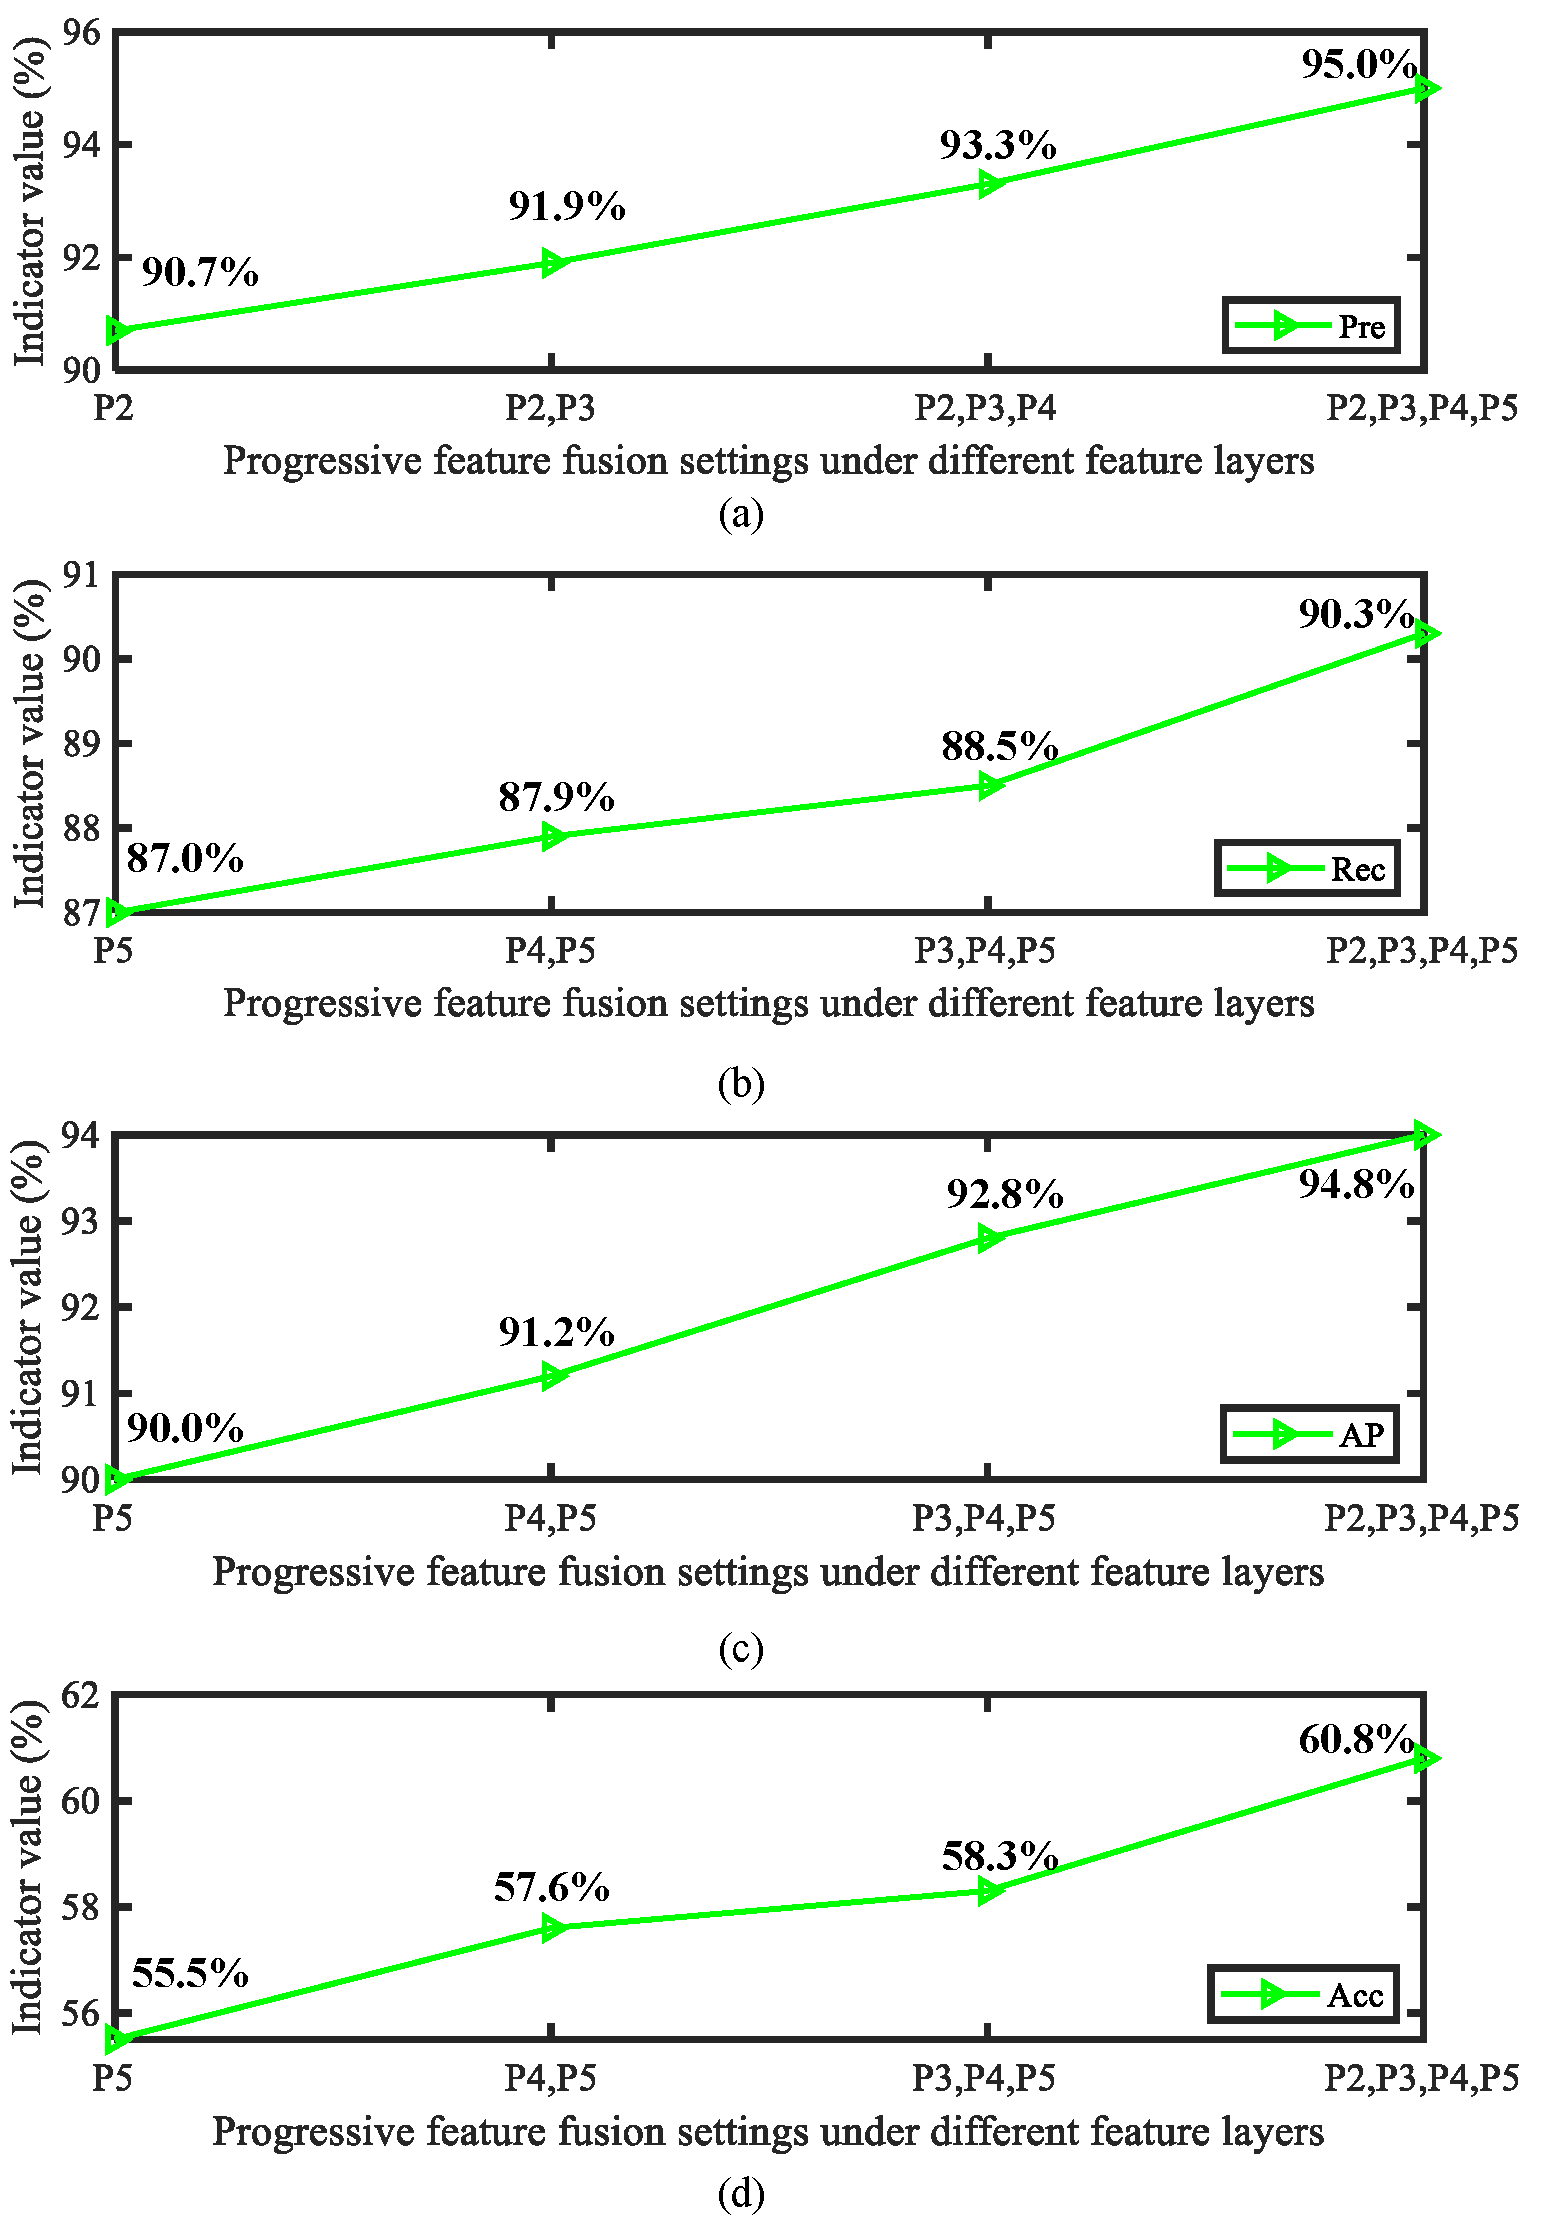
Figure 15.
Analysis of the effect of feature layer fusion quantity on model performance during the progressive feature fusion process: (a) Precision (Pre) indicators, (b) Recall (Rec) indicators, (c) AP indicators, and (d) Acc indicators.
From the above results, it can be observed that frequency domain attention can achieve the highest impact in the P2–P4 layer. From this, it can be concluded that frequency attention plays an important role in the prediction stage of the model. In addition, integrating more feature layers has a positive impact on the model. It is worth noting that increasing the number of attention layers and the number of fused feature layers in the process mentioned above results in a certain amount of additional parameters. Therefore, in practical application processes the dual effects of model accuracy and efficiency need to be considered in order to achieve complete model deployment in a user-friendly form.
4.6. Limitation Discussion
In this paper, we have proposed a progressive frequency-guided deep learning model to solve the defect detection problem under weak features. We have demonstrated the advantages of this method through the extensive experiments and analysis mentioned above. However, the current method has a number of limitations. In the process of defect detection, the accuracy of quantification is essential. Compared to bounding box-based paradigms, pixel-level methods have several advantages. It is worth noting that using the current end-to-end pixel-level segmentation method requires a large amount of pixel-level annotations. Unfortunately, pixel-level annotation requires a significant amount of time and resources. Therefore, in the future we intend to design a bounding box-guided weakly supervised segmentation framework to complete defect quantification tasks. Such a framework can achieve defect quantification while only needing to provide bounding box annotations, which is very meaningful for quantifying casting quality. Furthermore, we intend to utilize continuous learning methods to continuously improve model performance in an incremental manner, enabling the proposed approach to continuously meet practical application needs.
5. Conclusions
In this article, a progressive frequency guided deep model has been proposed to detect defects inside castings using X-ray images. The proposed method effectively overcomes the problem of low detection accuracy caused by weak features through subtle clue mining, progressive feature refinement, and detailed deep regression supervision. We have analyzed the necessity of each module and elaborated on the advantages of the overall framework by comparing it with other methods. Furthermore, the results of our image parameter adjustment experiments demonstrate the robustness of the method under a variety of conditions. In future research, we intend to design a continuous learning method able to continuously evolve the performance of models based on the needs of different scenarios.
Author Contributions
Conceptualization, Y.W.; methodology, F.Z. and Y.W.; software, S.Z., and Z.Z.; validation, F.Z.; data curation, Y.W.; investigation, Y.W.; writing —original draft, Y.W. and F.Z.; writing—review and editing, S.Z.; visualization, Z.Z.; project administration, Z.Z.; supervision, F.Z. All authors have read and agreed to the published version of the manuscript.
Funding
This research was funded by National Natural Science Foundation of China (U21A20481, 61973071).
Data Availability Statement
The data that support the findings of this study are available from the corresponding author upon reasonable request.
Conflicts of Interest
Yingbo Wang is from Company Energy Control Center of Ansteel Group Mining Co., Ltd. The other authors declare no conflict of interest.
References
- Ding, Z.; Zhao, J.; Misra, R.D.K.; Guo, F.; Xie, Z.; Wang, X.; Li, X.; Wang, J.; Shang, C. Deep Learning-Based Understanding of Defects in Continuous Casting Product. Metals 2023, 13, 1809. [Google Scholar] [CrossRef]
- Jung, B.; You, H.; Lee, S. Anomaly Candidate Extraction and Detection for automatic quality inspection of metal casting products using high-resolution images. J. Manuf. Syst. 2023, 67, 229–241. [Google Scholar] [CrossRef]
- Liu, P.; Ding, Z.; Zhang, W.; Ren, Z.; Yang, X. Using Ground-Penetrating Radar and Deep Learning to Rapidly Detect Voids and Rebar Defects in Linings. Sustainability 2023, 15, 11855. [Google Scholar] [CrossRef]
- Gupta, R.; Anand, V.; Gupta, S.; Koundal, D. Deep learning model for defect analysis in industry using casting images. Expert Syst. Appl. 2023, 232, 120758. [Google Scholar] [CrossRef]
- Liu, F.; Zhu, X.; Feng, P.; Zeng, L. Anomaly Detection via Progressive Reconstruction and Hierarchical Feature Fusion. Sensors 2023, 23, 8750. [Google Scholar] [CrossRef] [PubMed]
- Staude, A.; Bartscher, M.; Ehrig, K.; Goebbels, J.; Koch, M.; Neuschaefer-Rube, U.; Nötel, J. Quantification of the capability of micro-CT to detect defects in castings using a new test piece and a voxel-based comparison method. NDT E Int. 2011, 44, 531–536. [Google Scholar] [CrossRef]
- du Plessis, A.; Rossouw, P. X-ray computed tomography of a titanium aerospace investment casting. Case Stud. Nondestruct. Test. Eval. 2015, 3, 21–26. [Google Scholar] [CrossRef]
- Warnett, J.M.; Titarenko, V.; Kiraci, E.; Attridge, A.; Lionheart, W.R.B.; Withers, P.J.; Williams, M.A. Towards in-process X-ray CT for dimensional metrology. Meas. Sci. Technol. 2016, 27, 035401. [Google Scholar] [CrossRef]
- Villarraga-Gómez, H.; Lee, C.; Smith, S.T. Dimensional metrology with X-ray CT: A comparison with CMM measurements on internal features and compliant structures. Precis. Eng. 2018, 51, 291–307. [Google Scholar] [CrossRef]
- Carvalho, R.; Morgado, A.C.; Gonçalves, J.; Kumar, A.; Rolo, A.G.e.S.; Carreira, R.; Soares, F. Computer-Aided Visual Inspection of Glass-Coated Tableware Ceramics for Multi-Class Defect Detection. Appl. Sci. 2023, 13, 11708. [Google Scholar] [CrossRef]
- Wang, L.; Zhang, H.; Liu, J.; Qu, F.; Zuo, F. Defect Size Quantification for Pipeline Magnetic Flux Leakage Detection System via Multilevel Knowledge-Guided Neural Network. IEEE Trans. Ind. Electron. 2023, 70, 9550–9560. [Google Scholar] [CrossRef]
- Li, H.; Wang, X.; Liu, Y.; Liu, G.; Zhai, Z.; Yan, X.; Wang, H.; Zhang, Y. A Novel Robotic-Vision-Based Defect Inspection System for Bracket Weldments in a Cloud–Edge Coordination Environment. Sustainability 2023, 15, 10783. [Google Scholar] [CrossRef]
- Zhang, K.; Wang, S.; Hu, Y.; Yang, H.; Guo, T.; Yi, X. Evaluation Method of Potato Storage External Defects Based on Improved U-Net. Agronomy 2023, 13, 2503. [Google Scholar] [CrossRef]
- Liu, J.; Liu, X.; Qu, F.; Zhang, H.; Zhang, L. A Defect Recognition Method for Low-Quality Weld Image Based on Consistent Multiscale Feature Mapping. IEEE Trans. Instrum. Meas. 2022, 71, 3512911. [Google Scholar] [CrossRef]
- Zuo, F.; Liu, J.; Wang, L.; Qu, F.; Fu, M. Active Learning-Based Complex Pipeline Weld Defect Detection with Lightweight Neural Network. In Proceedings of the 2022 IEEE 11th Data Driven Control and Learning Systems Conference (DDCLS), Chengdu, China, 3–5 August 2022; pp. 712–717. [Google Scholar] [CrossRef]
- Zhang, L.; Zhang, Y.; Dai, B.; Chen, B.; Li, Y. Welding defect detection based on local image enhancement. Image Process. IET 2019, 13, 2647–2658. [Google Scholar] [CrossRef]
- Wang, Y.; Guo, H. Weld Defect Detection of X-ray Images Based on Support Vector Machine. IETE Tech. Rev. 2014, 31, 137–142. [Google Scholar] [CrossRef]
- Boaretto, N.; Centeno, T.M. Automated detection of welding defects in pipelines from radiographic images DWDI. NDT E Int. 2017, 86, 7–13. [Google Scholar] [CrossRef]
- Shen, D.; Liu, X.; Shang, Y.; Tang, X. Deep Learning-Based Automatic Defect Detection Method for Sewer Pipelines. Sustainability 2023, 15, 9164. [Google Scholar] [CrossRef]
- Parlak, İ.E.; Emel, E. Deep learning-based detection of aluminum casting defects and their types. Eng. Appl. Artif. Intell. 2023, 118, 105636. [Google Scholar] [CrossRef]
- Zhou, F.; Chao, Y.; Wang, C.; Zhang, X.; Li, H.; Song, X. A small sample nonstandard gear surface defect detection method. Measurement 2023, 221, 113472. [Google Scholar] [CrossRef]
- Yu, H.; Li, X.; Song, K.; Shang, E.; Liu, H.; Yan, Y. Adaptive depth and receptive field selection network for defect semantic segmentation on castings X-rays. NDT E Int. 2020, 116, 102345. [Google Scholar] [CrossRef]
- Cheng, S.; Lu, J.; Yang, M.; Zhang, S.; Xu, Y.; Zhang, D.; Wang, H. Wheel hub defect detection based on the DS-Cascade RCNN. Measurement 2023, 206, 112208. [Google Scholar] [CrossRef]
- Liu, Y.; Xiao, H.; Xu, J.; Zhao, J. A Rail Surface Defect Detection Method Based on Pyramid Feature and Lightweight Convolutional Neural Network. IEEE Trans. Instrum. Meas. 2022, 71, 5009510. [Google Scholar] [CrossRef]
- Li, J.; Xu, F.; Zheng, X.; Liu, B.; Bai, T.; Tang, Q. Study on the Fracture Evolution Characteristics of Existing Defect Lining under Unsymmetrical Load. Sustainability 2023, 15, 9531. [Google Scholar] [CrossRef]
- Moskovchenko, A.; Svantner, M. Thermographic Data Processing and Feature Extraction Approaches for Machine Learning-Based Defect Detection. Eng. Proc. 2023, 51, 5. [Google Scholar] [CrossRef]
- Tang, J.; Liu, S.; Zhao, D.; Tang, L.; Zou, W.; Zheng, B. PCB-YOLO: An Improved Detection Algorithm of PCB Surface Defects Based on YOLOv5. Sustainability 2023, 15, 5963. [Google Scholar] [CrossRef]
- Jung, H.; Rhee, J. Application of YOLO and ResNet in Heat Staking Process Inspection. Sustainability 2022, 14, 15892. [Google Scholar] [CrossRef]
- Lu, J.; Lee, S.H. Real-Time Defect Detection Model in Industrial Environment Based on Lightweight Deep Learning Network. Electronics 2023, 12, 4388. [Google Scholar] [CrossRef]
- Wang, Y.; Hu, C.; Chen, K.; Yin, Z. Self-attention guided model for defect detection of aluminium alloy casting on X-ray image. Comput. Electr. Eng. 2020, 88, 106821. [Google Scholar] [CrossRef]
- Hu, C.; Wang, Y. An Efficient Convolutional Neural Network Model Based on Object-Level Attention Mechanism for Casting Defect Detection on Radiography Images. IEEE Trans. Ind. Electron. 2020, 67, 10922–10930. [Google Scholar] [CrossRef]
- Tang, Z.; Tian, E.; Wang, Y.; Wang, L.; Yang, T. Nondestructive Defect Detection in Castings by Using Spatial Attention Bilinear Convolutional Neural Network. IEEE Trans. Ind. Inform. 2021, 17, 82–89. [Google Scholar] [CrossRef]
- Jiang, L.; Wang, Y.; Tang, Z.; Miao, Y.; Chen, S. Casting defect detection in X-ray images using convolutional neural networks and attention-guided data augmentation. Measurement 2021, 170, 108736. [Google Scholar] [CrossRef]
- Ni, X.; Ma, Z.; Liu, J.; Shi, B.; Liu, H. Attention Network for Rail Surface Defect Detection via Consistency of Intersection-over-Union(IoU)-Guided Center-Point Estimation. IEEE Trans. Ind. Inform. 2022, 18, 1694–1705. [Google Scholar] [CrossRef]
- Siliang, M.; Yong, X. MPDIoU: A Loss for Efficient and Accurate Bounding Box Regression. arXiv 2023, arXiv:2307.07662. Available online: http://xxx.lanl.gov/abs/2307.07662 (accessed on 7 October 2023).
- Vilar, R.; Zapata, J.; Ruiz, R. An automatic system of classification of weld defects in radiographic images. NDT E Int. 2009, 42, 467–476. [Google Scholar] [CrossRef]
- Mery, D.; Riffo, V.; Zscherpel, U.; Mondragón, G.; Lillo, I.; Zuccar, I. GDXray: The Database of X-ray Images for Nondestructive Testing. J. Nondestruct. Eval. 2015, 34, 1–12. [Google Scholar] [CrossRef]
- Marmanis, D.; Datcu, M.; Esch, T.; Stilla, U. Deep Learning Earth Observation Classification Using ImageNet Pretrained Networks. IEEE Geosci. Remote Sens. Lett. 2016, 13, 105–109. [Google Scholar] [CrossRef]
- Xiao, M.; Yang, B.; Wang, S.; Zhang, Z.; He, Y. Fine coordinate attention for surface defect detection. Eng. Appl. Artif. Intell. 2023, 123, 106368. [Google Scholar] [CrossRef]

Disclaimer/Publisher’s Note: The statements, opinions and data contained in all publications are solely those of the individual author(s) and contributor(s) and not of MDPI and/or the editor(s). MDPI and/or the editor(s) disclaim responsibility for any injury to people or property resulting from any ideas, methods, instructions or products referred to in the content. |
© 2024 by the authors. Licensee MDPI, Basel, Switzerland. This article is an open access article distributed under the terms and conditions of the Creative Commons Attribution (CC BY) license (https://creativecommons.org/licenses/by/4.0/).