Article

Temperature Prediction for 3 MW Wind-Turbine Gearbox Based on Thermal Network Model

1
School of Mechanical Engineering, Dalian Jiaotong University, Dalian 116028, China
2
Dalian Easttop Industrial Equipment Co., Ltd., Dalian 116414, China
*
Author to whom correspondence should be addressed.
Machines 2024, 12(3), 175; https://doi.org/10.3390/machines12030175
Submission received: 18 January 2024 / Revised: 24 February 2024 / Accepted: 1 March 2024 / Published: 4 March 2024
(This article belongs to the Section Turbomachinery)

Abstract

:
Focusing on the investigation of a 3 MW wind-turbine gearbox, this paper’s aim is to address the challenge of turbine shutdown due to the internal oil temperature exceeding its limits. Additionally, there is the difficulty in measuring the internal temperature. To tackle these issues, a thermal network model for the entire gearbox was developed. This model is based on an analysis of the thermodynamic behavior of the three-stage transmission in the wind-turbine gearbox and internal oil-spray lubrication. Through this model, thermal balance equations were established to predict the steady-state temperatures under different operating conditions. This study delved into the calculation methods for the power loss of heat sources in thermodynamic balance equations and the calculation methods for different types of thermal resistance between nodes, forming an adapted computational process. Applying this model, simulated analyses yielded temperatures at various nodes and bearing temperatures under different operating conditions. These results were compared with actual SCADA data, and steady-state thermal simulations of the high-speed stages were conducted, demonstrating the model’s effectiveness in predicting steady-state temperatures for a large-megawatt wind-turbine gearbox. Furthermore, the model-based analysis explored the impact of the oil spray parameters on the gearbox temperature, providing a theoretical foundation for further anticipating overheating malfunctions and optimizing the internal cooling systems.

1. Introduction

Based on statistical data from the People’s Daily, in 2022 [1], China’s wind-power generation capacity surpassed 10 trillion kilowatts for the first time, demonstrating an unstoppable trend in development. The issue of the oil temperature exceeding its limits in gearboxes has become one of the high-frequency faults in wind power generators. Xiang, et al. [2]. conducted a fault analysis investigation on three wind farms, revealing that oil-temperature exceedance faults ranked in the top three among various failures. The monitoring and reliability assessment of wind-turbine gearboxes are currently becoming focal points of research [3].
Due to the frequent occurrence of high-temperature faults, an increasing number of researchers are dedicating their efforts to studying the temperature field of wind-turbine gearboxes. Extensive research and analyses have been conducted by domestic and international scholars, such as Xu and Zhao, detailing the causes of and solutions to the high-temperature issues in wind-turbine gearboxes [4,5,6]; however, these investigations focus on external factors affecting the gearbox temperature field. To enhance preventive measures and mitigate downtime failures caused by high temperatures, researchers have initiated an analysis of internal high-temperature faults in gearbox systems.
Huang, et al. proposed a fault-prediction method based on PCA and SPC-dynamic neural networks for online learning, allowing for the long-term online prediction of wind-turbine-gearbox oil temperature. However, relying solely on lubricating oil temperature for gearbox fault prediction poses the issue of potential failure omission [7]. Gu, et al. introduced a novel approach for fault prediction in wind-turbine gearboxes by segmenting intervals, thereby overcoming the limitations of using a constant lubricating oil temperature as the warning threshold. However, the exclusive consideration of gearbox oil-temperature data during fault prediction [8]. Jing, et al. proposed a method based on KECA-GRNN capable of conducting gearbox condition monitoring, fault prediction, and health assessment, enabling the early prediction of gearbox faults. However, this method only predicts gearbox oil temperature and bearing temperature [9]. He. proposed a method based on the conditional convolutional autoencoder Gaussian mixture model (CCAE-GMM), which addresses the inaccuracies or missed alarms in fault information due to the limited number of sensor variables. This method achieves health assessment and fault prediction for gearbox temperature, power, and wind speed, and provides other information [10].
Although the aforementioned methods enable fault prediction for wind-turbine-gearbox temperature fields, they overly rely on SCADA data, making them susceptible to errors from sensors and other devices themselves. Moreover, they encounter challenges related to high model instability and lack of interpretability.
Utilizing finite element analysis methods for analyzing gearbox temperature fields can help address the aforementioned shortcomings. Song Hai. employed this approach to individually analyze the temperature field of wind-turbine gearbox bearings [11]. Liu [12] conducted an investigation on the steady-state thermal performance of the gearbox. Deshpande [13] utilized this method to predict the temperature of gears in oil-jet lubricated transmissions. In conclusion, the finite element method can accurately predict the temperature distribution of the gearbox. However, finite element modeling entails complexity, necessitates precise boundary conditions, requires significant computational resources, and is less suited for the comprehensive calculation of entire wind-turbine gearboxes.
The method that can simultaneously avoid the drawbacks of the two aforementioned approaches and accomplish the analysis of the temperature distribution in wind-turbine gearboxes is the thermal network approach. Based on internal heating and heat-transfer principles, this method enables the prediction of temperatures for all internal gearbox components while mitigating the risk of prediction errors due to data collection and component inaccuracies. Moreover, it demonstrates a low computational burden, swift processing speed, and robust applicability in forecasting temperatures for large structures such as wind-turbine gearboxes. Therefore, this study opted to employ the thermal network approach for research purposes. The thermal network approach has mature applications in areas such as helicopters [14] and electric cars [15]. X. Dong et al. [2] first introduced this method to the structure of wind-turbine gearboxes, enabling the prediction of internal temperatures for 1.5 MW wind-turbine gearboxes. However, 1.5 MW wind-turbine gearboxes utilize a relatively simplistic spur-gear transmission method, and the thermal network model in their paper does not account for the impact of oil-spray lubrication on the gearbox temperature.
The aforementioned research on the temperature field of wind-turbine gearboxes primarily focuses on 1.5 MW wind power systems. However, with technological advancements, the application of 2 MW and larger, gigawatt-scale wind turbines is becoming more widespread. Moreover, the structures and stress factors of gigawatt-scale wind-turbine gearboxes are more intricate. Gigawatt-scale wind turbines utilize a combination of oil-spray lubrication and splash lubrication in their cooling and lubrication systems, which significantly impacts the gearbox temperature field. Nevertheless, research on temperature fields in gigawatt-scale wind power systems remains relatively scarce at present.
Thus, this paper innovatively establishes a thermal network model suitable for a 3 MW wind-turbine gearbox. In contrast to the 1.5 MW wind turbine, the gearbox of a 3 MW wind turbine employs a triple-stage transmission system, entirely characterized by helical gear transmissions capable of withstanding significant alternating loads, rendering them more structurally complex. Furthermore, the oil-spray system is incorporated into the thermal network model for the first time, resulting in steady-state nodal temperatures and enabling the prediction of gearbox temperatures under various high-temperature conditions. This thermal network model can be applied to gigawatt-scale (exceeding 2 MW) wind-turbine gearboxes with similar transmission structures and lubrication methods. However, it is essential to note that when critical components’ structures differ, corresponding calculation methods need adjustment (such as bearing selection and heat generation methods in the transmission system under different input load conditions). Additionally, this paper investigates the impact of the oil spray parameters on the gearbox steady-state temperatures, providing robust model support for the temperature prediction and design optimization of the cooling and lubrication systems.

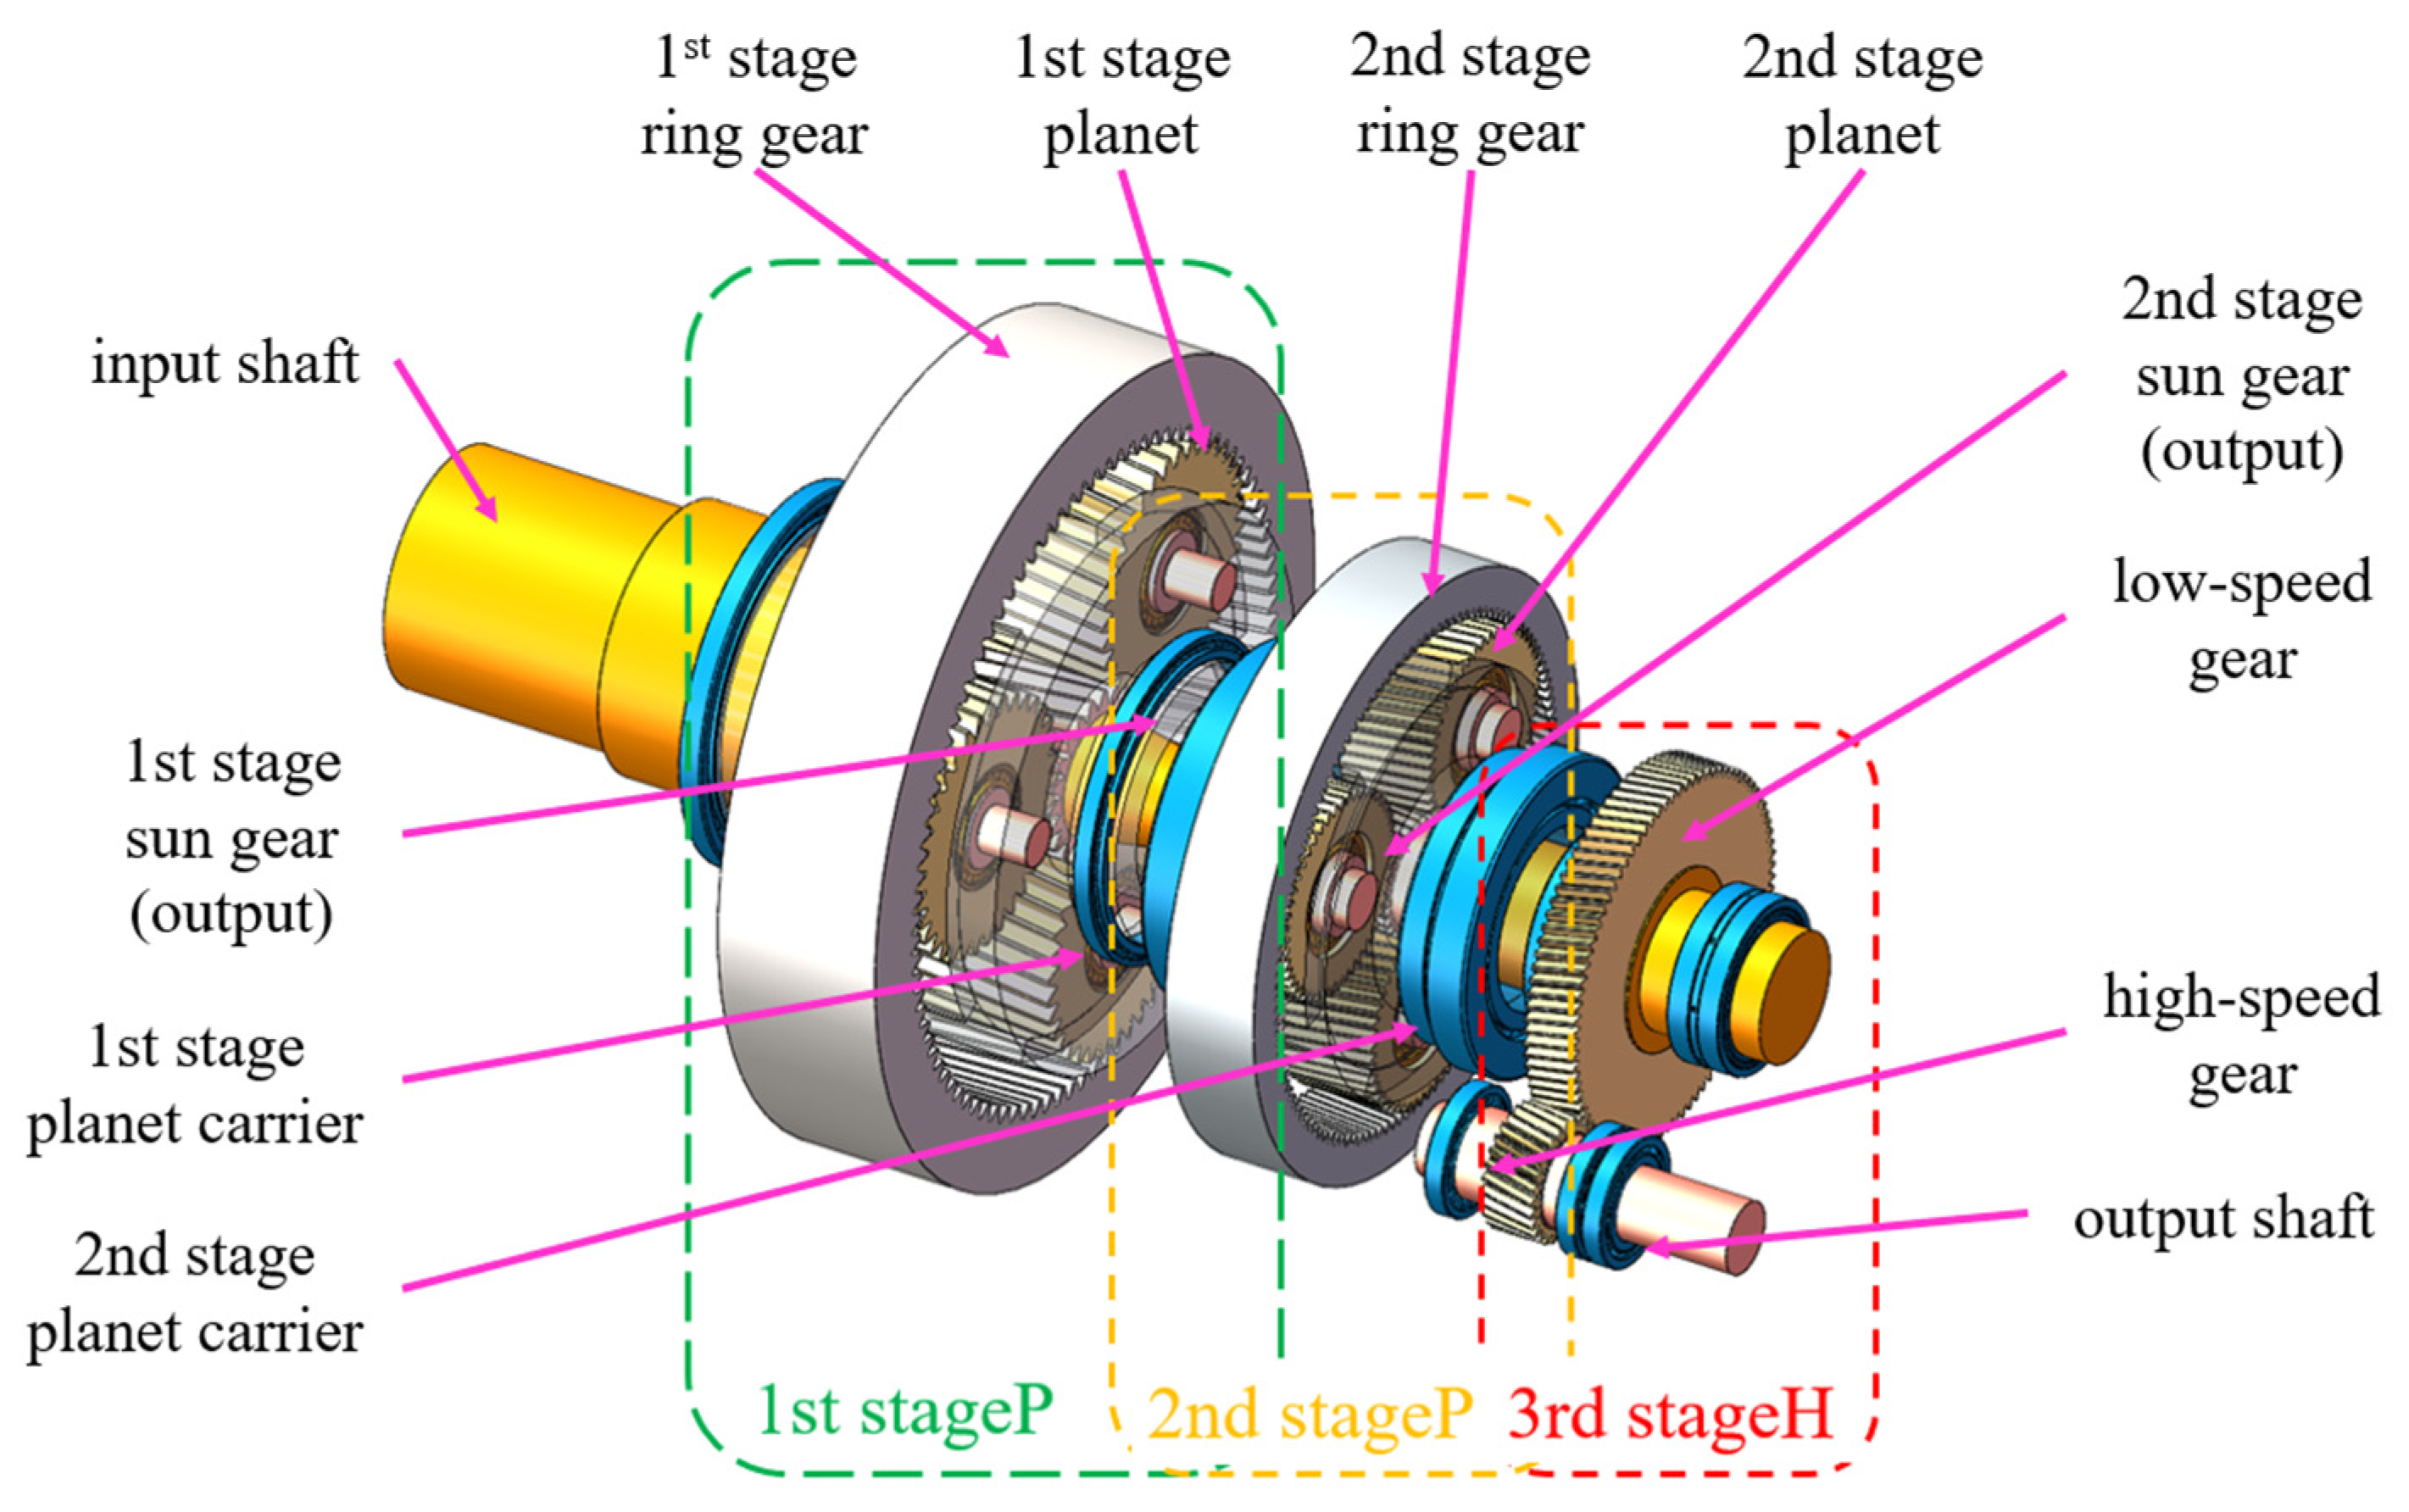
2. Principles of Transmission and Temperature Monitoring in 3 MW Wind-Turbine Gearboxes

The transmission principle of a 3 MW wind-turbine gearbox is illustrated in Figure 1. The transmission system comprises two stages: planetary transmission and high-speed parallel gear transmission.
The generator inputs speed and power to the input shaft, which transmits it to the first planetary carrier. The planetary carrier drives the first planet, and the engagement of the first planet gears with the first sun gear and the first stage ring gear is facilitated. This transmission is conveyed to the next stage through a key integrated with the output shaft, which is also integrated with the sun gear. The second stage follows the same configuration. The third-stage low-speed shaft and the second-stage output shaft engage through a key, receiving speed and torque. Acceleration is achieved through the meshing of a pair of helical gears, ultimately resulting in output through the output shaft. The internal gear and bearing parameters are detailed in Table 1 and Table 2. The bearings are sourced from SKF.
To achieve the real-time monitoring of the operational status of wind turbines, wind farms widely employ SCADA systems for the real-time monitoring of environmental factors (such as wind speed and direction) and turbine data (generator speed, blade angles, etc.). Simultaneously, this system is responsible for compiling and providing real-time feedback on crucial temperature data, including the inlet oil temperature, gearbox temperature, and high-speed shaft bearing temperature. Table 3 below shows an example of SCADA data for a certain enterprise’s mountainous 3 MW wind turbine.

3. Thermal Network Model Construction

3.1. Thermodynamic Analysis of the Interior of a Wind-Turbine Gearbox

In predicting the temperature of the gearbox, establishing a thermal network diagram involves an initial analysis of the internal heat generation and conduction methods [16]. The internal heat within the gearbox originates from three main sources: (1) heat generated during gear meshing due to sliding and rolling friction; (2) heat generated by the relative sliding and rolling friction of the internal rollers, the inner and outer rings of the bearings, and the structure of the cage; and (3) heat generated during the transmission process due to the movement of gears and bearings stirring the lubricating oil. However, in large-megawatt gearboxes, this heat generation is negligible, and it is disregarded in this study.
Internal heat propagation within the gearbox occurs through three main mechanisms: thermal conduction, convective heat transfer, and thermal radiation. However, due to the compact structure of the gearbox internals and the minimal temperature differences between components, this study focuses on analyzing the significant impacts of thermal conduction and convective heat transfer on overall heat propagation. Thermal conduction occurs between various contacting components inside the gearbox, including meshing gears, bearings, and their contacting shafts. Convective heat transfer primarily occurs through natural convection between air and the gearbox casing and forced convection between the internal lubricating oil and components such as gears and bearings.

3.2. Node Selection and Thermal Network Diagram Construction

The thermal network method, based on circuit computing principles, divides the gearbox into a finite number of nodes, forming a node network. Nodes are interconnected through thermal resistance values, and thermal balance equations are established based on the node network. The system’s temperature distribution is then obtained by solving these equations [16].
Therefore, the accuracy of the final results is critically dependent on the careful selection of the nodes. An excessive node density can increase computational complexity, while an overly sparse node selection may compromise precision. Considering the research objectives and the desired accuracy of the results, this study opted for 48 nodes. Detailed information is provided in Table 4 and Figure 2.
The distribution of nodes is illustrated in Figure 2.
Based on the node selection and the analysis of heat-transfer relationships between nodes, the thermal network diagram of the gearbox was created. As illustrated in Figure 3, node 16, representing the first-stage sun gear, is connected to node 12 through heat conduction. Moreover, it is linked to node 15 through heat transfer between meshing gear pairs and to node 3 through thermal convection with lubricating oil. Due to the complexity of the gearbox model, it was divided into first-stage planetary gear transmission, second-stage planetary gear transmission, and third-stage parallel transmission for precise calculations. The thermal network diagrams for each are detailed in Figure 3, Figure 4 and Figure 5.

3.3. Formulation and Solution of the Thermal Equilibrium Equations at the Nodes

The thermal network model incorporates the concepts of thermal resistance and thermal capacitance. Utilizing Kirchhoff’s law and the law of conservation of heat, the system of node heat balance equations, as shown in Equation (1), was formulated. The left-hand side of the equation represents the aggregate heat input from sources and the thermal exchange between nodes, while the right-hand side illustrates the heat absorbed by the nodes. For the case of steady-state temperatures, the right side of the equation is set to zero.
q n V n + j f ( T j i ) f ( T n i ) R j n = C n T n i + 1 T n i Δ t
Derived from an internal thermodynamic analysis of the gearbox and guided by the thermal network diagram illustrated in Figure 3, Figure 4 and Figure 5, a steady-state thermal equilibrium equation was established. The thermal equilibrium equations for the first-stage low-speed planetary transmission, the second-stage planetary transmission, and the third-stage high-speed transmission are expressed as follows (Equations (2)–(4)).
The meanings of all symbols in this paper’s formulas are listed in Table 5.
The thermal equilibrium equations for the first-stage planetary gear transmission are as follows:
0 = T 4 T 1 R 1 4 + T 19 T 4 R 4 19 + T 5 T 4 R 4 5 0 = T 5 T 3 R 3 5 + T 9 T 5 R 5 9 + T 18 T 5 R 5 18 T 5 T 1 R 1 5 T 5 T 4 R 4 5 0 = T 6 T 3 R 3 6 + T 10 T 6 R 6 10 + T 8 T 6 R 6 8 + T 15 T 6 R 6 15 0 = T 7 T 17 R 7 17 + T 10 T 7 R 7 10 T 7 T 14 R 7 14 0 = Q 8 T 8 T 9 R 8 9 T 8 T 6 R 6 8 0 = T 9 T 3 R 3 9 T 9 T 5 R 5 9 T 9 T 1 R 1 9 + T 8 T 9 R 8 9 T 9 T 11 R 9 11 0 = Q 10 T 10 T 7 R 7 10 T 10 T 6 R 6 10 T 10 T 3 R 3 10 0 = T 11 T 3 R 3 11 + T 9 T 11 R 9 11 T 11 T 1 R 1 11 + T 21 T 11 R 11 21 0 = T 16 T 12 R 12 16 + T 32 T 12 R 12 32 0 = Q 13 T 13 T 3 R 3 13 T 13 T 20 R 13 20 T 13 T 14 R 13 14 0 = T 14 T 3 R 3 14 + T 7 T 14 R 7 14 + T 13 T 14 R 13 14 T 14 T 17 R 14 17 0 = Q 15 T 15 T 16 R 15 16 T 15 T 6 R 6 15 0 = T 16 T 3 R 3 16 T 16 T 12 R 12 16 + T 15 T 16 R 15 16 0 = T 7 T 17 R 7 17 + T 14 T 17 R 14 17 + T 18 T 17 R 17 18 T 17 T 3 R 3 17 T 17 T 19 R 17 19 0 = Q 18 T 18 T 3 R 3 18 T 18 T 5 R 5 18 T 18 T 17 R 17 18 0 = T 17 T 19 R 17 19 T 19 T 4 R 4 19
The thermal equilibrium equations for the second-stage planetary gear transmission are delineated as follows:
0 = T 25 T 1 R 1 25 T 25 T 3 R 3 25 T 25 T 21 R 21 25 T 25 T 34 R 25 34 + T 22 T 25 R 22 25 0 = T 13 T 20 R 13 20 + T 33 T 20 R 20 33 0 = T 21 T 3 R 3 21 + T 11 T 21 R 11 21 T 21 T 1 R 1 21 + T 25 T 21 R 21 25 0 = T 22 T 24 R 22 24 T 22 T 25 R 22 25 0 = Q 23 T 23 T 3 R 3 23 T 23 T 24 R 23 24 T 23 T 26 R 23 26 0 = T 24 T 3 R 3 24 + T 23 T 24 R 23 24 + T 22 T 24 R 22 24 + T 30 T 24 R 24 30 0 = T 23 T 26 R 23 26 T 26 T 32 R 26 32 T 26 T 29 R 26 29 0 = T 31 T 27 R 27 31 T 27 T 44 R 27 44 0 = Q 28 T 28 T 3 R 3 28 T 28 T 29 R 28 29 T 28 T 34 R 28 34 T 28 T 47 R 28 47 0 = T 29 T 3 R 3 29 + T 26 T 29 R 26 29 + T 28 T 29 R 28 29 T 29 T 32 R 29 32 T 29 T 44 R 29 44 0 = Q 30 T 30 T 24 R 24 30 T 30 T 31 R 30 31 0 = T 31 T 3 R 3 31 T 31 T 27 R 27 31 + T 30 T 31 R 30 31 0 = T 32 T 12 R 12 32 + T 26 T 32 R 26 32 + T 29 T 32 R 29 32 + T 33 T 32 R 32 33 T 32 T 3 R 3 32 0 = Q 33 T 33 T 3 R 3 33 T 33 T 20 R 20 33 T 33 T 32 R 32 33 0 = T 34 T 3 R 3 34 T 34 T 1 R 1 34 + T 28 T 34 R 28 34 + T 25 T 34 R 25 34 + T 35 T 34 R 34 35 + T 38 T 34 R 34 38
The thermal equilibrium equations for the third-stage parallel transmission are as follows:
0 = Q 43 T 43 T 3 R 3 43 T 43 T 44 R 43 44 T 43 T 47 R 43 47 0 = T 27 T 44 R 27 44 + T 29 T 44 R 29 44 + T 43 T 44 R 43 44 + T 48 T 44 R 44 48 T 44 T 45 R 44 45 0 = T 44 T 45 R 44 45 + T 46 T 45 R 45 46 0 = Q 46 T 46 T 3 R 3 46 T 46 T 38 R 38 46 T 46 T 45 R 45 46 0 = T 47 T 1 R 1 47 + T 43 T 47 R 43 47 + T 28 T 47 R 28 47 0 = T 48 T 3 R 3 48 + T 42 T 48 R 42 48 T 48 T 44 R 44 48 0 = Q 35 T 35 T 3 R 3 35 T 35 T 34 R 34 35 T 35 T 37 R 35 37 0 = T 36 T 3 R 3 36 T 36 T 37 R 36 37 + T 42 T 36 R 36 42 0 = T 35 T 37 R 35 37 + T 36 T 37 R 36 37 + T 39 T 37 R 37 39 + T 41 T 37 R 37 41 T 37 T 40 R 37 40 0 = T 38 T 1 R 1 38 T 38 T 3 R 3 38 + T 39 T 38 R 38 39 + T 41 T 38 R 38 41 + T 46 T 38 R 38 46 T 38 T 34 R 34 38 0 = Q 39 T 39 T 3 R 3 39 T 39 T 37 R 37 39 T 39 T 38 R 38 39 0 = T 40 T 1 R 1 40 + T 37 T 40 R 37 40 0 = Q 41 T 41 T 3 R 3 41 T 41 T 37 R 37 41 T 41 T 38 R 38 41 0 = Q 42 T 42 T 36 R 36 42 T 42 T 48 R 42 48
Nodes 1, 2, and 3 represent the steady-state temperature values of the internal and external air of the gearbox and the gearbox oil temperature. These values can be provided through SCADA data and used as inputs for solving the steady-state heat balance equations, enhancing the practicality and interpretability of the equations.
Utilizing a first-order steady-state iteration method to solve the above balance equations, the calculation of the steady-state temperature field is simplified. The heat balance equations are organized, and in matrix form, they are expressed as follows:
[ A ] × [ T ] = [ Q ] [ Z ]

4. Calculation of Parameters for Steady-State Temperature Solution of the Gearbox

4.1. Analysis and Calculation of Gear Meshing Power Loss

The 3 MW wind-turbine gearbox employs a helical gear transmission. Based on the working principle of helical gear meshing, the frictional losses generated during gear meshing include both rolling friction loss and sliding friction loss. This loss is converted into heat energy. Various methods can be used to calculate the heat generated by gear meshing, including HOHN, ISO-recommended algorithms, and the Anderson–Loewenthal method. The Anderson–Loewenthal method has a broad calculation range, fewer limitations, and is suitable for the diverse gear transmission calculations in this paper, considering the large load, complex structure, and various transmission forms [17].
(1)
Calculation formulas for sliding friction loss in gear meshing.
Formula for calculating the length of the meshing line:
g t = r a 1 2 r b 1 2 0.5 + r a 2 2 r b 2 2 0.5 r 1 + r 2 sin α t
Formulas for calculating the average sliding velocity and average rolling velocity:
V S = 0.02618 n 1 g t z 1 + z 2 / z 2 V T = 0.2094 n 1 r 1 sin α t 0.0261 n 1 g t z 2 z 1 / z 2
Formula for calculating the average normal load:
F n = T 1 / r 1 cos α t cos β b
Formula for calculating the friction coefficient:
f = 0.0127 lg 29.66 F n cos β b b μ o V s V T 2  
Formula for calculating the average sliding loss:
P s = f   F n   V s   /   1000
(2)
Formulas for calculating meshing rolling friction loss.
Curvature radius calculation formula:
ρ r = r 1 sin α t + 0.25 g t r 2 sin α t 0.25 g t r 1 + r 2 sin α t cos β b
Formula for calculating the oil film thickness:
h = 2.051 10 7 V T μ o 0.67 F n 0.067 ρ r 0.464
Formula for calculating the overlap ratio:
ε α = 1000 g t / π m t cos α t
Formula for calculating the average rolling loss:
P R = 90000 V T h b ε α / cos β b
Summing up, the total power loss of gear meshing can be calculated:
P = P S + P R

4.2. Analysis and Calculation of Bearing Operating Power Loss

The bearing parameters of the gearbox are shown in Table 2 above, and the distribution of the bearings is illustrated in Figure 2. The bearings are sourced from SKF, which has summarized experience-based formulas for bearing calculations applicable to its products [18]. Internal friction in rolling bearings can be divided into internal sliding friction and internal rolling friction. For example, at the contact between the thrust collar of the inner ring and the large end of the tapered roller in a tapered roller bearing, due to the different speeds of revolution and rotation of the roller, varying degrees of sliding friction are generated. Under a significant axial load, this type of friction can cause considerable harm. Additionally, the friction between the roller, inner and outer rings, and the cage also generates a considerable amount of heat [19,20]. Therefore, the heat generated by bearing friction has a significant impact on the gearbox temperature. The calculation method is shown in Formula (16).
P B E A R I N G = M b n b 1000 × 9549 M b = M r r + M s l + M seal   + M d r a g M r r = ϕ i s h ϕ r s G r r v o i l n b 0.6 ϕ i s h = 1 1 + 1.84 × 10 9 n b d m 1.28 v o i l 0.64 d m = 0.5 ( d + D ) ϕ r s = e K r s v o i l n b ( d + D ) K z 2 ( D d ) 1 M s l = G s l μ s l

4.3. Calculation of Thermal Resistance and Convective Heat-Transfer Coefficient

4.3.1. Calculation of Thermal Conductive Resistance

The thermal conduction between the components is mainly divided into plane thermal conduction and cylindrical-wall thermal conduction. In this paper, plane thermal conduction exists between the nodes of the gearbox body itself, between the planetary gears, and between the input shaft nodes. Cylindrical-wall thermal conduction exists between the gears, bearings, shafts, and circumferentially contacting surfaces. The calculation methods are as follows:
Plane thermal conductive resistance:
R = l λ S A
Cylindrical-wall thermal conductive resistance:
R = 1 2 π λ S l ln r 2 r 1
Gear-mesh thermal conductive resistance:
R = 0.767 k 1 l h k v b

4.3.2. Calculation of Convective Heat Transfer Resistance [21]

The convective heat transfer within the gearbox involves thermal exchange processes among air, the casing, internal lubricating oil, and various structural components. Due to the substantial power losses and high heat generation within the wind-turbine gearbox, compounded by its enclosed environment, dissipating heat becomes a formidable challenge. Consequently, the lubrication and cooling of the internal components are accomplished through two methods: oil-spray lubrication and splash lubrication. In the multi-megawatt wind-turbine gearbox, oil injection ports are integrated into the gear meshing and bearing positions for lubrication. The 3 MW wind-turbine gearbox comprises seven gear oil-injection points and fourteen bearing oil-injection points. According to the diagrams provided by the company, the diameter of the gearbox oil-injection ports in this study is 2.5 mm. MOBIL 320 oil with a density of 860 Kg/m3 is used for lubrication. The total lubricant flow rate amounts to 285 L per minute. The calculation methods for the convective heat-transfer coefficients of each component are outlined as follows:
(1)
Convective heat transfer between the casing outer wall and air.
The casing is simplified as a uniformly heated cylindrical structure, and convective heat exchange with air is modeled as self-heating convection with a uniformly heated vertical plate structure.
Calculation of the convective heat-transfer coefficient between air and the cylindrical surface:
h = N u λ a L ( W / m 2 · k ) N u = 0.6 + 0.387 G r Pr 1 / 6 1 + ( 0.599 / Pr ) 9 / 16 8 / 27 2
Convective heat-transfer coefficient between air and the uniformly heated vertical surface:
N u = 0.825 + 0.387 G r Pr 1 / 6 1 + ( 0.492 / Pr ) 9 / 16 8 / 27 2
Comprehensive thermal resistance formula:
R = H 1 A 1 H 2 A 2 H 1 A 1 + H 2 A 2
(2)
Convective heat transfer computation for the bearings and lubricating oil.
In this design, the bearings encompass various types, including cylindrical roller bearings, tapered roller bearings, angular contact ball bearings, and deep groove ball bearings. In the calculation, the bearings are treated holistically as a singular node. Consequently, in the convective heat transfer computation, the bearings are considered a unified entity, eliminating the need for separate calculations for the inner ring, outer ring, and rolling elements.
Tapered roller bearing:
h = 0.0986 n v ± n v d 0 cos θ d m 1 / 2 K oil   P r 1 / 3
Plain bearing:
h = 0.332 K oil   Pr 1 / 3 u s v x 1 / 2
(3)
Heat transfer resistance between the gears and lubricating oil.
For rapidly rotating gears, the prudent design of the internal lubrication system is of paramount importance due to the substantial heat generation and the relative challenges associated with lubrication. Essential factors such as the position, diameter, and angle of the oil injection nozzles play a critical role in effectively reducing the gear temperature and providing the necessary lubrication. Concurrently, the rotational motion of the gears agitates the lubricating oil, achieving a splash lubrication effect. The calculation of the average convective heat transfer coefficient on the gear surface follows a specific formula, while the convective heat transfer coefficient on the side of the larger gear is computed based on the fluid-swept surface [14].
h = 3326.9 + 2033.418 S 0.3317 + 69.345 v j + 10253.724 A 1 0.2979 0.00666 θ 3 + 0.706 θ 2 + 14.36 θ
(4)
Casing and lubricating oil convective heat transfer calculation.
During the operation of the gears, the lubrication and heat exchange processes of the casing and internal lubricating oil can be represented by a simplified model of heat-fluid sweeping over a uniformly heated plate. This streamlined model takes into account the heat exchange between the lubricating oil and the inner walls of the casing during the agitation of the lubricating oil [22].
h l = 0.664 ( u oil l v oil   ) 1 / 2 Pr 1 / 3 k oil l h d = 0.664 ( u oil d v oil ) 1 / 2 Pr 1 / 3 k oil d R = H 1 A 1 H 2 A 2 H 1 A 1 + H 2 A 2

5. Steady-State Temperature Calculation and Result Validation in the Gearbox

5.1. Programming Calculation and Results

Utilizing the SCADA data from a high-altitude wind farm of a certain enterprise, the steady-state oil temperature, air temperature inside the nacelle, and air temperature inside the gearbox, as well as the high-speed bearing temperature data, can be obtained. Taking the steady-state oil temperature and gearbox temperature during the high-temperature months of June to August as input values for six actual operating conditions, the conditions are detailed in Table 6. Based on this, employing a first-order steady-state iterative method for solving the balance equation system (Equations (2)–(4)), the computed results are depicted in Figure 6.
Analyzing the results from Figure 6 reveals that high-temperature nodes are predominantly concentrated at the third-stage high-speed position. The temperature at nodes 35 to 48, corresponding to the third high-speed position, is on average 3.4 to 3.6 °C higher than the nodes of the other two stages of transmission. This is because the third-stage transmission is primarily responsible for acceleration, resulting in higher gear and bearing speeds, intensified friction, and, consequently, higher heat generation compared to other locations within the gearbox. The downwind bearing position in the high-speed stage (node 41) attains the highest rotational speeds, and its proximity to other heat-generating points in the third stage makes heat dissipation challenging. Consequently, this node experiences the highest temperature and is the most susceptible location to the occurrence of high-temperature faults. The high-temperature position in the first stage occurs at the meshing point of the planetary and sun gears (node 15), which endure significant input loads. Failure at this location incurs substantial replacement and maintenance costs.
Analyzing the overall temperature distribution, except for the external air node temperatures, other node temperatures stabilize between 50 and 70 °C. Furthermore, under various operating conditions, the temperature distribution trends remain consistent. High-temperature nodes act as heat sources, resulting in a trend where temperatures decrease to varying degrees from the heat source, following the heat propagation pattern. The temperatures predicted by the thermal network model in this paper conform to the flow patterns of heat propagation within the gearbox.

5.2. Comparative Validation of the Thermal Network Model’s Efficacy

To validate the efficacy of the thermal network model in predicting the temperature of the 3 MW wind-turbine gearbox, a comparison was made between the model’s output parameters and the actual steady-state operating parameters from the wind farm’s SCADA data. For validation, SCADA data from the high-temperature months of June, July, and August 2021 were selected. Each month, a stable operating day with continuous data points collected at 10 min intervals was chosen, resulting in a total of 312 data sets for comparison.
Due to the challenges in installing internal sensors in the gearbox, actual data included only output parameters such as the input-side bearing temperature, output-side bearing temperature, gearbox oil temperature, and ambient air temperature inside the nacelle. The gearbox oil temperature and nacelle air temperature were used as input values for the model, and the output-side bearing temperature served as the data for the validation and comparison. Figure 7, Figure 8 and Figure 9 below illustrate the comparison results between the model’s predicted bearing temperature and the actual SCADA data for the output-side bearing temperature.
Comparing the aforementioned 312 sets of data, it is observed that the average error falls within the range of 1 to 4 °C. Furthermore, during periods of stable input temperatures, the average error narrows to 1 to 2 °C. However, when the input temperature undergoes significant changes, the error tends to increase, yet it remains below 4 °C at its maximum. At 11:39, as depicted in Figure 8, the effective power of the turbine drops to 0. At this moment, the temperature deviation reaches its peak for the day, reaching 4 °C. Subsequently, the turbine begins to slowly decelerate, and the deviation stabilizes within the range of 0 to 2.2 °C.
Analysis of the potential error sources reveals two main aspects:
(1)
Errors stemming from the node simplification: The thermal network model simplifies components like gear bearings into ideal nodes for computation. In practical scenarios, heat generation points in bearing positions may be at the contact points of rollers and other components, whereas the thermal network model treats the entire bearing node as a heat source.
(2)
Errors arising from the lubrication system simplification: In actual lubrication processes, the lubricating oil flows out of the gearbox for secondary cooling. Moreover, the lubricating oil temperatures at different positions in the gearbox should be varied, and the oil-spray quantities should be adjusted in real time based on the gearbox temperature conditions. However, for computational efficiency, the thermal network model simplifies the lubricating oil temperature and spray parameters as ideal conditions.
Considering the above, the overall error is within a reasonable range, Furthermore, the refinement of the thermal network model at critical research positions can help reduce the aforementioned errors. The thermal network model proves effective in predicting the steady-state temperature of a large-megawatt wind-turbine gearbox in practical operations.

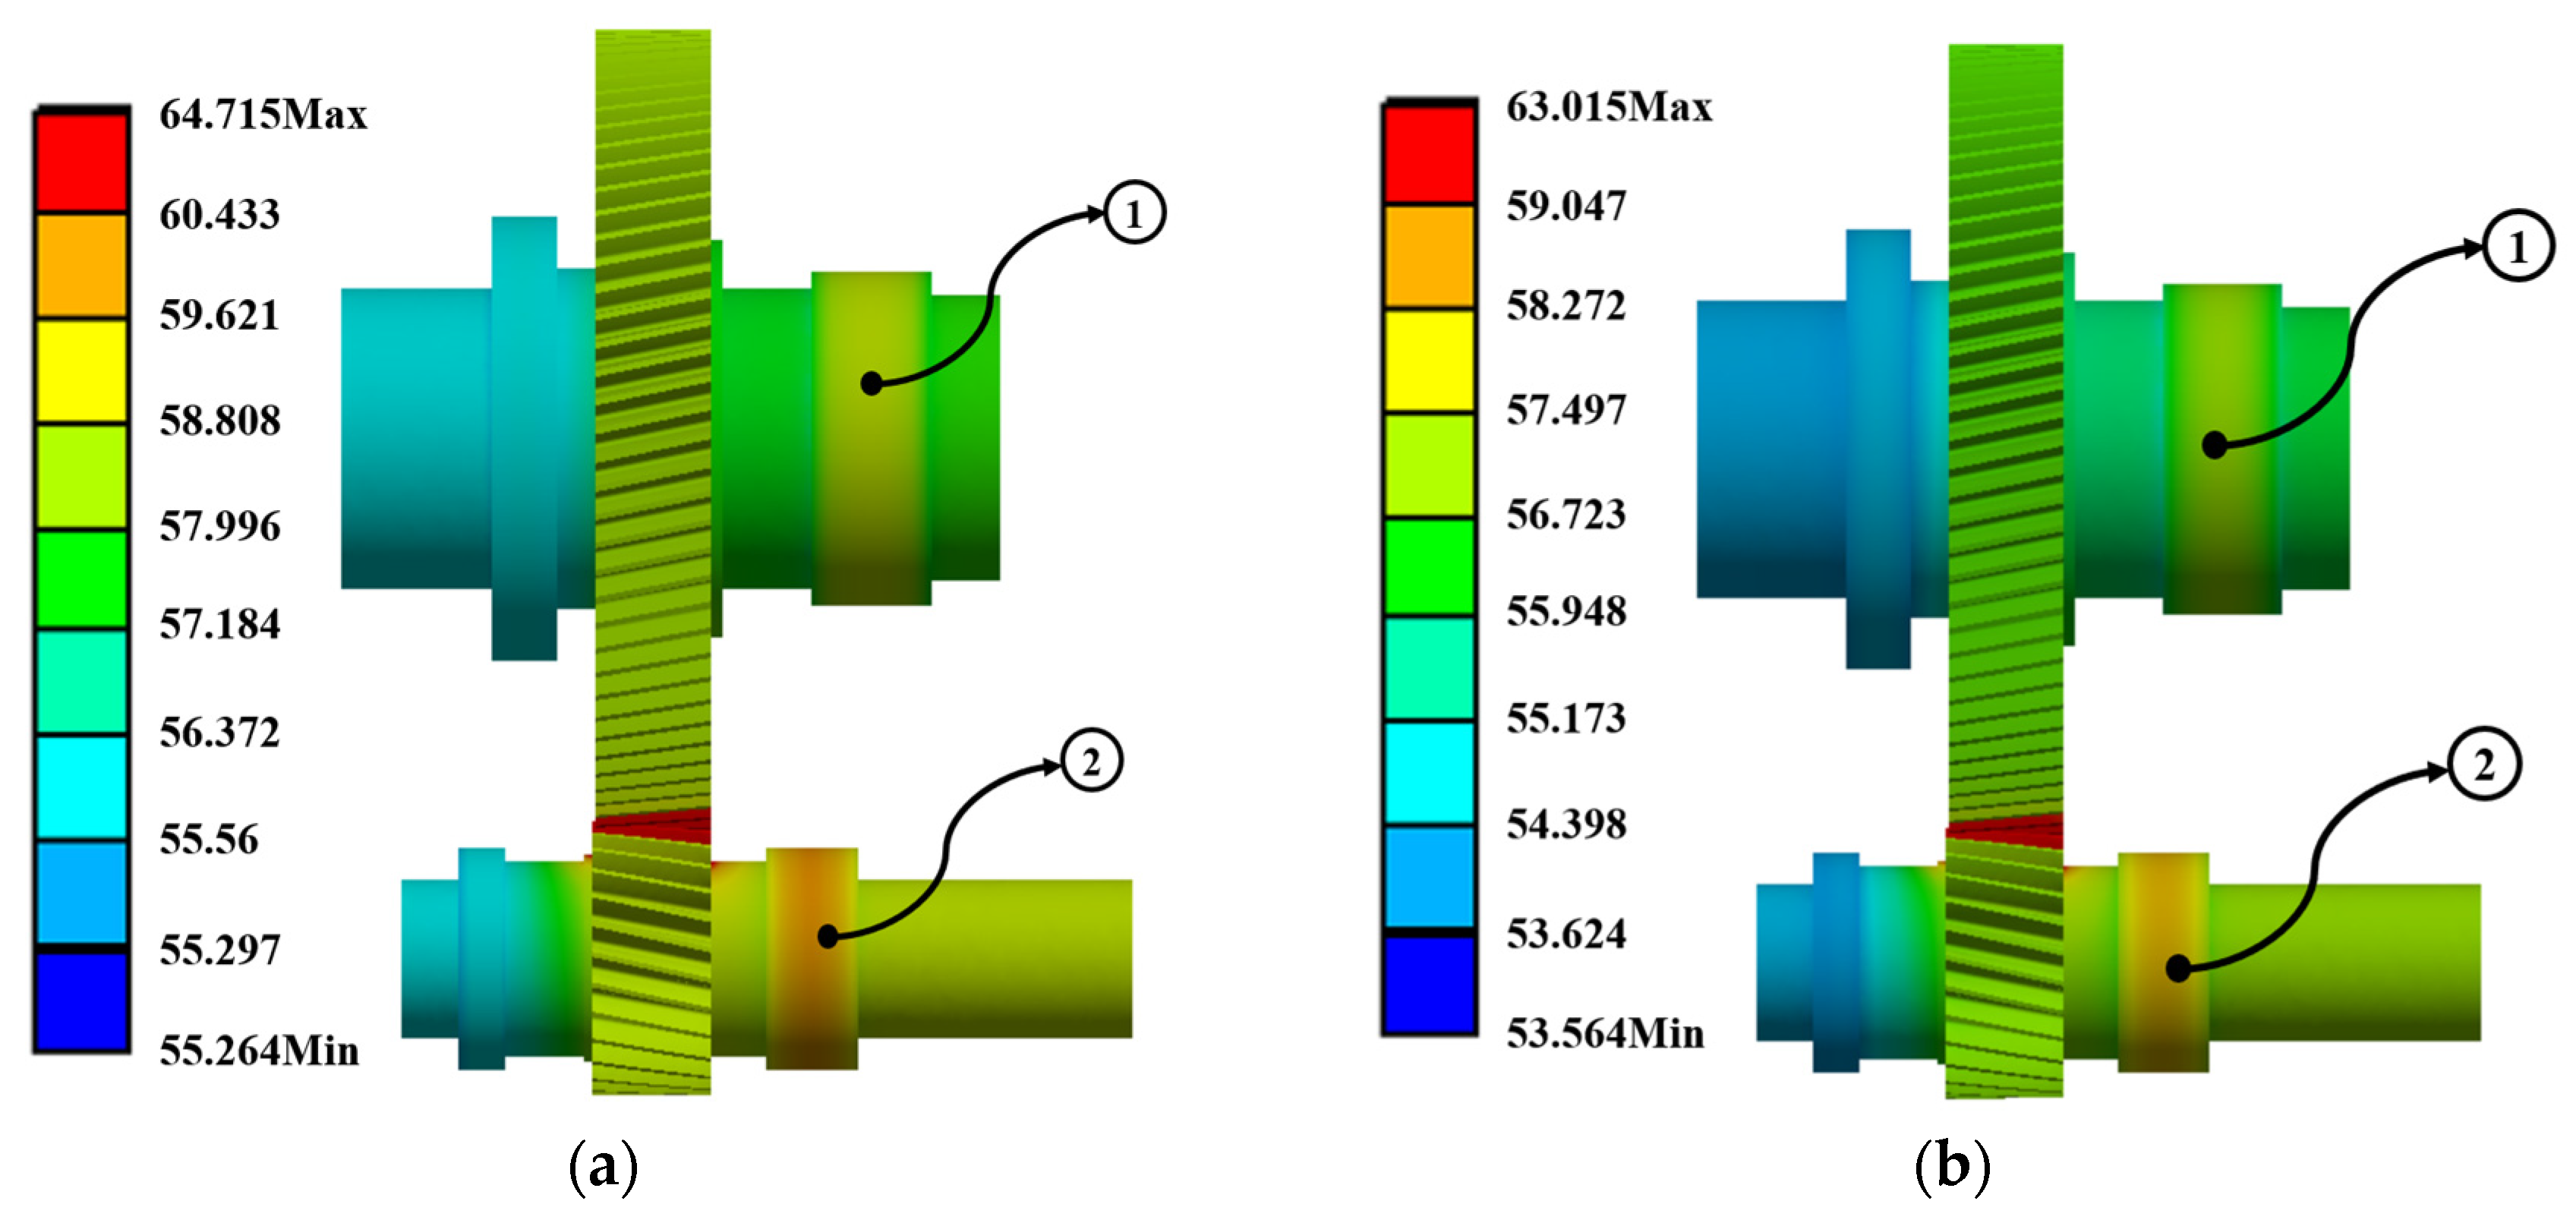
5.3. Finite Element Simulation Validation of the Thermal Network Model’s Efficacy

However, comparison with SCADA data can only validate the temperature predictions for the output shaft bearing at this particular node position. Thus, the study of the internal temperature distribution within the gearbox cannot be verified through comparison with SCADA data alone. Therefore, this paper employs finite element analysis to analyze the temperatures of the internal gearbox nodes, allowing for a comparative analysis with the results obtained from the thermal network model. This approach validates the effectiveness of temperature predictions for other internal nodes. Due to the extensive computational requirements and high-performance demands on computing resources, this study focuses solely on the simulation of the steady-state temperature field in the high-speed gear transmission area where temperatures are elevated.
The purpose of the simulation is to verify the consistency between the steady-state temperature field within the gearbox and the thermal network model. This encompasses the temperature distribution and magnitude during steady-state conditions. Given the omission of dynamic considerations for the rotational motion of gear engagement, the simulation uniformly distributes the heat generated by gear engagement as a heat flux on the gear surfaces. Additionally, it applies the theoretically calculated heat flux at the points of gear engagement. In the thermal network method, bearings are treated as nodes, simplifying the bearing model to a circular ring, with heat flux applied to the geometric body. Considering the heat exchange processes between the lubricating oil, gears, and bearings, convective heat transfer is applied to the outer surface of the bearing, gear engagement surfaces, and side surfaces, with numerical values based on theoretical calculations. Material definitions and parameters for the shaft, gears, and bearings were established, with the initial temperature set at the ambient temperature of 22 °C. The simulation was conducted for the steady-state temperature field under the operating conditions specified in Table 6.
As depicted in Figure 10, under various operating conditions, the highest internal temperatures occur at the gear meshing positions and the downwind bearing position of the high-speed stage (Point 2). Conversely, the lowest temperature manifests at the upwind bearing position of the low-speed stage (node 43).
Upon analyzing the results depicted in Figure 10, it is observed that the average temperature at Point 2 exceeds that of the lower temperature positions by 10 °C. This temperature disparity suggests the following potential causes for the elevated temperatures: The high heat generation at the downwind bearing of the high-speed stage stems from the fact that the highest speed in the third-stage transmission resides at the output end. Additionally, the downwind bearing bears significant inclined gear meshing forces, resulting in heightened heat generation. Similarly, the temperature of the low-speed downwind bearing (Point 1) averages 4 to 5 °C higher than that of the upwind bearing. Furthermore, the heat generation points in the high-speed section are denser than those in the low-speed section, and heat transfers occur between these points, thereby elevating the temperature of the high-speed section above that of the low-speed section.
The observed temperature variation trend and distribution align with the results obtained from the thermal network model, validating its effectiveness in predicting the overall gearbox temperature. However, the simulated temperatures at each bearing location notably fall below the predicted values of the thermal network model, while the temperatures at the high-speed section nodes exceed the predicted values. Table 7 below records the simulated temperatures of the downwind bearing of the high-speed stage (Point 1), the downwind bearing of the low-speed stage (Point 2), and the maximum and minimum temperatures of the third-stage transmission.
Analyzing the discrepancies between the simulation and the thermal network model reveals that in the thermal network model, the bearing is considered a singular node endowed with a heat source. However, the thermal resistance is computed based on the actual heat-transfer area of the bearing. In the finite element simulation, the heat source is uniformly applied to the entire bearing geometry through heat flux, and the convective heat transfer coefficient is assigned to all bearing outer surfaces based on theoretical calculations. This results in an average temperature at the bearing position that is lower than that of the thermal network model. Furthermore, the simulation does not account for the heat conduction between the housing and various components, leading to an increase in temperature at some nodes.
Setting the same boundary conditions as the thermal network model in the finite element simulation is challenging, making it difficult to precisely reflect the temperature at various nodes in the gearbox. However, the overall temperature distribution trend aligns with thermal equilibrium principles and corresponds with the results of the thermal network model. This effectively validates the efficacy of the thermal network model in predicting the temperature of the 3 MW wind-turbine gearbox.

5.4. Conclusion of Thermal Network Model Verification

Based on the temperature predictions for different operating conditions obtained from Section 5.1, the analysis reveals that high-temperature nodes within the gearbox are concentrated in the third stage of the high-speed transmission section. Node 41 and node 15 are identified as the most susceptible locations to high-temperature faults within the gearbox. Therefore, in the actual process of optimizing gearbox structure and designing internal lubrication cooling systems, targeted improvements should be made based on the predictive results. Additionally, health monitoring devices should be installed at these node positions.
In Section 5.2, by juxtaposing the numerical values of the output shaft bearing temperature extracted from the SCADA data of the 3 MW wind-turbine gearbox, the thermal network model’s accuracy in predicting node temperatures can be corroborated. Furthermore, the data analysis in Section 5.2 indicates that to minimize predictive errors in this model, it is imperative to analyze the wind turbine when it has reached a stable operational state or is undergoing gradual changes.
In Section 5.3, by conducting a thorough comparison with the steady-state temperature field simulation of the high-speed gear transmission using finite element analysis, the model’s effectiveness in predicting the overall temperature distribution is confirmed. Additionally, an analysis of the root causes of high temperatures in the nodes of the high-speed gear transmission section was performed.
In conclusion, the thermal network model presented in this study effectively predicts the temperature of the gearbox and accurately identifies the precise location of high-temperature faults within the gearbox. It serves to prevent high-temperature faults and contributes to reducing the associated cost losses.

6. Exploring the Influence of Oil Injection Parameters on the Steady-State Temperature Field

The 3 MW wind-turbine gearbox employs both oil-injection lubrication and splash lubrication methods, with the design of the oil-injection lubrication system playing a pivotal role in the overall temperature regulation of the gearbox. M. Shuai et al. [23] conducted a study on the convective heat transfer effects of oil-injection lubrication on gears. L. Ruirui [24] analyzed oil-injection lubrication in planetary gear transmissions through finite element simulation. L. Jiadong and F. Jin [25] explored the impact of different oil-injection aperture sizes and lengths on lubrication effectiveness. These studies collectively underscore the significance of the oil-injection lubrication system in the gearbox. Therefore, in establishing the thermal network model, this paper considered the parameters of the oil-injection lubrication system. After validating the model’s effectiveness, this study investigated the influence of the oil injection aperture, injection velocity, and injection angle on the overall gearbox temperature field. The relevant results are presented in Figure 11, Figure 12 and Figure 13.
To illustrate the impact of the oil injection system on the steady-state temperature field of the gearbox, we selected ten nodes significantly influenced by the oil injection parameters for observation. These ten nodes represent the positions directly subjected to oil-spray lubrication, or in close proximity to the oil spray. They exhibit the most significant temperature variations with changes in oil spray parameters, thereby reflecting the profound impact of oil spray parameters on node temperatures. Based on the results in Figure 11, Figure 12 and Figure 13, the nozzle diameter and injection velocity in the oil injection system have a substantial impact on the gearbox temperature, especially at the gear meshing positions, where an increased nozzle diameter and injection velocity result in more pronounced cooling effects, while the injection angle has a relatively minor effect. When designing the overall oil-injection lubrication and cooling system, it is crucial to comprehensively consider these three factors. Introducing the designed boundary conditions into the thermal network model presented in this paper allows for the prediction of relevant results. This thermal network model provides theoretical support for the optimization and validation of the cooling and lubrication systems in 3 MW wind-turbine gearboxes, offering a convenient and efficient computational approach.

7. Conclusions

In this investigation, a thermal network model was constructed to forecast the internal temperature distribution of a 3 MW wind-turbine gearbox. Predictions of the gearbox temperature field under various operating conditions were conducted to validate its efficacy. Additionally, an analysis was performed to assess the impact of oil spray parameters on the temperature field. The conclusions are summarized as follows:
(1)
Under various high-temperature conditions, temperature forecasts for the 3 MW wind-turbine gearbox revealed a concentrated distribution of internal high-temperature nodes within the third stage. Node 41 (high-speed downwind bearing—deep groove ball bearing) stands out as the hottest point within the gearbox, notorious for its frequent high-temperature failures. Similarly, under substantial input loads, Node 15 (meshing area of first-stage planetary-gear sun gear) experiences elevated temperatures, making it prone to gear failures such as bonding. To avert downtime caused by high temperatures, it is essential to enhance lubrication and cooling mechanisms at these critical nodes, optimize mechanical structures, and prioritize the monitoring of high-temperature failures.
(2)
Through comparison with SCADA data, the average error of the thermal network model in this study ranges from 1 to 4 °C. When the turbine operates steadily, the average error decreases to 1 to 2 °C. However, significant fluctuations in turbine input power can lead to increased errors. Hence, for temperature prediction, it is advisable to analyze the turbine’s operation during stable or gradually changing conditions.
(3)
Through analysis of the oil spray parameters, it is evident that the diameter and velocity of the oil spray significantly impact the internal temperature of the gearbox, showing a trend where cooling effectiveness increases with the enlargement of these parameters. Conversely, the spray angle exerts minimal influence on temperature. Therefore, in designing the oil-spray system, greater emphasis should be placed on optimizing velocity and diameter parameters, while the spray angle can be tailored based on gearbox structure for optimal design. Moreover, these parameters can be integrated into the model presented in this paper to validate the optimization outcomes.
The model offers rapid computation, making it more convenient and versatile compared to data modeling and analysis methods. It enables the swift identification of overheating positions within the gearbox, allowing for targeted optimization and maintenance, thus effectively reducing the frequency and duration of turbine shutdowns caused by overheating faults. This endeavor also furnishes a robust computational and validation model for the design and optimization of cooling and lubrication systems in large-megawatt wind-turbine gearboxes. This study holds significant industrial value for enterprises by reducing maintenance and loss costs incurred due to shutdown failures.

Author Contributions

Conceptualization, Y.-F.C. and Y.-H.Z.; methodology, Y.-F.C.; software, Y.-F.C.; validation, Y.-F.C.; formal analysis, Y.-F.C., Y.-H.Z. and L.-J.D.; investigation, Y.-F.C.; resources, L.-J.D.; data curation, Y.-F.C. and L.-J.D.; writing—original draft preparation, Y.-F.C.; writing—review and editing, Y.-F.C., W.-D.H., Y.-H.Z. and L.-J.D.; visualization, Y.-H.Z.; supervision, W.-D.H.; project administration, W.-D.H.; funding acquisition, W.-D.H. All authors have read and agreed to the published version of the manuscript.

Funding

This research received no external funding.

Data Availability Statement

The data presented in this study are available on request from the corresponding author. The data are not publicly available to protect the information of the key design parameters.

Acknowledgments

The author expresses gratitude to Dong and all participants for their esteemed support. Appreciation is extended towards the platform provided by the Modern Transmission Laboratory.

Conflicts of Interest

Author Lian-Jun Dong was employed by the company Dalian Easttop Industrial Equipment Co., Ltd. The remaining authors declare that the research was conducted in the absence of any commercial or financial relationships that could be construed as a potential conflict of interest.

References

  1. Ding, Y.T. Central People’s Government of the People’s Republic of China. Available online: https://www.gov.cn/xinwen/2023-02/14/content_5741415.htm (accessed on 10 January 2023).
  2. Xiang, D.; Wei, Y.Z.; Shen, Y.H.; Sun, X.Y. Research on thermal network modeling and temperature calculation method for wind turbine gearbox lubrication oil temperature overrun fault. J. Mech. Eng. 2022, 58, 17. [Google Scholar]
  3. Zhao, W.; Jiang, Z.; Zhang, P.; Huang, X. Reliability sensitivity analysis of main shaft bearings of wind turbines subject to subsurface stress. Machines 2023, 11, 681. [Google Scholar] [CrossRef]
  4. Xu, Z.J.; Xue, Y.Y.; Yang, Y.J.; Xing, Z.X. Cause analysis and solving measures of high oil temperature in a series of wind turbine gearboxes. Acta Energ. Sol. Sin. 2020, 41, 74–79. [Google Scholar]
  5. Zhao, W.D. Analysis on the treatment of high temperature problems in the gearbox of wind turbines. Electron. Technol. 2023, 52, 236–237. [Google Scholar]
  6. Liu, B.; Liu, B.; Wan, Q.; Lu, C.P.; Chen, B.Z.; Cheng, J.X.; Chen, B. Research on heat dissipation of wind turbine gearbox engine room based on fluent. Resour. Inf. Eng. 2023, 38, 108–113. [Google Scholar]
  7. Huang, Z.S.; Tian, L.; Xiang, D.; Wei, Y.Z. Prediction of oil temperature variations in a wind turbine gearbox based on PCA and an SPC-dynamic neural network hybrid. Tsinghua Sci. Technol. 2018, 58, 539–546. [Google Scholar]
  8. Gu, Y.J.; Su, L.W.; Zhong, Y.; Xu, T. An online fault early warning method for wind turbine gearbox based on operational condition division. Energy Sci. Eng. 2014, 30, 1. [Google Scholar]
  9. Jing, T.M.; Qi, Y.S.; Liu, L.Q. Condition monitoring and health assessment of wind turbine gearbox based on KECA-GRNN. Acta Energ. Sol. Sin. 2021, 42, 400–408. [Google Scholar]
  10. He, Q.; Li, Y.Y.; Jiang, G.Q.; Su, N.; Xie, P.; Wu, X. Health assessment of wind turbine gearbox based on conditional convolution autoencoding gaussian mixture model. Acta Energ. Sol. Sin. 2023, 44, 214–220. [Google Scholar]
  11. Song, H.; Ahmat, M.; Yusup, N.; Wang, Y.H.; Zhang, Q.Y. Study on transient temperature of wind turbine bearing based on thermal network and numerical simulation. Bearing 2022, 6, 51–58. [Google Scholar]
  12. Liu, Y.; Zhang, K.L.; Shao, S.; Xiang, H.X. Investigation on steady-state thermal performance of gear box based on thermal–fluid-solid coupling. J. Shanghai Jiao Tong Univ. 2024, 1–17. [Google Scholar] [CrossRef]
  13. Deshpande, S.; Joshi, H.; Madhavan, J.; Mason, P.; Wink, C. Two-way coupled CFD approach for predicting gear temperature of oil jet lubricated transmissions. SAE Int. J. Commer. Veh. 2018, 11, 163–170. [Google Scholar] [CrossRef]
  14. Fan, Y. Thermal Analysis and Flow Field Simulation of an Unmanned Helicopter Main Gearbox. Master’s Thesis, Nanjing University of Aeronautics and Astronautics, Nanjing, China, 2019. [Google Scholar]
  15. Liu, Y.; Peng, J.; Wang, B.; Qin, D.; Ye, M. Bulk temperature prediction of a two-speed automatic transmission for electric vehicles using thermal network method and experimental validation. Proc. Inst. Mech. Eng. Part D J. Automob. Eng. 2019, 233, 2585–2598. [Google Scholar] [CrossRef]
  16. Kang, Q.; Li, S.W.; Guo, J.L. The thermal network method outline. Ind. Heat. 2006, 35, 15–18. [Google Scholar]
  17. Xu, X.; Bi, X.P. Computer simulation and calculation of heat transfer in automotive gearbox. J. Mech. Transm. 2003, 27, 1–4. [Google Scholar] [CrossRef]
  18. SKF. SKF Rolling Bearing Catalog; SKF Group: Gothenburg, Sweden, 2016. [Google Scholar]
  19. Kahraman, A.; Hilty, D.; Singh, A. An experimental investigation of spin power losses of a planetary gear set. Mech. Mach. Theory 2015, 86, 48–61. [Google Scholar] [CrossRef]
  20. Wang, Z.H. Practical Bearing Manual, 2nd ed.; Shanghai Scientific and Technological Literature Press: Shanghai, China, 1996; pp. 1–304. [Google Scholar]
  21. Huang, F. The Thermal Analysis of Epicyclic Gear Reducer Based on Thermal Network Method. Master’s Thesis, Nanjing University of Aeronautics and Astronautics, Nanjing, China, 2011. [Google Scholar]
  22. Xiang, C. Thermal Balance Analysis of High Speed Gearbox of Electric Vehicle Based on Thermal Network Structure. Master’s Thesis, Chongqing University, Chongqing, China, 2018. [Google Scholar]
  23. Mo, S.; Li, X.; Zou, Z.X.; Feng, Z.Y.; Cen, G.J.; Huang, Y.S. Analysis and research of asymmetric helical gear oil injection lubrication considering convective heat transfer coefficient. J. Mechl. Transm. 2022, 46, 1–6+37. [Google Scholar]
  24. Liu, R.R. Windage Analysis and Oil Jet Lubrication Simulation of High Speed Double Helical Star Gear System. Master’s Thesis, Chongqing University, Chongqing, China, 2021. [Google Scholar]
  25. Li, J.D.; Feng, J.; Liu, X.F.; Qin, K. Flow simulation analysis of multi channel lubrication system of certain gear box test bench. Mechl. Eng. Autom. 2020, 49, 7–9. [Google Scholar]
Figure 1. Wind-turbine gearbox transmission structure.
Machines 12 00175 g001
Figure 2. Distribution of nodes in the wind power gearbox.
Machines 12 00175 g002
Figure 3. Thermal network diagram for the first stage of gear transmission.
Machines 12 00175 g003
Figure 4. Thermal network diagram for the second stage of gear transmission.
Machines 12 00175 g004
Figure 5. Thermal network diagram for the third stage of gear transmission in the wind-turbine gearbox.
Machines 12 00175 g005
Figure 6. Steady-state node temperatures in the wind-turbine gearbox.
Machines 12 00175 g006
Figure 7. Numerical computations versus SCADA data comparative chart for June.
Machines 12 00175 g007
Figure 8. Numerical computations versus SCADA data comparative chart for July.
Machines 12 00175 g008
Figure 9. Numerical computations versus SCADA data comparative chart for August.
Machines 12 00175 g009
Figure 10. Steady-state thermal simulation results under six operating conditions: (a) operational scenario 1; (b) operational scenario 2; (c) operational scenario 3; (d) operational scenario 4; (e) operational scenario 5; (f) operational scenario 6.
Machines 12 00175 g010aMachines 12 00175 g010b
Figure 11. The influence of the nozzle diameter on the steady-state temperature.
Machines 12 00175 g011
Figure 12. The influence of the fuel injection velocity on the steady-state temperature.
Machines 12 00175 g012
Figure 13. The influence of the fuel injection angle on the steady-state temperature.
Machines 12 00175 g013
Table 1. Transmission gear parameters.
LocationModule
(mm)
Number of TeethPressure Angle (°)Helix Angle (°)
First-stage planetarySun gear19.12222.56.1
Planet gear19.13522.56.1
Internal gear19.19422.56.1
Second-stage planetarySun gear1127206.8
Planet gear1149206.8
Internal gear11126206.8
High-speed parallelLarge gear11892011.5
Small gear11282011.5
Table 2. Bearing parameters.
Bearing NameLocationBearing TypeOuter Diameter (mm)Inner Diameter (mm)Width (mm)
NNCF 5044CVsFirst-stage planetaryCylindrical roller340220160
EE763330First-stage upwindTapered roller1041.4838.293.663
LL483449First-stage downwindTapered roller88976269.85
60/670NIMASSecond-stage upwindDeep groove ball980670136
Nu1044MSecond-stage planetaryCylindrical roller22034056
294/500EMSecond-stage downwindSpherical roller thrust500870224
NU1076Low-speed upwindCylindrical roller38056082
32972/DFLow-speed downwindFace-to-face tapered roller360480152
NU240ECMHigh-speed upwind/downwindCylindrical roller20036058
QJ240N2MAHigh-speed downwindAngular contact ball20036058
Table 3. SCADA data for a 3 MW wind-turbine gearbox.
DataTimeBearing Temperature in the Gearbox (°C)Gearbox Oil Temperature (°C)Temperature Inside the Nacelle (°C)
13 October 202123:53:1550.751.721.8
14 October 20210:03:1550.251.421.8
14 October 20210:13:155151.421.6
14 October 20210:23:155151.521.5
Table 4. Gearbox joint.
Node NumberNode Location
1External air of gearbox
2Internal air of gearbox
3Gearbox internal oil pool
4Input shaft—left
5First-stage left casing
6First-stage planetary gear
7First-stage planetary gear shaft
8Meshing area of first-stage planetary-gear internal ring
9First-stage internal ring
10First-stage planetary gear bearing
11First-stage right casing
12First-stage sun gear shaft
13First-stage downwind bearing
14First-stage planetary carrier—right
15Meshing area of first-stage planetary-gear sun gear
16First-stage sun gear
17First-stage planetary carrier—left
18First-stage upwind bearing
19Input shaft—right
20First-stage bearing sleeve
21Second-stage left casing
22Meshing area of second-stage planetary-gear internal gear
23Second-stage planetary gear bearing
24Second-stage planetary gear
25Second-stage internal gear
26Second-stage planetary gear shaft
27Second-stage sun gear shaft
28Second-stage downwind bearing
29Second-stage planetary carrier—right
30Meshing area of second-stage planetary-gear sun gear
31Second-stage sun gear
32Second-stage planetary carrier—left
33Second-stage upwind bearing
34Second-stage right casing
35High-speed upwind bearing
36High-speed gear
37High-speed shaft—left
38Third-stage gearbox
39High-speed downwind bearing—cylindrical roller bearing
40High-speed shaft—right
41High-speed downwind bearing—deep groove ball bearing
42Meshing area of high-speed gear
43Low-speed upwind bearing
44Low-speed shaft—left
45Low-speed shaft—right
46Low-speed downwind bearing
47Bearing end cover of 2–3 stages
48Low-speed gear
Table 5. Meanings of symbols in the formulas within the text.
SymbolSymbolic MeaningUnit
q n The heat generation rate per unit volume in node nW/m³
f ( T ) A function of the temperature
R j n The thermal resistance between nodes j and n
CThe specific heat capacityJ/(kg·K)
ΔtThe time interval from time i to i + 1
AThermal resistance matrix
TTemperature node matrix
QHeat source matrix
ZConstant matrix in the heat balance equation
r a Addendum circle radiusm
r b Base circle radius of the gearm
r Root circle radius of the gearm
α t Face pressure angle°
z Number of teeth
n 1 Rotational speed of the driving wheelr/min
T 1 Input torqueN·m
β b Base circle pressure angle°
μ o Lubricating oil dynamic viscosityMPa·s
P s Average sliding loss of the gearkW
b Tooth thicknessmm
P b e a r i n g Bearing power losskW
n b Relative speed between the inner and outer rings of the Bearingr/min
M b , M r r , M s l Running resistance torque of the bearingN·mm
ϕ i s h Inlet shear heat shrinkage coefficient
ϕ r s Motion compensation reduction coefficient
v o i l Lubricating oil kinematic viscosity;10−6 m2/s
μ s l Depends on the motion state
G r r , G s l K z , K r s The specific values of these parameters depend on the Type of bearing
A Contact aream2
l h Meshing point sliding velocitym/s
v Gear pitch circle point sliding velocitym/s
k Thermal conductivity of the gear materialW/(m·K)
λ s Convective heat transfer coefficientW/(m²·K)
l / r ( d ) Characteristic length/radius (diameter)m
h Convective heat transfer coefficient
h l Convective heat transfer coefficient for cylindrical surfaces
h d Convective heat transfer coefficient for vertical surfaces
G r Depends on the properties of the lubricating oil
Pr Prandtl number
λ a Air thermal conductivityW/(m·k)
ξ Coefficient of air expansion
v f Air dynamic viscositym2/s
u s Bearing cage speedr/min
N u Nusselt number
C p Specific heat at constant pressureJ/(kg·K)
μ o i l Lubricating oil flow characteristicsm/s
v o i l Lubricating oil dynamic viscositymm/s
k _ o i l Lubricating oil thermal conductivityW/(m·K)
A 1 Oil-injection nozzle aream2
S Cooling aream2
θ Oil injection angle°
v j Injection velocitym/s
Table 6. Data of six operational scenarios.
TimeNacelle Temperature (°C)Gearbox Oil Temperature (°C)High-Speed Shaft Bearing Temperature (°C)
Scenario 112 June 2021 11:5040.854.563.1
Scenario 212 June 2021 12:0040.852.862.2
Scenario 312 July 2021 14:5940.552.463.8
Scenario 412 July 2021 15:2939.650.364
Scenario 512 August 2021 2:28265363
Scenario 612 August 2021 2:3825.850.961.5
Table 7. Temperature field simulation data.
Temperature at Point 1 (°C)Temperature at Point 2 (°C)Highest Temperature (°C)Lowest Temperature (°C)
Scenario 160.11258.78364.71555.264
Scenario 258.357.09763.01553.564
Scenario 357.9956.69562.61553.164
Scenario 455.96354.5560.51551.064
Scenario 558.15257.28463.21553.764
Scenario 656.38855.18561.11551.664
Disclaimer/Publisher’s Note: The statements, opinions and data contained in all publications are solely those of the individual author(s) and contributor(s) and not of MDPI and/or the editor(s). MDPI and/or the editor(s) disclaim responsibility for any injury to people or property resulting from any ideas, methods, instructions or products referred to in the content.

