

Axiomatic Design of a Test Artifact for PBF-LM Machine Capability Monitoring †
by
 , and
, and
Alessandro Giorgetti
1,* ,
,
Filippo Ceccanti
2,3,
Niccolò Baldi
2,
Simon Kemble
3,
Gabriele Arcidiacono
2 and
and
Paolo Citti
2 1
Department of Industrial, Electronic and Mechanical Engineering, Roma Tre University, 00146 Rome, Italy
2
Department of Engineering Science, Guglielmo Marconi University, 00193 Rome, Italy
3
Baker Hughes—Nuovo Pignone, Via Felice Matteucci 2, 50127 Florence, Italy
*
Author to whom correspondence should be addressed.
†
This paper is an extended version of our paper published in Giorgetti, A.; Ceccanti F.; Citti P.; Ciappi A.; Arcidiacono G. Axiomatic Design of Test Artifact for Laser Powder Bed Fusion Machine Capability Assessment. In Proceedings of the 13th International Conference on Axiomatic Design (ICAD), Sidney, Australia, 18–20 October 2019; MATEC Web of Conferences 301, 00006.
Machines 2024, 12(3), 199; https://doi.org/10.3390/machines12030199
Submission received: 15 January 2024
/
Revised: 22 February 2024
/
Accepted: 12 March 2024
/
Published: 18 March 2024
(This article belongs to the Special Issue Design Methods for Mechanical and Industrial Innovation)
Abstract
:Powder Bed Fusion Laser Melting (PBF-LM) additive manufacturing technology is expected to have a remarkable impact on the industrial setting, making possible the realization of a metallic component with very complex designs to enhance product performance. However, the industrial use of the PBF-LM system needs a capability monitoring system to ensure product quality. Among the various studies developed, the investigation of methodology for the actual machine capability determination has been faced and still represents an open point. There are multiple authors and institutes proposing different investigation methods, ranging from the realization of samples (ex situ analysis) to installing monitoring devices on the machine (in situ analysis). Compared to other approaches, sample realization allows for assessing how the machine works through specimen analysis, but it is sensitive to the sample design. In this article, we first present an analysis of a well-known test artifact from an Axiomatic Design perspective. Second, based on the customer needs analysis and adjustments with respect to the use of hypothetical additive production lines, a new test artifact with an uncoupled design matrix is introduced. The proposed design has been experimentally tested and characterized using artifact made of Inconel 718 superalloy to evaluate its performance and representativeness in machine capability assessment. The results show an accurate identification of beam offset and scaling factor considering all the building platform positions. In addition, the artifact is characterized by a reduced building time (more than 90% with respect to the reference NIST artifact) and a halved inspection time (from 16 h to 8 h).
1. Introduction
Additive Manufacturing (AM) is an innovative production process that is highly suitable for many applications. AM is mainly based on the concept of creating matter just where it is needed, as opposed to subtractive technologies [1,2,3,4,5]. That is possible by subdividing the CAD model into two-dimensional slices and building the parts by a layer-by-layer building strategy. Starting from this basic concept, many different technologies involving many types of material (polymers, metals, biomaterials, ceramics, etc.) have been developed in the last few decades [6].
Metal AM technologies, among all the others, raised much attention due to their potential impact on the industrial environment. In fact, AM technology can produce parts with more enhanced properties [7] than traditionally manufactured parts, with all the advantages coming from adopting an additive production technology rather than a subtractive one. Based on this consideration, metal AM presented many possibilities, ranging from enhancing part performance to insourcing strategic parts. Among all the metal AM technologies [5], within the industrial environment, one in particular has been heavily adopted: Powder Bed Fusion Laser Melting (PBF-LM or L-PBF) [7,8]. PBF-LM is a powder bed technology, which means that parts are built within a metal powder bed. The powder bed is created by spreading very thin powder layers (typically from 20 μm to 100 μm). After the layer is spread, a highly focused laser melts the metal powder, realizing the part slice. PBF-LM technology has many fields of application (biomedical, aerospace, energy, etc.), thanks to the very wide variety of materials processable: lightweight alloys (aluminum and titanium alloys), high-temperature materials (nickel-based and cobalt-based alloys), stainless steels, precious metals, etc. However, introducing PBF-LM technology as a standard manufacturing technique brings new challenges and issues. One of the most important aspects is quality assurance [9], along with design for additive manufacturing [10,11], process efficiency, and control [12,13].
From a quality assurance point of view, PBF-LM fabricated parts have to be acceptable in terms of material printability and geometry compliance with tolerances. In particular, with regard to the first aspect mentioned, it is necessary to ensure a defect-free part, through the identification of material printability map boundaries. For this purpose, usually, the definition of material printability is performed through the analysis of Melt Pool shape printing several single and multi-tracks on a powder bed [14,15,16,17,18]. In order to have a fully dense and defect-free material, the Melt Pool formation has to be fully governed by conduction, avoiding the presence of unproper melting regimes such as Keyhole, Lack of Fusion, or Balling [19,20,21]. This analysis could be carried out through Melt Pool monitoring in situ or ex situ assessment analyzing printed specimens [22,23,24,25]. Conversely, as soon as additively manufactured parts start to be produced in an industrial line, thanks to the technology applications spreading [26,27,28,29,30,31,32,33,34,35], the importance of PBF-LM machines’ capability determination and their monitoring through time is constantly increasing [36,37].
To monitor and verify the system’s performance, many authors and PBF-LM providers propose using samples or functional mock-ups. Samples are typically identified as test artifacts [38,39,40,41,42,43,44,45,46,47,48,49,50,51,52,53]. In most cases, the design of test artifacts is characterized by a high level of complexity and a large number of geometric features, which allow the evaluation of many different capabilities. Focusing on the use of test artifacts to check machine performances in an additive manufacturing production line, results robustness and a fast test time are more important than the possibility of evaluating, at the same time, many different capabilities.
The idea of this paper is to use Axiomatic Design (AD) methodology to address the issue of machine capability assessment in an industrial production line. AD is a methodology developed by Suh in the 1990s [54] and it helps with the development of products and systems that respond to functional requirements.
AD, as demonstrated largely in the literature [55,56,57,58,59,60,61,62,63,64,65,66,67,68,69], is a structured method that helps the designer identify optimal design solutions especially for products and processes with many different needs to be considered simultaneously [70,71].
For AD, the best designs had two things in common (Suh’s design axioms). Maintain the independence of the Functional Requirements or FRs, (Axiom one) and minimize the information content (Axiom two). When these axioms are applied the resulting design solutions are optimal for a given set of FRs and candidate Design Parameters (DPs) [70,72]. The independence of FRs is assured when the design matrix that connects FRs and DPs is diagonal (called “uncoupled design”).
In this paper, the AD approach is used to analyze a well-known test artifact proposed by the National Institute of Standards and Technology (NIST) [73] in order to determine its criticalities if applied to the needs of industrial additive manufacturing production lines (Section 2). Based on the previous analysis, a new concept of a test artifact is proposed (Section 3), physically produced and tested (Section 4), evaluating the benefits of the new design.
2. Analysis of the NIST Test Artifact
The section describes the main characteristics of the test artifact proposed by NIST (Section 2.1) and analyzes, from an AD point of view, its ability to monitor and verify the system’s performance in the context of an industrial production line (Section 2.2).
2.1. Description of Characteristics and Main Features
Among the various test artifacts proposed in the literature usable for the monitoring and qualification of AM processes, one of the most relevant is that proposed by NIST [73]. The NIST artifact, represented in Figure 1a, assesses many aspects related to the AM process, so it is a sample that can be fruitfully used to compare different AM systems or additive manufacturing technologies. The NIST artifact has been used as a reference in this paper’s development.
The considered specimen is characterized by many features, such as central cylinders, staircases, ramps, pins, holes, line features, lateral features, top surfaces, massive material, etc. The features are grouped in a single geometry characterized by lateral dimensions of 100 × 100 mm2 (see [73] for further detail). Typically, the specimen shall be printed in the center of the machine building area and shall be geometrically inspected (Figure 1b).
The drawback of this test artifact is represented by its purpose: it has been designed, in fact, mainly to compare different AM technologies rather than to compare systems that nominally should have the same characteristics and performances. Furthermore, realizing this test artifact with PBF-LM technology features is prone to being characterized by a non-diagonal design matrix.
2.2. AD Analysis of NIST Test Artifact
The NIST test artifact, used in this paper as a reference point, has been evaluated using the AD approach. The aim is to assess the quality of the design choices in relation to the typical objectives of an industrial production line based on AM and, in particular, the PBF-LM process.
The analysis begins with our interpretation of the Customer Needs (CNs) that have been used by NIST when they develop their well-known test artifact. Therefore, the inputs behind the reference test artifact design are considered the following:
- −
- CN1. Assess overall machine capabilities through the realization of a test artifact to compare multiple printed materials using multiple AM technologies and test the limitations of the system (regardless of the specific additive manufacturing technology);
- −
- CN2. The test artifact shall have as many features as possible to maximize the information content per system inspected;
- −
- CN3. Test artifact features shall be feasible for all the possible additive manufacturing commercial systems available (without any constraints related to additive manufacturing technology).
The Functional Requirements (FRs) were identified based on the CNs and are listed in Table 1. Using these FRs, we identified the corresponding Design Parameters (DPs) for the NIST test artifact (Table 2).
According to the AD approach, the design matrix has been compiled to identify the relationship between FRs and DPs (Figure 2). From the analysis, some criticalities related to the use of this design as an artifact for the PBF-LM system performance check were identified. In particular, the design matrix shows that this artifact is suboptimal from an AD standpoint. In detail, analyzing the accordance of the design with the AD first axiom (i.e., “Maintain the independence of FRs” [54]), it is possible to observe that:
- The matrix is neither diagonal nor square, so the design is coupled;
- The use of certain features (such as bulk material) makes features not independent.
The superposition of effects means that information retrievable by their analysis is potentially affected by this design choice since all the features are grouped into a single part.
This is confirmation that the use of a single part as a test artifact potentially introduces mutual influences among features. In fact, the analysis of every single feature is meaningless, as they are mutually influenced. Considering the application addressed in this paper, this choice could be a very critical element.
In addition, this effect becomes very relevant when considering additive manufacturing technologies that produce metal parts, such as nickel-based or cobalt-based, widely used in PBF-LM applications. In fact, as is well known, PBF-LM technology is characterized by very high residual stresses due to the printing process itself. Therefore, to determine specific machine capabilities, it is desirable to remove any possible mutual influence of features to be inspected. That allows for more representative data that can eventually be correlated with information about the process.
To summarize, the use of this artifact design for the performance check of the PBF-LM system in an AM production line is non-optimal. The proposition of a different test artifact design carried out in this paper starts with these preliminary considerations.
3. Analysis of the New Test Artifact
3.1. CNs Review
The AD analysis carried out on the NIST test artifact shows that the CNs used to drive the design phase do not appropriately match the requirements coming from the context considered within this work (i.e., the industrial AM production line). Therefore, CNs have been reviewed and redefined according to the scenario considered within the work.
The new CNs are:
- CN1. Evaluate machine capability assessment for a periodic performance check;
- CN2. Performance check performed fast;
- CN3. Performance check performed cheaply;
- CN4. Results coming from the check robust and reliable;
- CN5. Same performance check among machines and materials with homogeneous characteristics;
- CN6 Performance check safe for those who carry it out.
Focusing on the scenario considered, it is evident that the new CNs and those related to the reference design differ significantly (except partially for CN1). The overall goal of the test artifact is still to assess machine performance. However, since the new scenario specifically considers PBF-LM technology, more needs, such as the machine time-occupancy and the check cost, should be considered.
3.2. FRs Definition and Redesign Using AD
The list of CNs defined in Section 3.1 is used to identify a new set of FRs. Starting from their definition, we have considered the following assumptions [54]:
- CN6 shall not be considered an FR. It shall be considered a non-Functional Requirement (nFR) instead;
- CN2 and CN3 lead to FRs that will not satisfy the Independence Axiom because of their very nature. For this reason, in the following AD analysis, we considered speed as an actual FR and cost as a Selection Criteria (SC);
- CN5 represents more of a constraint than an actual FR. Therefore, it will be considered as such.
Additionally, considering the progressive development of PBF-LM technology and the quest for higher productivity, the number of lasers will be considered an additional constraint. This work will consider single laser machines; however, the study can easily be extended to multi-laser machines, which are rapidly growing in the industrial scenario. With this consideration, the highest-level CN is still represented by CN1, the machine capability assessment for a periodic performance check. Accordingly, the first design choice (that is DP1) consists of the adoption of an inspection strategy, which eventually means the realization of a test artifact. This DP comes from the choice of not changing how machine performances are checked. Then, as long as the test artifact is representative of the machine’s performance, its realization is the design choice adopted.
Then, based on the classical AD Zig-Zagging process, once this first DP has been identified, lower-level FRs are defined as follows:
- FR1. Produce the test artifact in less than 8 h.
- FR2. Analyze the test artifact in less than 12 h.
- FR3. Deliver results with measure accuracy below 10 microns in the whole working space.
These FRs come from the CNs analysis and their interpretation, as shown above. Then lower level FRs and DPs are defined using the Zig-Zagging process iteratively.
The design matrix in Figure 3 shows that the design of the proposed test artifact is uncoupled (the first AD axiom is verified).
3.3. Resulting Artifact Design and Discussion
The geometrical model of the new test artifact obtained using the AD approach is represented in Figure 4. The test artifact consists simply of an array of pins printed above the building platform (i.e., the gray parallelepiped with four counterbores to allow for bolting it into the printing machine). The main novelty represented by the design is the use of distinct components and the absence of printed material below the main features.
This section will go through the reason behind it in better detail.
The use of the AD strategy for this problem has resulted in a comprehensive redefinition of the overall approach and optimization of an existing procedure. In particular, the AD approach led us to analyze the specific needs related to the monitoring and verification of the system’s performance in the context of an industrial production line, build on them in the design process, and achieve an improved and optimized design.
Optimization of the test artifact design has brought significant advantages: the artifact building time has been reduced by 90% compared to the original one (consider approximately 105 mm3 of printed materials for the NIST artifact [73] and about 104 mm3 for the redesigned one), and the inspection time has been halved (from about 16 h to 8 h).
The compromise reached with the new test artifact must consider that the lower number of features measurable, with regard to the reference NIST artifact, leads to a reduction in the amount of information obtainable. This loss, however, does not affect the effectiveness of the measures achievable using the test artifact for the features still present.
It is important to consider that any modification of the laser due to an internal fluctuation of the PBF-LM system is detected automatically by the machine, as well as other major failures (i.e., laser source malfunctioning, excessive oxygen concentration, etc.). Conversely, the realization of the pins is fundamental because it makes it possible to verify the dimensional performance of the systems that are otherwise unverifiable.
The owner of the PBF-LM production line needs to have the same dimensional performance among all the available systems. The basic assumption is that PBF-LM is characterized by poor accuracy performance, mainly due to its physical nature. In fact, the powder melting process has the inherent disadvantage of having a mantle of powder not melted, limiting accuracy to the powder grain size itself (typically in the range of 5–65 µm).
In addition, two other factors influence the nominal dimension of a PBF-LM printed component:
- Material shrinkages during the solidification, which creates residual stress.
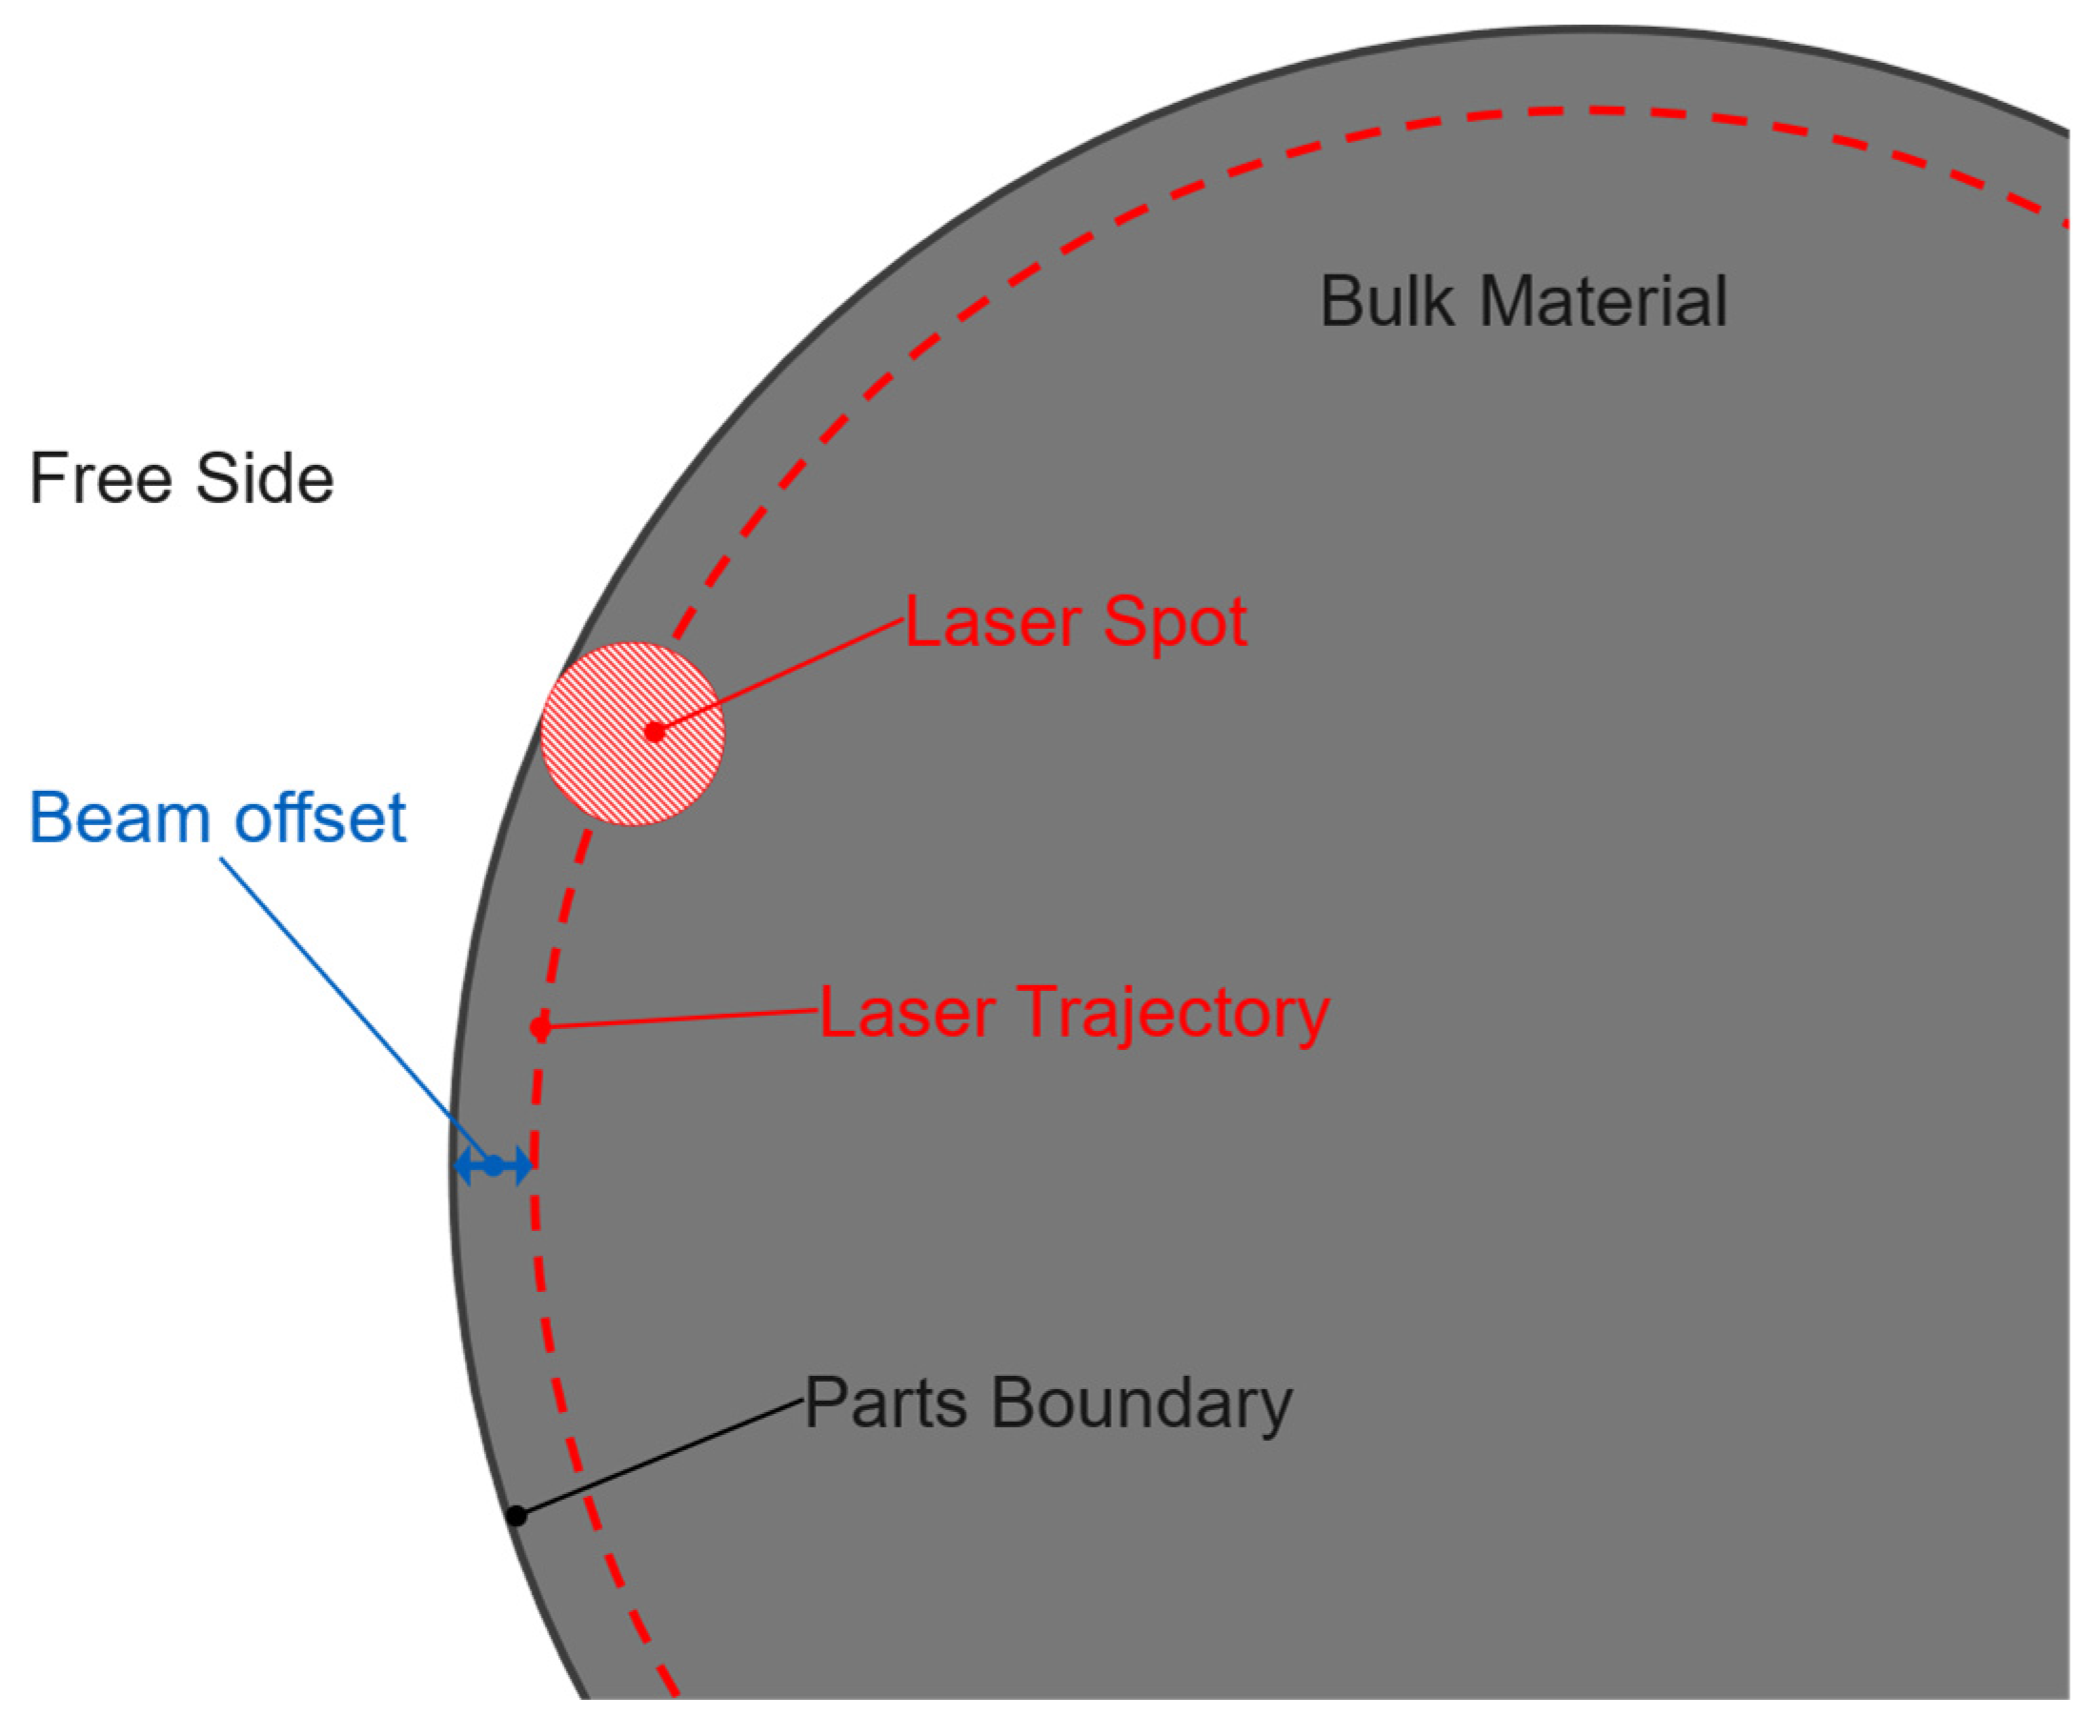
- Beam offset compensation.
The first effect can be simulated and compensated or directly compensated through a trial-and-error process. Conversely, the modification of beam offset compensation is allowed in commercial systems to change the laser trajectory, compensating the beam spot radius (Figure 5) [73]. Beam offset compensation is a global correction applied to every printing position on the building platform. This correction has to be performed and repeated each time the machine type and process parameters change, considering the industrial production line.
Once the CAD model is compensated, it is crucial to have machines with the same dimensional accuracy.
The beam offset compensation varies between systems, so correcting it on each machine is critical to achieving the same dimensional performance. This is why printing pin features in the test artifact should be preferred to the use of other geometrical features.
The other important thing to monitor and check is whether the system can point the laser where it is required (i.e., the accuracy of the machine in laser pointing). The laser is highly focused in the PBF-LM system, so direct measurement results are difficult and costly. An indirect method of obtaining this information is to measure the position of the axles of the pins, thus indirectly assessing the accuracy of the machine.
Hence, analyzing the pins alone makes it possible to check whether a PBF-LM system works well. The dimensions of these pins, considering these factors, shall be as follows:
- Small enough to make shrinkage effects negligible in their diameter.
- Big enough to avoid being damaged by the re-coater during the printing processing.
In the proposed design the diameter dimension (4 mm) has been aligned with the pin present in the NIST artifact considering that it is verified in [73] how it allows the above two problems to be avoided.
It is important to note that the proposed artifact minimizes the superposition of effects, leaving key system features independent. This means that there is no additional effect as a result of other variables in the measure of each feature.
4. Experimental Validation
After the design analysis, which highlighted the necessity to remove the superposition of effects to get a test artifact able to catch differences between PBF-LM commercial systems, an experimental campaign was carried out to validate the obtained results.
The campaign has been structured by collecting data retrieved by analyzing the reference test artifact produced by the PBF-LM system EOS Eosint M-280 (EOS GmbH, Krailling, Germany), provided with one ytterbium fiber laser characterized by a beam wavelength of 1070 nm, a minimum spot size of 80 µm, and a maximum laser power of 400 W. Furthermore, during all the tests, the building platform temperature was kept constant at 80 °C and an argon gas flow was continuously pumped inside the building chamber to maintain oxygen content under 100 ppm. All the experimental campaigns are carried out on test artifacts made of Inconel 718 superalloy (for detailed chemical and mechanical properties, refer to [13]). In the following, the test artifacts considered for this work were built three consecutive times with the same machine, same process parameters (listed in Table 5), same metal alloy, and same time span, and accounting for a layer thickness of 40 μm.
As previously stated, the machine considered within this work is a commercial PBF-LM system fitting a 250 × 250 mm2 building platform and a single laser. Test artifacts have been geometrically inspected, measuring the artifact still attached to the building platform, with the Coordinate Measurement Machine Carl Zeiss Contura G2 (Carl Zeiss AG, Oberkochen, Germany). The measuring system has a declared accuracy of 2 μm. The overall estimated repeatability error, which results from the measuring machine accuracy and its interaction with pin surface roughness, has been experimentally evaluated under 4 μm.
The data obtained by the geometrical inspections are pin diameters and pin positions. The pin inspection has been structured, defining five planes parallel to the building platform. On each plane, 12 points are acquired along the circumference obtained by the pin and plane intersection. The number of planes and points has been selected after a preliminary analysis to ensure a reliable measure of the circularity and cylindricity of the pins. Figure 6 represents how the plane is chosen and how the pin is measured on each of these. In particular, planes are chosen to be parallel to the building platform (i.e., with the normal parallel to the machine Z axis). The number of planes is a trade-off value between a fast measure (few planes) and a high representativity (many planes). On each plane, the intersection with the pin nominally creates a circumference (the crosshatched circumference in Figure 6a); measurement points are taken touching the pin with a radial movement towards the pin center. The 12 points collected are angularly outdistanced by a constant angle of 30° (Figure 6b).
As stated in Section 3.2, the choice to define these parameters only comes from the main aim of the proposed new test artifact, i.e., to identify with as much reliability as possible, the few parameters that are vital to be managed within the context considered in this work. In the following, 22 pins will be considered. This value can, however, be increased to enhance the spatial resolution of the data. Table 6 and Table 7 and Figure 7 contain the difference between the average diameter measured on each pin and the nominal one (4 mm).
Analyzing the diameters in Figure 7, it is possible to outline several considerations. The first is that the average pin diameter is more constant in the new design with regard to the reference design. Partially, this could be a direct consequence of the higher number of pins considered in the new sample (the higher the sample number, the lower the sensitivity to potential outliers). However, this consideration contradicts the lower (and even, in this case, more constant) standard deviation value. In all its forms, the standard deviation represents the sample scattering. Therefore, the higher the standard deviation value, the higher the scattering within the sample. Thus, as a first conclusion, the new test artifact design appears to be more able to catch the actual average pin diameters than the reference NIST artifact. The actual average diameter definition’s importance has already been explained in Section 3.
The pin position, conversely, has been defined as a point resulting from the intersection between the pin axis and the building platform’s top surface. This choice comes from the plane definition’s repeatability, thanks to the building platform construction accuracy and the perpendicularity between pin and plane. With this procedure, the pin position is measured. It is important to highlight that the authors considered, within this work, the coordinate system origin in the center of the building platform. Table 8 and Table 9 list pin position deviation values, assessed as the difference between the actual position and the nominal one. These data have been obtained using the same test artifact geometrical inspections used to assess the average pin diameter.
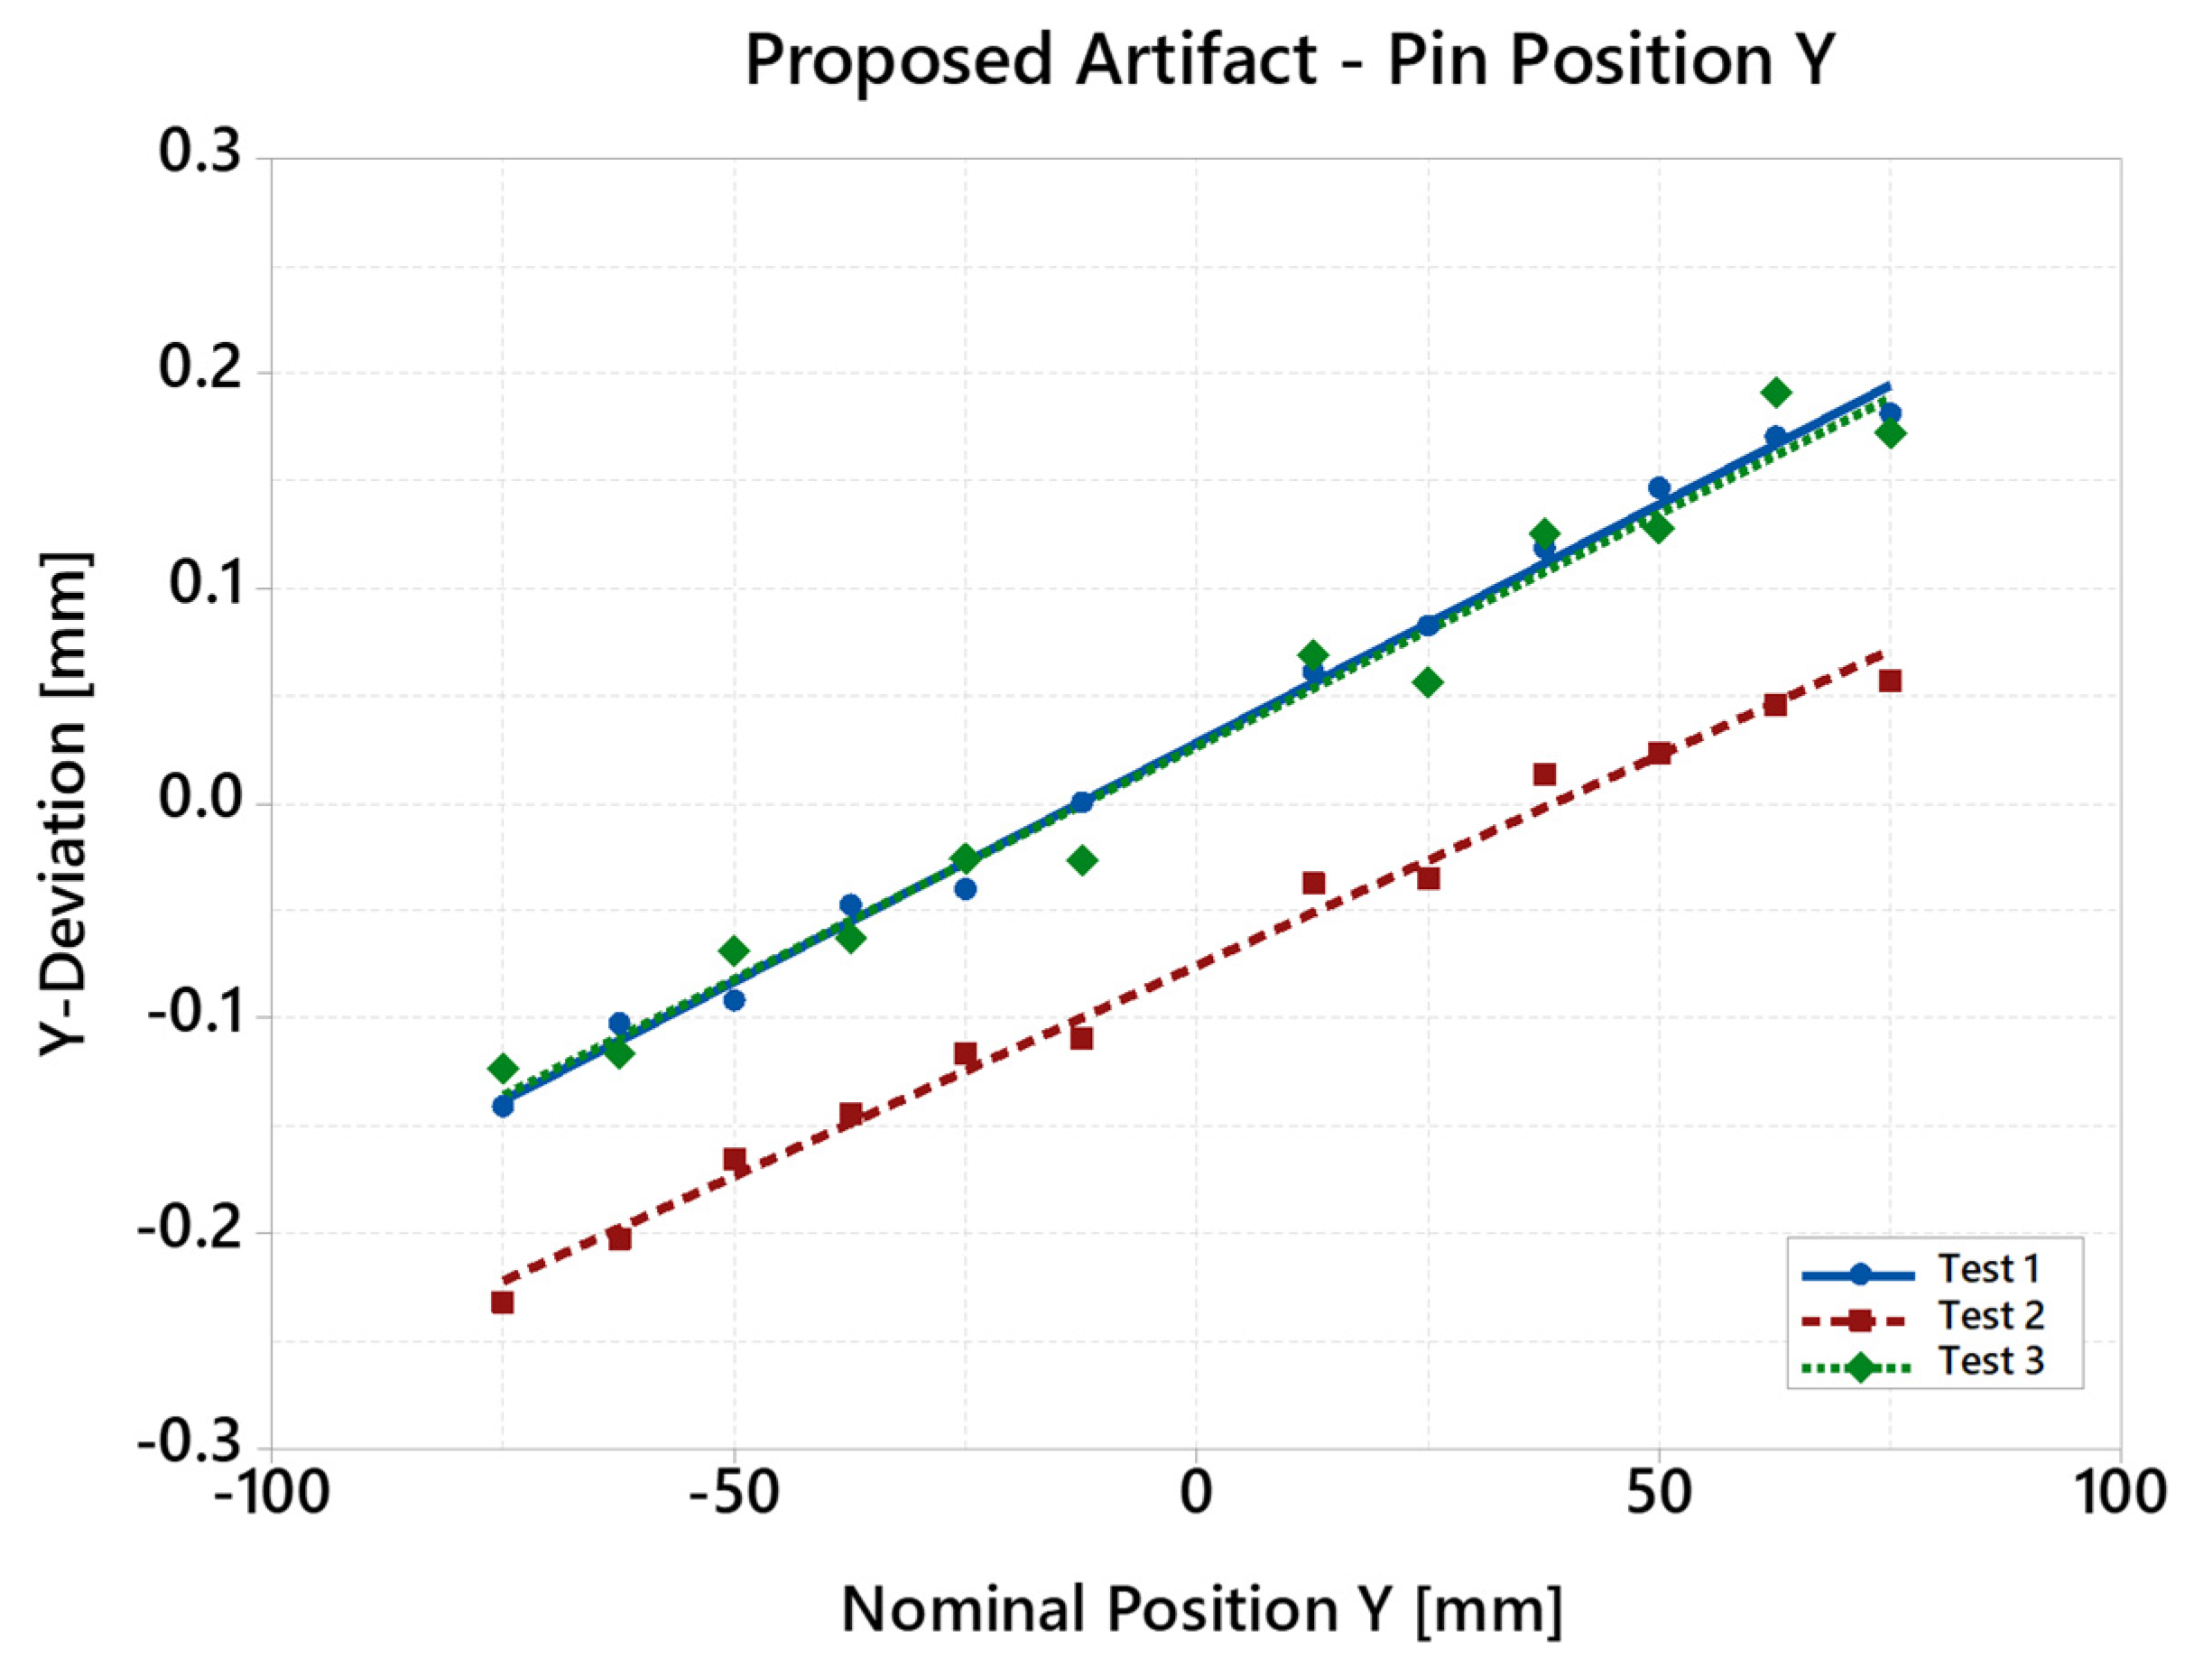
Furthermore, it is possible to observe the data listed in the tables graphically in Figure 8 and Figure 9 (referred to as the X axis) and Figure 10 and Figure 11 (referred to as the Y axis). These plots have the scope to illustrate whether and how the pin positions printed are modified with respect to nominal ones. The scaling factor is a material-dependent parameter used to compensate for the thermal shrinkages that occur after the powder melts when the material solidifies. The scaling factor is evaluated as the regression angular coefficient of the average deviation from the nominal diameter measured on different pins as a function of the nominal pin position. Table 10 and Table 11 list the regression coefficients and the coefficient of determination (adjusted R-squared) evaluated on data obtained by test artifact geometrical inspection.
By plot comparison, it is evident how much the test artifact design influences the result retrievable by its analysis. Data from the reference design shows that printing the pin features above a base of massive materials substantially reduces the difference between the real and nominal positions. As a drawback, however, it is possible to note that data is heavily scattered from the same machine and using the same alloy. Regressions are also highly scattered. Linear regressions have been used to fit the data since the shrinkage compensation is supposed to be linear [7]. By analyzing the data in Table 10 and Table 11, it is possible to estimate the variability in the regression coefficient. In the reference design, the coefficients are so scattered that the variability range of the coefficient (0.0017 for X and 0.0012 for Y) is bigger than every single coefficient. In the proposed design, on the contrary, values are more similar among the tests carried out (variability range of the coefficient 0.0001 for X and 0.0002 for Y). Therefore, it is possible to calculate a percentage of variation of the coefficient, which is 7.9% for the X-axis and 9.4% for what concerns the Y-axis in the proposed design.
The regression value in the building platform center (coordinate system origin) is not essential, as it depends on the relative alignment between the plate and the scanning system, which is not guaranteed in the system used in this work. This is why relative alignment between the scanning system and building plate is not important in building applications since once the job is started, it is self-aligned. This is important in repair applications, where the alignment between parts on the platform and the laser is crucial for the repair to succeed.
Analyzing the plot retrieved by the analysis of the new artifact, it is evident how the data are less affected by noise, are more regular, and are more repeatable (Figure 7). In addition, the new test artifact design increased the measurement system’s accuracy, where the reference system is represented by the test artifact itself and its measure.
In the NIST reference design, some noise is introduced by the bulk base of the artifact printed below the features. This is due to the fact that in PBF-LM applications, the exposure of such a large area without any interruption potentially leads to the production of material characterized by strong internal stresses, which unavoidably introduce deformations in the part. These deformations can be so intense, depending on the process parameters and materials used, that they can cause test artifact distortions and consequently can affect the measurement accuracy. All of these are emphasized by the test artifact geometrical inspection strategy, which imposes measuring the part while still attached to the building platform and without any heat treatment (i.e., stress relief).
Conversely, the proposed test artifact is not affected by this issue, making the measurement of appropriate axis scaling possible without any significant shrinkage deformation along the X and Y axes due to the artifact material itself. In fact, by analyzing the plots obtained by the new test artifact design, it is possible to identify the difference between the X and Y axes through the identification of the specific regression coefficient (Table 10 and Table 11).
Furthermore, an effective advantage derived from the application of the proposed test artifact for machine capability evaluation is related to the high replicability of the industrial part’s printing conditions through the distribution of features to be measured, such as pins, all over the building platform.
5. Conclusions
Within this work, we defined the problem of how to check PBF-LM machine behaviors in a hypothetical additive production line. After the choice to adopt an ex situ strategy, we started by considering a well-known NIST test artifact from the AD perspective. The AD evaluation confirmed that the NIST artifact is not optimal in the scenario of machine capability assessment in an industrial production line. The redefinition of CNs for the considered scenario has been used to develop a different approach to test artifact design. The analysis shows that the AD approach to redesigning the test artifact produced an excellent result compared to the reference design.
The main characteristics of the proposed test artifact are:
- An uncoupled design matrix was obtained through better identification of the parameters used to tune the process.
- The artifact building time has been reduced by 90% compared to the NIST one (FR1), and the inspection time has changed from 16 h to 8 h (FR2).
- Allows the reliable identification of the beam offset and the scaling factor (FR3).
- Assess the performance all over the building platform (FR3.4).
Further experimental campaigns could be carried out by investigating the robustness of the proposed approach by testing different types of superalloys and multilaser machines, which are structurally more complex in their setting operations.
Author Contributions
Conceptualization, A.G. and F.C.; investigation, A.G. and F.C.; resources, S.K. and P.C.; methodology, A.G. and F.C.; validation, F.C., N.B. and S.K.; formal analysis, A.G. and F.C.; visualization, A.G., F.C. and N.B.; data curation, A.G., F.C. and N.B.; writing—original draft, A.G., F.C. and N.B.; writing—review and editing, A.G., F.C., N.B. and G.A.; supervision, G.A. and P.C. All authors have read and agreed to the published version of the manuscript.
Funding
This research received no external funding.
Data Availability Statement
Data are contained within the article.
Conflicts of Interest
Authors Filippo Ceccanti and Simon Kemble were employed by the company Baker Hughes—Nuovo Pignone. The remaining authors declare that the research was conducted in the absence of any commercial or financial relationships that could be construed as a potential conflict of interest.
References
- DebRoy, T.; Wei, H.; Zuback, J.; Mukherjee, T.; Elmer, J.; Milewski, J.; Beese, A.; Wilson-Heid, A.; De, A.; Zhang, W. Additive Manufacturing of Metallic Components—Process, Structure and Properties. Prog. Mater. Sci. 2018, 92, 112–224. [Google Scholar] [CrossRef]
- Sames, W.; List, F.; Pannala, S.; Dehoff, R.; Babu, S. The Metallurgy and Processing Science of Metal Additive Manufacturing. Int. Mater. Rev. 2016, 61, 315–360. [Google Scholar] [CrossRef]
- Frazier, W.E. Metal Additive Manufacturing: A Review. J. Mater. Eng. Perform. 2014, 23, 1917–1928. [Google Scholar] [CrossRef]
- Ngo, T.D.; Kashani, A.; Imbalzano, G.; Nguyen, K.T.Q.; Hui, D. Additive manufacturing (3D printing): A review of materials, methods, applications and challanges. Compos. Part B 2018, 143, 172–196. [Google Scholar] [CrossRef]
- Zhang, Y.; Wu, L.; Guo, X.; Kane, S.; Deng, Y.; Jung, Y.G.; Lee, J.Y.; Zhang, J. Additive manufacturing of metallic materials: A review. J. Mater. Eng. Perform. 2018, 27, 1–13. [Google Scholar] [CrossRef]
- Bourell, D.; Kruth, J.P.; Leu, M.; Levy, G.; Rosen, D.; Beese, A.M.; Clare, A. Materials for Additive Manufacturing. CIRP Ann. Manuf. Technol. 2017, 66, 659–681. [Google Scholar] [CrossRef]
- Achillas, C.; Tzetzis, D.; Raimondo, M.O. Alternative production strategies based on the comparison of additive and traditional manufacturing technologies. Int. J. Prod. Res. 2017, 55, 3497–3509. [Google Scholar] [CrossRef]
- Ciappi, A.; Giorgetti, A.; Ceccanti, F.; Canegallo, G. Technological and economical consideration for turbine blade tip restoration through metal deposition technologies. Proc. Inst. Mech. Eng. Part C J. Mech. Eng. Sci. 2021, 235, 1741–1758. [Google Scholar] [CrossRef]
- Kim, H.; Lin, Y.; Tseng, T.L.B. A review on quality control in additive manufacturing. Rapid Prototyp. J. 2018, 24, 645–669. [Google Scholar] [CrossRef]
- Mandolini, M.; Pradel, P.; Cicconi, P. Design for Additive Manufacturing: Methods and Tools. Appl. Sci. 2022, 12, 6548. [Google Scholar] [CrossRef]
- Ceccanti, F.; Giorgetti, A.; Citti, P. A support structure design strategy for laser powder bed fused parts. Procedia Struct. Integr. 2019, 24, 667–679. [Google Scholar] [CrossRef]
- Mostafaei, A.; Zhao, C.; He, Y.; Ghiaasiaan, S.R.; Shi, B.; Shao, S.; Shamsaei, N.; Wu, Z.; Kouraytem, N.; Sun, T.; et al. Defects and anomalies in powder bed fusion metal additive manufacturing. Curr. Opin. Solid State Mater. Sci. 2022, 26, 100974. [Google Scholar] [CrossRef]
- Giorgetti, A.; Baldi, N.; Palladino, M.; Ceccanti, F.; Arcidiacono, G.; Citti, P. A Method to Optimise Parameters Development in L-PBF Based on Single and Multitracks Analysis: A Case Study on Inconel 718 Alloy. Metals 2023, 13, 306. [Google Scholar] [CrossRef]
- Yadroitsava, I.; Els, J.; Booysen, G.; Yadroitsev, I. Peculiarities of single track formation from Ti6AL4V alloy at different laser power densities by selective laser melting. S. Afr. J. Ind. Eng. 2015, 26, 86–95. [Google Scholar] [CrossRef]
- Zheng, H.; Wang, Y.; Xie, Y.; Yang, S.; Hou, R.; Ge, Y.; Lang, L.; Gong, S.; Li, H. Observation of Vapor Plume Behavior and Process Stability at Single-Track and Multi-Track Levels in Laser Powder Bed Fusion Regime. Metals 2021, 11, 937. [Google Scholar] [CrossRef]
- Dong, Z.; Liu, Y.; Wen, W.; Ge, J.; Liang, J. Effect of Hatch Spacing on Melt Pool and As-built Quality During Selective Laser Melting of Stainless Steel: Modeling and Experimental Approaches. Materials 2019, 12, 50. [Google Scholar] [CrossRef]
- Caiazzo, F.; Alfieri, V.; Casalino, G. On the Relevance of Volumetric Energy Density in the Investigation of Inconel 718 Laser powder Bed Fusion. Materials 2020, 13, 538. [Google Scholar] [CrossRef]
- Johnson, L.; Mahmoudi, M.; Zhang, B.; Seede, R.; Huang, X.; Maier, J.T.; Maier, H.J.; Karaman, I.; Elwany, A.; Arróyave, R. Assessing printability maps in additive manufacturing of metal alloys. Acta Mater. 2019, 176, 199–210. [Google Scholar] [CrossRef]
- Tenbrock, C.; Fischer, F.G.; Wissenbach, K.; Schleifenbaum, J.H.; Wagenblast, P.; Meiners, W.; Wagner, J. Influence of keyhole and conduction mode melting for top-hat shaped beam profiles in laser powder bed fusion. J. Mater. Process. Technol. 2020, 278, 116514. [Google Scholar] [CrossRef]
- Guo, Y.; Jia, L.; Kong, B.; Wang, N.; Zhang, H. Single track and single layer formation in selective laser melting of niobium solid solution alloy. Chin. J. Aeronaut. 2018, 31, 860–866. [Google Scholar] [CrossRef]
- Mukherjee, T.; DebRoy, T. Mitigation of lack of fusion defects in powder bed fusion additive manufacturing. J. Manuf. Process. 2018, 36, 442–449. [Google Scholar] [CrossRef]
- Ma, H.Y.; Wang, J.C.; Qin, P.; Liu, Y.J.; Chen, L.Y.; Wang, L.Q.; Zhang, L.C. Advances in Additively Manufactured Titanium Alloys by Powder Bed Fusion and Directed Energy Deposition: Microstructure, Defects, and Mechanical Behavior. J. Mater. Sci. Technol. 2024, 183, 32–62. [Google Scholar] [CrossRef]
- Snow, Z.; Scime, L.; Ziabari, A.; Fisher, B.; Paquit, V. Scalable in situ non-destructive evaluation of additively manufactured components using process monitoring, sensor fusion, and machine learning. Addit. Manuf. 2023, 78, 103817. [Google Scholar] [CrossRef]
- Wang, J.; Zhu, R.; Liu, Y.; Zhang, L. Understanding melt pool characteristics in laser powder bed fusion: An overview of single-and multi-track melt pools for process optimization. Adv. Powder Mater. 2023, 2, 100137. [Google Scholar] [CrossRef]
- Feng, S.; Chen, Z.; Bircher, B.; Ji, Z.; Nyborg, L.; Bigot, S. Predicting laser powder bed fusion defects through in-process monitoring data and machine learning. Mater. Des. 2022, 222, 111115. [Google Scholar] [CrossRef]
- Land, W.S.I.; Zhang, B.; Davies, A. In-Situ Metrology System for Laser Powder Bed Fusion Additive Process. Procedia Manuf. 2015, 1, 393–403. [Google Scholar] [CrossRef]
- Bidare, P.; Maier, R.; Beck, R.; Shephard, J.; Moore, A. An Open-Architecture Metal Powder Bed Fusion System for In-Situ Process Measurements. Addit. Manuf. 2017, 16, 177–185. [Google Scholar] [CrossRef]
- Umaras, E.; Tsuzuki, M.S.G. Additive Manufacturing-Considerations on Geometric Accuracy and Factors of Influence. IFAC PapersOnLine 2017, 50, 14940–14945. [Google Scholar] [CrossRef]
- Ortega, N.; Martinez, S.; Cerrillo, I.; Lamikiz, A.; Ukar, E. Computed Tomography Approach to Quality Control of the Inconel 718 Components Obtained by Additive Manufacturing (SLM). Procedia Manuf. 2017, 13, 116–123. [Google Scholar] [CrossRef]
- Abdelrahman, M.; Reutzel, E.W.; Nassar, A.R.; Starr, T.L. Flaw Detection in Powder Bed Fusion Using Optical Imagining. Addit. Manuf. 2017, 15, 1–11. [Google Scholar]
- Scime, L.; Beuth, J. Anomaly Detection and Classification in a Laser Powder Bed Additive Manufacturing Process Using a Trained Computer Vision Algorithm. Addit. Manuf. 2018, 19, 114–126. [Google Scholar] [CrossRef]
- Krauss, H.; Zeugner, T.; Zaeh, M.F. Layerwise Monitoring of the Selective Laser Melting Process by Thermography. Phys. Procedia 2014, 56, 64–71. [Google Scholar] [CrossRef]
- Malekipour, E.; El-Mounayri, H. Common defects and contributing parameters in powder bed fusion AM process and their classification for online monitoring and control: A review. Int. J. Adv. Manuf. Technol. 2018, 95, 527–550. [Google Scholar] [CrossRef]
- Fahad, M.; Hopkinson, N. Evaluation and comparison of geometrical accuracy of parts produced by sintering-based additive manufacturing processes. Int. J. Adv. Manuf. Technol. 2017, 88, 3389–3394. [Google Scholar] [CrossRef]
- Ye, D.; Hong, G.S.; Zhang, Y.; Zhu, K.; Fuh, J.Y.H. Defect detection in selective laser melting technology by acoustic signals with deep belief networks. Int. J. Adv. Manuf. Technol. 2018, 96, 2791–2801. [Google Scholar] [CrossRef]
- Delgado, J.; Ciurana, J.; Rodriguez, C. Influence of process parameters on part quality and mechanical properties for DMLS and SLM with iron-based materials. Int. J. Adv. Manuf. Technol. 2012, 60, 601–610. [Google Scholar] [CrossRef]
- Yakout, M.; Cadamuro, A.; Elbestawi, M.A.; Veldhuis, S.C. The selection of process parameters in additive manufacturing for aerospace alloys. Int. J. Adv. Manuf. Technol. 2017, 92, 2081–2098. [Google Scholar] [CrossRef]
- Rebaioli, L.; Fassi, I. A review on benchmark artifacts for evaluating the geometrical performance of additive manufacturing processes. Int. J. Adv. Manuf. Technol. 2017, 5–8, 2571–2598. [Google Scholar] [CrossRef]
- Taylor, H.C.; Garibay, E.A.; Wicker, R.B. Toward a common laser powder bed fusion qualification test artifact. Addit. Manuf. 2021, 39, 101803. [Google Scholar] [CrossRef]
- Dimitrov, D.; Van Wijck, W.; Schreve, K.; De Beer, N.; Meijer, J. An investigation of the capability profile of the three dimensional printing process with an emphasis on the achievable accuracy. CIRP Ann. Manuf. Technol. 2003, 52, 189–192. [Google Scholar] [CrossRef]
- Scaravetti, D.; Dubois, P.; Duchamp, R. Qualification of rapid prototyping tools: Proposition of a procedure and a test part. Int. J. Adv. Manuf. Technol. 2008, 38, 683–690. [Google Scholar] [CrossRef]
- Brajlih, T.; Valentan, B.; Balic, J.; Drstvensek, I. Speed and accuracy evaluation of additive manufacturing machines. Rapid Prototyp. J. 2011, 17, 64–75. [Google Scholar] [CrossRef]
- Mahesh, M.; Wong, Y.S.; Fuh, J.Y.H.; Loh, H.T. Benchmarking for comparative evaluation of RP systems and processes. Rapid Prototyp. J. 2004, 10, 123–135. [Google Scholar] [CrossRef]
- Lopes, A.J.; Perez, M.A.; Espalin, D.; Wicker, R.B. Comparison of ranking models to evaluate desktop 3D printers in a growing market. Addit. Manuf. 2020, 35, 101291. [Google Scholar] [CrossRef]
- Ghany, K.A.; Moustafa, S.F. Comparison between the products of four RPM systems for metals. Rapid Prototyp. J. 2006, 12, 86–94. [Google Scholar] [CrossRef]
- Moylan, S.; Slotwinski, J.; Cooke, M.; Jurrens, K.; Alkan Donme, M. Proposal for a standardized test artifact for additive. In Solid Freeform Fabrication Symposium; University of Texas: Austin, TX, USA, 2012; pp. 902–920. [Google Scholar]
- Maurer, O.; Herter, F.; Bähre, D. Tolerancing the laser powder bed fusion process based on machine capability measures with the aim of process control. J. Manuf. Process. 2022, 80, 659–665. [Google Scholar] [CrossRef]
- Asnafi, N. Application of laser-based powder bed fusion for direct metal tooling. Metals 2021, 11, 458. [Google Scholar] [CrossRef]
- Moylan, S.; Slotwinski, J.; Cooke, A.; Jurrens, K.; Donmez, M.A. An Additive Manufacturing Test Artifact. J. Res. Natl. Inst. Stand. Technol. 2014, 119, 429–459. [Google Scholar] [CrossRef]
- ISO/ASTM 52941; Additive Manufacturing—System Performance and Reliability—Acceptance Tests for Laser Metal Powder-bed Fusion Machines for Metallic Materials for Aerospace Application. ASTM International: Conshohocken, PA, USA, 2020.
- ISO/ASTM 52902; Additive Manufacturing—Test Artifacts—Geometric Capability Assessment of Additive Manufacturing Systems. ASTM International: Conshohocken, PA, USA, 2019.
- Moshiri, M.; Tosello, G.; Mohanty, S. A new design for an extensive benchmarking of additive manufacturing machines. In Proceedings of the 18th International Conference of the European Society for Precision Engineering and Nanotechnology (Euspen 18), Venice, Italy, 4–8 June 2018. [Google Scholar]
- Moshiri, M.; Candeo, S.; Carmignato, S.; Mohanty, S.; Tosello, G. Benchmarking of Laser Powder Bed Fusion Machines. J. Manuf. Mater. Process. 2019, 3, 85. [Google Scholar] [CrossRef]
- Suh, N.P.; Suh, R. The Principles of Design; Oxford University Press: Oxford, UK, 1990. [Google Scholar]
- Coelho, A.M.G.; Mourão, A.J.F. Axiomatic design as support for decision-making in a design for manufacturing context: A case study. Int. J. Prod. Econ. 2007, 1–2, 81–89. [Google Scholar] [CrossRef]
- Brown, C.A. Axiomatic Design Applied to a Practical Example of the Integrity of Shaft Surfaces for Rotating Lip Seals. Procedia Eng. 2011, 19, 53–59. [Google Scholar] [CrossRef]
- Arcidiacono, G.; Matt, D.T.; Rauch, E. Axiomatic Design of a Framework for the Comprehensive Optimization of Patient Flows in Hospitals. J. Healthc. Eng. 2017, 2017, 2309265. [Google Scholar] [CrossRef]
- Arcidiacono, G.; Molon, M.; Nuzzi, S.; Placidoli, P. Improving Reliability of a fire-fighting pump set with Axiomatic Design. MATEC Web Conf. 2017, 127, 01014. [Google Scholar] [CrossRef]
- Girgenti, A.; Citti, P.; Delogu, M. A novel approach for axiomatic-based design for the environment. In Axiomatic Design in Large Systems; Farid, A., Suh, N., Eds.; Springer: Cham, Switzerland, 2016; pp. 131–148. [Google Scholar] [CrossRef]
- Sölvason, G.Ó.; Foley, J.T. Low-cost spectrometer for icelandic chemistry education. Procedia CIRP 2015, 34, 156–161. [Google Scholar] [CrossRef]
- Foley, J.T.; Harardóttir, S. Creative axiomatic design. Procedia CIRP 2016, 50, 240–245. [Google Scholar] [CrossRef]
- Monti, C.; Giorgetti, A.; Girgenti, A. An Axiomatic Design Approach for a Motorcycle Steering Damper. Procedia CIRP 2015, 34, 150–155. [Google Scholar] [CrossRef]
- Wang, Y.; Liu, A. Student’s Axiomatic Design Application Example of Battery Thermal Controller for High Altitude Balloon. MATEC Web Conf. 2018, 223, 01017. [Google Scholar] [CrossRef]
- Iino, K.; Arruti, A.; Nakao, M. Axiomatic Design Aspect of a Braking System Redesign. MATEC Web Conf. 2017, 127, 01003. [Google Scholar] [CrossRef]
- Bahadir, M.C.; Satoglu, S.I. A novel robot arm selection methodology based on axiomatic design principles. Int. J. Adv. Manuf. Technol. 2014, 71, 2043–2057. [Google Scholar] [CrossRef]
- Bang, I.C.; Heo, G. An axiomatic design approach in development of nanofluid coolants. Appl. Therm. Eng. 2009, 29, 75–90. [Google Scholar] [CrossRef]
- Giorgetti, A.; Anselmi, M.; Scatena, A. Improvement of the Test Equipment for a Stress Corrosion Lab through the Axiomatic Design. Procedia CIRP 2015, 34, 162–167. [Google Scholar] [CrossRef]
- Giorgetti, A.; Citti, P.; Romanelli, M. Development of a Custom Software for Processing the Stress Corrosion Experimental Data through Axiomatic Design. Procedia CIRP 2015, 34, 250–255. [Google Scholar] [CrossRef]
- Arcidiacono, G.; Brown, C.; Bucciarelli, L.; Melosi, F. Axiomatic Design of Production Systems for Performance Improvement: A Project Identification and Prioritisation Model. In Axiomatic Design in Large Systems; Farid, A., Suh, N., Eds.; Springer: Cham, Switzerland, 2016; pp. 251–262. [Google Scholar] [CrossRef]
- Suh, N.P. Axiomatic Design: ADVANCES and Applications; Oxford University Press: New York, NY, USA, 2001. [Google Scholar]
- Suh, N.P. Complexity: Theory and Applications; Oxford University Press: Oxford, UK, 2005. [Google Scholar]
- Suh, N.P.; Cavique, M.; Foley, J.T. Design Engineering and Science; Springer Nature: Berlin/Heidelberg, Germany, 2021. [Google Scholar]
- Giorgetti, A.; Ceccanti, F.; Citti, P.; Ciappi, A.; Arcidiacono, G. Axiomatic Design of Test Artifact for Laser Powder Bed Fusion Machine Capability Assessment. MATEC Web Conf. 2019, 301, 00006. [Google Scholar] [CrossRef]
- Thompson, M.K. A Classification of Procedural Errors in the Definition of Functional Requirements in Axiomatic Design Theory. In Proceedings of the 7th International Conference on Axiomatic Design (ICAD’13), Worcester, MA, USA, 27–28 June 2013. [Google Scholar]
Figure 1.
NIST test artifact [73,74]: (a) geometry and main features, (b) position of the artifact on the building platform.
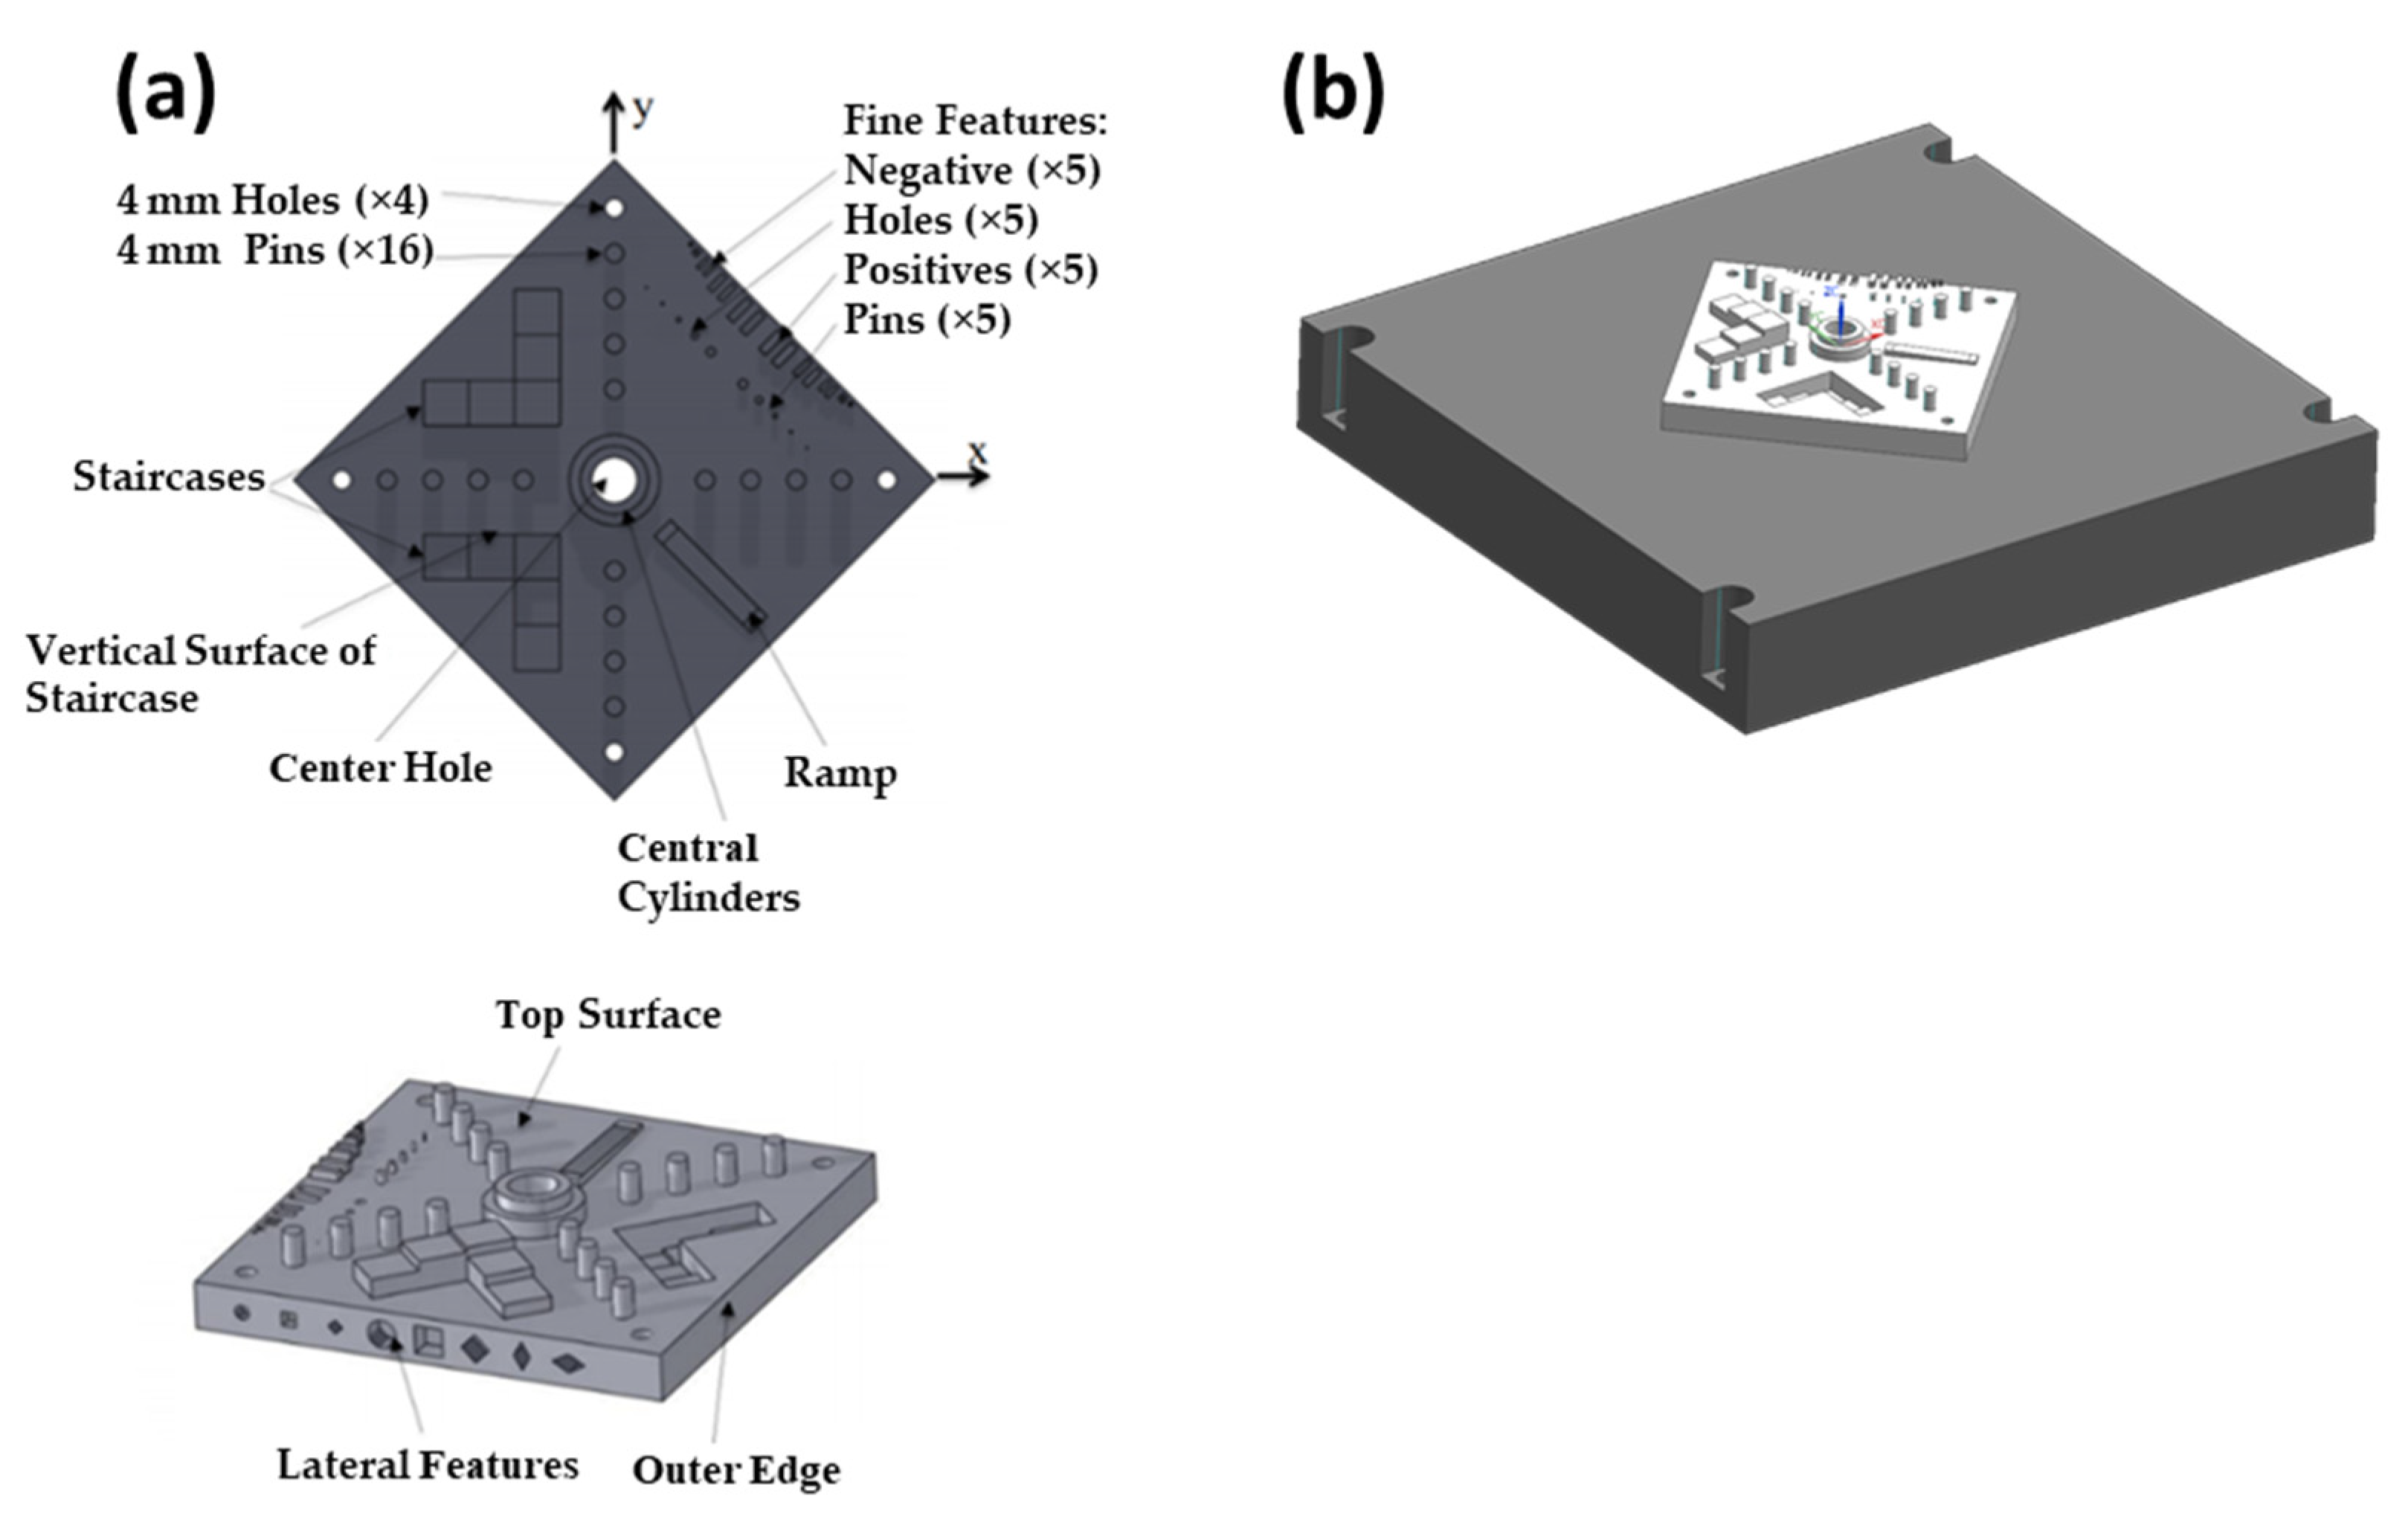
Figure 2.
FRs-DPs matrix of test artifact proposed by NIST.

Figure 3.
Redesign FRs-DPs matrix.
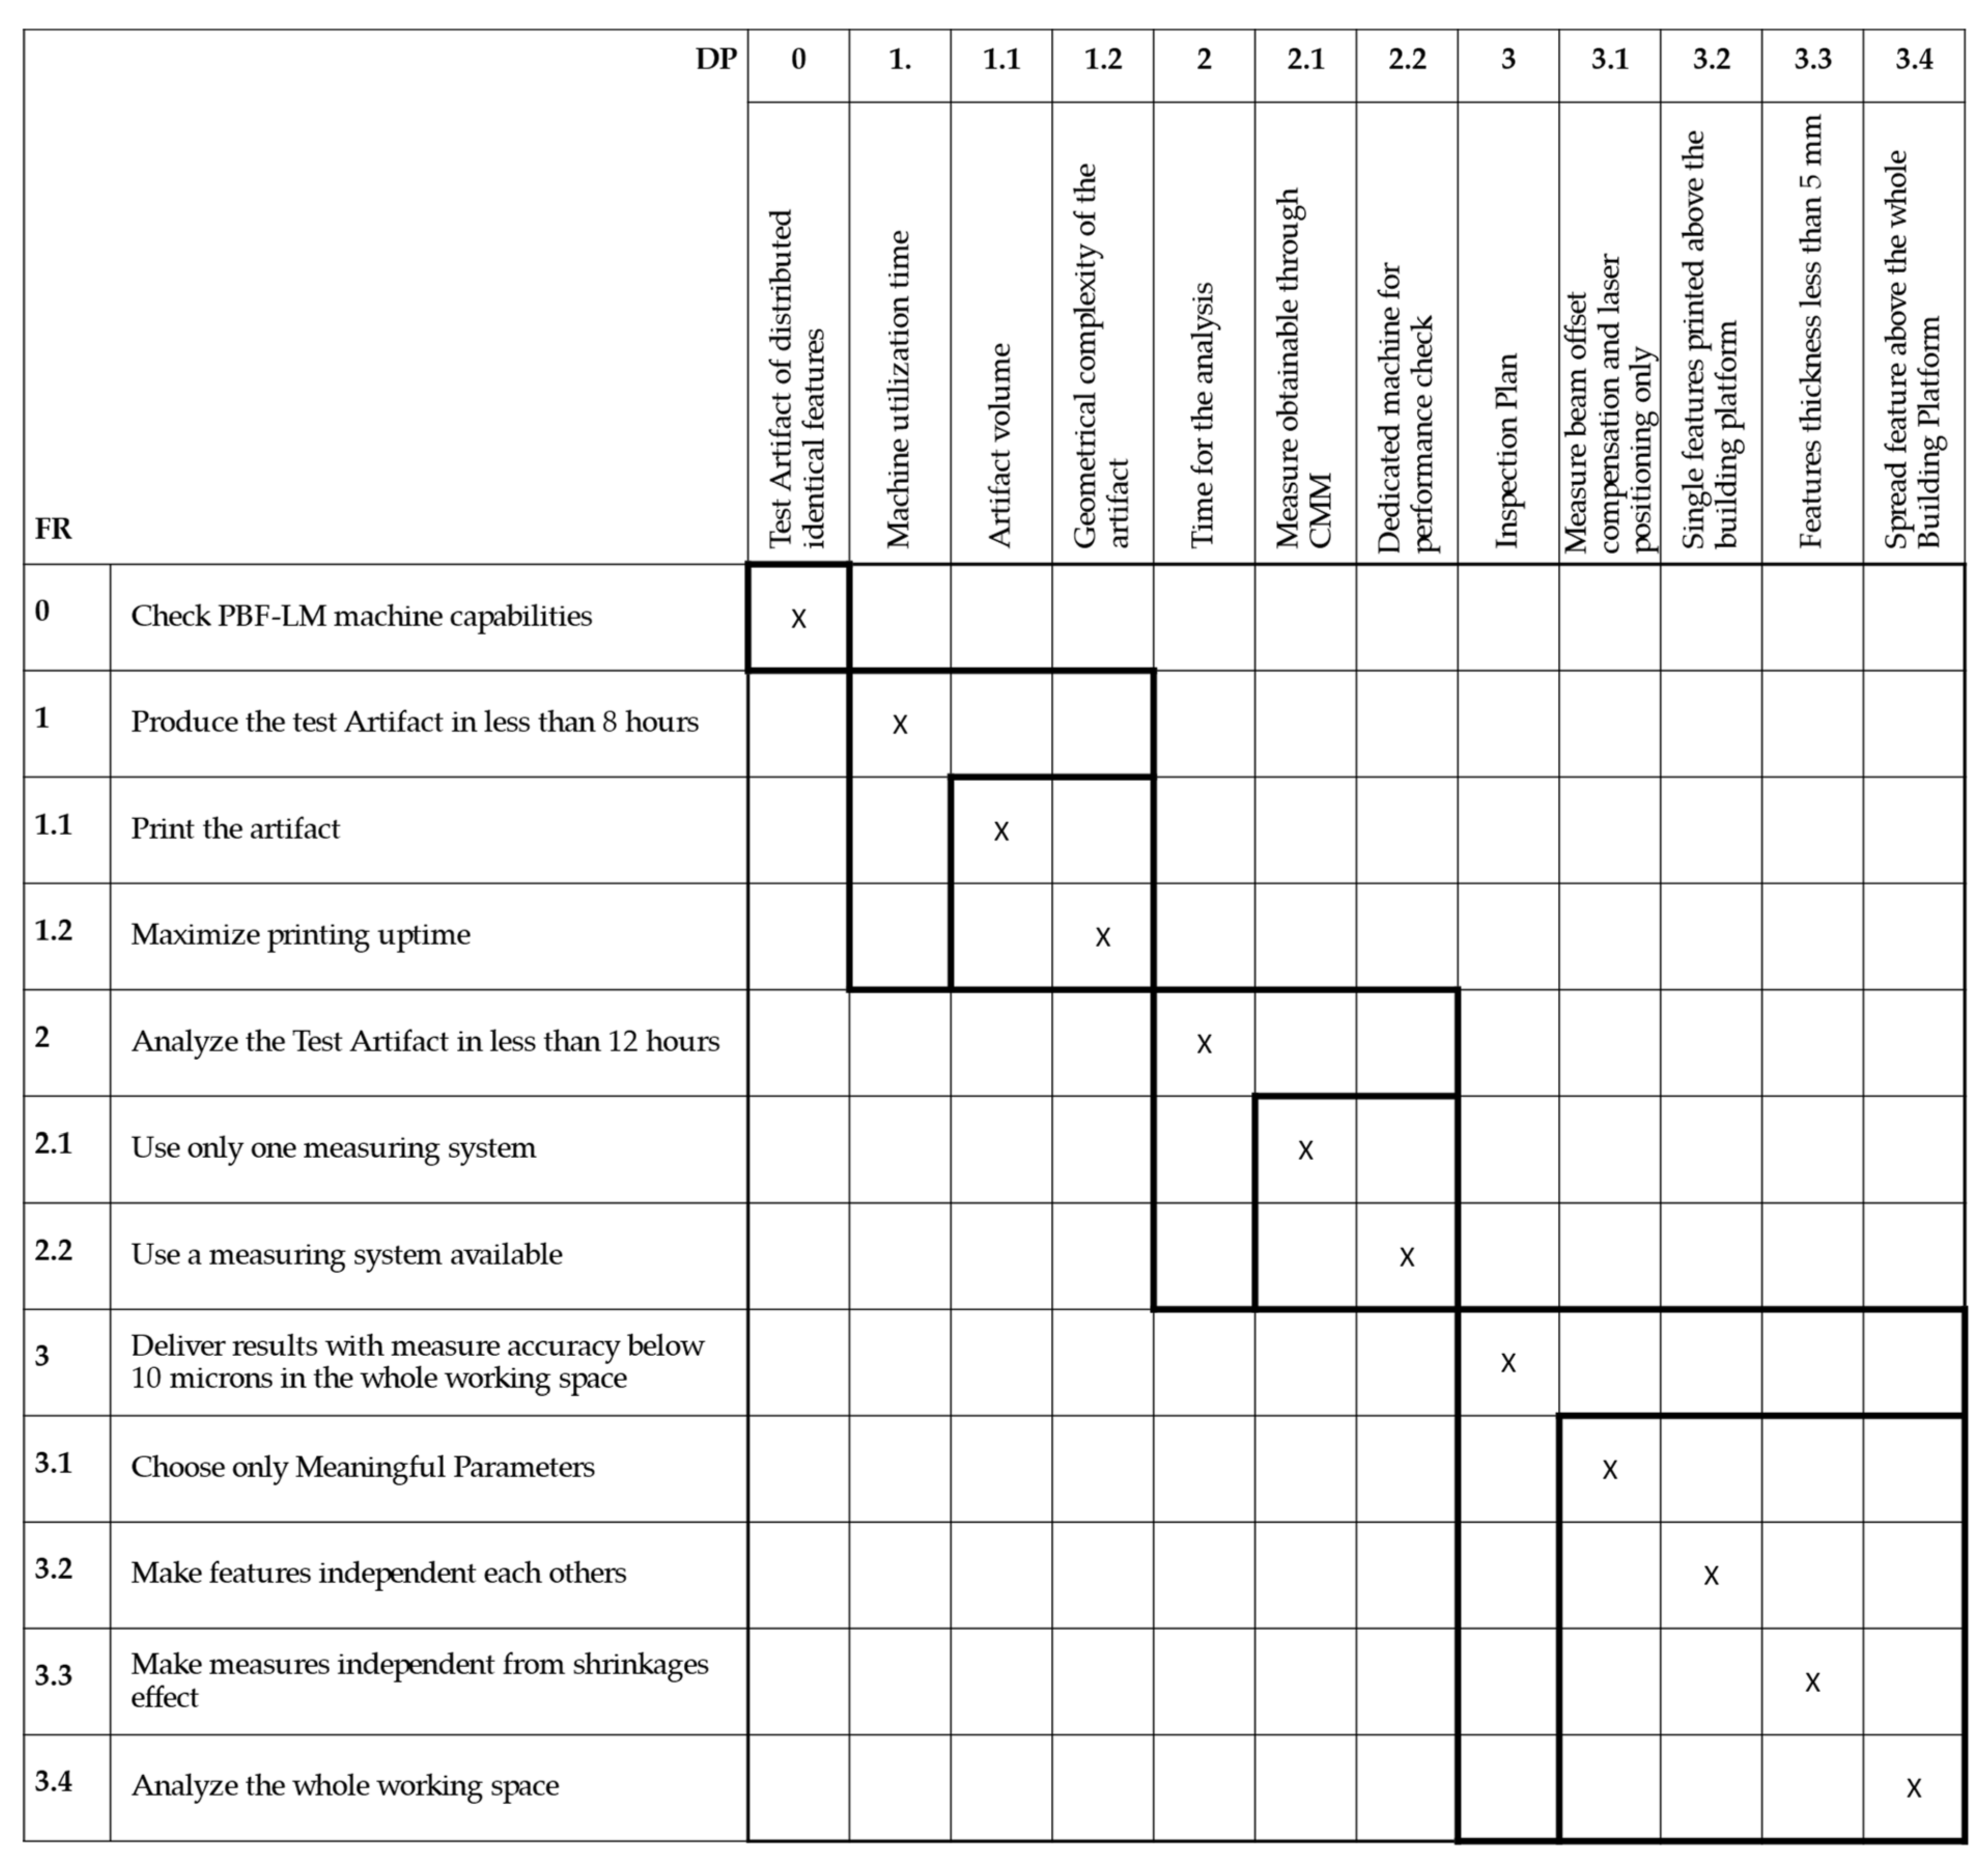
Figure 4.
CAD model of the redesigned test artifact.
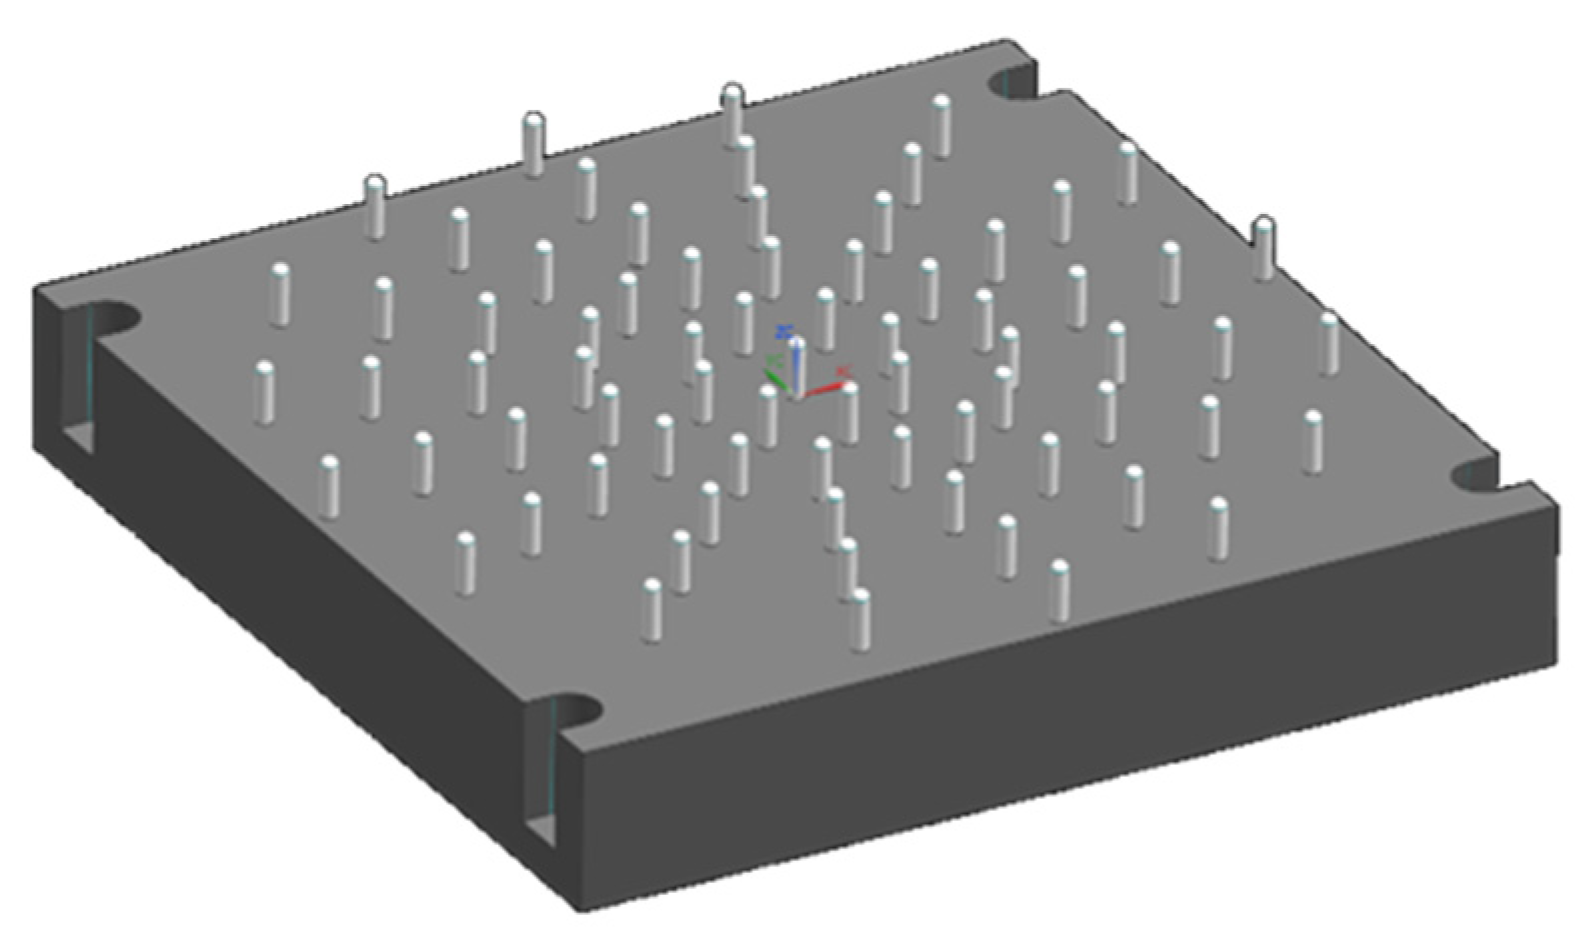
Figure 5.
Beam offset compensation.

Figure 6.
Measure on each pin: (a) a–e planes on which circumferences are identified, (b) how the circumference of each pin is measured on each plane.
Figure 6.
Measure on each pin: (a) a–e planes on which circumferences are identified, (b) how the circumference of each pin is measured on each plane.
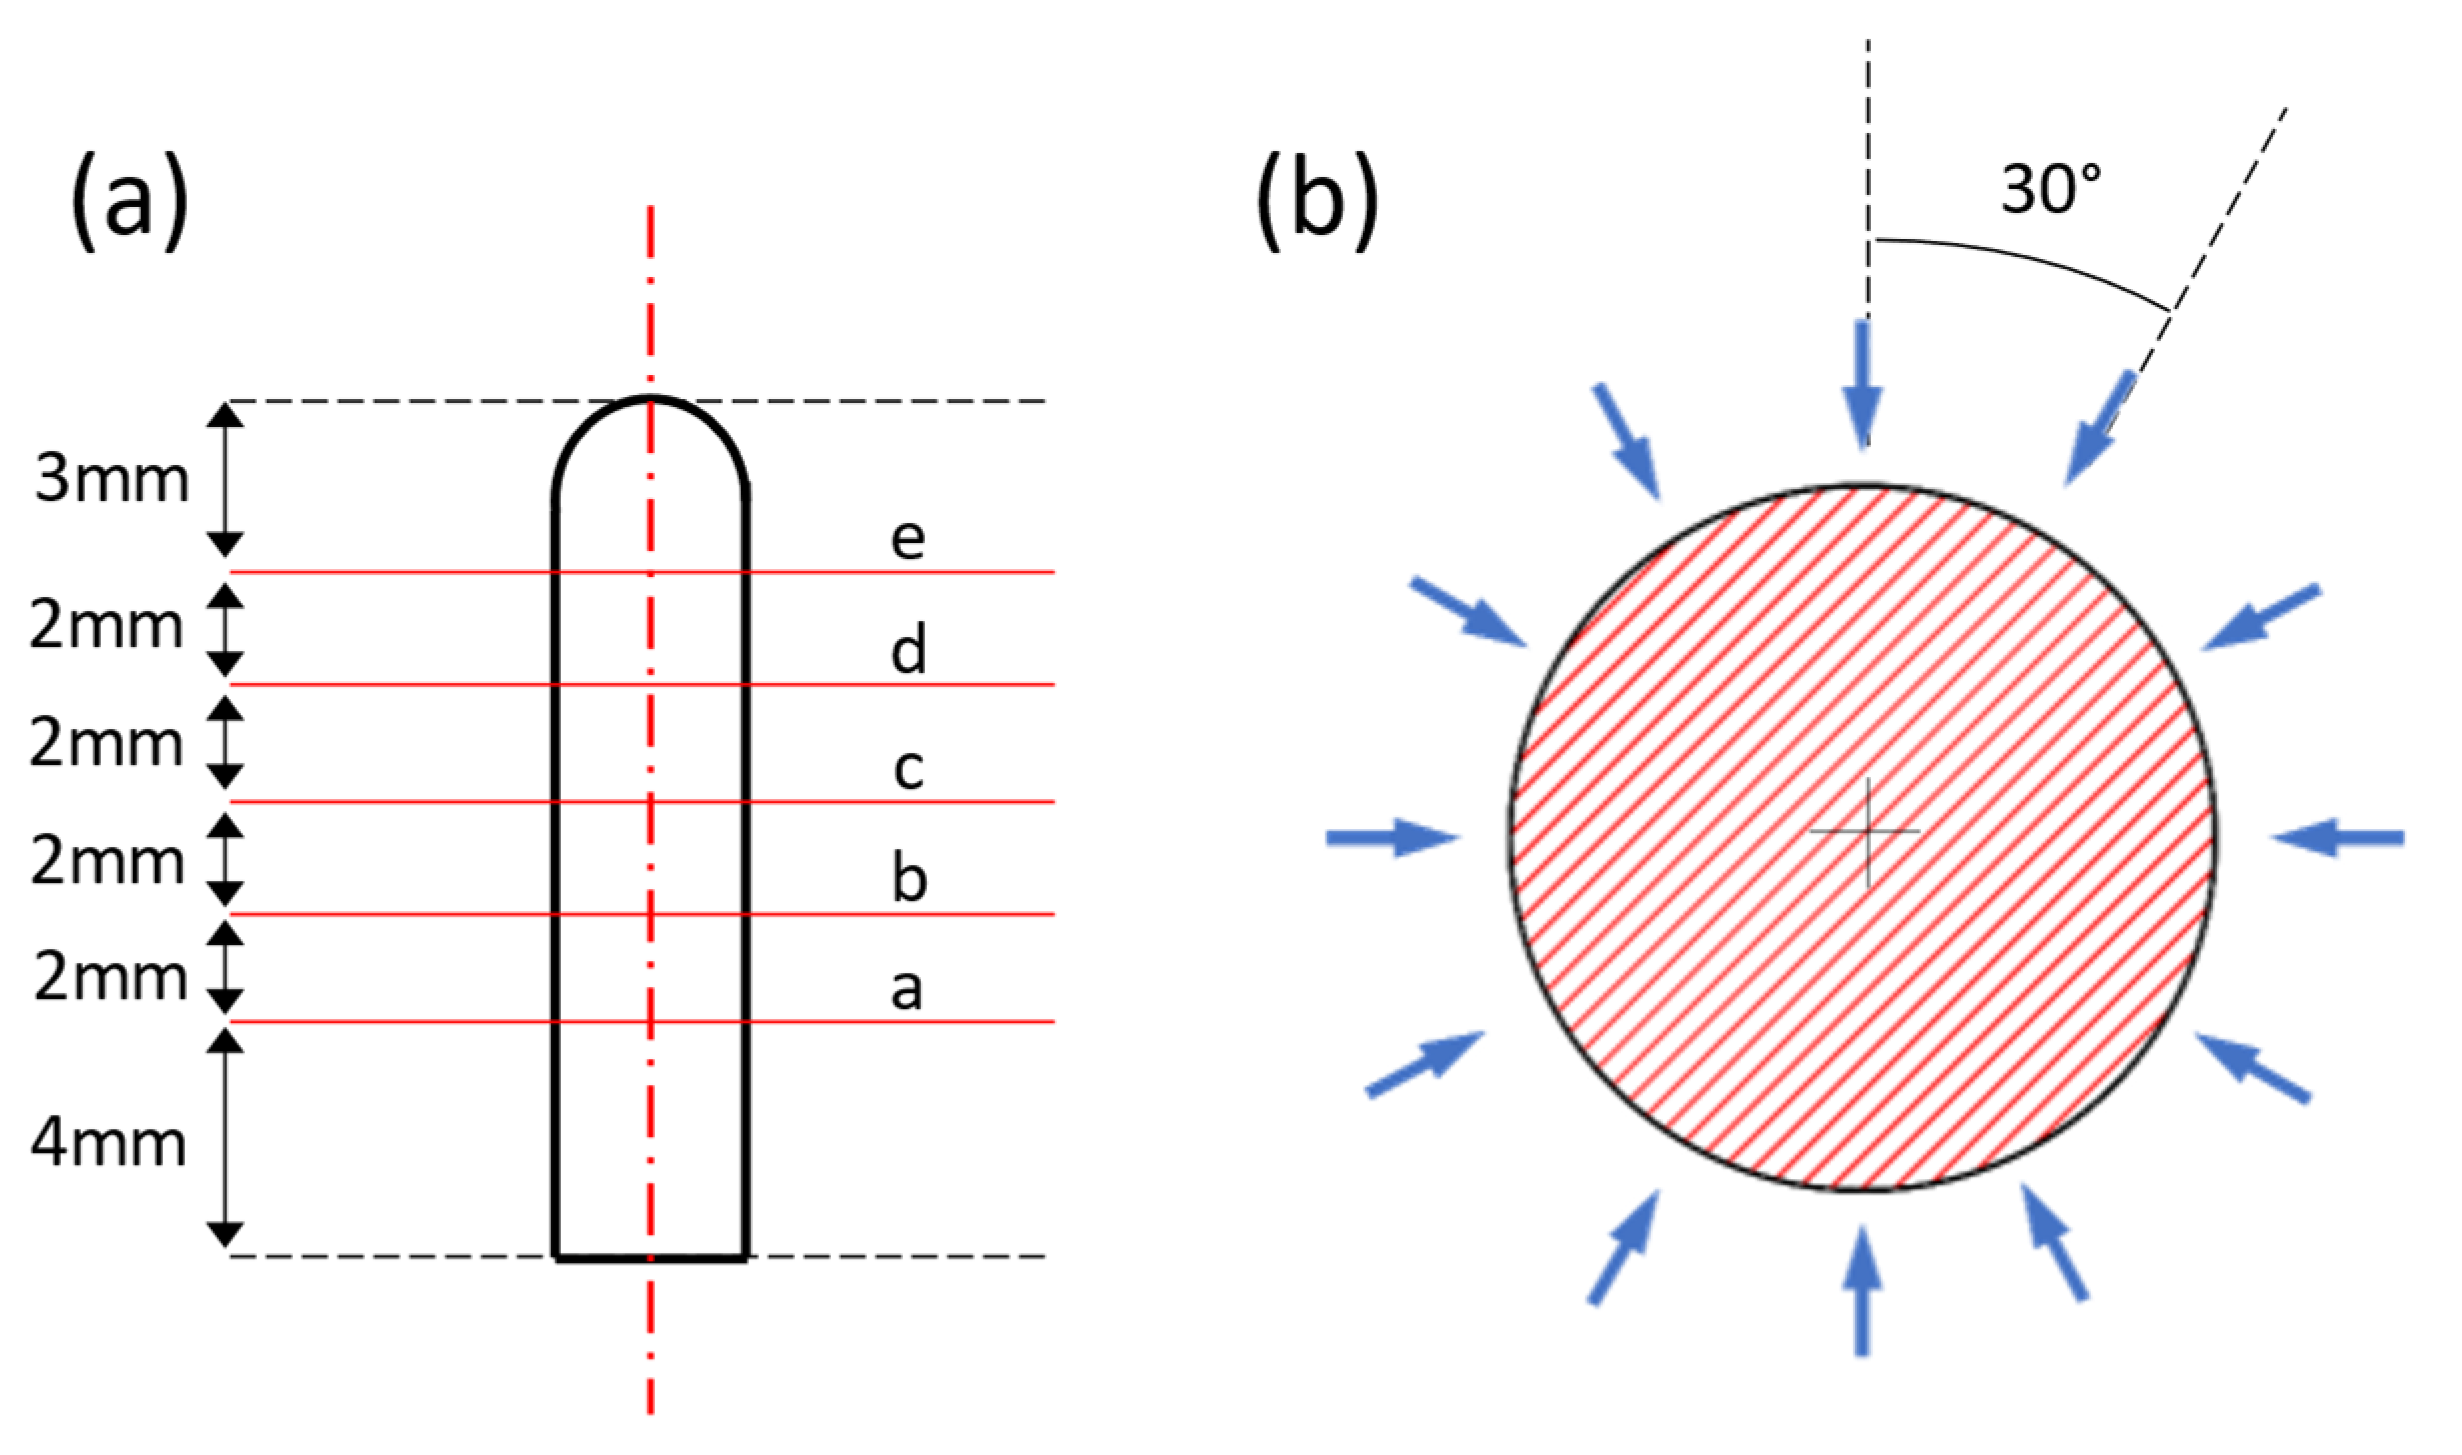
Figure 7.
Deviations from the nominal diameter: (a) NIST reference test artifact, (b) proposed new test artifact.
Figure 7.
Deviations from the nominal diameter: (a) NIST reference test artifact, (b) proposed new test artifact.
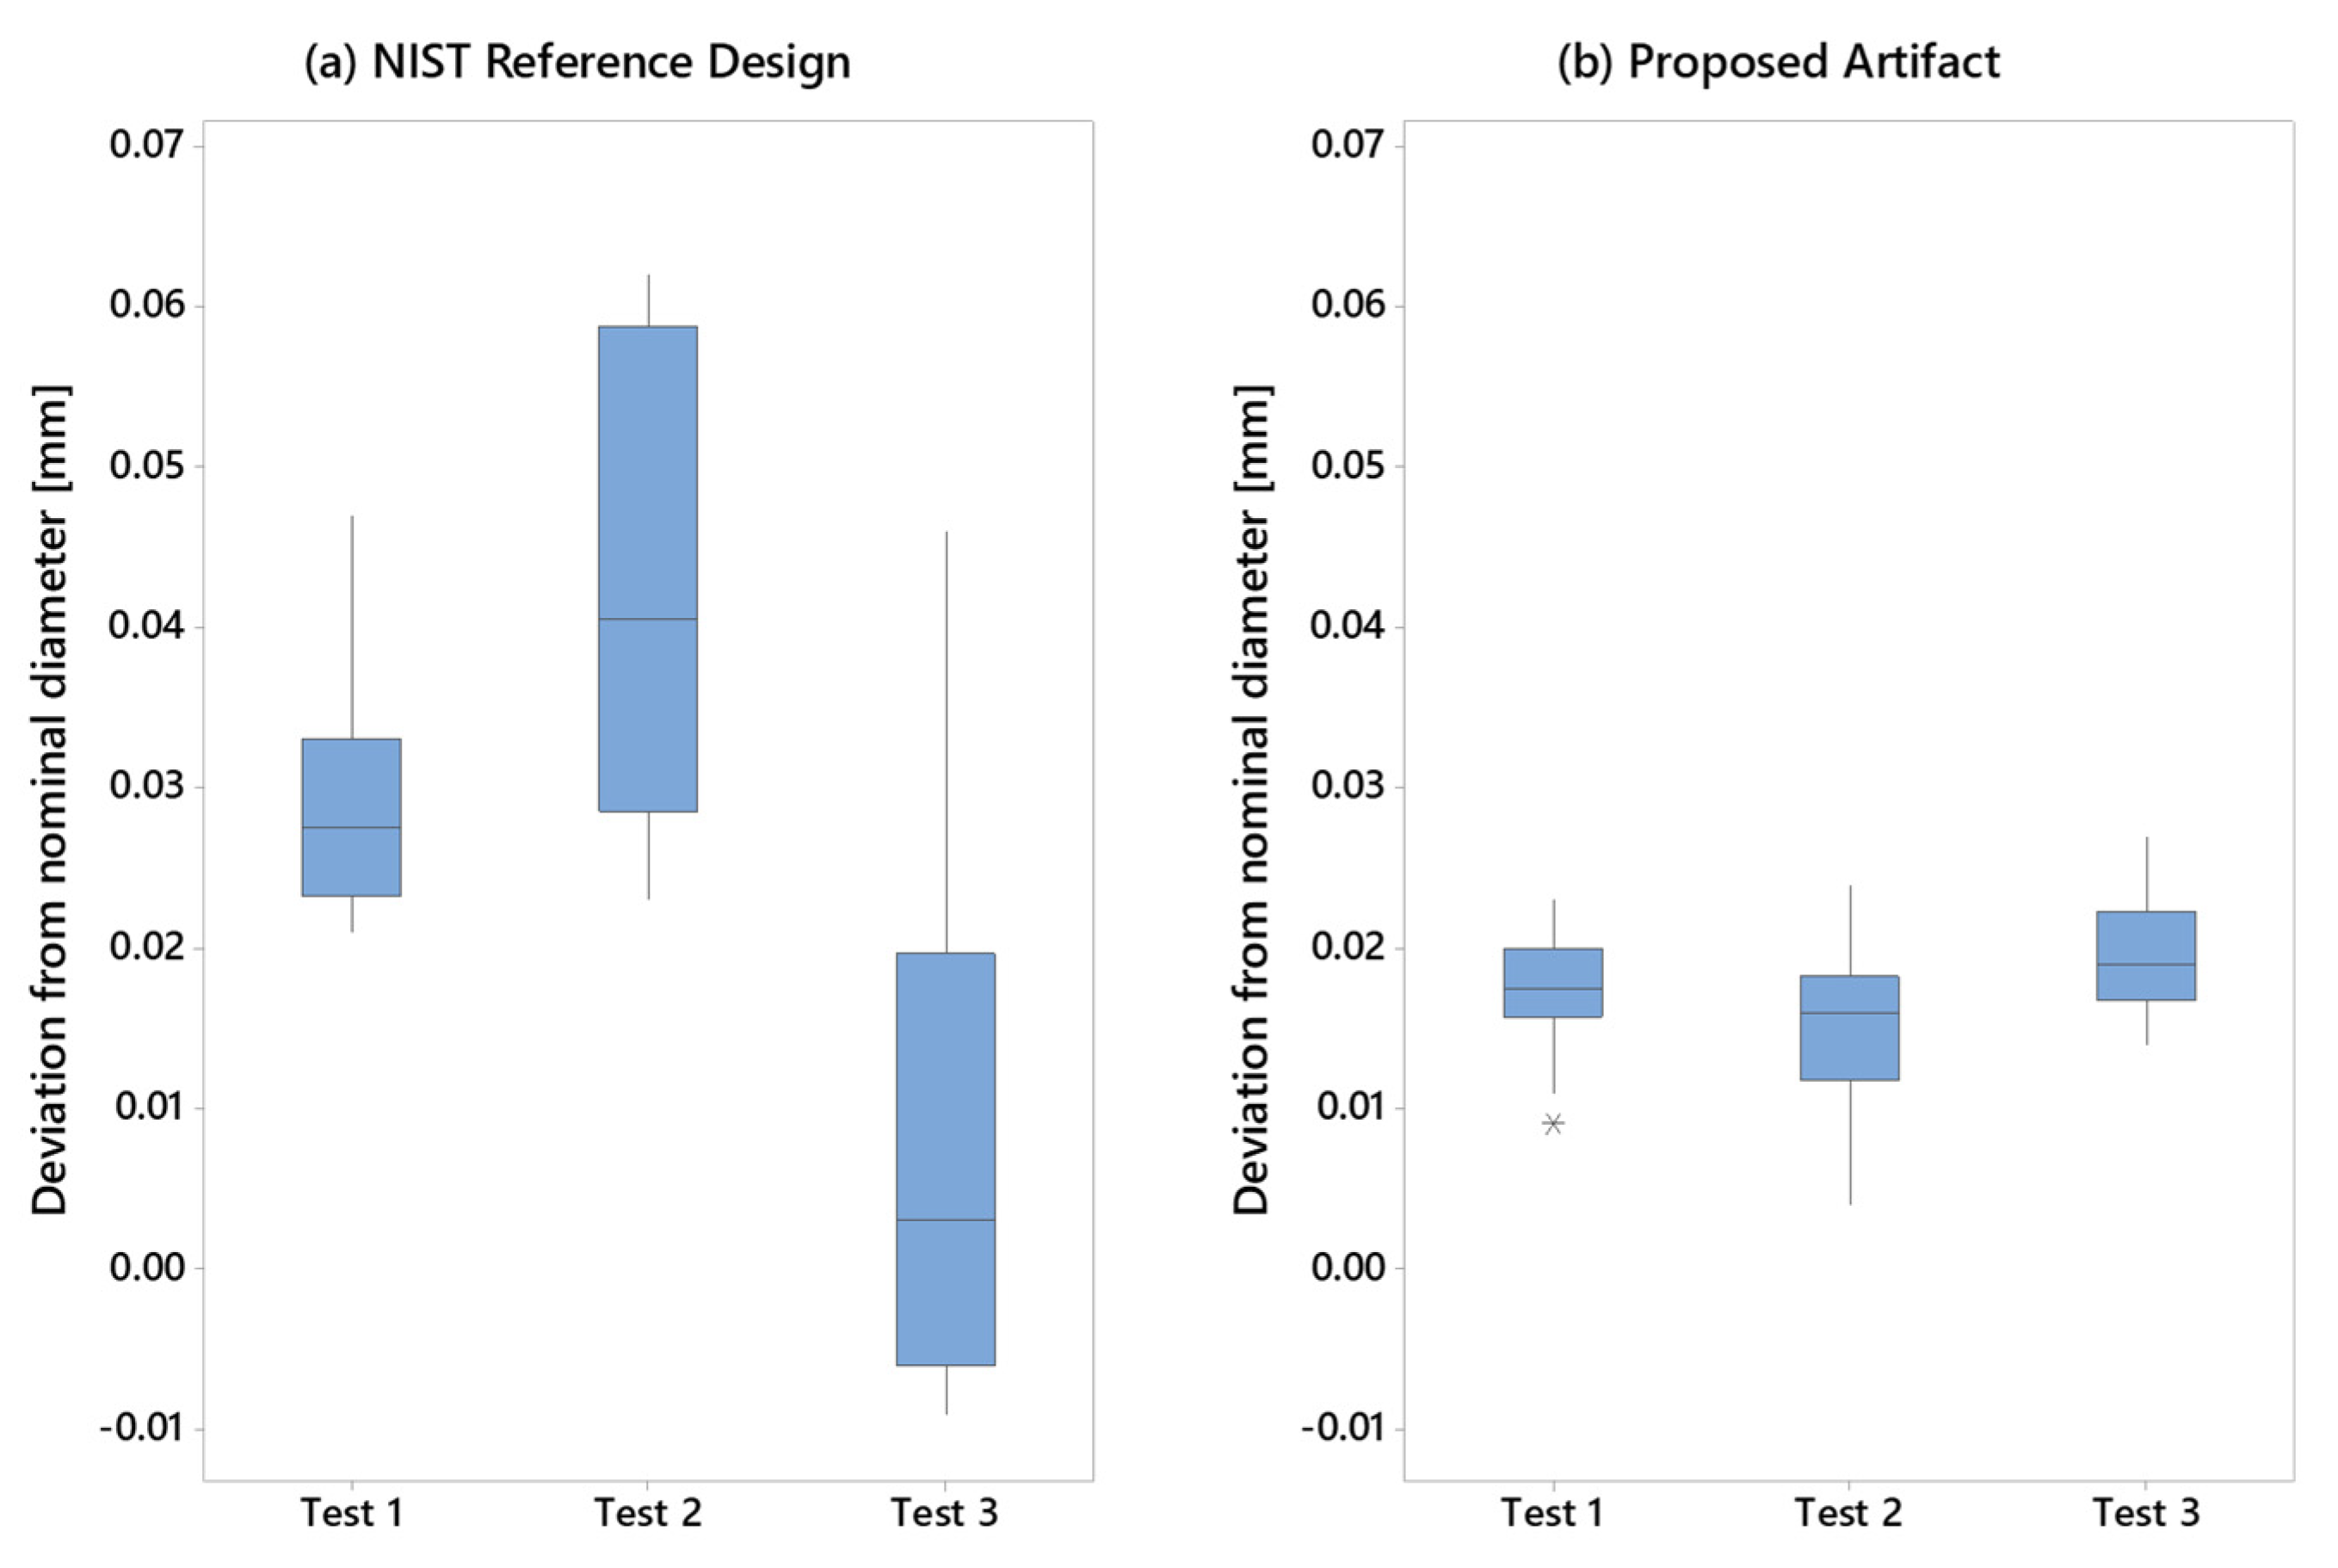
Figure 8.
X-axis pin position, reference design.
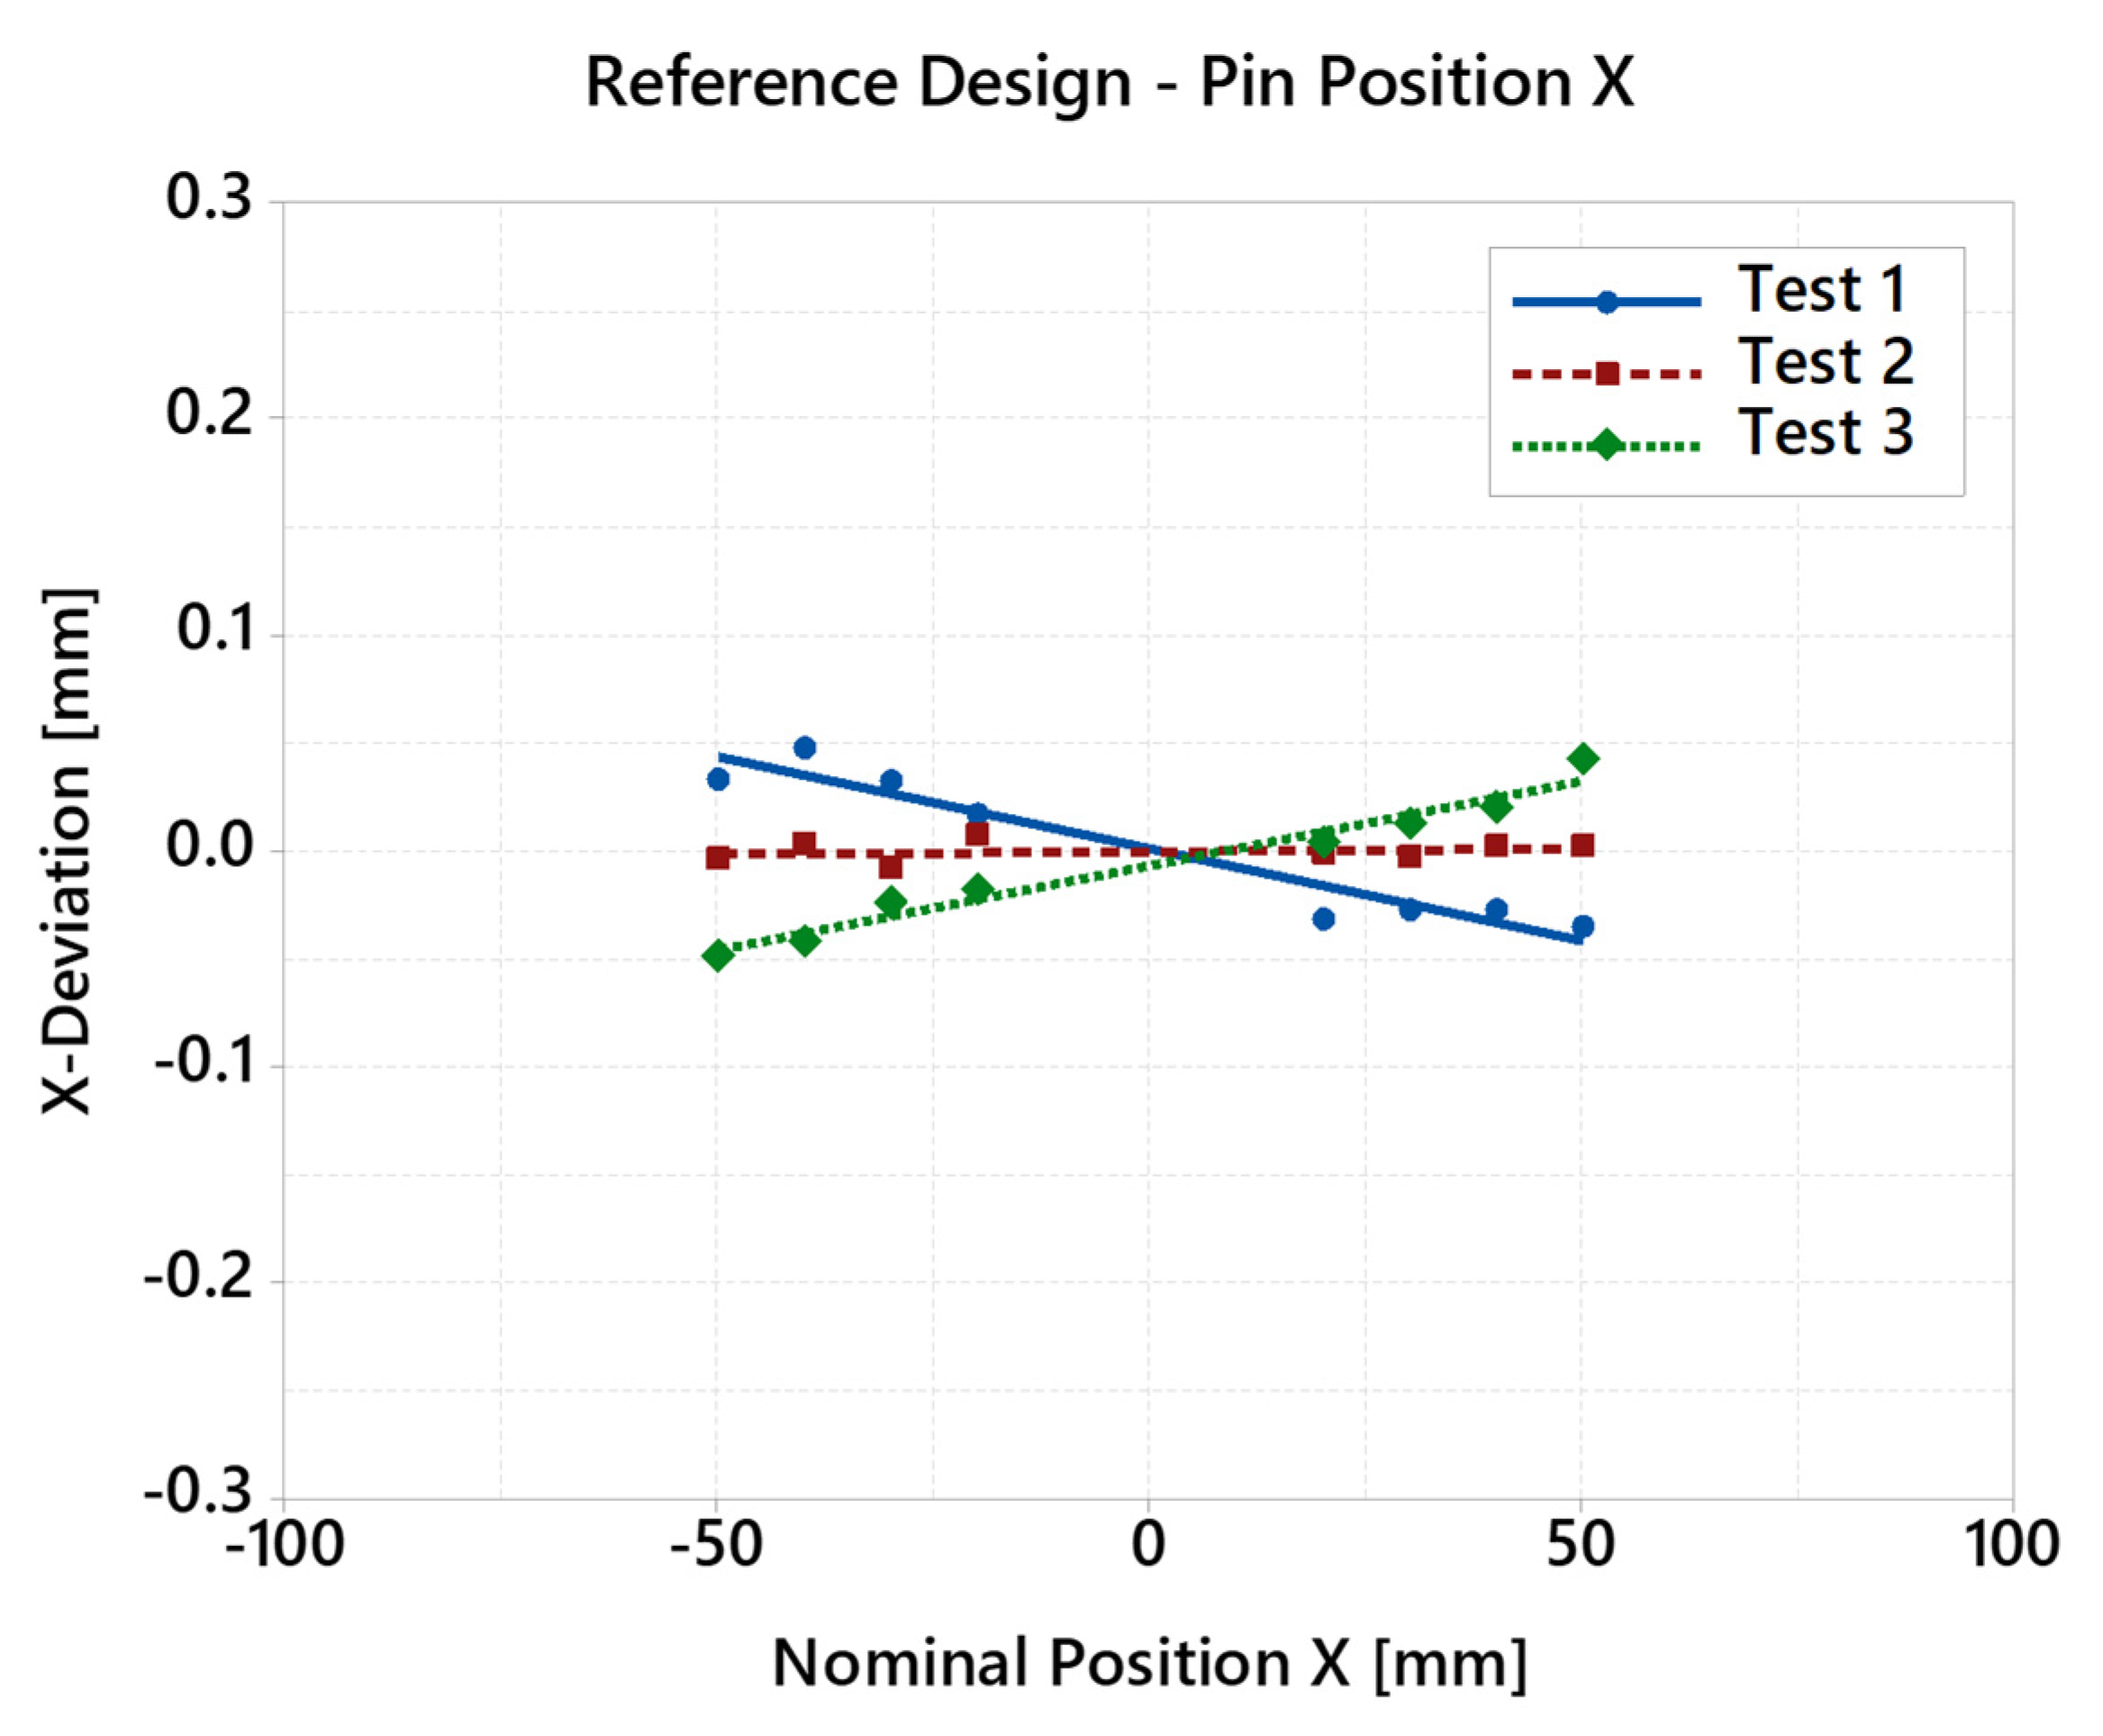
Figure 9.
X-axis pin position, proposed design.

Figure 10.
Y-axis pin position, reference design.
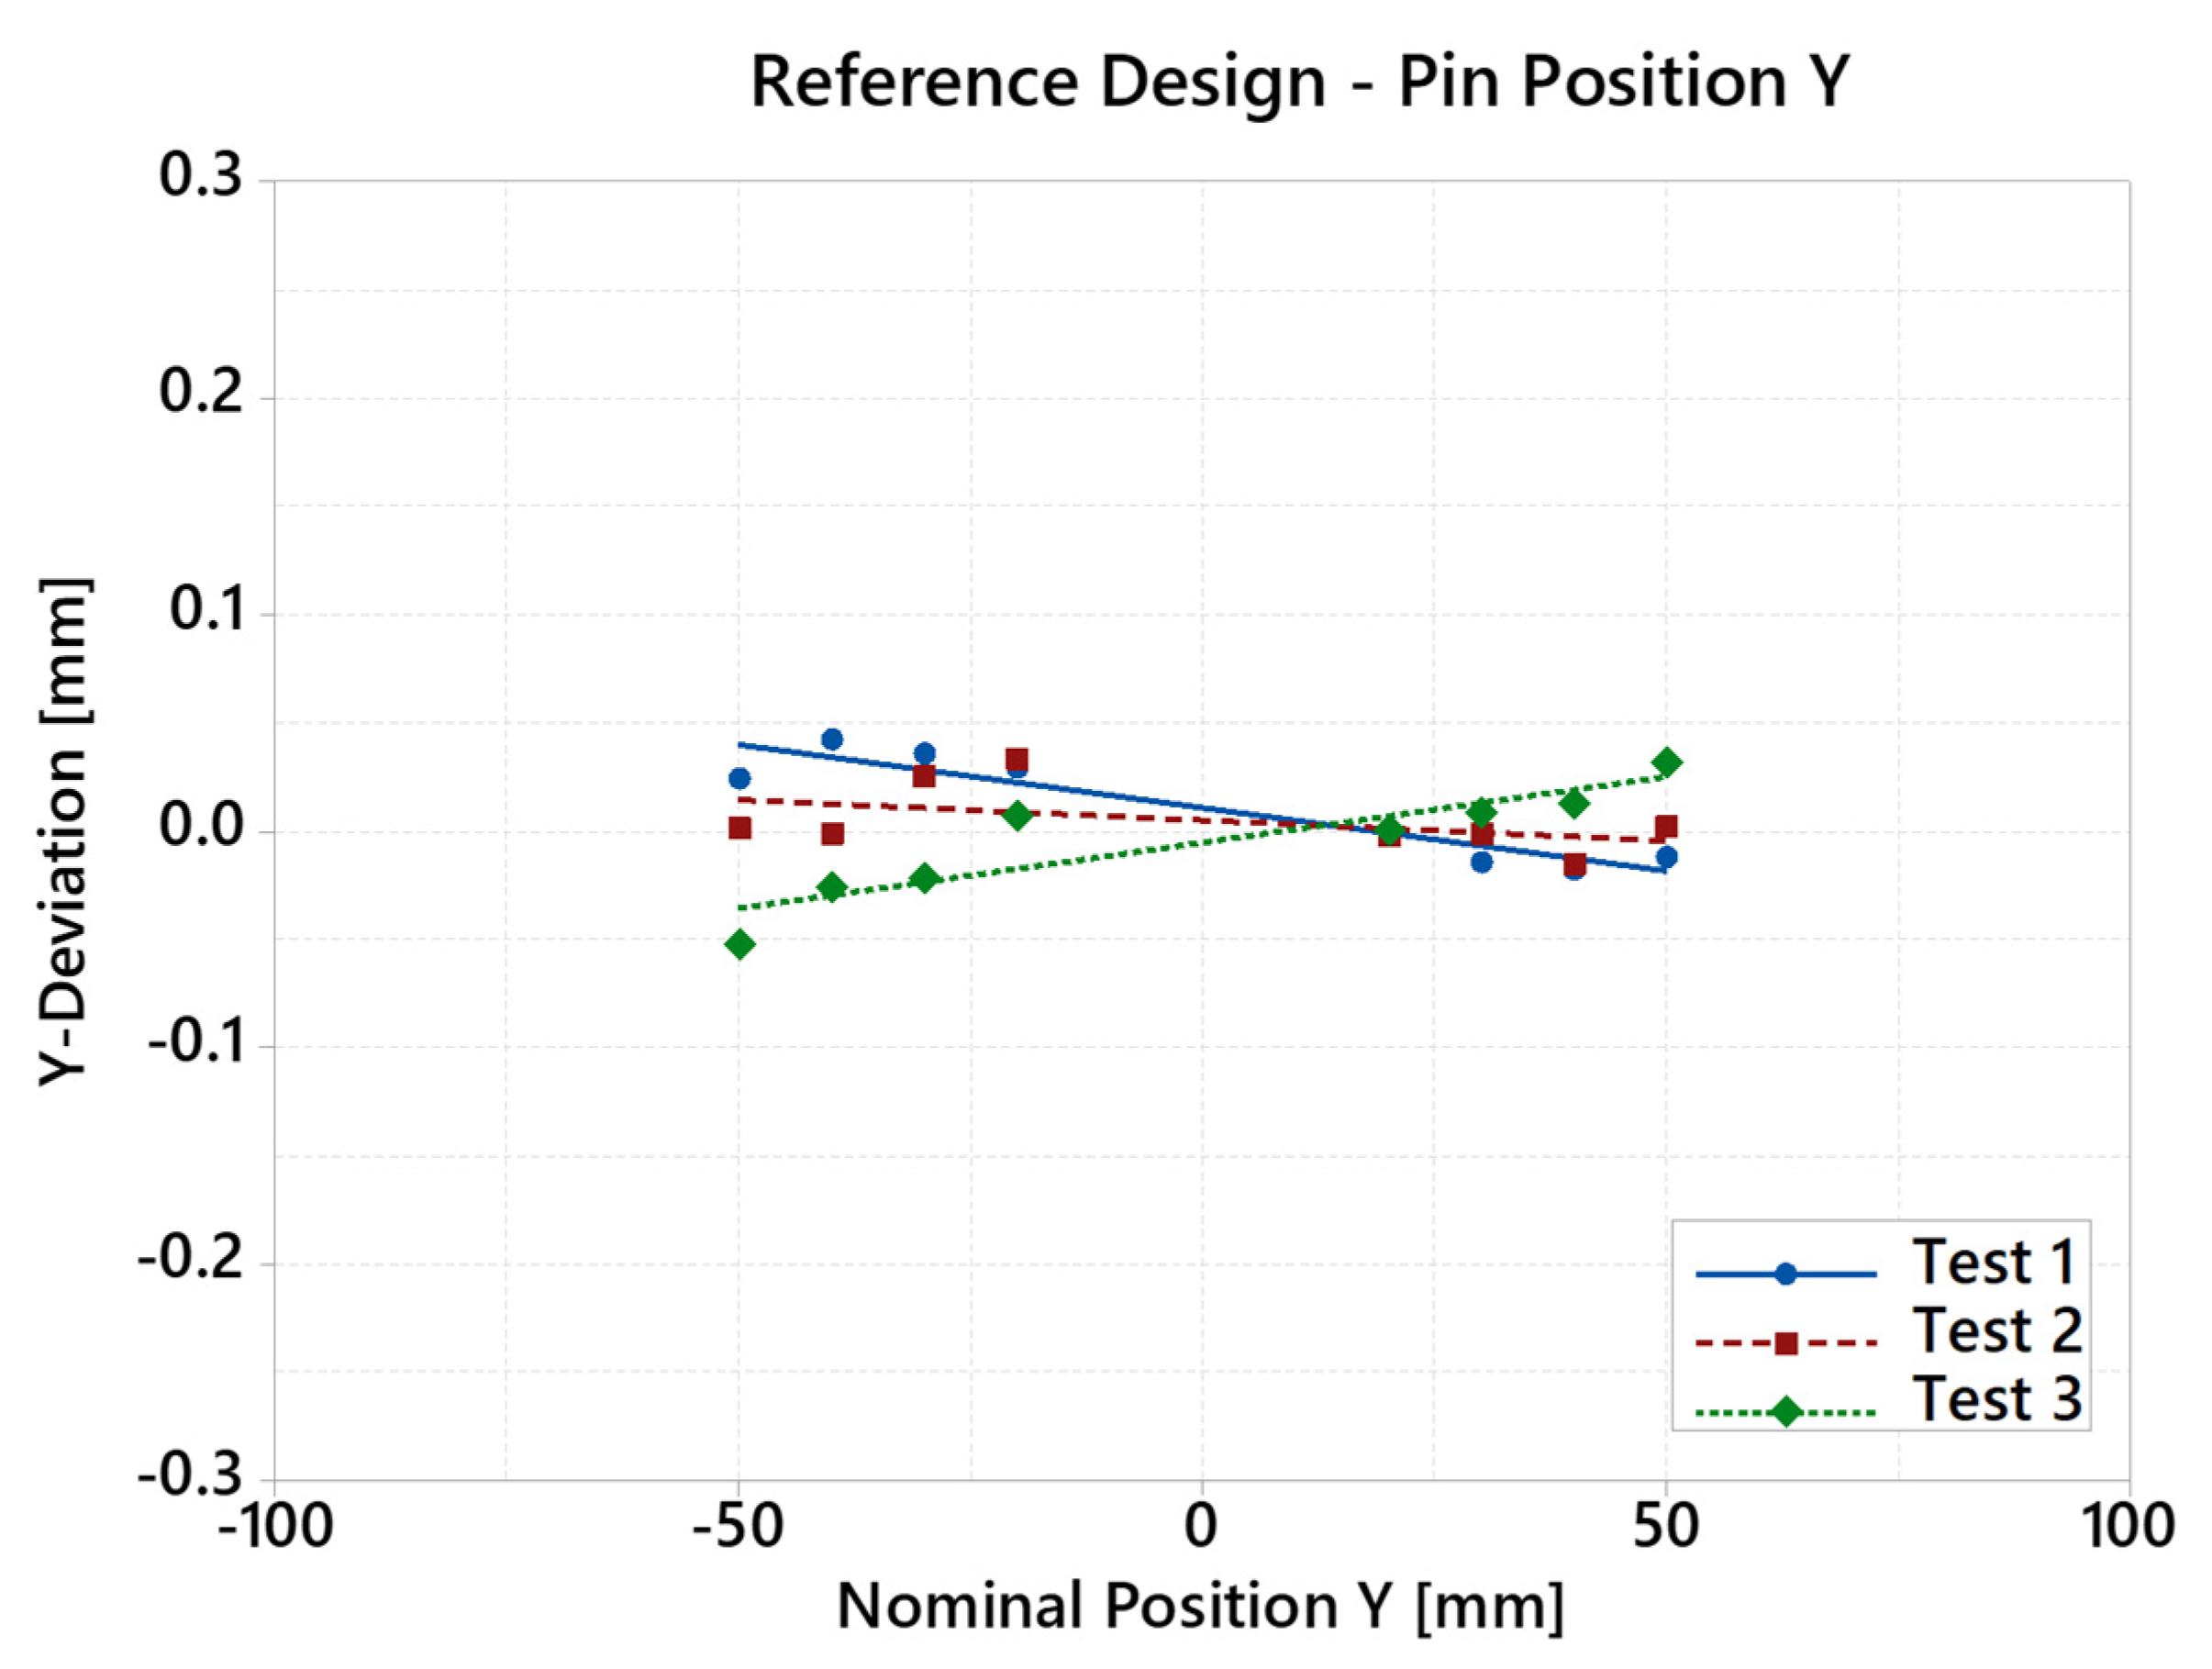
Figure 11.
Y-axis pin position, proposed design.

Table 1.
FRs of NIST test artifact.
| FR | |
|---|---|
| 0 | Evaluate the performance of the system |
| 1 | Measure process precision |
| 2 | Measure shrinkage |
| 3 | Assess process capability |
| 4 | Measure roughness |
Table 2.
DPs of NIST test artifact.
| DP | |
|---|---|
| 0 | Test artifact with multiple different geometric features |
| 1 | Pins |
| 2 | Central cylinders |
| 3 | Holes |
| 4 | Bulk material |
| 5 | Lateral features |
| 6 | Fine features |
| 7 | Staircase features |
| 8 | Ramp features |
| 9 | Flat top plane |
Table 3.
FRs of proposed test artifact.
| FR | |
|---|---|
| 0 | Check PBF-LM machine capabilities |
| 1 | Produce the test artifact in less than 8 h |
| 1.1 | Print the artifact |
| 1.2 | Maximize printing uptime |
| 2 | Analyze the test artifact in less than 12 h |
| 2.1 | Use only one measuring system |
| 2.2 | Use an available measure system |
| 3 | Deliver results with measure accuracy below 10 microns in the whole working space |
| 3.1 | Choose only meaningful parameters |
| 3.2 | Make features independent from each other |
| 3.3 | Make measures independent from shrinkages effect |
| 3.4 | Analyze the whole working space |
Table 4.
DPs of proposed test artifact.
| DP | |
|---|---|
| 0 | Test artifact of distributed identical features |
| 1 | Machine utilization time |
| 1.1 | Artifact volume |
| 1.2 | Geometrical complexity of the artifact |
| 2 | Time for the analysis |
| 2.1 | Measure obtainable through CMM * |
| 2.2 | Dedicated machine for performance check |
| 3 | Inspection plan |
| 3.1 | Measure beam offset compensation and laser positioning only |
| 3.2 | Single features printed above the building platform |
| 3.3 | Features thickness less than 5 mm |
| 3.4 | Spread features above the whole building platform |
* CMM: Coordinate Measuring Machine considered the industry standard.
Table 5.
Process parameters set used during the test.
| Laser Power (W) | 250 |
| Scanning Speed (mm/s) | 1000 |
| Hatch Distance (mm) | 0.09 |
Table 6.
Pin average deviation from nominal diameter measured on the NIST test artifact (Confidence Interval ±0.004 mm).
Table 6.
Pin average deviation from nominal diameter measured on the NIST test artifact (Confidence Interval ±0.004 mm).
| Δ⌀ | Test 1 [mm] | Test 2 [mm] | Test 3 [mm] |
|---|---|---|---|
| 1X | 0.023 | 0.027 | −0.005 |
| 2X | 0.040 | 0.031 | 0.016 |
| 3X | 0.022 | 0.023 | −0.008 |
| 4X | 0.024 | 0.028 | −0.006 |
| 5X | 0.022 | 0.057 | 0.008 |
| 6X | 0.024 | 0.044 | 0.004 |
| 7X | 0.021 | 0.037 | −0.009 |
| 8X | 0.031 | 0.059 | −0.006 |
| 1Y | 0.047 | 0.062 | 0.044 |
| 2Y | 0.033 | 0.061 | 0.046 |
| 3Y | 0.033 | 0.061 | 0.025 |
| 4Y | 0.024 | 0.058 | 0.021 |
| 5Y | 0.027 | 0.046 | −0.006 |
| 6Y | 0.032 | 0.031 | 0.002 |
| 7Y | 0.028 | 0.028 | −0.005 |
| 8Y | 0.033 | 0.030 | 0.006 |
| MEAN | 0.029 | 0.043 | 0.008 |
| SD | 0.007 | 0.015 | 0.018 |
Table 7.
Pin average deviation from nominal diameter measured on new test artifact (Confidence Interval ±0.0007 mm).
Table 7.
Pin average deviation from nominal diameter measured on new test artifact (Confidence Interval ±0.0007 mm).
| Δ⌀ | Test 1 [mm] | Test 2 [mm] | Test 3 [mm] |
|---|---|---|---|
| 1 | 0.014 | 0.004 | 0.014 |
| 2 | 0.017 | 0.012 | 0.016 |
| 3 | 0.011 | 0.009 | 0.017 |
| 4 | 0.023 | 0.024 | 0.027 |
| 5 | 0.019 | 0.018 | 0.019 |
| 6 | 0.020 | 0.020 | 0.015 |
| 7 | 0.021 | 0.018 | 0.017 |
| 8 | 0.017 | 0.016 | 0.019 |
| 9 | 0.017 | 0.010 | 0.017 |
| 10 | 0.019 | 0.012 | 0.017 |
| 11 | 0.016 | 0.011 | 0.019 |
| 12 | 0.009 | 0.009 | 0.014 |
| 13 | 0.011 | 0.012 | 0.016 |
| 14 | 0.021 | 0.015 | 0.020 |
| 15 | 0.015 | 0.016 | 0.022 |
| 16 | 0.020 | 0.023 | 0.023 |
| 17 | 0.016 | 0.024 | 0.019 |
| 18 | 0.021 | 0.018 | 0.024 |
| 19 | 0.019 | 0.016 | 0.022 |
| 20 | 0.018 | 0.014 | 0.026 |
| 21 | 0.017 | 0.016 | 0.025 |
| 22 | 0.018 | 0.019 | 0.021 |
| MEAN | 0.017 | 0.015 | 0.019 |
| SD | 0.004 | 0.005 | 0.004 |
Table 8.
Pins axial deviation with regard to nominal position—NIST artifact.
| Nominal Position [mm] | Test 1 [mm] | Test 2 [mm] | Test 3 [mm] | |
|---|---|---|---|---|
| Pin 1X | −50 | 0.033 | −0.004 | −0.049 |
| Pin 2X | −40 | 0.047 | 0.003 | −0.042 |
| Pin 3X | −30 | 0.032 | −0.008 | −0.024 |
| Pin 4X | −20 | 0.017 | 0.007 | −0.018 |
| Pin 5X | 20 | −0.032 | −0.001 | 0.004 |
| Pin 6X | 30 | −0.028 | −0.003 | 0.012 |
| Pin 7X | 40 | −0.028 | 0.002 | 0.020 |
| Pin 8X | 50 | −0.035 | 0.002 | 0.042 |
| Pin 1Y | −50 | 0.024 | 0.001 | −0.052 |
| Pin 2Y | −40 | 0.042 | −0.001 | −0.026 |
| Pin 3Y | −30 | 0.036 | 0.025 | −0.022 |
| Pin 4Y | −20 | 0.029 | 0.033 | 0.007 |
| Pin 5Y | 20 | 0.000 | −0.002 | 0.000 |
| Pin 6Y | 30 | −0.014 | −0.001 | 0.009 |
| Pin 7Y | 40 | −0.018 | −0.015 | 0.013 |
| Pin 8Y | 50 | −0.012 | 0.002 | 0.032 |
Table 9.
Pins axial deviation with regard to nominal position—proposed design.
| Nominal Position [mm] | Test 1 [mm] | Test 2 [mm] | Test 3 [mm] | |
|---|---|---|---|---|
| Pin 1X | −75 | −0.097 | −0.016 | −0.103 |
| Pin 2X | −62.5 | −0.075 | −0.002 | −0.063 |
| Pin 3X | −50 | −0.063 | 0.000 | −0.074 |
| Pin 4X | −37.5 | −0.045 | 0.035 | −0.039 |
| Pin 5X | −25 | −0.019 | 0.043 | −0.040 |
| Pin 6X | −12.5 | −0.013 | 0.057 | −0.015 |
| Pin 7X | 12.5 | 0.031 | 0.090 | 0.009 |
| Pin 8X | 25 | 0.028 | 0.105 | 0.030 |
| Pin 9X | 37.5 | 0.071 | 0.131 | 0.045 |
| Pin 10X | 50 | 0.072 | 0.139 | 0.085 |
| Pin 11X | 62.5 | 0.084 | 0.141 | 0.080 |
| Pin 12X | 75 | 0.087 | 0.154 | 0.107 |
| Pin 1Y | −75 | −0.141 | −0.233 | −0.124 |
| Pin 2Y | −62.5 | −0.103 | −0.203 | −0.117 |
| Pin 3Y | −50 | −0.092 | −0.166 | −0.069 |
| Pin 4Y | −37.5 | −0.048 | −0.145 | −0.063 |
| Pin 5Y | −25 | −0.040 | −0.117 | −0.026 |
| Pin 6Y | −12.5 | 0.000 | −0.110 | −0.027 |
| Pin 7Y | 12.5 | 0.061 | −0.038 | 0.068 |
| Pin 8Y | 25 | 0.082 | −0.035 | 0.056 |
| Pin 9Y | 37.5 | 0.118 | 0.013 | 0.125 |
| Pin 10Y | 50 | 0.146 | 0.023 | 0.127 |
| Pin 11Y | 62.5 | 0.170 | 0.045 | 0.191 |
| Pin 12Y | 75 | 0.181 | 0.057 | 0.172 |
Table 10.
X direction regression models analysis.
| Coefficient | R-Sq (Adj) | ||
|---|---|---|---|
| Reference Artifact | Test 1 | −0.0009 | 91.4% |
| Test 2 | 0.0000 | 0% | |
| Test 3 | 0.0008 | 96% | |
| Proposed Artifact | Test 1 | 0.0013 | 98.1% |
| Test 2 | 0.0012 | 98.5% | |
| Test 3 | 0.0013 | 97.7% |
Table 11.
Y direction regression models analysis.
| Coefficient | R-Sq (Adj) | ||
|---|---|---|---|
| Reference Artifact | Test 1 | −0.0006 | 84.9% |
| Test 2 | −0.0002 | 8.1% | |
| Test 3 | 0.0006 | 76.1% | |
| Proposed Artifact | Test 1 | 0.0022 | 99.5% |
| Test 2 | 0.0020 | 99.0% | |
| Test 3 | 0.0022 | 97.2% |
Disclaimer/Publisher’s Note: The statements, opinions and data contained in all publications are solely those of the individual author(s) and contributor(s) and not of MDPI and/or the editor(s). MDPI and/or the editor(s) disclaim responsibility for any injury to people or property resulting from any ideas, methods, instructions or products referred to in the content. |
© 2024 by the authors. Licensee MDPI, Basel, Switzerland. This article is an open access article distributed under the terms and conditions of the Creative Commons Attribution (CC BY) license (https://creativecommons.org/licenses/by/4.0/).
Share and Cite
MDPI and ACS Style
Giorgetti, A.; Ceccanti, F.; Baldi, N.; Kemble, S.; Arcidiacono, G.; Citti, P. Axiomatic Design of a Test Artifact for PBF-LM Machine Capability Monitoring. Machines 2024, 12, 199. https://doi.org/10.3390/machines12030199
AMA Style
Giorgetti A, Ceccanti F, Baldi N, Kemble S, Arcidiacono G, Citti P. Axiomatic Design of a Test Artifact for PBF-LM Machine Capability Monitoring. Machines. 2024; 12(3):199. https://doi.org/10.3390/machines12030199
Chicago/Turabian StyleGiorgetti, Alessandro, Filippo Ceccanti, Niccolò Baldi, Simon Kemble, Gabriele Arcidiacono, and Paolo Citti. 2024. "Axiomatic Design of a Test Artifact for PBF-LM Machine Capability Monitoring" Machines 12, no. 3: 199. https://doi.org/10.3390/machines12030199
Note that from the first issue of 2016, this journal uses article numbers instead of page numbers. See further details here.