This section will present how the dataset was collected and the variable pruning processes. Then, the process of training and evaluating models is explained.
2.1. Dataset Collection
The dataset is collected using an industrial robotic manipulator IRB 120, produced by ABB, with the datasheet given in [
19]. The collection process is performed on its control unit using the RobotStudio 2024.1.1 software package, produced by the same manufacturer [
20]. The laboratory setup on which the measurement was performed can be seen in
Figure 1, with the IRB 120, manufactured by ABB Ltd., Zurich, Switzerland shown in the front, and the control unit used for measurement given in the back.
The measurement is performed by a random selection of points in the joint space of the robot, along with the movement speed and zone. The robot was programmed using ABB RAPID programming language. To achieve the desired movement, the following RAPID [
21] code was used:
FOR i FROM 0 TO SIMULATION_COUNT DO
! Randomly select joint 1--6, speed and zone, and move to that position
MoveAbsJ [[((RAND()/RAND_MAX)∗(J1_HI-J1_LO))+J1_LO,
((RAND()/RAND_MAX)∗(J2_HI-J2_LO))+J2_LO,
((RAND()/RAND_MAX)∗(J3_HI-J3_LO))+J3_LO,
((RAND()/RAND_MAX)∗(J4_HI-J4_LO))+J4_LO,
((RAND()/RAND_MAX)∗(J5_HI-J5_LO))+J5_LO,
((RAND()/RAND_MAX)∗(J6_HI-J6_LO))+J6_LO],
[9E9,9E9,9E9,9E9,9E9,9E9]],
SPEED_ARR{1+ROUND((RAND()/RAND_MAX)∗(SPEED_NUMBER-1))},
ZONE_ARR{1+ROUND((RAND()/RAND_MAX)∗(ZONE_NUMBER-1))},
tool0;
ENDFOR
As can be seen from the code, the process is repeated a total of SIMULATION_COUNT times, which is selected to be 500. The command MoveAbsJ will move the robot to the position of the joint space specified by the first six values (in the case of a six-degree-of-freedom robot, such as ABB IRB 120 used in this research), with the given speed and zone selected from the appropriate arrays. The random values are generated using RAND function, which is a built-in RAPID function [
21]. It returns a value between 0 and 32,767. To normalize this value to the range of
, the returned value is divided by RAND_MAX which is a variable that equals 32,767. The random values for each of the joint targets
are limited using the equation given below. In the equation
represents the lower end of the range and
the higher end of the range for joint
i (these values were coded as Ji_LO and Ji_HI in the given code example), with
r being the random variable obtained randomly uniformly in the range
:
Because of the limitations posed by the robot configuration and the laboratory setup, the movement cannot be allowed to happen on the full possible range of the robot. By experimenting with the robot setup and the laboratory walls within the simulation the limits of the joints were selected to ensure no collisions happen, and they are given in
Table 2.
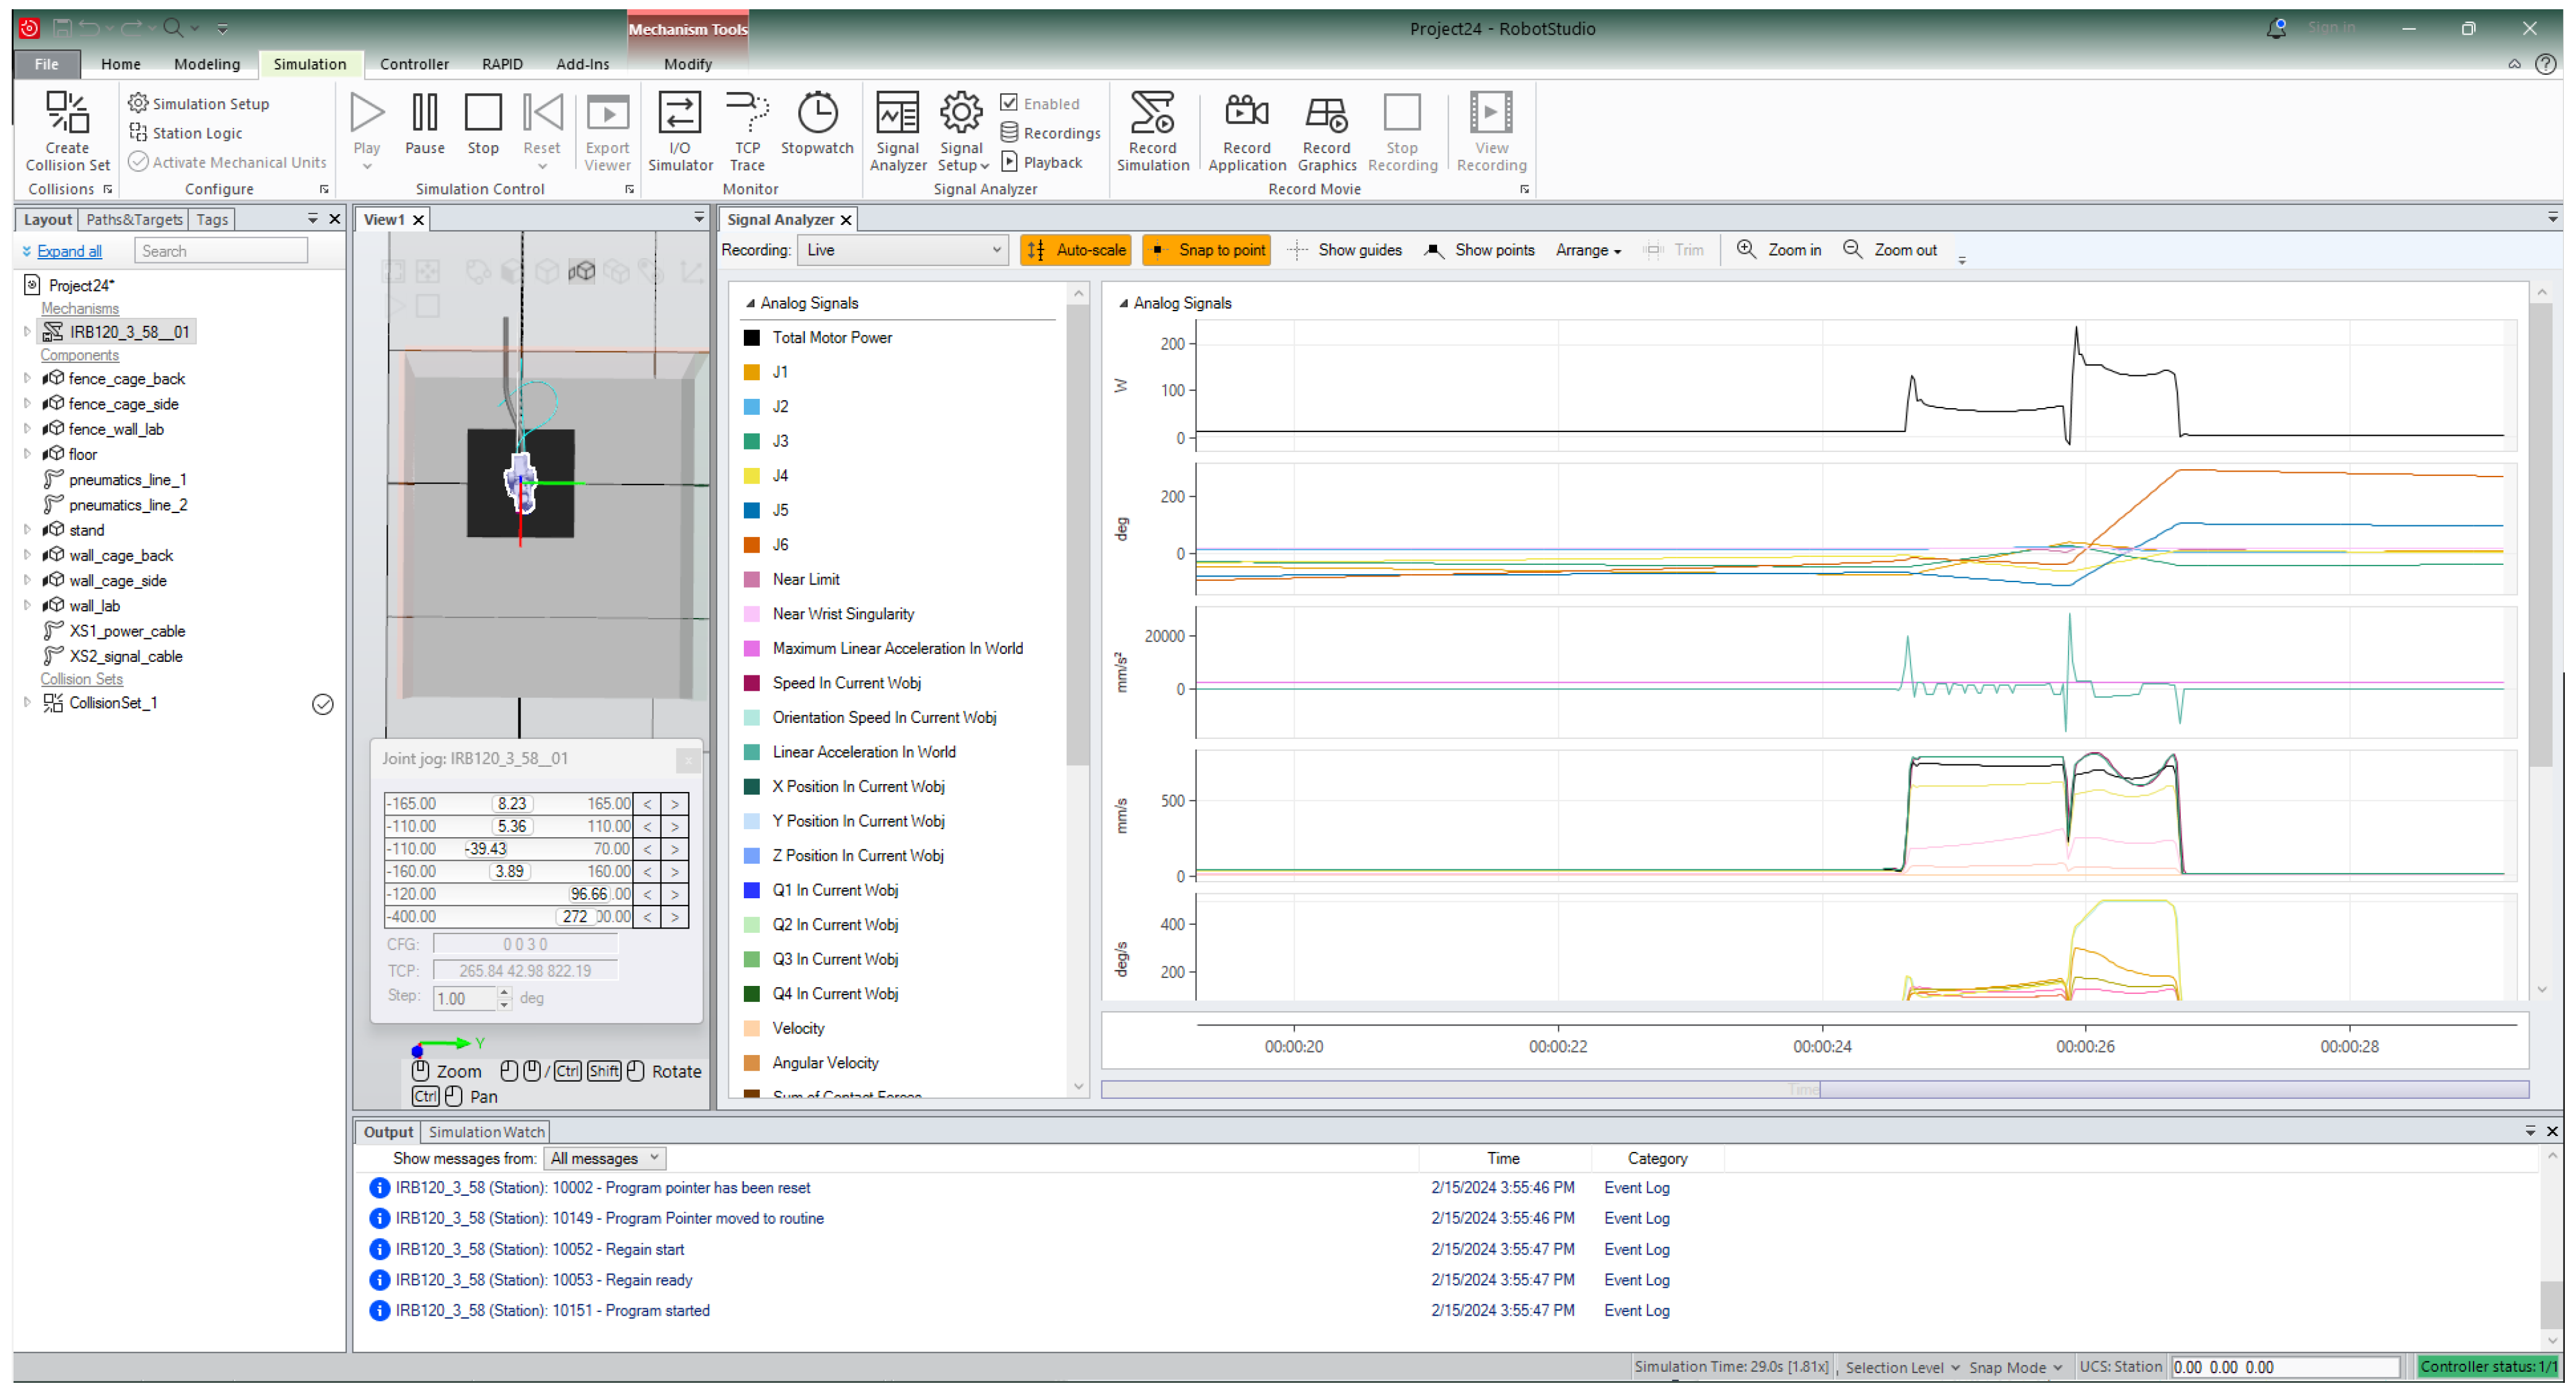
After connecting to the robot and uploading the RAPID code, the simulation in the RobotStudio software package is set up to measure different values. The values measured during the robot movement are:
To set up RobotStudio to measure the listed values, the first step is to connect the computer running the software package to the control unit of the robot. Then, the code is executed, and the measurement is performed. This appearance of this measurement in RobotStudio can be seen in the
Figure 2.
The sampling frequency of the measurement is
Hz. Over approximately 1 h and 22 min, this process collected a dataset of 132,192 data points. The simulation time may vary depending on randomly selected speeds of the robot movement. These values, a list of which was given previously, are then exported to a comma-separated value (CSV) file, in such a way that each variable is stored in a separate column. This CSV file will be used for further processing and measurement. The dataset collected in this part of the research is made publicly available [
22].
2.1.1. Correlation Analysis
The correlation analysis is performed between all of the values in the dataset. Pearson’s correlation coefficient is calculated between each of the parameters in the dataset. Between two variable sets
and
of length
n, the Pearson correlation coefficient
r is calculated as:
Based on the correlation coefficient, the dataset is pruned using the following rule: if an input variable has a correlation coefficient lower than 0.2 to the output variable ‘Total Motor Power’ it is eliminated.
2.1.2. Feature Importance
Feature importance is determined with the random forest (RF) algorithm. RF algorithm creates a large number of weak predictors which attempt to regress the target. The created models are tree-based, and as such they are both simple and analyzable [
23]. The analysis of models can be performed using two metrics—the mean decrease in impurity (MDI) and feature permutation (FP). FP tests the change of performance when one of the variables is randomly permuted [
24], while MDI measures the change of result quality when the feature is added or removed [
25]. Based on the results of the feature importance, the dataset is pruned from variables if the MDI or FP value is lower than 0.01.
MDI is calculated according to the impurity. If
is the value of the output, then
I can be calculated per:
The MDI is calculated by observing I of the tree model before the variable is included in the model, and after it was added in the model. Then, the difference is calculated. The more important the variable is in the modeling of the output, the greater its decrease of impurity should be after the inclusion in the model. FP is calculated by training the dataset normally and noting the score of the model. Then, one of the variables is randomly shuffled, and the training is performed again. The performance of the two models—one trained on the original dataset, and one trained on the dataset with a single variable randomly shuffled is compared. If the variable is important then the score should decrease significantly, while if the variable has a low influence on the output the score should not change significantly.
In addition to the described techniques for dataset feature preprocessing, several other techniques can be used to remove features with a low influence on the output. One of the main benefits of the applied RF method, which is a tree-based method is that the method provides a simple list of variables that have a low influence and may be removed, allowing for an easy application in conjunction with correlation-based analysis. Decomposition methods are also commonly applied by researchers, such as the principle component analysis (PCA) methods which serve to transform the dataset into a set of principal components [
26,
27]. Compared to the used approach, the PCA approach does not provide a clear list of variables to be removed (or simply not collected), but the transformation needs to be performed every time new data is collected, before using the developed regression model, possibly adding time to the very fast prediction time of the developed MLP [
28]. A more direct approach would be the application of Lasso or Ridge regression to determine the coefficients of the variables and lower them to zero to eliminate the low-influenced ones from the dataset [
29]. Still, RF does have some benefits in comparison to these methods such as robustness to non-linearity and multicollinearity, lower sensitivity to outliers and unscaled features, and automatic variable interaction capturing [
30,
31].
2.2. Regression Methodology
The dataset regression is performed using the MLP method. As stated in the introduction, the goal of using a regression technique instead of an LSTM or similar approaches is the ability to perform the modeling of the instantaneous power. In other words, the authors want to establish a model which will be able to predict the motor power of the industrial robot at any moment—with this prediction being based on the other measured variables such as speed and position, and not the previous values of motor power, as this may enable different optimization schemes. While many regression techniques could have been applied to a dataset of this type authors have selected MLP based on two features, and those are the high performance in similar modeling tasks in the previous research [
1] and a high computational speed of the trained models. MLP is constructed from neurons, arranged in layers. Each neuron sums the values of the neurons in the previous layer, multiplied by the values of the weighted connections. These connection weights are values that are updated during the training process [
32]. In the training process, the output value—which is the value of the single neuron in the last layer (so-called output neuron), is compared to the expected output for a set of inputs. The error of this prediction is then backpropagated—adjusting weights based on the error gradient in the direction from the output neuron to the input neurons. By repeating this process for each of the data points, over multiple training iterations, the model parameters (weights) are tuned to minimize the error [
33].
In addition to the parameters, the neural network also has the so-called hyperparameters. These values describe the initial model of the network, regardless of the trained parameters. These parameters include the number of layers in the network and the number of neurons per layer. In addition, they include the learning rate value and adjustment type which control how quickly are the parameters of the network adjusted during the backpropagation, the activation function of the neurons which is the function that controls the individual neuron output, the regularization parameter which controls the influence of individual variables, and the solver—the algorithm used for recalculating the weights [
34]. Hyperparameter tuning is key to obtaining a high-performing dataset, as hyperparameters have a great influence on the model performance [
35]. To determine the best set of parameters the grid search procedure is used in this research. First, a set of discrete values is selected for each of the hyperparameters, based on previous research targeting similar topics [
1]. These values are given in
Table 3. Then, the MLP is trained for each of the possible combinations of hyperparameters. Results are evaluated for each to determine the performance, as it’s described below.
Two separate sets of MLPs are trained in this research. Both target the total motor power of the industrial robotic manipulator, but one attempts to regress it with the entire collected dataset (30 inputs), and the second attempts to regress it with the dataset pruned according to the rules given in the previous section, the results of which are discussed in the following section.
The final structure of the model will consist of the neurons arranged in three types of layers—the input layer, one or more hidden layers, and an output layer. Out of these layers, the simplest one to define is the output layer. This layer will consist of a single neuron. The value of this neuron will represent the predicted value for a given set of inputs, as determined by the forward propagation through the hidden layers. As for the hidden layers, their size will depend on the grid search procedure. As the grid search procedure attempts to tune both the number of hidden layers (between one and five) and the number of neurons in all of the selected layers (selected as for ), the size of hidden layers can vary between a single layer with one neuron at the smallest and five layers with 128 neurons at the largest. This means that the smallest model would consist of parameters—where is the size of the input vector and the comes from the connection to the output layer. The largest model on the other hand would consist of parameters, where (connection of the input layer to the first layer), (connections between all neurons of one hidden layer to the next), and finally (connections of the last hidden layer to the output layer). In other words, this is 65,664 parameters. The input layer can also vary in size, between two values. This is due to the dataset pruning which is described in the following section. This means that, for the original dataset, the size of the input layer is equal to 30. This means that for it, the model ranges in size from 31 to 69,504 parameters. For the pruned dataset, the input layer is shortened to 15 elements, as shown in the following sections, making its total model parameters range from 16 to 67,584.
Regression Model Evaluation
Each of the models trained in the grid search procedure is subjected to the process of five-fold cross-validation. This process is performed to ensure that the data is not overfitted, and the model generalizes well across data [
36]—as the model could overfit on a single part of the dataset and falsely provide good performance metrics. This process is performed in the following manner [
37]:
- 1.
Randomly split the dataset into five subsets —, , , , .
- 2.
For i in the range from 1 to 5:
Create a dataset consisting of the four folds whose index doesn’t equal i.
Split the train and test datasets by randomly selecting points in such a way that is 70% of the dataset, and is 30% of the dataset.
Perform the training procedure using the two datasets and obtain a trained model.
Calculate the performance indexes on the fold which was not used in the training set and save them.
- 3.
Calculate the mean score and the standard deviation of the performance indexes across all folds.
This means that for each of the possible combinations of hyperparameters, the model is trained five times, each time using a different part of the dataset for validation. In each of these five iterations, 74,028 data points are used as the training set (
), and 18,507 points are used as the test set (
) during training, with results validated on the 39,657 data points. As mentioned, each of these folds is evaluated by using two separate performance indexes—coefficient of determination
and mean absolute percentage error
. These values were selected because they are commonly used in the evaluation of regression models, with
evaluating how well the predicted data follow the trends of the original data across different outputs [
38,
39], and
defines the absolute difference between the predicted data and the real data across different inputs [
40,
41]. These two values are utilized because individually they may not provide a good picture of model performance—e.g., a model that has a good variance prediction but a large error will have a good
and a poor
, while the model which follows the data closely, but without taking the trends across inputs into account will demonstrate the opposite.
As mentioned
demonstrates the amount of variance of the original dataset
contained in the predicted dataset
[
42]. It ranges between
, where 1 indicates the entirety of variance being contained in the predictions. The higher values of
indicate a higher regression quality.
is defined as:
will provide good scores for models that follow the variance, i.e., the trends contained in the data. But to better express the absolute error of predicted points an error metric should be used.
was selected, as it performs similarly to a popular
, but defines the absolute error expressed as a percentage which makes it more straightforward to interpret [
43]. It ranges from
, with the lower values indicating a better regression model. It is calculated per [
44]:


