Article

Multi-Response Optimization of Electrochemical Machining Parameters for Inconel 718 via RSM and MOGA-ANN

1
Department of Mechanical Engineering, National Institute of Technical Teachers Training and Research (NITTTR), Kolkata 700106, India
2
Department of Machining, Assembly and Engineering Metrology, Faculty of Mechanical Engineering, VSB-Technical University of Ostrava, 70800 Ostrava, Czech Republic
3
Department of Mechanical engineering, CV Raman Global University, Bhubaneswar 752054, India
4
Department of Mechanical Engineering, College of Engineering, Imam Mohammad Ibn Saud Islamic University, Riyadh 11432, Saudi Arabia
5
Department of Mechanical Engineering, School of Engineering and Technology, JECRC University, Jaipur 303905, India
6
Department of Industrial Engineering, College of Engineering, Imam Mohammad Ibn Saud Islamic University, Riyadh 11432, Saudi Arabia
*
Authors to whom correspondence should be addressed.
Machines 2024, 12(5), 335; https://doi.org/10.3390/machines12050335
Submission received: 20 March 2024 / Revised: 28 April 2024 / Accepted: 11 May 2024 / Published: 14 May 2024
(This article belongs to the Section Advanced Manufacturing)

Abstract

:
Inconel 718’s exceptional strength and corrosion resistance make it a versatile superalloy widely adopted in diverse industries, attesting to its reliability. Electrochemical machining (ECM) further enhances its suitability for intricate part fabrication, ensuring complex shapes, dimensional accuracy, stress-free results, and minimal thermal damage. Thus, this research endeavors to conduct a novel investigation into the electrochemical machining (ECM) of the superalloy Inconel 718. The study focuses on unraveling the intricate influence of key input process parameters—namely, electrolytic concentration, tool feed rate, and voltage—on critical response variables such as surface roughness (SR), material removal rate (MRR), and radial overcut (RO) in the machining process. The powerful tool, response surface methodology (RSM), is used for understanding and optimizing complex systems by developing mathematical models that describe the relationships between input and response variables. Under a 95% confidence level, analysis of variance (ANOVA) suggests that electrolyte concentration, voltage, and tool feed rate are the most important factors influencing the response characteristics. Moreover, the incorporation of ANN modeling and the MOGA-ANN optimization algorithm introduces a novel and comprehensive approach to determining the optimal machining parameters. It considers multiple objectives simultaneously, considering the trade-offs between them, and provides a set of solutions that achieve the desired balance between MRR, SR, and RO. Confirmation experiments are carried out, and the absolute percentage errors between experimental and optimized values are assessed. The detailed surface topography and elemental mapping were performed using a scanning electron microscope (SEM). The nano/micro particles of Inconel 718 metal powder, obtained from ECM sludge/cakes, along with the released hydrogen byproducts, offer promising opportunities for recycling and various applications. These materials can be effectively utilized in powder metallurgy products, leading to enhanced cost efficiency.

1. Introduction

The historic advancement of civilization has been linked with the workability of human beings with advanced materials like superalloys, nanomaterials, etc. Inconel 718 is a superalloy, possessing high hot strength and hardness [1], a high melting point, and good alloying ability [2]. Inconel 718 also has excellent resistance to creep and corrosion and is an essential material in the chemical, environmental protection, food preparation, water treatment, nuclear, and aerospace industries [1,3].
However, machining Inconel 718 is challenging due to its high hardness, low thermal conductivity, and tendency to strengthen during the process. This presents difficulties in achieving the desired surface finish [2,4]. To address these difficulties, manufacturers often turn to unconventional machining methods like electrochemical machining (ECM), electrical discharge machining (EDM), and EDM-ECM. The comparative characteristics of EDM, ECM, and hybrid EDM-ECM are shown in Table 1.
The ECM surface is stress-free and shiny, resembling a polished mirror. Therefore, the final finishing of the EDM surface could be accomplished by ECM in a hybrid mode. The investigation is essential for the precise control of ECM input process parameters on the output parameters for effective and fine applications of ECM in the finishing machining cycle.

1.1. Critical Issues and Scopes

Due to the atomic dissolution mechanism in ECM, theoretically, it would be the finest burr-free machining process with atomic-level surface smoothness and accuracy. Additionally, the product is highly safe from stress corrosion as there is no stress concentration or HAZ on the surface. Practically, the accuracy of ECM is higher than that of EDM. However, the surface finish accuracy of the ECM is adversely affected by the evaluation of H2, which adheres to the electrode and prompts selective dissolution. The sporadic breakdown of anodic film, flow separation, and the formation of eddies [7] is also responsible for such issues. The electrolytic conduction changes due to the heat gradient (which is influenced by high current flow), and the formation of precipitation restricts the uniform flow of the current and electrolyte, which causes non-uniformity in material dissolution. The electrolyte flow is necessary to avoid ion concentration and deposition on the tool to overcome overheating of the electrolyte. An ultrasonic vibration-assisted tool [8,9,10] with nano-ceramic (SiO2, Al2O3) particle-mixed nano-fluid electrolyte can be utilized to improve the quality and performance of ECM. Hence, the ultrasonic vibration may play a brilliant role in removing depositions, and nano-ceramic particles may also act to remove the same and improve the heat conduction of the electrolyte for better thermal stability in the machining zone.
The ECM gets byproducts [11,12,13,14,15], which are hydrogen and sludge/cakes (metallic hydroxides or hydrated oxides) at a rate of 100–150 cm3 per cubic centimeter of material removed in NaCl electrolyte [16]. Theoretically, these metallic hydroxides/hydrated oxides would have atomic sizes that could be used to extract metallic nanopowders and may be an effective byproduct for additive manufacturing industries. The hydrogen produced in the cathode could be collected properly to use as green fuel.
By eliminating the issues in ECM and utilizing the byproducts, it could be one of the finest machining technologies of modern industries for advanced metals, alloys, and nano-materials machining.
For improved machinability, electrochemical machining is a viable option as it allows complex shape machining without heat-affected zones and local stress, minimal taper, and no tool wear [17]. Electrochemical material removal modeling encompasses the application of conservation equations to describe fluid flow, electrochemical reactions, heat transfer, electric fields, and ionic transport [18].

1.2. State-of-the-Art Review of Electrochemical Machining Inconel 718

The superalloy Inconel 718 was developed using exotic elements for critical aerospace engine and turbine parts, which could be optimally machined through ECM, ensuring stress-free and smooth post-machining surfaces.
Geethapriyan et al. (2016) [19] conducted ECM micro-drilling to assess the performance of coated electrodes. They found that the nickel-coated copper electrode removed 7.2% more material, while the chromium-coated electrode reduced surface roughness by 19% during micro-drilling of Inconel alloy 718. They used Taguchi-grey analysis to study [20] multi-performance optimization of Inconel 718 surface characteristics. It was found that the micro-tool feed rate has the most influence on NaCl dielectric medium, while the applied voltage has the greatest influence on NaNO3 dielectric medium in the micro-ECM process.
Zhu et al. (2018) [21] studied how Inconel 718 microstructures affect both dissolution and the integrity of machined surfaces. Their findings demonstrated the uneven distribution of metallographic phases. Besides, high quantities of niobium (Nb) had a substantial impact on the surface integrity of electrochemically machined samples.
Klocke et al. (2018) [22] investigated the effectiveness of two twisted wire rotating electrodes in optimizing electrolyte flushing in Inconel 718 ECM. They might improve cutting speeds by extending the working gap and increasing electrolyte pressure.
Wang et. al. (2019) [23,24] investigated ways to improve counter-rotating electrochemical machining (CRECM) performance on lug bosses made of 304 stainless steel and Inconel 718, taking into account their different dissolution behaviors. They noticed that 304 stainless steel performed significantly better than Inconel 718. The application of a 304 stainless steel coating prevented the dissolution of the Inconel 718 lug boss. In another investigation, they explored the use of a mixed solution of neutral NaNO3 and alkaline NaOH, and the results show that the alkaline solution promoted the formation of a dense passive film on the Inconel 718 surface.
Madhankumar et al. (2021) [25] investigated ECM overcut in Inconel 625 and Inconel 718 alloys, reaching the best overcut value of 0.021 mm with Inconel 718. In other work [26], they also optimized material removal rate (MRR) and surface roughness in the micro-ECM of Inconel 718 utilizing the Grey Relational Technique, using electrolyte concentration, feed rate, and voltage as process factors. Voltage is identified as the most important variable for achieving performance criteria, with optimal values. In another study, Rajesh et al. (2022) [27] performed a comparative micro-ECM for surface roughness measurement of Inconel 625 and Inconel 718 alloys. Inconel 625 alloy had the finest surface roughness result, measuring 0.3853 µm.
Kong et al. (2023) [28] explored the use of helical wire electrochemical discharge machining (HW-ECDM) of Inconel 718 alloy, employing a low-conductivity salt-glycol solution. Their inquiry led to the exploration of mortise structures in Inconel 718 with high machining precision and surface quality. Notably, a feed rate of 5 μm/s was identified as optimal. This work demonstrated the possibility of helical wire-assisted electrical discharge ECM as a viable approach for machining thick and hard metals such as Inconel 718.
A review of available ECM machining data revealed a scarcity of research on machining Inconel 718 material, despite its widespread application in the tool and die industries. Thus, the current study employed experimental data to investigate how input parameters affect material removal rate, surface roughness, and radial overcut.
Leo Kumar et al. conducted an experimental study to explore how cutting parameters impact surface quality. They employed a genetic algorithm (GA) to determine the optimal process settings that yield an excellent surface finish while minimizing machining time [29]. Neuro-fuzzy systems integrate artificial neural networks and fuzzy logic to build intelligent systems capable of managing complex and uncertain information. The neuro-fuzzy approach was probably used to evaluate the surface quality of the machined Ti-Cu alloy [30]. Agrawal et al. [31] aimed to optimize the machining parameters to improve the machining efficiency and surface quality of AA 6082 MMC and AA 6082 alloy using the PCA-GRA method. Majumder et al. [32] employed RSM to study how pulse current, servo voltage, pulse off time, and pulse on time affect surface roughness and cutting time in the WEDC of Inconel 800. They used both traditional GRA and GRA based on principal component analysis to obtain their results. According to the mathematical model, PCA-based GRA was found to be 1.12% more accurate than classical GRA.
The experiment employed an RSM-based experimental design to identify optimized input parameters and their corresponding values through RSM modeling and multi-objective optimization [33,34,35] using the desirability function. Furthermore, MOGA-ANN was used to predict responses. Over the years, there has been significant growth in the application of various techniques for predicting the optimum process parameters of manufacturing processes [36,37,38,39,40,41,42]. Combining MOGA-ANN and RSM analysis is beneficial when dealing with complex optimization problems with multiple conflicting objectives. This integrated approach can lead to more efficient and effective optimization for this study. To gain a comprehensive understanding of surface defects and material migration, the authors combined SEM and EDS analyses. SEM provided visual data on surface morphology and visible defects, while EDS analysis offered insights into elemental composition changes due to machining. The overview of the present investigation is illustrated in Figure 1.
The primary aims of this investigation are twofold: Firstly, to conduct a multi-objective optimization analysis using MOGA-ANN and RSM techniques to enhance control over process parameters in the finer applications of ECM. Secondly, to perform elemental analysis of the sludge with the goal of identifying opportunities for recycling exotic Inconel 718 nano/micro powders for potential additive manufacturing (AM) applications.

2. Materials and Methods

2.1. Workpiece Material and Tool

In the current investigation, Inconel 718 alloy is used as the workpiece specimen material due to its significance in manufacturing industries. A tool servo-controlled ECM machine (manufactured by METATECH INDUSTRIES in Pune, India) with a working range of 5–300 Amps and 1–25 V DC and a tool feed rate of 0.03–1.00 mm/min is utilized for machining operations. A copper tool electrode with a round cross-section and a 20 mm head diameter, including a 5 mm central hole for electrolyte flow, has been selected for the electrochemical machining operation. Lab grade 99.9% NaCl (SRL, India-made) is used to make electrolyte solutions. To determine the metal removal rate for each machining operation, measure the initial and final weights of the workpiece with an electronic scale accurate to 0.001 gm. Surface roughness characteristics were measured with the assistance of the Mitutoyo SJ-410 surface roughness tester. The radial overcut (ROC) was measured using a Leica S9i stereo microscope at 0.61× magnification. Surface topography and elemental analysis were performed by a scanning electron microscope (SEM) (JEOL, Tokyo, Japan, model: JSM IT500) with energy dispersive X-ray spectroscopy (EDS), equipped with an LN2-free SDD detector.

2.2. Experimental Planning and Methods

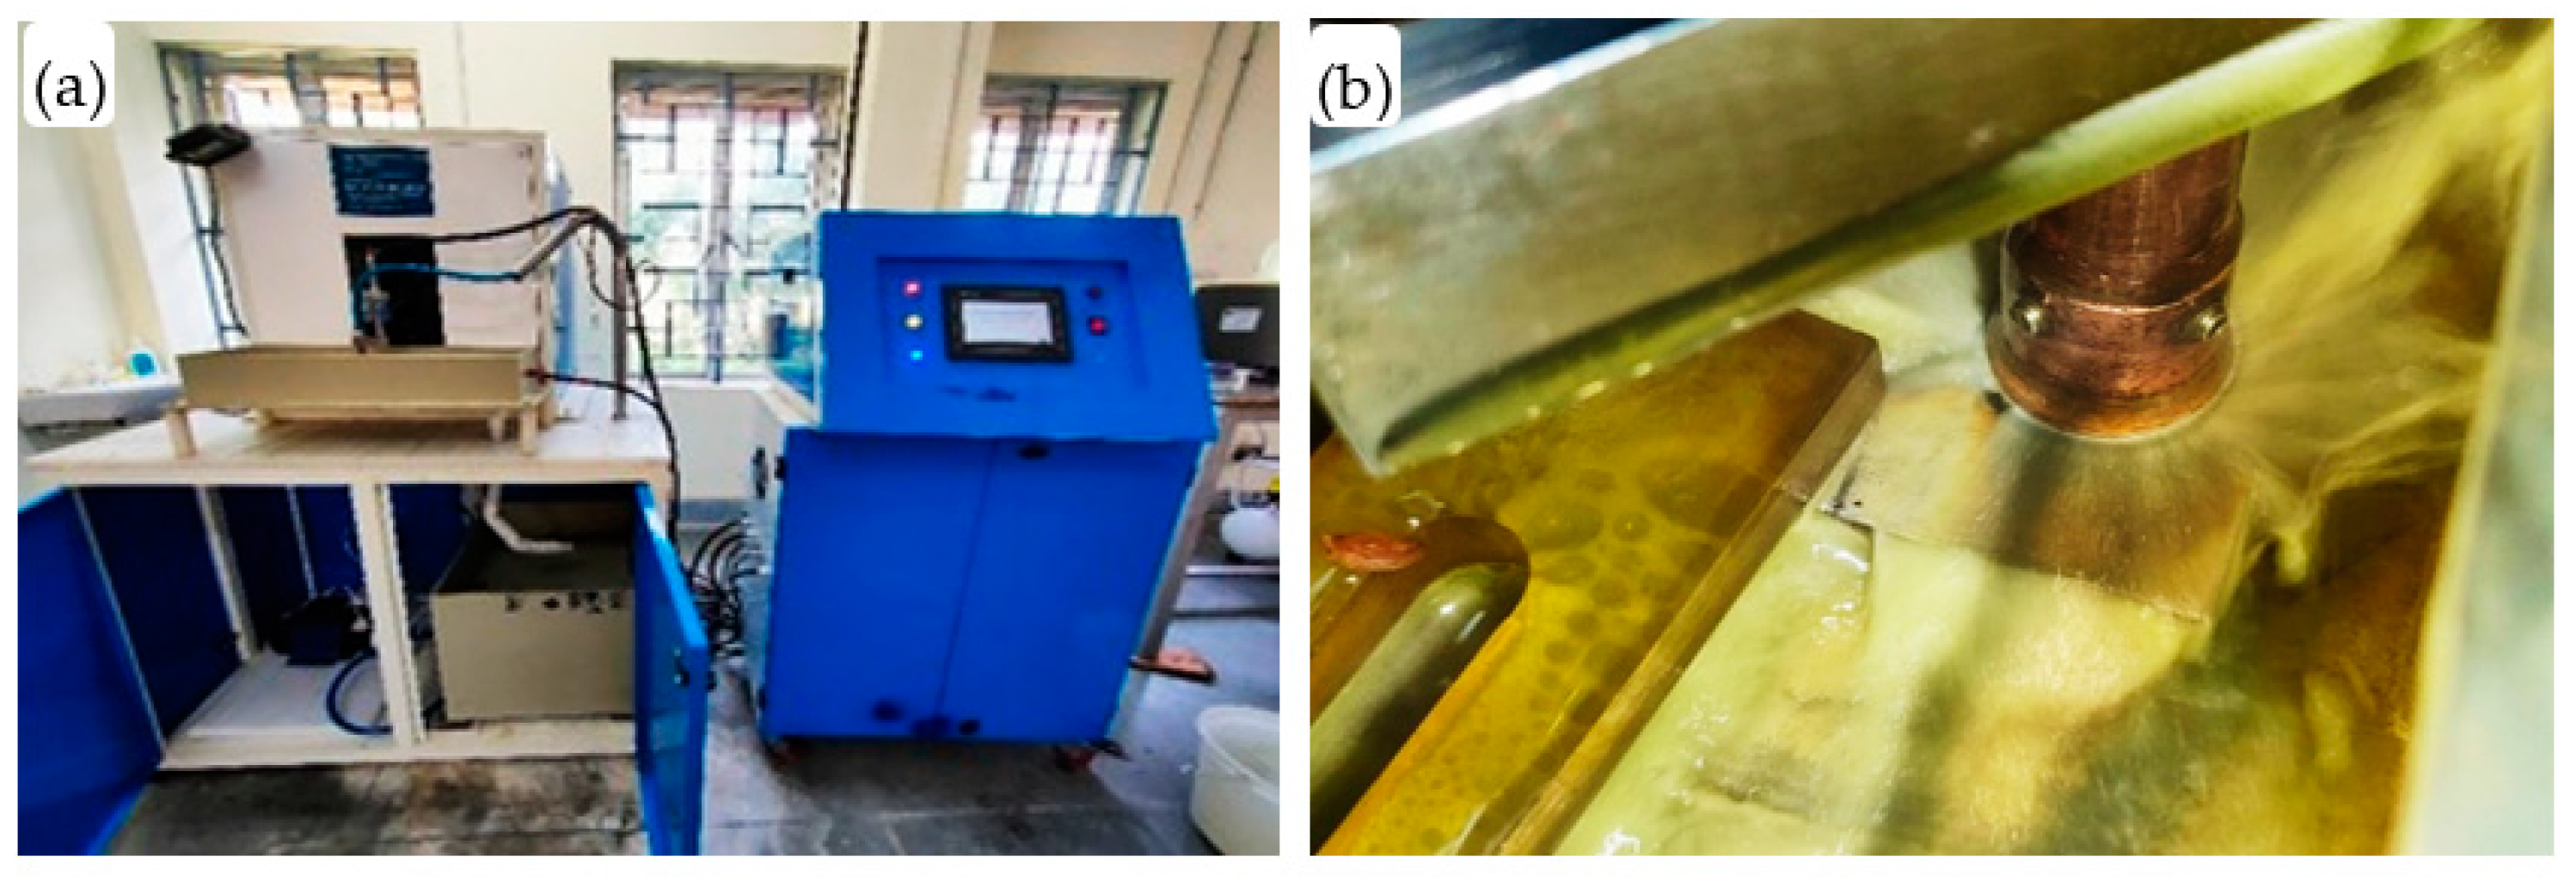
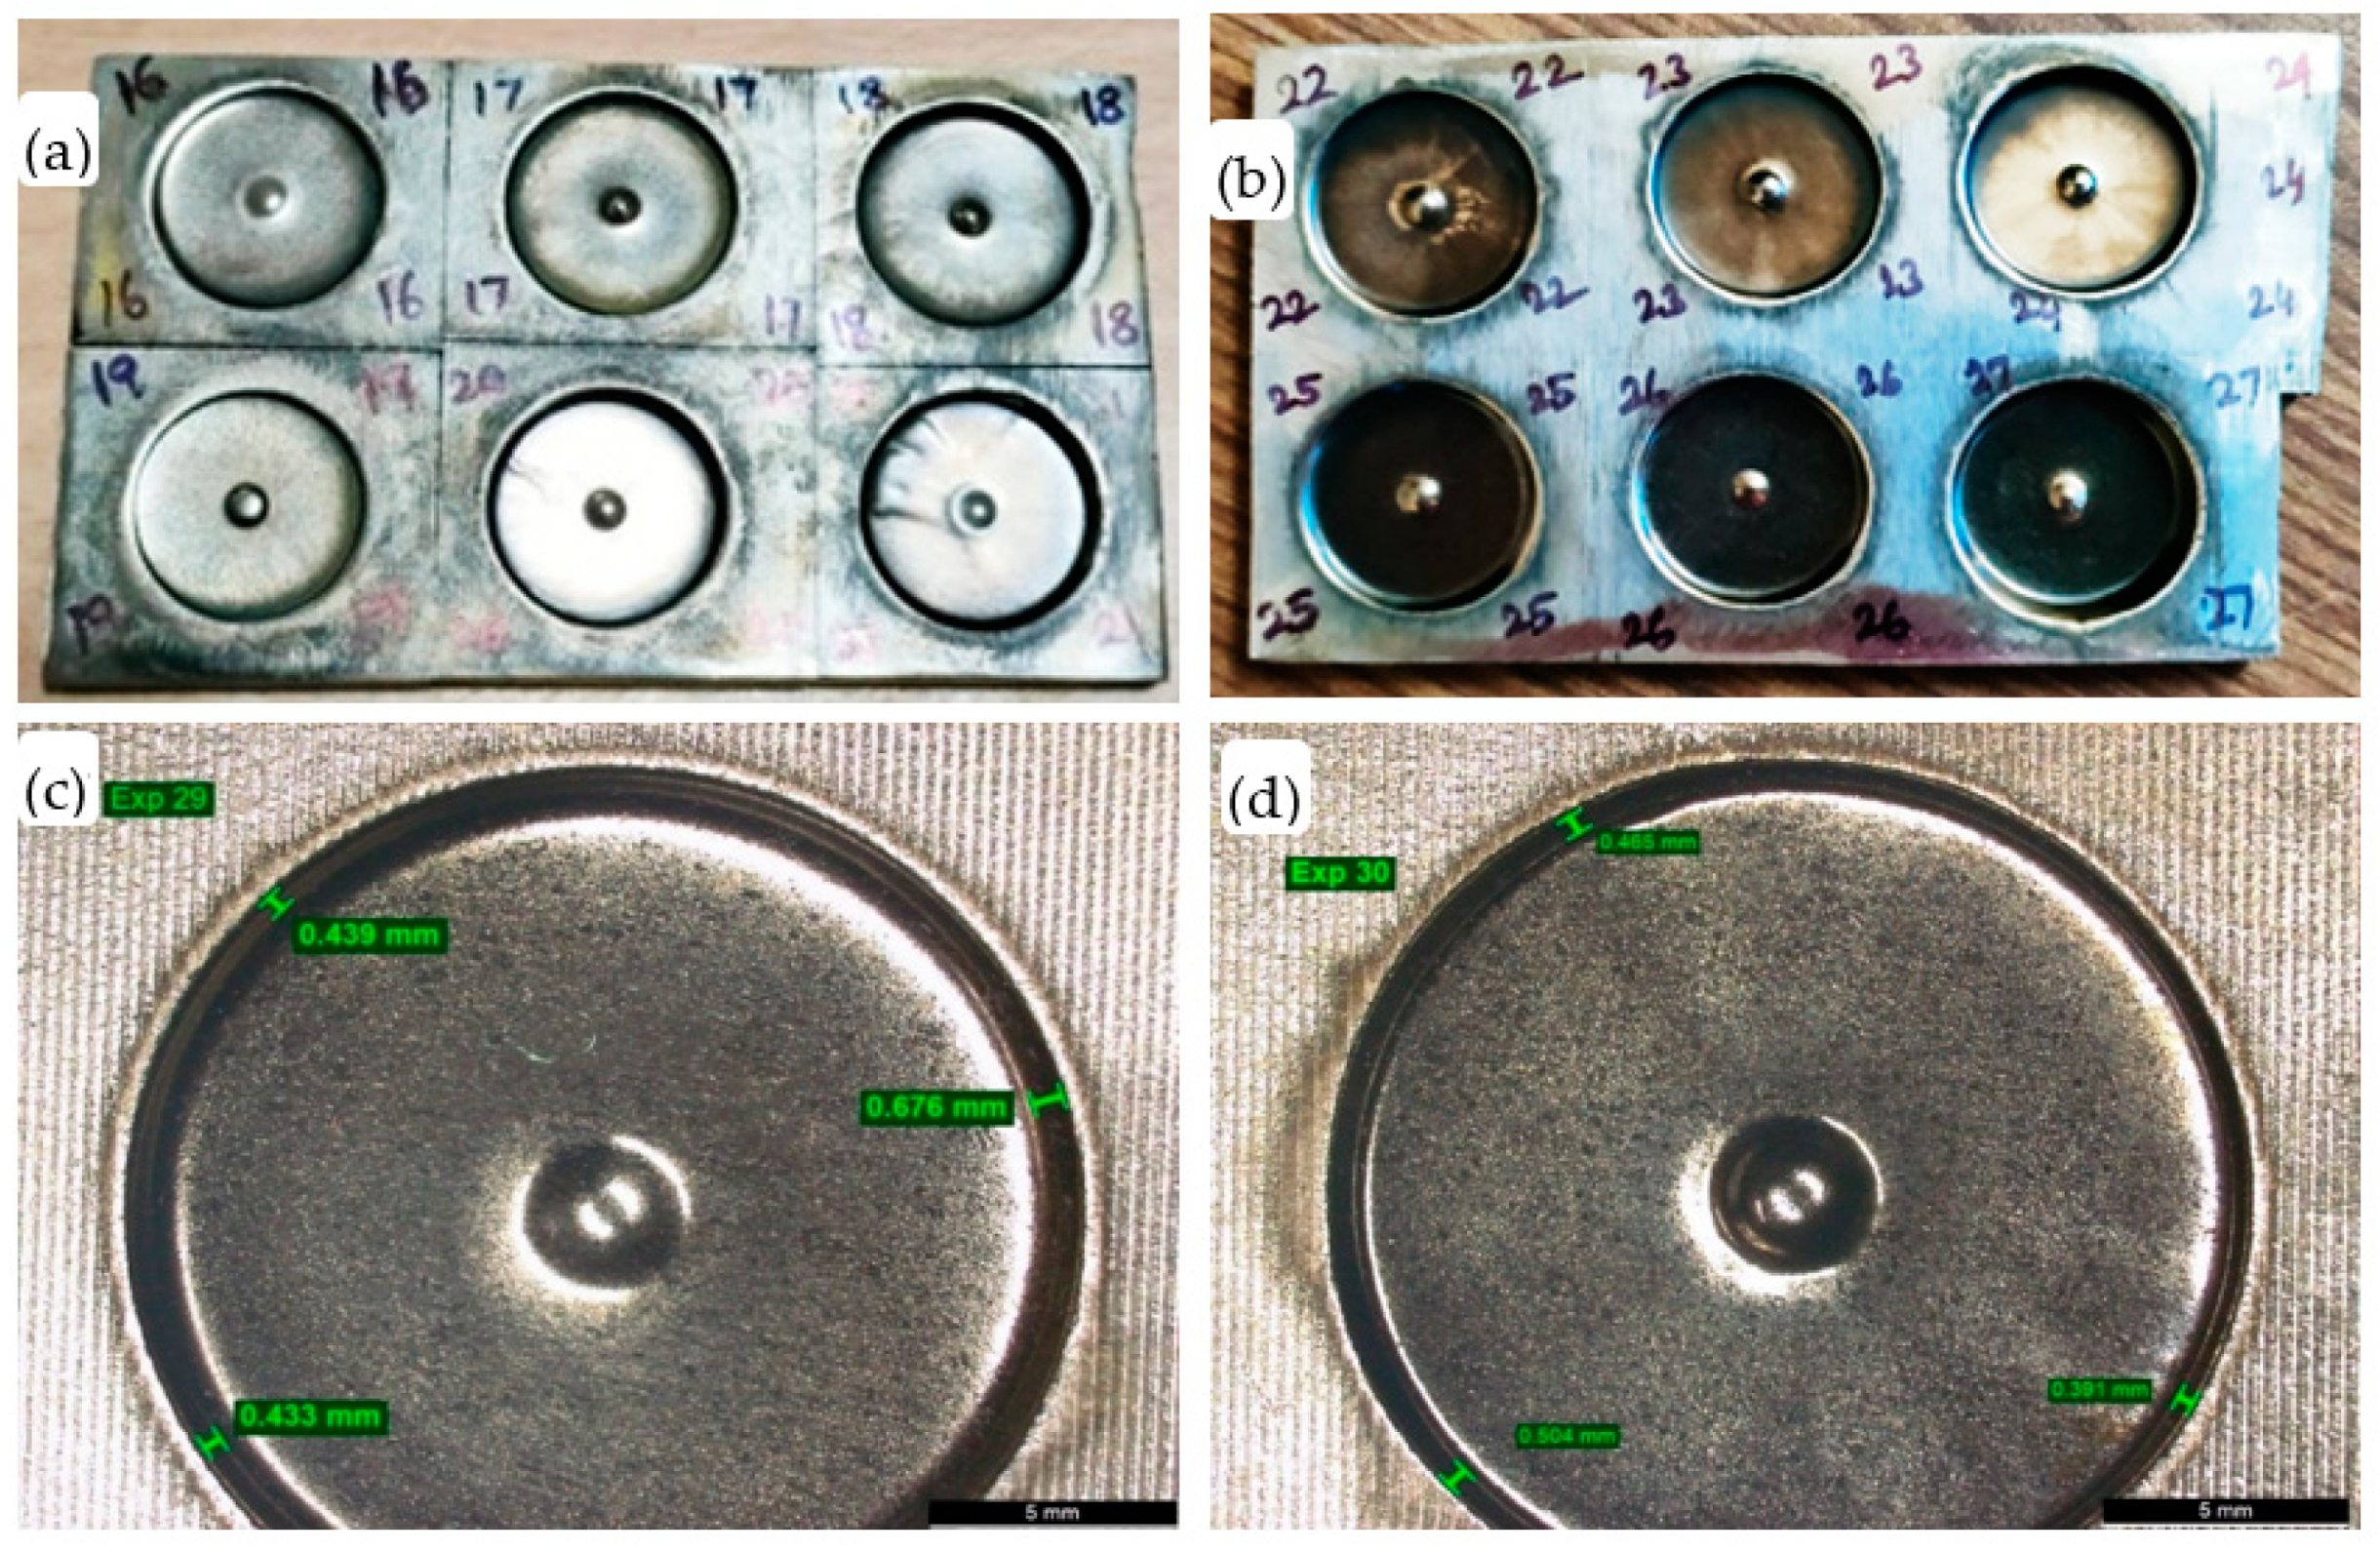
The electrochemical machine setup and corresponding operation are shown in Figure 2a,b. The samples are placed and securely clamped in the machining chamber with the help of a non-conductive job-holding device. Both the surfaces of the tool and workpiece are polished with the help of 2500-grade emery paper to eliminate dirt and burrs, as these can interfere with the current flow. Then the copper electrode is fixed in the servo-controlled tool holder, and the electrolyte tank is filled with the required concentration of electrolyte. Sodium chloride solution has been selected as the suitable electrolyte in this research work as it is highly conductive, non-toxic, readily available, non-hazardous, and inexpensive. The machining samples are shown in Figure 3. Exploring the effect of input process parameters on output response characteristics like material removal rate (MRR), surface roughness (SR), and radial overcut (RO) is a fundamental aspect of process optimization and control in various manufacturing and machining processes.

2.3. Multi-Response Optimization

2.3.1. Response Surface Methodology

Response surface methodology is a powerful tool for understanding and optimizing complex systems and processes by systematically exploring the relationships between input factors and output responses through a series of carefully designed experiments and mathematical modeling. With the knowledge of the literature survey and several trial-and-error experiments, the following have been suitably selected as the process parameters, as these parameters significantly influence the responses. Table 2 represents the design parameters and their levels in the electrochemical machining process.
A total of 27 experiments were conducted for all the permutations and combinations. To get an accurate outcome, each experiment was performed three times, and the average value was taken. As per the full factorial design matrix, the final experimental output values are shown in Table 3. Equation (1) states that the modeling of the response output factor towards specific input parameters ( x i ) has been accomplished using DoE and regression analysis.
Y = f x 1 , x 2 , , x k   ±   ε
where f represents a response function, while ε denotes the residual error. The expression for the response surface of the second-order model is given as:
Y = β 0 + i = 1 k β i x i + i = 1 k β i i x i 2 + i k j k β i j ( i < j ) x i x j ± ε
where β 0 , β i , β i i , and β i j are the unknown regression coefficients of the second-order model. The licensed software of Design Expert (DX-11) has been used to analyze the performance of output responses (MRR, SR and RO).

2.3.2. Desirability Function Analysis (DFA)

It is used for experimental design and optimization of multi-responses in RSM. The desirability function assigns a value between 0 and 1 to different levels of the response variables. The function is typically based on specified target values and acceptable limits for the response. The desirability function combines multiple response variables into a single overall desirability value.
The following steps are part of the DFA optimization process:
Step 1: Let ymin, ymax, and ytar be the response’s minimum, maximum, and target values, respectively. The outlined desirability function in Equation (3) enables the calculation of individual desirability indices for attributes of the nominal-the-best type.
d i = y i y min y t a r y min s , y min y i y t a r , s 0 y i y max y t a r y max t , y t a r y i y max , t 0 0 , o t h e r w i s e
In this state, the preferred approach is to set the target value ytar for each response yi as the maximum. For maximum,
d i = 0 , y i < y min y i y min y max y min r , y min y i y max , r 0 1 , y i > y max
Step 2: The geometric mean of the individual desirability indices calculated in the first step (step 1) is employed to assess the overall desirability (“D”) in this phase. The symbol “D”, which stands for overall desirability or total desirability [22], is represented as shown in Equation (5).
D = d 1 w 1 × d 2 w 2 × d 3 w 3 × d k w k w
where k represents the number of responses, d i denotes the individual desirability, and W i signifies the weight assigned to the ith response. w = i k w i = 1 . If any of the responses are entirely unacceptable, i.e., di = 0, then composite desirability also becomes zero.
Step 3: The optimum machining conditions need to be determined next. The best machining circumstances are those parameter values that produce the highest composite desirability.
Step 4: An ANOVA should be performed for “D” to determine the relative importance of the process factors of the combined objective.
Step 5: The final stage is to forecast the response variables using the best parameter settings and to confirm the outcome.

2.3.3. Artificial Neural Networks (ANN)

The form and operation of biological neural networks, notably the brain, served as inspiration for artificial neural networks (ANNs), which are computational models. In a conventional ANN, the input layer, hidden layers, and output layer are the three basic types of layers. In neural networks, every neuron within a layer receives input from the preceding layer and performs a calculation, usually entailing a weighted sum of these inputs, followed by the application of an activation function. The activation function introduces non-linearity and helps the network learn complex relationships in the data. An ANN gains knowledge while being trained by changing the weights associated with the connections between neurons. This adjustment is completed iteratively using a process called back-propagation, which calculates the error among the predicted output of the network and the expected output, and then propagates this error backward through the network to update the weights. The suggested design of the matrix (Table 2) of three input parameters (EC, V, and TFR) with three experimental output responses (MRR, SR, and RO) exhibits a non-linear relationship for training, testing, and validation. The root mean square error and the corresponding correlation coefficients served as the ANN model’s judgment criteria. The ANN model, featuring various architectures, was trained using 70% of the dataset, tested with 15% of the data, and validated with the remaining 15% of the data. The supervised learning algorithm Levenberg−Marquardt (LM) back-propagation is employed to minimize the mean squared error between the predicted outputs of a neural network and the actual outputs. MATLAB R2016a is utilized to develop, train, and evaluate the model for predicting output response behavior. Mean square error (MSE) and mean absolute percentage error (MAPE) are utilized to assess performance during training and testing, respectively, as elucidated in Equations (6) and (7).
M S E = 1 N n = 1 N ( A c t u a l p r e d i c t e d ) 2
M A P E = 1 N n = 1 N A c t u a l p r e d i c t e d A c t u a l × 100

2.3.4. MOGA Analysis

The developed ANN model has been put into the MOGA-ANN to discover the best variables to maximize MRR and minimize the SR and RO so that
Objective:
f1 = max (MRR)
f2 = min (SR)
f3 = min (RO)
Subject to:
EC [100, 200] Electrolyte concentration (EC) range varies from 100 to 200.
V  [7, 13] Voltage (V) range varies from 7 to 13.
TFR [0.3, 0.5] Tool feed rate (TFR) range varies from 0.3 to 0.5.
A search-based genetic algorithm (GA) is a type of optimization algorithm that is commonly used to solve complex optimization problems. It draws inspiration from natural selection and evolution, functioning by seeking the optimal solutions to a problem through a process of selection and recombination of candidate solutions [21]. The procedures used in MOGA-ANN are depicted in Figure 4.

3. Results and Discussion

Mathematical modeling through regression analysis is a valuable tool for exploring and quantifying relationships in data. Table 4 provides a summary of the model’s fit for MRR, SR, and RO, and Figure 5a–c corresponds to normal residual plots for these output responses. Selecting the highest-order polynomial model based on a lack of fit or non-significance is always recommended. In the current study, the lack of fit for all three quadratic regression model outputs (MRR, SR, and RO) is “non-significant”. As a result, each response characteristic is chosen using a quadratic model. Unimportant terms are eliminated by using the backward-type elimination process. Table 5 displays the ANOVA performed on all response measurements, together with the R2 (adjusted and predicted) values, associated F-values, and p-values that correlate to them. It also includes a check for the model’s capacity to fit the data or not.
The following lists the model response equations that use input parameters as actual factors:
M a t e r i a l   R e m o v a l   R a t e   M R R = 88.5572 0.2123   E C 12.593   V 75.7272   T F R + 0.01056   E C   .   V + 0.2994   E C   .   T F R + 12.1717 T R F   .   V + 0.00058   E C 2 + 0.4573   V 2
S u r f a c e   R o u g h n e s s   S R = 1.4925 0.0059   E C 0.04932   V 4.5438   T F R 0.00099   E C .   V + 0.04655   E C   .   T F R + 0.5566   T R F   .   V + 0.0243   V 2 + 5.7875   T F R 2
R a d i a l   O v e r c u t   R O = 4.4234 0.02886   E C 0.3783   V 1.8076   T F R 0.00047   E C .   V + 0.0163   E C   .   T F R + 0.0142   T R F   .   V + 0.00059   E C 2 + 0.011674   V 2
Table 4 demonstrates some performance metrics or results comparing the quadratic model and the 2FI model. The statement suggests that the quadratic model performs better than the 2FI model, and this difference is statistically significant. Figure 6 likely contains visual representations (3-D surface plots) that illustrate how various input factors affect a particular variable, which is referred to as MRR. It appears that increasing all the permutations and combinations of the three input parameters leads to an increase in MRR.
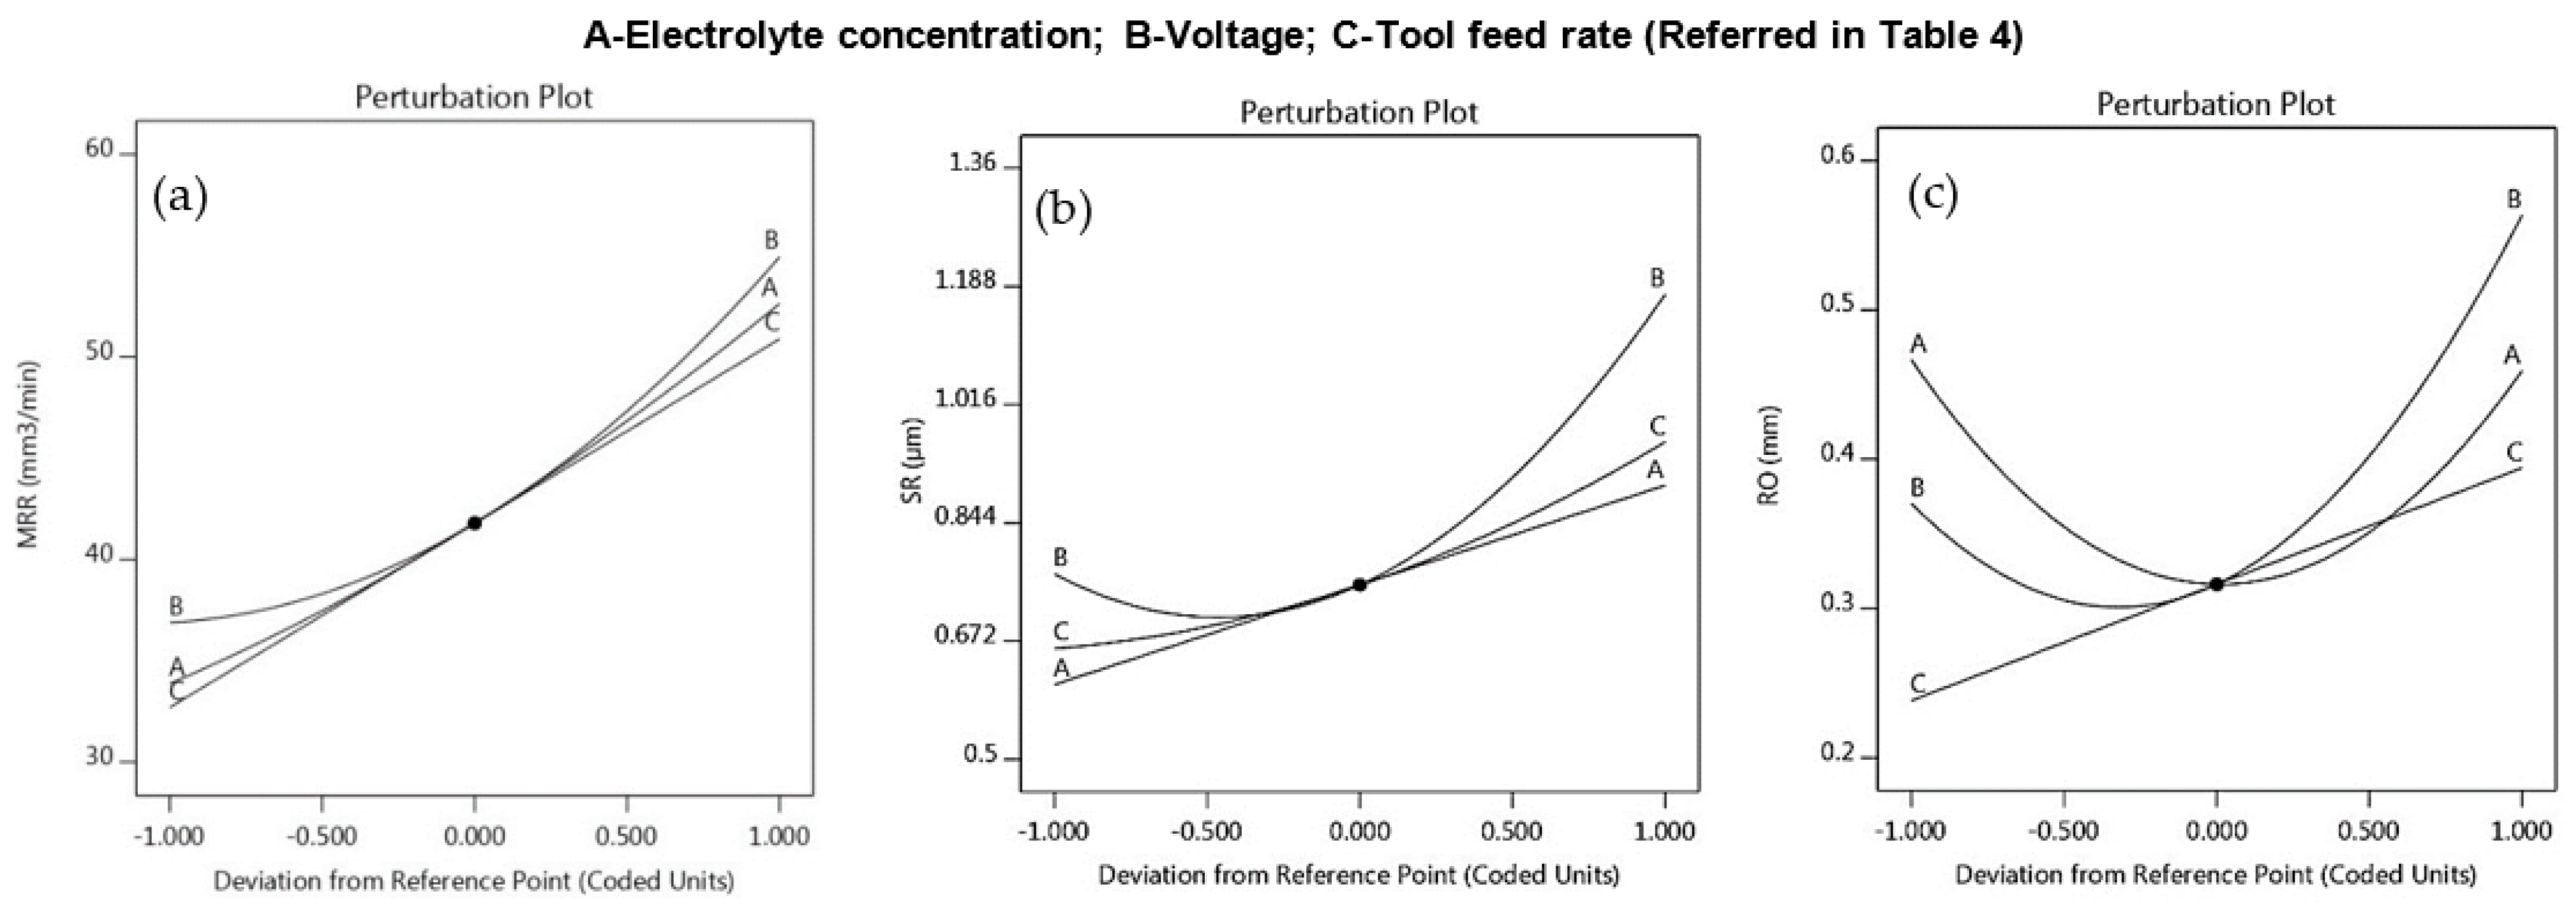
Surface plots in Figure 7 illustrate that lower electrolyte concentration, tool feed rate, and voltage lead to reduced SR. Figure 8 presents surface plots for RO. According to Table 3, the quadratic model is recommended for SR and RO. Tool feed rate and electrolyte concentration exhibit the most significant effect (at 95% confidence) on SR, as evident from p-values (<0.05) in ANOVA Table 4. According to Table 5, the F-value indicates that the influence of the three input parameters on MRR is highly significant. The perturbation plot depicts the comparative effects of important process parameters on the MRR of Inconel 718 in Figure 9a. Electrolyte concentration (A) and tool feed rate (C) are more influential than voltage (B) in the perturbation plot in Figure 9b, highlighting their importance for SR. Stiff curves for electrolyte concentration (EC), voltage (V), and tool feed rate (TFR) indicate that the MRR is highly sensitive to all the input parameters. For RO, voltage and tool feed rate are the most impactful parameters (95% confidence), as indicated by p-values (<0.05) in ANOVA Table 5. Among input parameters, tool feed rate (C) stands out in the perturbation plot in Figure 9c and is the most significant factor.
The differences between experimental and predicted results (MRR, SR, and RO) are illustrated in Figure 10a–c. Achieving the highest feasible D value is essential for optimal output responses. The study employs the composite DF to assess the ideal input parameters for maximizing MRR while minimizing SR and RO. Figure 11 displays the results of ECM optimization using the desirability function, revealing an anticipated minimum surface roughness of 0.98 µm, a radial overcut of 0.5926 mm, and a maximum material removal rate of 59.06 mm3/min. The composite desirability, D, is 0.9276, indicating well-optimized ECM machining performance, as it is very close to 1. These optimized ECM performance values are evaluated for electrolyte concentration = 200, voltage = 11.746, and tool feed rate = 0.3909, which are the predicted optimal input parameters in this study.
Confirmation experiments were conducted using the input settings: electrolyte concentration = 200 g/L, voltage = 11.7466 volts, and tool feed rate = 0.3909 mm/min. Measurements of the corresponding responses (MRR, SR, and RO) were taken, and the experimental averages from three runs are presented in Table 6. The numerical representation of these results indicates a close match between the RSM predictions and the experimental averages across various responses.
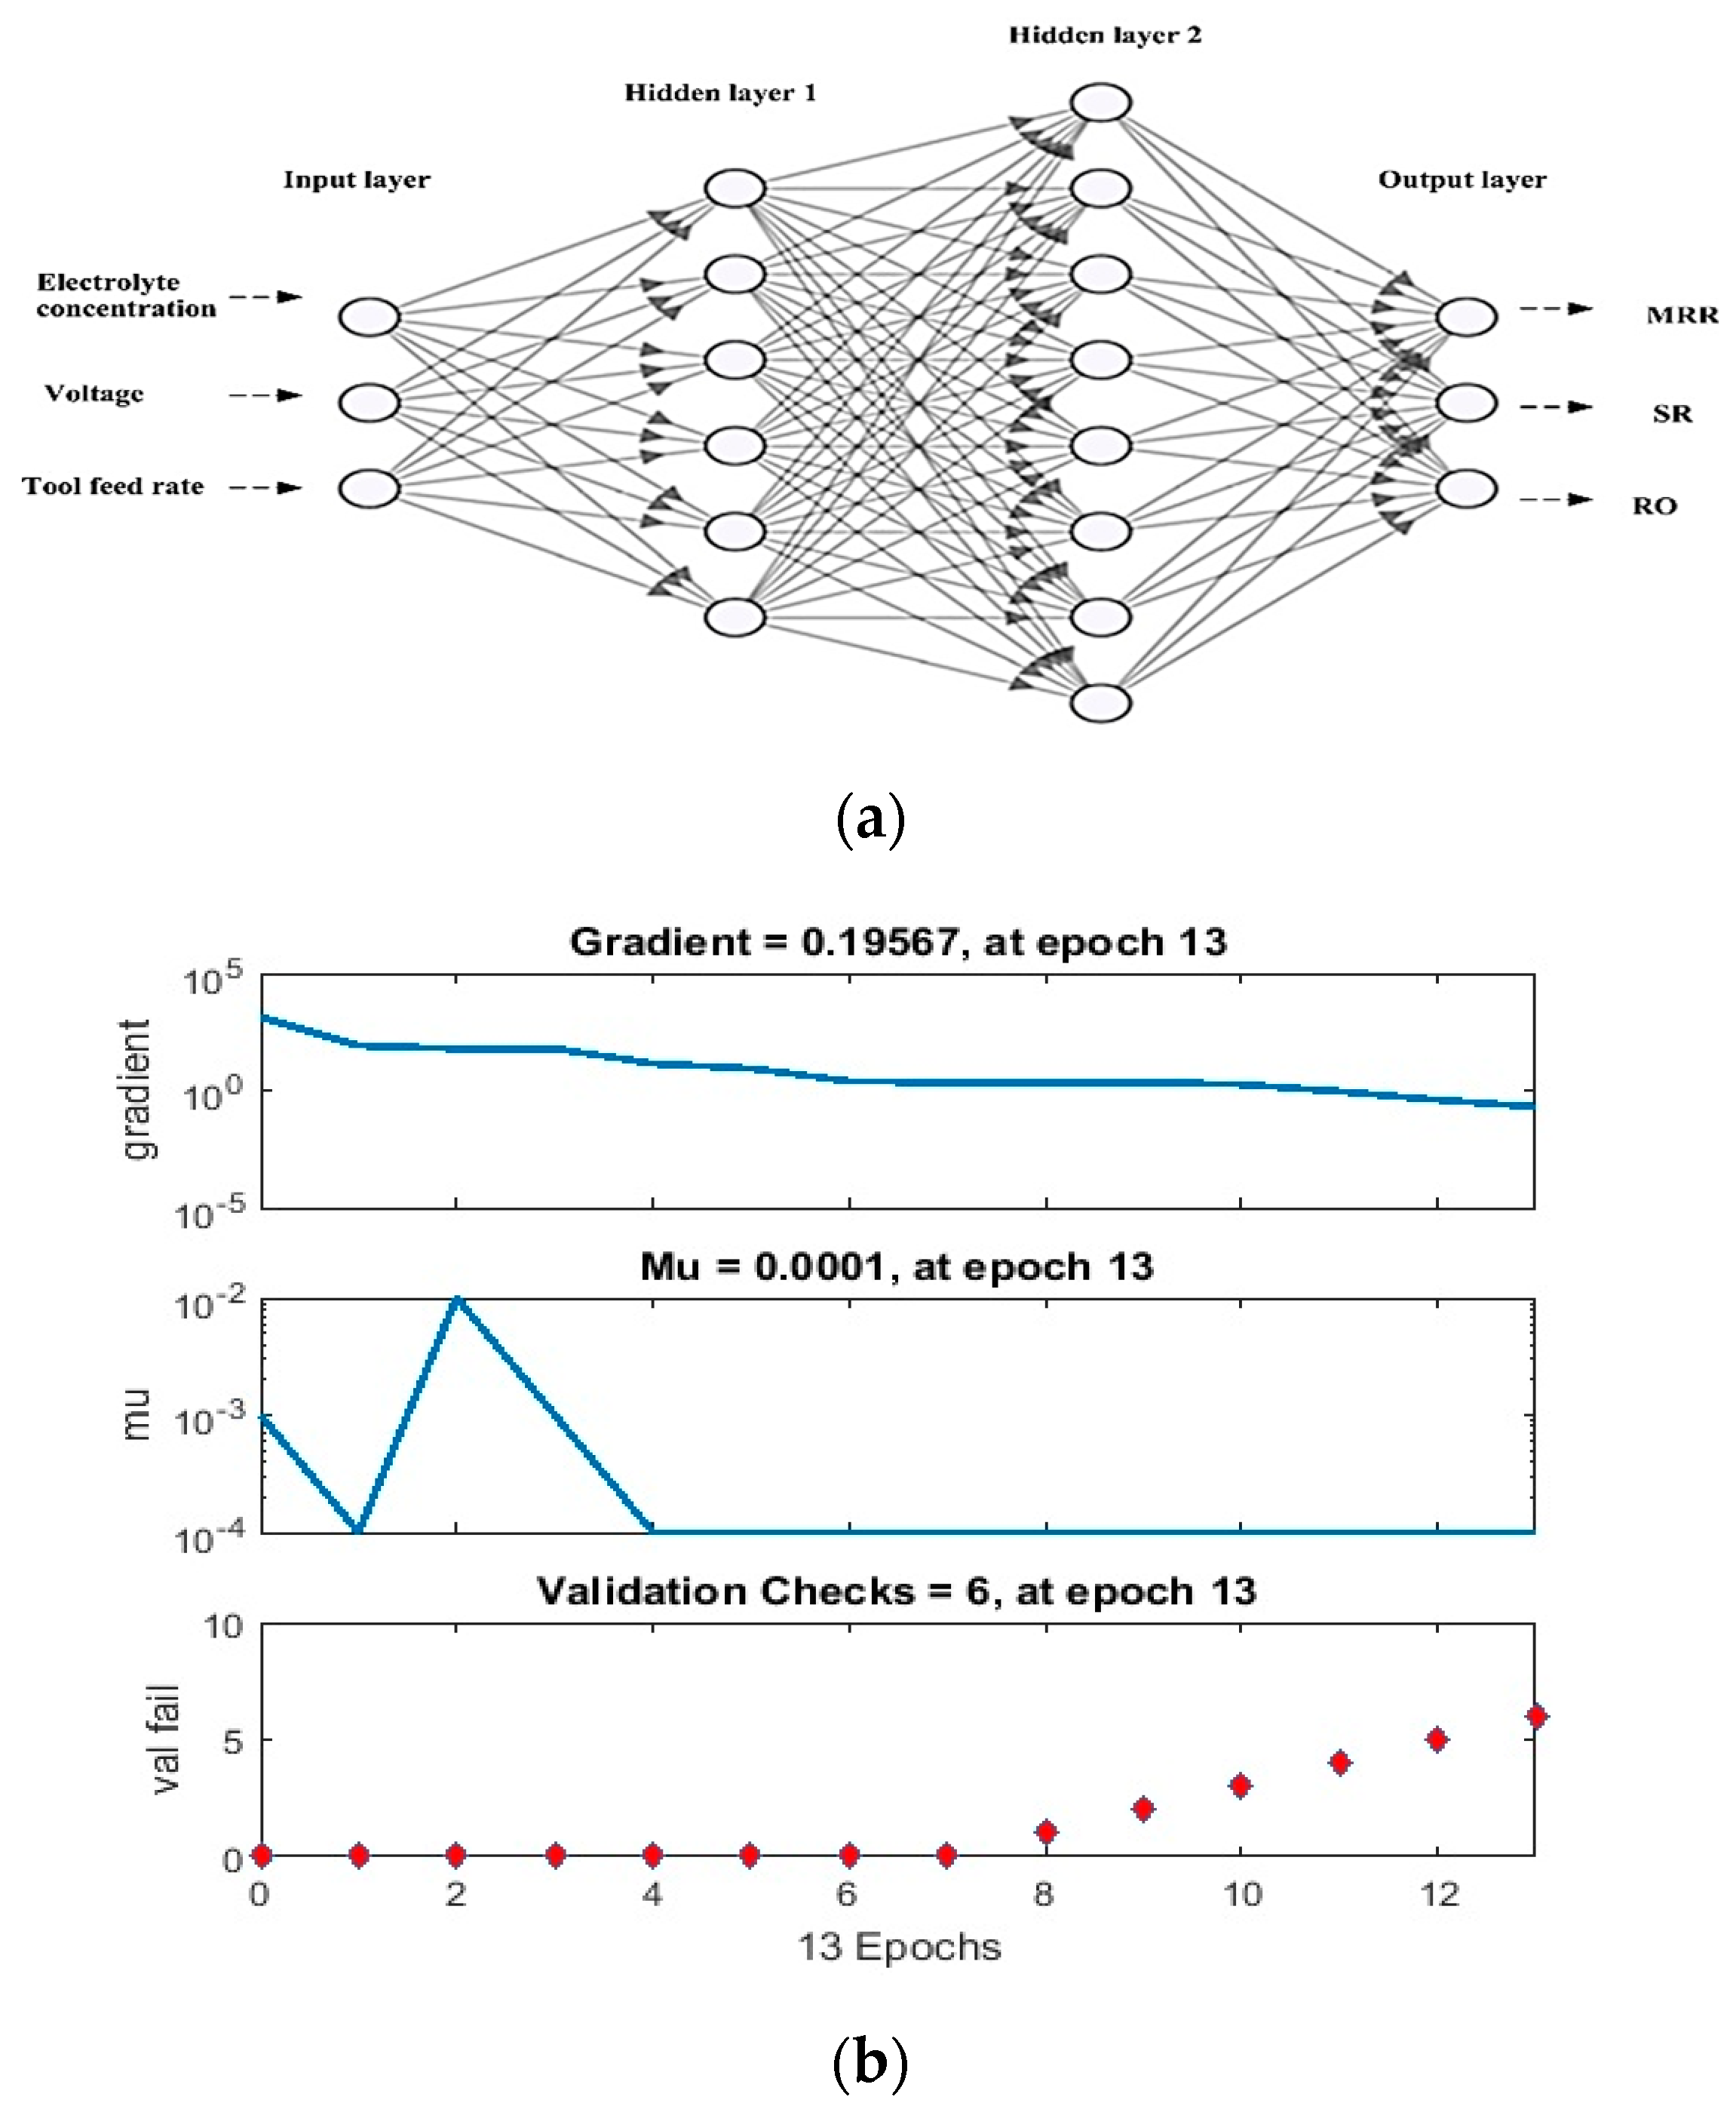
The current study also employs an artificial neural network (ANN) for analysis. This ANN has constructed the structure-based model depicted in Figure 12a and underwent training using 27 sets of input data involving EC, V, and TFR, as well as three output responses—MRR, SR, and RO. Figure 12b illustrates the training progress of the ANN model at epoch 13.
The Levenberg−Marquardt (LM) back propagation algorithm, a supervised learning method, is employed to achieve an exceptionally high R-squared (R) value of 0.99, as depicted in Figure 13. This algorithm is chosen for its superior speed and reliability compared to other algorithms, despite its higher computational and memory requirements.
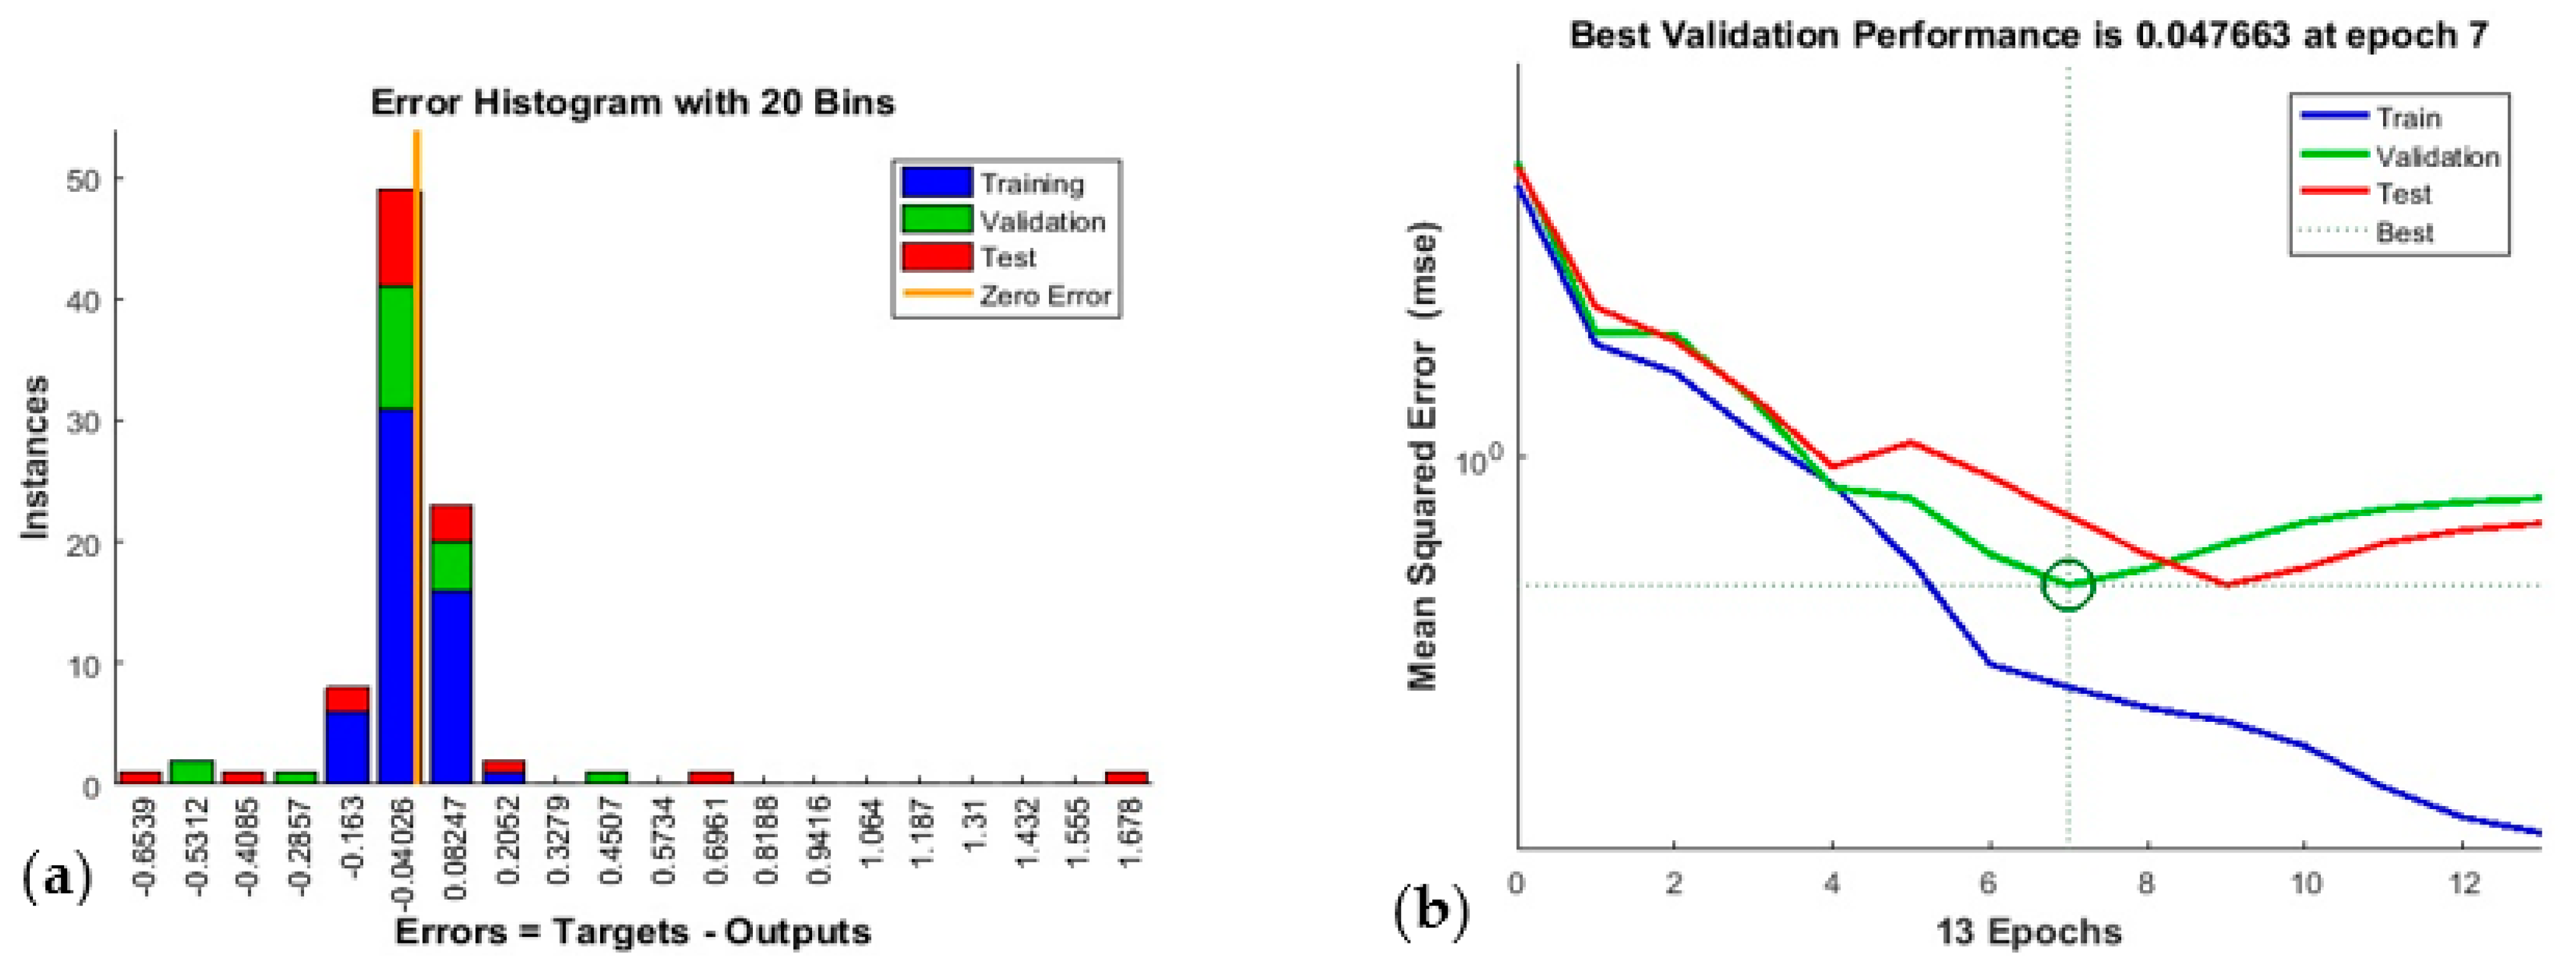
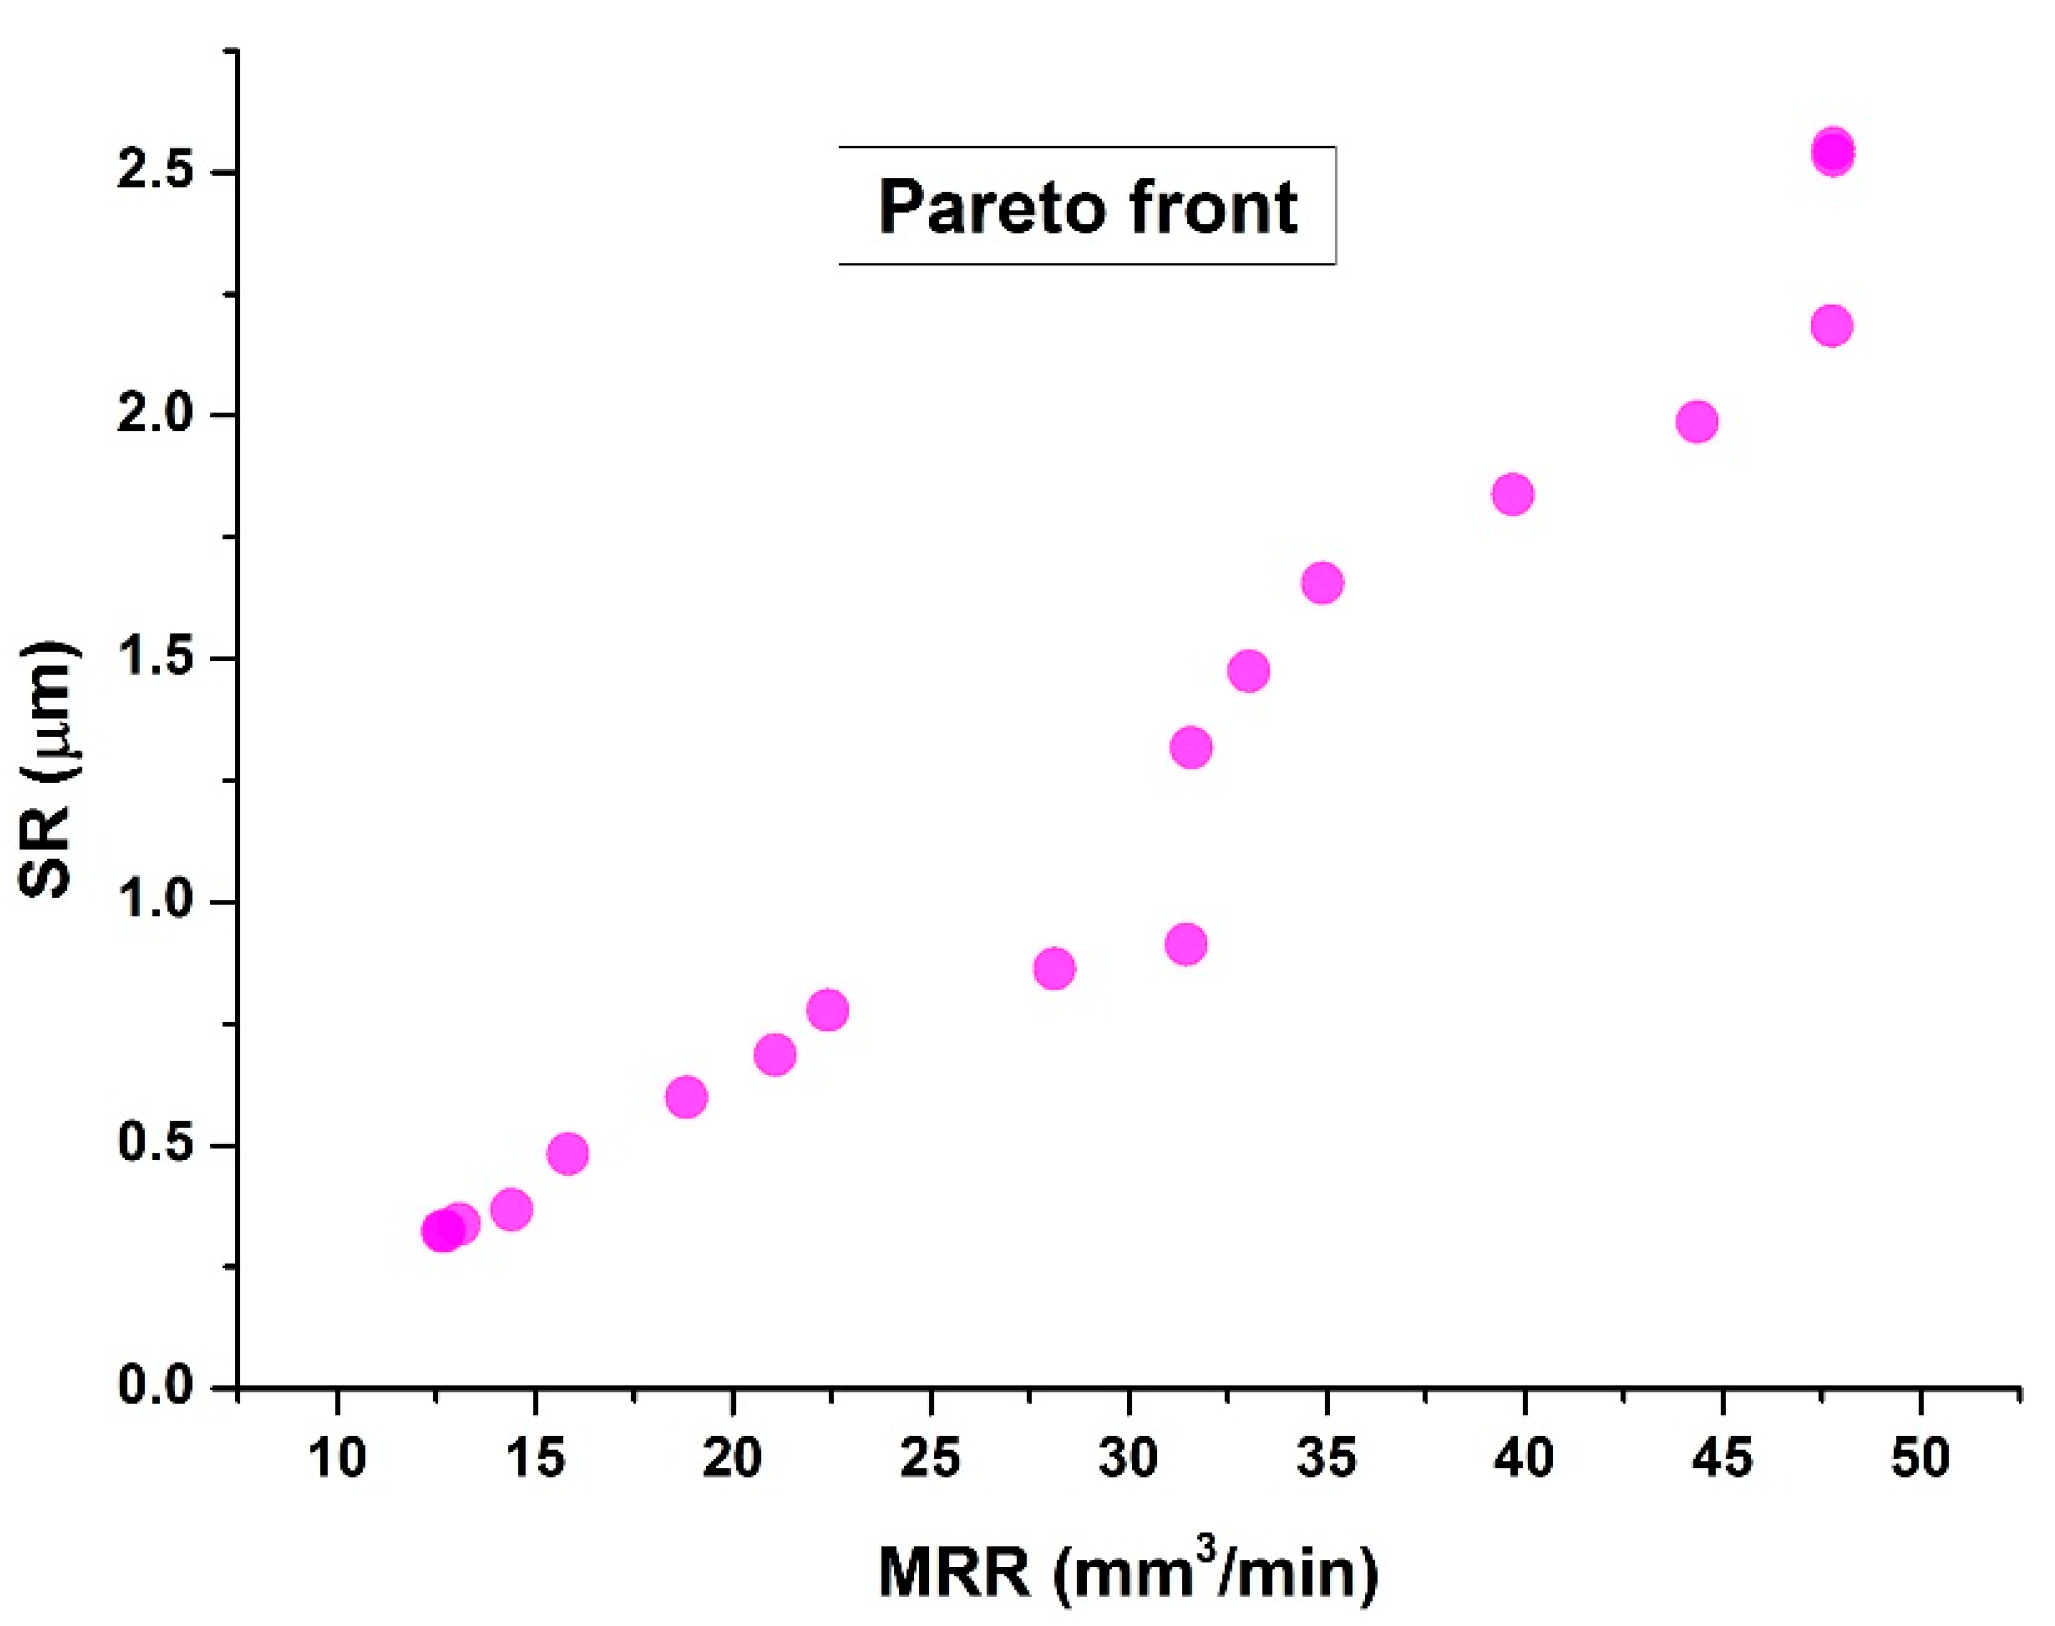
Figure 14a provides a concise visual representation of the error distribution. It divides the entire error range into 20 bins, using the Y-axis to denote the number of samples within each bin. Specifically, the highest point within the bin, signifying errors from −0.04026 to +0.08247 for the training dataset, remains below 30. For the test datasets and validation, it ranges between 30 and 48. Essentially, this plot reveals the presence of errors within specified ranges across diverse datasets. The mean squared error (MSE) plot in Figure 14b reveals that the data converges to its optimal solution after the seventh training iteration, and the training epochs automatically terminate when the MSE of validation samples starts to rise. At epoch 7, the algorithm attains its best validation performance, with an MSE of 0.04766. Using both RSM and MOGA-ANN for comparison in multi-objective optimization provides a comprehensive approach to addressing complex optimization problems. Table 7 illustrates the MOGA results, maintaining the output responses with the optimal input values. The graph of two of the output objectives (SR and MRR) is identified as pareto front, as shown in Figure 15.
A MOGA-ANN was employed to optimize input parameters. The resulting optimized combination sets were then utilized in conducting confirmative experiments aimed at validating the model. The optimum outcomes obtained using the MOGA-ANN are presented in Table 8. Confirmatory studies were carried out, specifically correlating the values with serial numbers 1, 5, 10, 15, and 18. The output results from these confirmatory studies are meticulously detailed and summarized in Table 8. To ensure the retention of accuracy, the average value was calculated after each set of tests was repeated three times. The outcome of the confirmation studies highlighted an exceptionally close match between the experimental and anticipated values.
It suggests that in other literature reviews [43,44], artificial neural networks (ANN) have been shown to provide better results than response surface methodology (RSM) in terms of desirability. This indicates that ANN is often favored for its predictive accuracy and robustness compared to traditional statistical methods like RSM.

3.1. Machined Surface Morphology Analysis

The surface morphologies of the electrochemically machined sample surfaces were examined under a scanning electron microscope (SEM). The sample composition is analyzed in SEM using an extra EDAX element. Samples 1 and 5 show relatively clean and smoother surfaces (as shown in Figure 16a,b) than any other samples. The surface roughness of the said samples is quite less than that of the other samples.
The surface morphologies of samples 10 and 18 are relatively inferior to those of samples 1 and 5. The sticky debris, irregularly in the surface and micro-surface cavities/holes, is observed on the surface of the said samples, as shown in Figure 17a,b.
The surface topography of certain samples appears very shiny and clean, while others exhibit a less desirable condition. This variance might be attributed to higher electrolytic concentrations and increased voltage effects.

3.2. Characterization of Machined Debris or Cake

The characterization of machined debris is important to investigate the chances of finding out sub-nano/sub-nano inconel 718 (workpiece) particles that may be processed to make nano/sub-nano particles byproducts of ECM. The line EDX scanning analysis of the debris for bulk composition analysis is appended here in Figure 18a,b. The elemental details of the same are given in Table 9.
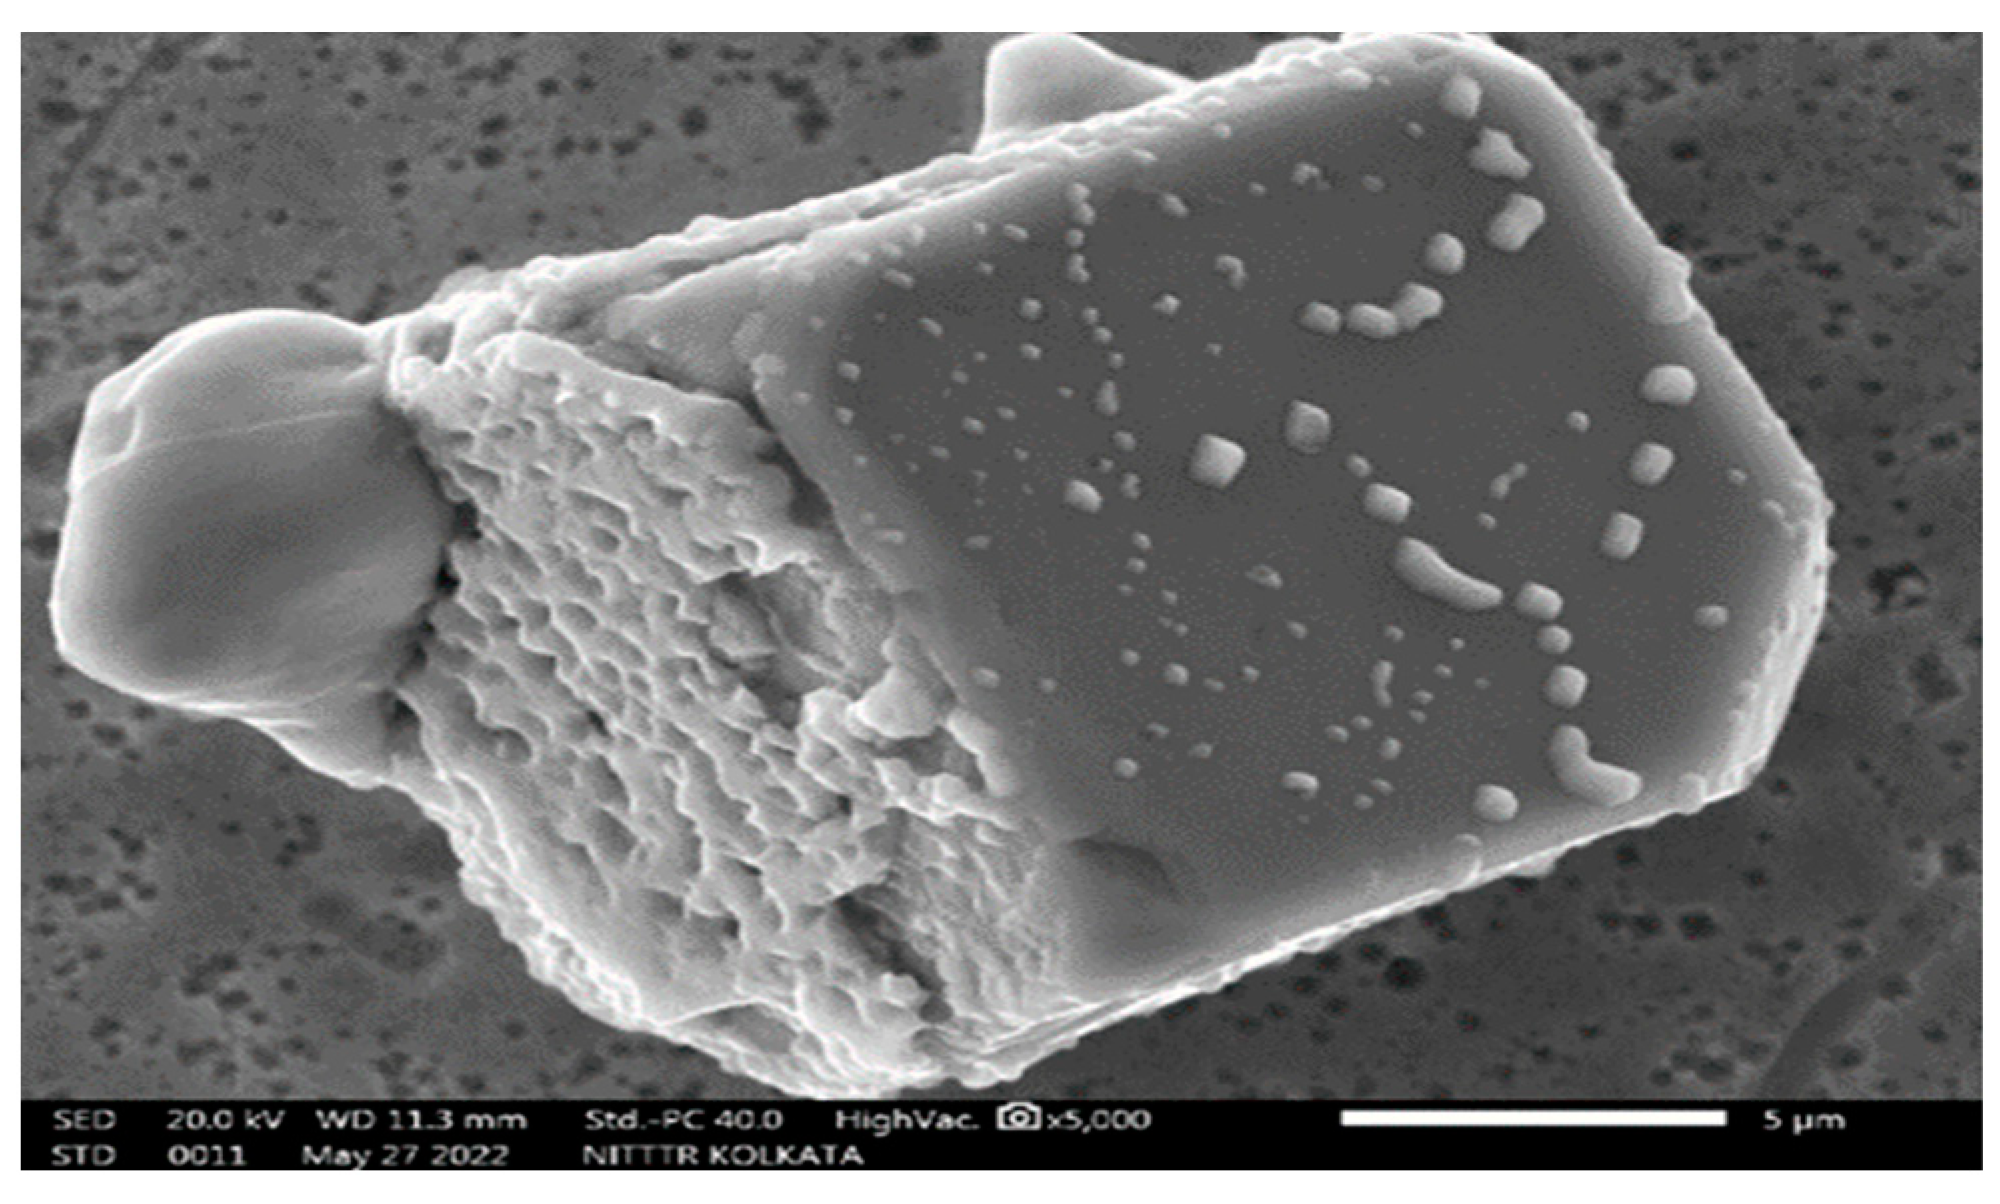
The elemental analysis confirms that the debris is the composition of Inconel 718 mixed with the electrolyte NaCl. The particle sizes vary from less than a micron to ~10 microns, as shown in Figure 19.
The Inconel 718 particles might be smaller than observed (in Figure 19) and mixed with the NaCl to form the crystalline larger particle, which might be dissolved in water again to get the minimal nano/microparticles of Inconel 718. Further investigation is essential to utilize the byproducts from ECM.

4. Conclusions

Three input parameters of the ECM process are examined for MRR, SR, and RO of Inconel 718. Based on RSM, the experimental runs are planned using a full factorial design (FFD). Using the results of the experiment, an individual predictive model has been established for the different responses of the ECM process for Inconel 718. The following observations could also be noted:
  • MRR is found to be maximum for all the higher-level values of inputs, that is, electrolyte concentration (200 g/L), tool feed rate (0.5 mm/min), and voltage (13 volts).
  • Surface roughness is found to be low at a voltage of 7 volts and an electrolyte concentration of 100 g/L when the tool feed rate is kept constant. On the other hand, the radial overcut is at its minimum at a voltage of 10 volts and an electrolyte concentration of 150 g/L when the tool feed rate remains constant.
  • With the help of the desirability approach, the optimal input parameters are found at an electrolyte concentration of 200 g/L, a voltage of 11.7466 volts, a tool feed rate of 0.3909 mm/min, and a corresponding desirability of 0.927.
  • The predicted values for MRR, SR, and RO are determined to be 59.066 mm3/min, 0.98 μm, and 0.5926 mm, respectively, at the maximum desirability of 0.9276. Judging by the R values, the ANN tool demonstrates superior fitting or performance in predicting outcomes compared to RSM, with R values of 0.99994 and 0.9276, respectively.
  • The balanced optimal outcomes attained through the MOGA-ANN hybrid technique are outlined as follows (listed as serial number 1 in Table 8): The input parameters at their optimal values are EC: 100.099 g/L; V: 8.815 volts; and TFR: 0.3 mm/min. The corresponding output values are 47.59 mm3/min, 0.0317µm, and 0.276 mm for MRR, SR, and RO, respectively.
  • It can be concluded that the MOGA-ANN hybrid approach for multi-optimization proves to be a more effective method compared to RSM for achieving maximum MRR while minimizing SR and RO in the electrochemical machining process for Inconel 718.
  • Elevated machining voltage results in detrimental effects on the machined surface, such as the formation of micro-holes attributed to hydrogen liberation, surface irregularities caused by sticky debris, and the adherence of stubborn residues due to burning.
  • The debris is full of nano/micro particulate Inconel 718. Further investigation can be initiated to separate pure Inconel 718 as an explicit byproduct for additive manufacturing industries.

Author Contributions

Conceptualization, S.S., A.K.M. and B.H.; methodology, S.S., A.K.M., H.J. and B.H.; software, S.S. and H.J.; validation, A.K.M. and B.H.; formal analysis, A.K.M., H.J., B.H., R.Č. and A.K.; investigation, S.S.; resources, A.K.M. and N.A.A.; data curation, S.A.; writing—original draft preparation, S.S., A.K.M., B.H. and H.J.; writing—review and editing, S.A., N.A.A., B.H., R.Č. and A.K.; visualization, N.A.A., B.H., S.A., H.J., R.Č. and A.K.; supervision, B.H. and A.K.M.; project administration, B.H., A.K.M., H.J., S.A. and N.A.A.; funding acquisition, B.H., A.K.M., H.J., S.A., N.A.A., R.Č. and A.K. All authors have read and agreed to the published version of the manuscript.

Funding

This work was supported and funded by the Deanship of Scientific Research at Imam Mohammad Ibn Saud Islamic University (IMSIU) (grant number IMSIU-RG23023).

Data Availability Statement

The authors declare that the data supporting the findings of this study are available within the paper.

Acknowledgments

The authors would like to express their gratitude to the National Institute of Technical Teachers Training and Research (NITTTR), Kolkata, India, for their core support of this team research. Additionally, the authors extend their thanks to the Ministry of Education, Youth, and Sports in the Czech Republic for encouraging this work through the Student Competition on ‘Specific Research of Sustainable Manufacturing Technologies’ at the Faculty of Mechanical Engineering, VŠB-Technical University of Ostrava (TUO). The authors are also thankful for the extended cooperation of CV Raman Global University, Odisha, India, and JECRC University, Jaipur, Rajasthan, India. Our deep thanks extend also to Deanship of Scientific Research at Imam Mohammad Ibn Saud Islamic University (IMSIU) for their supported.

Conflicts of Interest

The authors declare no conflicts of interest.

References

  1. Bhadeshia, H.K.D.H. Nickel Based Superalloys. Available online: https://www.phase-trans.msm.cam.ac.uk/2003/Superalloys/superalloys.html (accessed on 7 October 2023).
  2. Choudhury, I.A.; El-Baradie, M.A. Machining nickel base superalloys: Inconel 718. Proc. Inst. Mech. Eng. Part B J. Eng. Manuf. 1998, 212, 195–206. [Google Scholar] [CrossRef]
  3. Klocke, F.; Zeis, M.; Klink, A.; Veselovac, D. Experimental research on the Electrochemical Machining of modern titanium- and nickel-based alloys for aero engine components. Procedia CIRP 2013, 6, 368–372. [Google Scholar] [CrossRef]
  4. Van Riel, T.; Qian, J.; Lauwers, B. Exploratory study of wire based ECM finishing of 316L stainless steel, implemented within a hybrid wire EDM-ECM platform. Procedia CIRP 2022, 113, 465–470. [Google Scholar] [CrossRef]
  5. ASM Handbook Committee. ASM Handbook Volume 16: Machining; ASM Handbook Committee, Ed.; ASM International: Materials Park, OH, USA, 1989; ISBN 978-1-62708-188-7. [Google Scholar]
  6. Crichton, I.M.; McGeough, J.A.; Munro, W.; White, C. Comparative studies of ecm, edm and ecam. Precis. Eng. 1981, 3, 155–160. [Google Scholar] [CrossRef]
  7. Ghosh, A.; Mallik, A.K. Manufacturing Science, 2nd ed.; East-West Press Pvt Ltd.: New Delhi, India, 2010; ISBN 9780470203125. [Google Scholar]
  8. Liu, J.; Liu, Y.; Zhang, Z.; Wang, H. Parameter Optimization and Experimental Study on Tool-Vibration-Assisted Pulsed Electrochemical Machining of γ-TiAl TNM Blades. Appl. Sci. 2022, 12, 8042. [Google Scholar] [CrossRef]
  9. Jadhav, D.B.; Jadhav, P.V.; Bilgi, D.S.; Sawant, A.A. Experimental Investigation of MRR on Inconel 600 using Ultrasonic Assisted Pulse Electrochemical Machining. IOP Conf. Ser. Mater. Sci. Eng. 2018, 377, 012095. [Google Scholar] [CrossRef]
  10. Jiang, X.; Li, D.; Xu, Z. Simulation and Experimental Analyses of Multi-field Coupling in Electrochemical Machining. Int. J. Electrochem. Sci. 2022, 17, 220932. [Google Scholar] [CrossRef]
  11. Rajurkar, K.P.; Zhu, D.; MacGeough, J.A.; Kozak, J.; De Silva, A. New Developments in Electro-Chemical Machining. CIRP Ann. 1999, 48, 567–579. [Google Scholar] [CrossRef]
  12. Pingale, A.D.; Owhal, A.; Katarkar, A.S.; Belgamwar, S.U.; Rathore, J.S. Recent researches on Cu-Ni alloy matrix composites through electrodeposition and powder metallurgy methods: A review. Mater. Today Proc. 2021, 47, 3301–3308. [Google Scholar] [CrossRef]
  13. Lee, K.J.; Lee, J.S. Synthesis of nano metal powder by electrochemical reduction of metal oxides. Mater. Sci. Forum 2004, 449–452, 1137–1140. [Google Scholar] [CrossRef]
  14. Zhao, L.Y.; Siu, A.C.; Pariag, L.J.; He, Z.H.; Leung, K.T. Electrochemical deposition of chromium core-shell nanostructures on H-Si(100): Evolution of spherical nanoparticles to uniform thin film without and with atop hexagonal microrods. J. Phys. Chem. C 2007, 111, 14621–14624. [Google Scholar] [CrossRef]
  15. Rai, V.; Liu, D.; Xia, D.; Jayaraman, Y.; Gabriel, J.C.P. Electrochemical approaches for the recovery of metals from electronic waste: A critical review. Recycling 2021, 6, 53. [Google Scholar] [CrossRef]
  16. Benedict, G.F. Nontraditional Manufacturing Processes, 1st ed.; Taylor & Francis: Abingdon, UK, 1987; ISBN 0824773527. [Google Scholar]
  17. Reed, R.C. The Superalloys as High-Temperature Materials; Cambridge University Press: Cambridge, UK, 2006; ISBN 9780521859042. [Google Scholar]
  18. Klocke, F.; Zeis, M.; Harst, S.; Klink, A.; Veselovac, D.; Baumgärtner, M. Modeling and simulation of the electrochemical machining (ECM) material removal process for the manufacture of aero engine components. Procedia CIRP 2013, 8, 265–270. [Google Scholar] [CrossRef]
  19. Geethapriyan, T.; Kalaichelvan, K.; Muthuramalingam, T. Influence of Coated Tool Electrode on Drilling Inconel Alloy 718 in Electrochemical Micro Machining. Procedia CIRP 2016, 46, 127–130. [Google Scholar] [CrossRef]
  20. Geethapriyan, T.; Kalaichelvan, K.; Muthuramalingam, T. Multi performance optimization of electrochemical micro-machining process surface related parameters on machining Inconel 718 using Taguchi-grey relational analysis. Metall. Ital. 2016, 108, 13–19. [Google Scholar]
  21. Zhu, D.; Yu, L.; Zhang, R. Dissolution Effects with Different Microstructures of Inconel 718 on Surface Integrity in Electrochemical Machining. J. Electrochem. Soc. 2018, 165, E872–E878. [Google Scholar] [CrossRef]
  22. Klocke, F.; Herrig, T.; Zeis, M.; Klink, A. Experimental Investigations of Cutting Rates and Surface Integrity in Wire Electrochemical Machining with Rotating Electrode. Procedia CIRP 2018, 68, 725–730. [Google Scholar] [CrossRef]
  23. Wang, D.; He, B.; Cao, W. Enhancement of the localization effect during electrochemical machining of inconel 718 by using an alkaline solution. Appl. Sci. 2019, 9, 690. [Google Scholar] [CrossRef]
  24. Wang, D.; Zhang, J. Experimental Research on the Counter-Rotating Electrochemical Machining of 304 Stainless Steel and Inconel 718 Alloy. Int. J. Electrochem. Sci. 2019, 14, 9741–9754. [Google Scholar] [CrossRef]
  25. Madhankumar, S.; Kumaar, K.A.; Arunachalam, S.; Suhirtharaj, J.B.; Anek Anil, K.; Aadhavan, P.; Hari Narayanan, K.R.; Akshey, P.B. Assessments and comparison of Inconel 625 and Inconel 718 alloys from overcut in micro ECM. Mater. Today Proc. 2021, 45, 6459–6464. [Google Scholar] [CrossRef]
  26. Madhankumar, S.; Rajesh, S.; Balamurugan, R.; Tharun Sri Ram, N.; Venuprasath, S.; Tazmeel Ahamed, S. Optimization of Material Removal Rate and Surface Roughness for Micro ECM of Inconel 718 alloy utilizing Grey Relational Technique. IOP Conf. Ser. Mater. Sci. Eng. 2021, 1059, 012008. [Google Scholar] [CrossRef]
  27. Rajesh, S.; Antony Prabu, D.; Gobikrishnan, U.; Lokesh Kumar, P.J.; Selvan, T.A.; Ramesh, A.; Madhankumar, S. Surface roughness assessments and comparative study of Inconel 625 and Inconel 718 alloys after micro electrochemical machining. Mater. Today Proc. 2022, 62, 938–943. [Google Scholar] [CrossRef]
  28. Kong, W.; Zeng, Y.; Liu, Z.; Hu, X.; Kong, H. Helical wire electrochemical discharge machining on large-thickness Inconel 718 alloy in low-conductivity salt-glycol solution. Chin. J. Aeronaut. 2023, 36, 522–533. [Google Scholar] [CrossRef]
  29. Leo Kumar, S.P.; Jerald, J.; Kumanan, S.; Aniket, N. Process parameters optimization for micro end-milling operation for CAPP applications. Neural Comput. Appl. 2014, 25, 1941–1950. [Google Scholar] [CrossRef]
  30. Beruvides, G.; Castaño, F.; Quiza, R.; Haber, R.E. Surface roughness modeling and optimization of tungsten-copper alloys in micro-milling processes. Meas. J. Int. Meas. Confed. 2016, 86, 246–252. [Google Scholar] [CrossRef]
  31. Agrawal, S.; Agrawal, S.; Kumar Kasdekar, D. Optimization of MRR and electrolyte coating thickness of ECM parameters using PCA based GRA. Mater. Today Proc. 2018, 5, 18956–18965. [Google Scholar] [CrossRef]
  32. Majumder, H.; Paul, T.R.; Dey, V.; Dutta, P.; Saha, A. Use of PCA-grey analysis and RSM to model cutting time and surface finish of Inconel 800 during wire electro discharge cutting. Meas. J. Int. Meas. Confed. 2017, 107, 19–30. [Google Scholar] [CrossRef]
  33. Adak, D.K.; Pal, V.; Das, S.; Ghara, T.; Joardar, H.; Alrasheedi, N.; Haldar, B. Surface Preparation for Coating and Erosion MRR of SS 304 Using Silicon Carbide Abrasive Jet. Lubricants 2023, 11, 10. [Google Scholar] [CrossRef]
  34. Haldar, B.; Joardar, H.; Louhichi, B.; Alsaleh, N.A.; Alfozan, A. A Comparative Machinability Study of SS 304 in Turning under Dry, New Micro-Jet, and Flood Cooling Lubrication Conditions. Lubricants 2022, 10, 359. [Google Scholar] [CrossRef]
  35. Karumuri, S.; Haldar, B.; Pradeep, A.; Karanam, S.A.K.; Sri, M.N.S.; Anusha, P.; Sateesh, N.; Subbiah, R.; Vijayakumar, S. Multi-objective optimization using Taguchi based grey relational analysis in friction stir welding for dissimilar aluminium alloy. Int. J. Interact. Des. Manuf. 2023, 18, 1627–1644. [Google Scholar] [CrossRef]
  36. Winiczenko, R.; Kaleta, A.; Górnicki, K. Application of a moga algorithm and ann in the optimization of apple drying and rehydration processes. Processes 2021, 9, 1415. [Google Scholar] [CrossRef]
  37. Pramanick, A.; Kumar, R.; Mandal, S.; Dey, P.P.; Das, P.K. Modeling and multi-objective optimization of WEDM of spark plasma sintered boron carbide considering preferences of users. IOP Conf. Ser. Mater. Sci. Eng. 2018, 377, 012094. [Google Scholar] [CrossRef]
  38. Bhaumik, M.; Maity, K.; Mohapatra, K. Das Multi-Objective Optimization ff EDM Process Parameters Using Rsm-Based GRA and Topsis Method For Grade 6 Titanium Alloy. Surf. Rev. Lett. 2021, 28, 4–5. [Google Scholar] [CrossRef]
  39. Rajamanickam, S.; Prasanna, J. Multi objective optimization during small hole electrical discharge machining (EDM) of Ti-6Al-4V using TOPSIS. Mater. Today Proc. 2019, 18, 3109–3115. [Google Scholar] [CrossRef]
  40. Prakash, C.; Kansal, H.K.; Pabla, B.S.; Puri, S. Multi-objective optimization of powder mixed electric discharge machining parameters for fabrication of biocompatible layer on β-Ti alloy using NSGA-II coupled with Taguchi based response surface methodology. J. Mech. Sci. Technol. 2016, 30, 4195–4204. [Google Scholar] [CrossRef]
  41. Kumar, L.; Kumar, K.; Chhabra, D. Experimental investigations of electrical discharge micro-drilling for Mg-alloy and multi-response optimization using MOGA-ANN. CIRP J. Manuf. Sci. Technol. 2022, 38, 774–786. [Google Scholar] [CrossRef]
  42. Hosamo, H.; Hosamo, M.H.; Nielsen, H.K.; Svennevig, P.R.; Svidt, K. Digital Twin of HVAC system (HVACDT) for multiobjective optimization of energy consumption and thermal comfort based on BIM framework with ANN-MOGA. Adv. Build. Energy Res. 2023, 17, 125–171. [Google Scholar] [CrossRef]
  43. Zhao, D.; Wang, Y.; Liang, D.; Ivanov, M. Performances of regression model and artificial neural network in monitoring welding quality based on power signal. J. Mater. Res. Technol. 2020, 9, 1231–1240. [Google Scholar] [CrossRef]
  44. Nalbant, M.; Gokkaya, H.; Toktaş, I. Comparison of regression and artificial neural network models for surface roughness prediction with the cutting parameters in CNC turning. Model. Simul. Eng. 2007, 2007, 092717. [Google Scholar] [CrossRef]
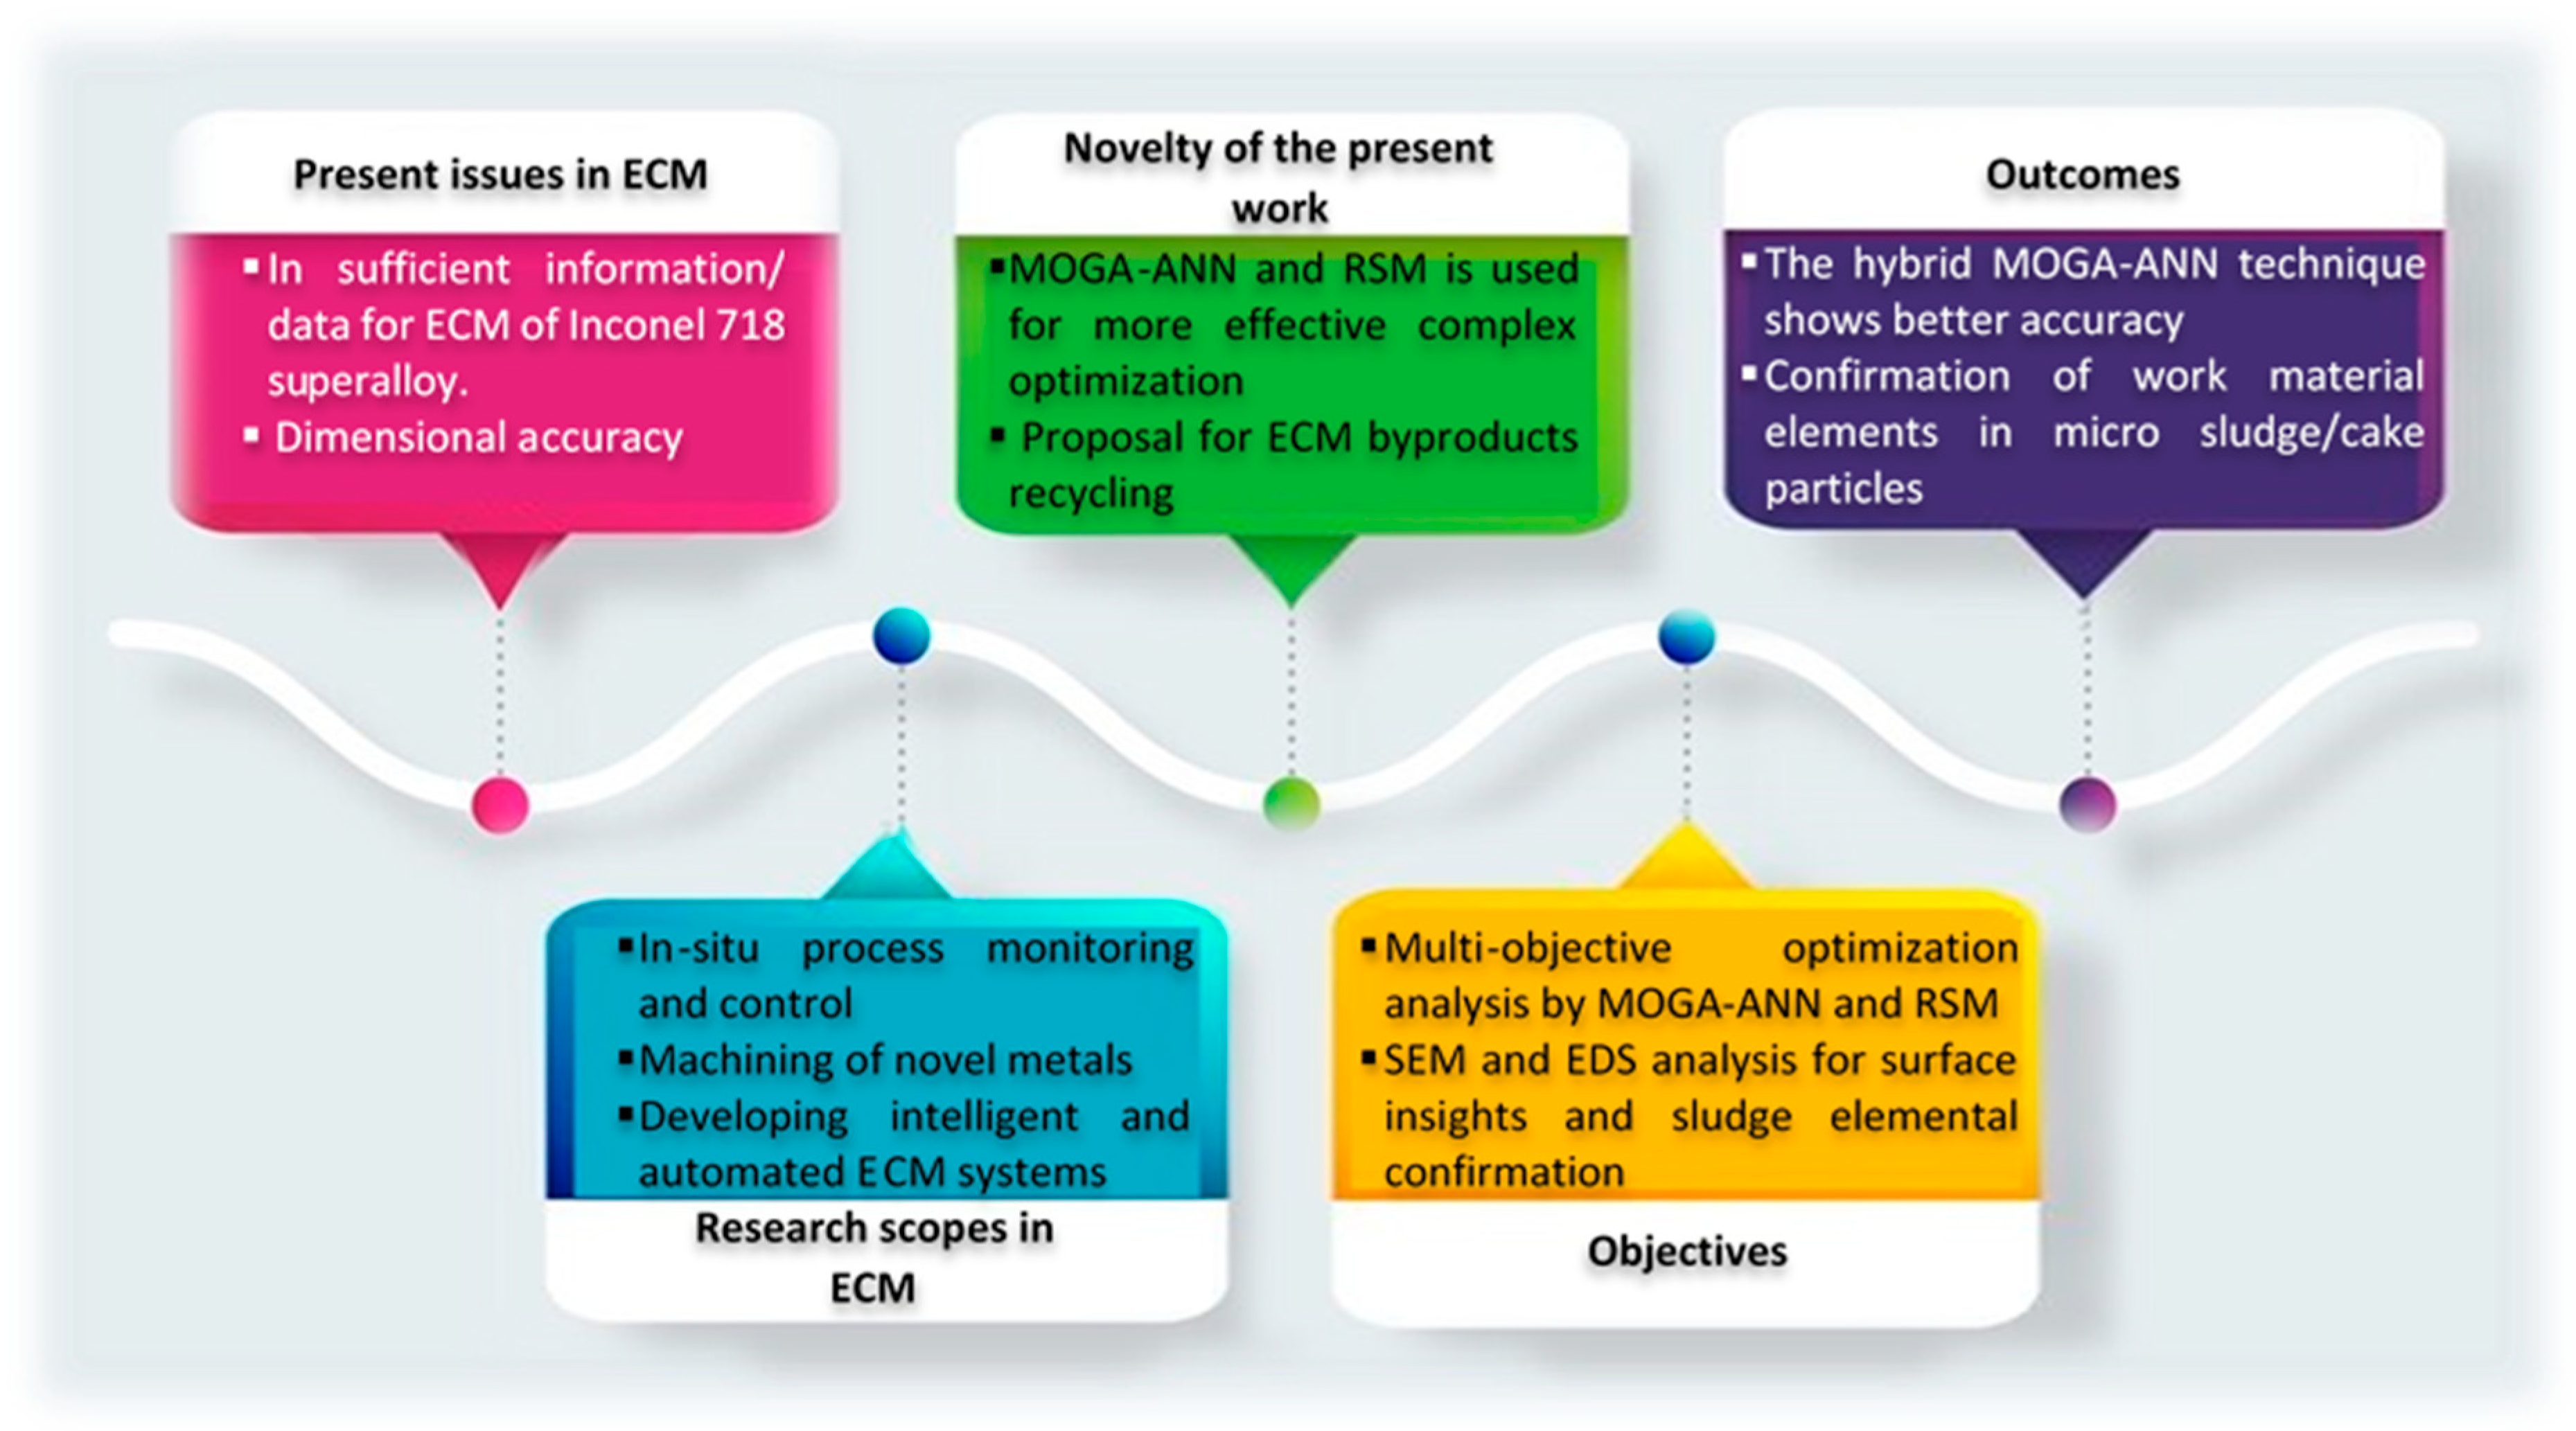
Figure 1. The infographic overview of the present investigation.
Machines 12 00335 g001
Figure 2. ECM (a) setup and (b) tool-work interface during machining operation.
Machines 12 00335 g002
Figure 3. Photographs of ECM (a,b) machined specimen and (c,d) overcut measurements.
Machines 12 00335 g003
Figure 4. Steps for MOGA optimization.
Machines 12 00335 g004
Figure 5. Normal residual plots for (a) MRR, (b) SR, and (c) RO.
Machines 12 00335 g005
Figure 6. Surface plot on MRR: (a) EC Vs. V (TFR: 0.4 mm/min is constant), (b) EC Vs. TFR (V: 10 volts is constant), and (c) TFR Vs. V (EC: 150 g/L is constant).
Machines 12 00335 g006
Figure 7. Surface plot on SR: (a) EC Vs. V (TFR: 0.4 mm/min is constant), (b) EC Vs. TFR (V: 10 volt is constant), and (c) TFR Vs. V (EC: 150 g/L is constant).
Machines 12 00335 g007
Figure 8. Surface plot on RO: (a) EC Vs. V (TFR: 0.4 mm/min is constant), (b) EC Vs. TFR (V: 10 volt is constant), and (c) TFR Vs. V (EC: 150 g/L is constant).
Machines 12 00335 g008
Figure 9. Perturbation plot for (a) MRR (b) SR and (c) RO.
Machines 12 00335 g009
Figure 10. Comparison between predicted and experimental values for the (a) MRR, (b) SR, and (c) RO.
Machines 12 00335 g010
Figure 11. Multi-optimization using “Desirability function”.
Machines 12 00335 g011
Figure 12. Structure (a) training state, and (b) ANN model.
Machines 12 00335 g012
Figure 13. p-Model trained by ANN for optimal fitness.
Machines 12 00335 g013
Figure 14. Histogram (a) MSE plots (b) neural network.
Machines 12 00335 g014
Figure 15. Pareto front plot.
Machines 12 00335 g015
Figure 16. Smooth machined surfaces of (a) sample 1 and (b) sample 5.
Machines 12 00335 g016
Figure 17. Some rough and defective surfaces of (a) sample 10 and (b) sample 18.
Machines 12 00335 g017
Figure 18. EDX analysis of debris (a) line scanning image (b) elemental intensity image.
Machines 12 00335 g018
Figure 19. A configuration of debris particle.
Machines 12 00335 g019
Table 1. Characteristics of EDM, ECM, and hybrid EDM-ECM.
Characteristics:EDMECMHybrid EDM-ECM
Mechanism:Spark erosion
(current density is the main factor)
Atomic dissolution
(Current density and atomic number are the main factors)
Hybrid (initially EDM and fishing by ECM)
Material removal rate (MRR):~4350 mm3/min per 400 A~650 to 4400 mm3/min per 1000 A [5]Higher than both
Heat affected zone (HAZ):Yes [6]No [6]Removed by ECM
Stress-concentration:YesNoRemoved by ECM
Tool wear:YesNoYes
Surface quality:
Damaged and rough due to the re-cast layer
Surface finish ranges from 0.2 to 12.5 µm
Smooth and bright
Surface finish is usually 0.30 to 1.9 µm
Better than EDM
Shape flexibility:RestrictedBetter than EDM and Hybrid EDM-ECMRestricted
Dimensional accuracy:Generally, ±0.013 to ±0.005 mm can be obtained Wire-EDM [5]Upto ±0.025 mm [5]Better than ECM
Power requirement:0.5 and 400 A
and 40 to 400 V DC
50 to 4000 A
and 5 to 30 V DC
Hybrid mode
Fluid and flow pressure:Di-electric pressure ia about 2 kg/cm2High electrolyte pressure (14 kg/cm2) is unfavourable for soft/thin metallic partsunfavourable for soft/thin metallic parts
Maintenance:RegularRegular and highly essentialRegular and highly essential
Table 2. Design parameters with their levels in the electrochemical machining process.
Process ParametersLevel 1Level 2Level 3
Electrolyte concentration (g/L), EC100150200
Voltage (V), V71013
Tool feed rate (mm/min), TFR0.30.40.5
Table 3. The final experimental output values.
Exp No.Electrolyte Concentration (g/L)Voltage (V)Tool Feed Rate (mm/min)Material Removal Rate (mm3/min)Surface Roughness
(µm)
Radial Overcut
(mm)
0110070.326.3210.4010.596
0210070.432.1530.6720.462
0310070.534.5950.5950.587
04100100.327.4730.5030.299
05100100.434.1990.6540.453
06100100.544.380.9980.379
07100130.334.3921.8650.658
08100130.442.1251.0590.432
09100130.556.3250.9450.65
1015070.331.340.7930.35
1115070.437.0840.860.402
1215070.544.1591.0060.919
13150100.333.0560.6280.248
14150100.441.0180.6690.338
15150100.551.561.0380.393
16150130.347.0080.8070.448
17150130.4551.1290.55
18150130.566.9520.7060.582
1920070.339.4790.6020.284
2020070.442.5320.8910.427
2120070.552.7 931.6220.593
22200100.345.3810.4950.453
23200100.452.560.830.468
24200100.558.4051.1450.627
25200130.352.941.0290.61
26200130.462.8821.2560.374
27200130.581.8071.4860.944
Table 4. The model fitting values.
SourceMRRSRRO
F-Valuep-ValueF-Valuep-ValueF-Valuep-Value
Linear vs. Mean48.34<0.00013.740.03275.830.0182
2FI vs. Linear4.710.01959.520.00143.170.0012
Quadratic vs. 2FI241.43<0.000125.93<0.0001478.00<0.0001
Cubic vs. Quadratic0.77570.57924.890.04262.990.1115
Table 5. The ANOVA application on measurements and check for the model’s capacity to fit the data.
SourceMRRSRRO
F-Valuep-ValueF-Valuep-ValueF-Valuep-Value
Model1896.03<0.000161.98<0.0001789.98<0.0001
A-Electrolyte concentration4770.66<0.000151.76<0.00011.440.2551
B-Voltage4415.70<0.0001101.76<0.0201980.49<0.0001
C-Tool feed rate4484.51<0.000155.54<0.0001638.95<0.0001
AB108.99<0.000143.00<0.0001412.74<0.0001
AC97.29<0.0001106.70<0.0001559.49<0.0001
BC579.02<0.000154.93<0.00011.520.2431
A236.70<0.000137.92<0.0001725.10<0.0001
B2294.30<0.00012.640.1326765.18<0.0001
Lack of Fit2.380.18033.180.11282.540.1631
not significantnot significantnot significant
0.99930.97830.9983
Adjusted R²0.99870.96250.9970
Predicted R²0.99530.84470.9904
Table 6. Confirmation test result for optimization.
ComparisonMRR
(mm3/min)
SR
(µm)
RO
(mm)
Predicted59.0660.980.5926
Experimental60.1060.9560.5844
% Variation<2%<3%<2%
Table 7. Optimized results for MOGA ANN.
Sl NoInput ParameterOutput
ECVTFRMRRSRRO
1100.0998.8150.30047.590.3170.276
2100.00112.9830.50012.142.1630.738
3100.0019.7110.50047.600.3180.274
4100.00912.2590.47611.792.4980.503
5100.0209.9140.31547.560.3180.279
6100.00512.8000.46413.391.9930.686
7100.00212.9090.48223.411.1560.400
8100.03712.6970.42533.310.6100.129
9100.0998.8150.30019.681.4700.502
10100.00910.4720.32229.790.8410.198
11100.00112.5070.48811.792.4980.503
12100.0089.4130.43945.660.3240.225
13100.01812.9650.32636.990.4820.020
14100.00812.2620.47414.851.8790.622
15100.00210.6020.49922.891.3710.332
16100.00711.6950.46331.780.6800.170
17100.00111.4830.50040.480.4460.103
18100.00912.9890.48817.381.6260.574
Table 8. Validation of the MOGA-ANN model.
Sl NoInput ParameterOutput Responses
Predicted ValuesExperimental Values
ECVTFRMRRSRROMRRSRRO
1100.0998.8150.30047.590.3170.27648.540.3290.288
5100.0209.9140.31547.560.3180.27948.920.3210.292
10100.00910.470.32229.790.8410.19829.490.8640.192
15100.00210.600.49922.891.3710.33223.691.4390.338
18100.00912.980.48817.381.6260.57418.071.9410.584
Table 9. The elemental details of debris, as shown in Figure 18.
ElementWeight %Atomic %Error %Net Int.
C K0.10.2100.00.0
Na K37.664.810.175.6
Cl K0.60.765.41.8
Ti K0.50.464.10.8
Cr K1.61.250.72.0
Fe K9.26.516.18.4
Ni K20.213.614.011.2
Nb L4.11.718.15.7
Mo L26.010.78.335.0
Disclaimer/Publisher’s Note: The statements, opinions and data contained in all publications are solely those of the individual author(s) and contributor(s) and not of MDPI and/or the editor(s). MDPI and/or the editor(s) disclaim responsibility for any injury to people or property resulting from any ideas, methods, instructions or products referred to in the content.