1. Introduction
With the continuous growth of the social economy, the modern high-speed railway develops rapidly. The high-speed Electric Multiple Unit (EMU), as the core equipment of the high-speed railway, is a key technology to realize high-speed railway operation. The bogie frame, as the most critical load-bearing structure in the running gear of a high-speed EMU, bears and transmits various loads from the car body, wheelsets, and its own installation components. Its service performance is crucial for the operational safety of a high-speed EMU.
A higher operating speed is one of the primary directions for the future development of high-speed railway technology. At the current stage, the loads recommended in the current international standards (EN 13749 [
1], UIC 615-4 [
2], JIS E 4207 [
3], etc.) are generally adopted for the structural design and reliability assessment of the bogie frame. It is worth noting that the current international standards do not provide a clear definition of the operating speeds of high-speed EMUs. With the increasing operation speed of high-speed EMUs, especially when the design and operational speeds exceed 400 km/h, the applicability of current international standards is uncertain. The load spectrum is the basis for structural reliability design and fatigue evaluation. It is very necessary to establish the load spectrum of the higher-speed EMU bogie frame based on the measured service load.
The study of the load characteristics is an important basis for establishing the load spectrum. Ren et al. [
4] put forward the method of decoupling and dimensionality reduction to identify multiple loads on the high-speed EMU bogie frame with a maximum test speed of 368 km/h. They obtained the load–time histories under different operating conditions, analyzed the time-domain and frequency-domain characteristics of multiple loads, established the relationship between the peak load of the axle spring and operating speeds, and obtained the load spectra for different speed levels. Yang et al. [
5] conducted on-track tests of the traction rod load of a high-speed EMU bogie frame through traction rod sensors, studied the variation characteristics of the traction rod load under typical operating conditions, and comparatively analyzed the fatigue damage caused to the bogie frame by traction rod loads under different speed levels. Xing et al. [
6] focused on the SKMB-200 bogie of the CRH380A EMU and calculated four simulated operating condition loads and one abnormal load based on the UIC 615-4 standard, and they optimized the bogie frame parameters through load characteristic research. Ji et al. [
7] comparatively analyzed the time-domain and frequency-domain characteristics of the torsional loads of two types of bogie frames of high-speed EMUs under six typical operating conditions, and they studied the distribution characteristics of the torsional loads between different stations through four characteristic parameters. Tao et al. [
8] obtained the load characteristics of the axle spring load and primary vertical damper through on-track testing, established the fatigue damage calculation formula based on the equivalent load, determined the amplitude and phase relationship of equivalent loads of the axle spring and primary vertical damper, and finally developed a bogie test method based on the measured loads. At present, the research on the load characteristics of the bogie frame have focused on high-speed EMUs with operating speeds below 400 km/h, and there are no research studies on the measured load characteristics of the bogie frame for EMUs operating at even higher speeds.
The load spectrum serves as the foundation for structural reliability design and fatigue evaluation. In the field of load spectrum research for the bogie structures of railway vehicles, Zhu et al. [
9] established the load spectrum for high-speed EMU bogie structures based on actual measurements from the Beijing–Shanghai line (1318 km), calibrated the load spectrum based on the damage consistency criteria and compared it with current international standards. Kassner et al. [
10] obtained the vertical load spectrum for light rail vehicle bogie structures under specified operating conditions through multibody dynamics simulation and compared the fatigue assessment results with current international standards. Wang et al. [
11] established the damage consistency load spectrum for bogie structures based on long-term track testing and improved the fatigue reliability of the bogie structures. Zhang et al. [
12] established a damage consistency load spectrum based on the measured load data of high-speed EMU bogie structures on the Beijing–Tianjin line (166 km) and revised the assessment standards for high-speed train bogie structures to reduce the potential safety risks. Ji et al. [
13] proposed a new calibration method to establish a damage consistency load spectrum for a high-speed EMU bogie frame and verified that it had a higher fatigue evaluation accuracy compared with the current international standards. Wang et al. [
14] proposed a vibration load spectrum establishment method based on the fatigue damage spectrum (FDS). Based on the vibration measured within a maintenance period of the bogie frame, the time domain method was used to obtain the unsteady vibration FDS, and the FDS was used to generate the vibration load spectrum of the bogie frame in the frequency domain. Xiu et al. [
15] established a dynamic model of a rigid–flexible coupling rail vehicle under the action of longitudinal force, established the road environment percentage (REP) load spectrum of the bogie frame according to the actual operational data of train, and predicted the fatigue life of the bogie frame of locomotive. At the current stage, the method for establishing the load spectrum of the bogie frame at the speed level of 400 km/h and above is not found in the relevant research.
The key steps in fitting and extrapolating the load spectra to establish a full life-cycle load spectrum have been studied. Ma et al. [
16] proposed a fatigue life assessment method based on kernel density estimation (KDE) for extrapolating multiple-sample load spectra. Chen et al. [
17] adopted the KDE method to fit the measured loads of CR400BF high-speed EMU bogie structures under typical operating conditions and proposed a method for establishing the bogie structure standardized load spectra applicable to different line conditions. Xiu et al. [
18] obtained the load spectrum for bogie structures by a diffusion kernel density estimation (DKDE) method and extrapolated the load spectrum by using Gaussian kernel density estimation (GKDE) and parameter estimation to obtain a load spectrum close to the actual operational condition. Li et al. [
19] verified the fatigue strength of the subway bogie frame based on the load spectrum specified in the national standard, the load spectrum obtained from multibody dynamics simulation, and the stress spectra from a dynamic stress track test. The results indicated that, compared to the field test, the fatigue strength verification results based on the standard load spectrum were conservative. In the above load spectrum fitting and extrapolation studies, there is no extrapolation method with speed as a variable. Therefore, the load spectrum of the bogie frame with a higher speed level cannot be obtained based on the existing studies.
This paper focuses on the bogie structure of the CR400AF high-speed EMU. Based on the measured data from long-term track tests on the Beijing–Shanghai high-speed railway, the experimental data were processed and analyzed. By examining the variation pattern of loads with the vehicle’s operating speed, discrete load spectra for the bogie structure were compiled. The load spectra were fitted using a three-parameter Weibull distribution and extrapolated to derive discrete load spectra for the bogie structure under different operating conditions, specifically at a speed level of 450 km/h. This provides a reference for assessing the bogie structures of trains operating at higher speeds, aiming to reduce the potential safety risks.
2. Materials and Methods
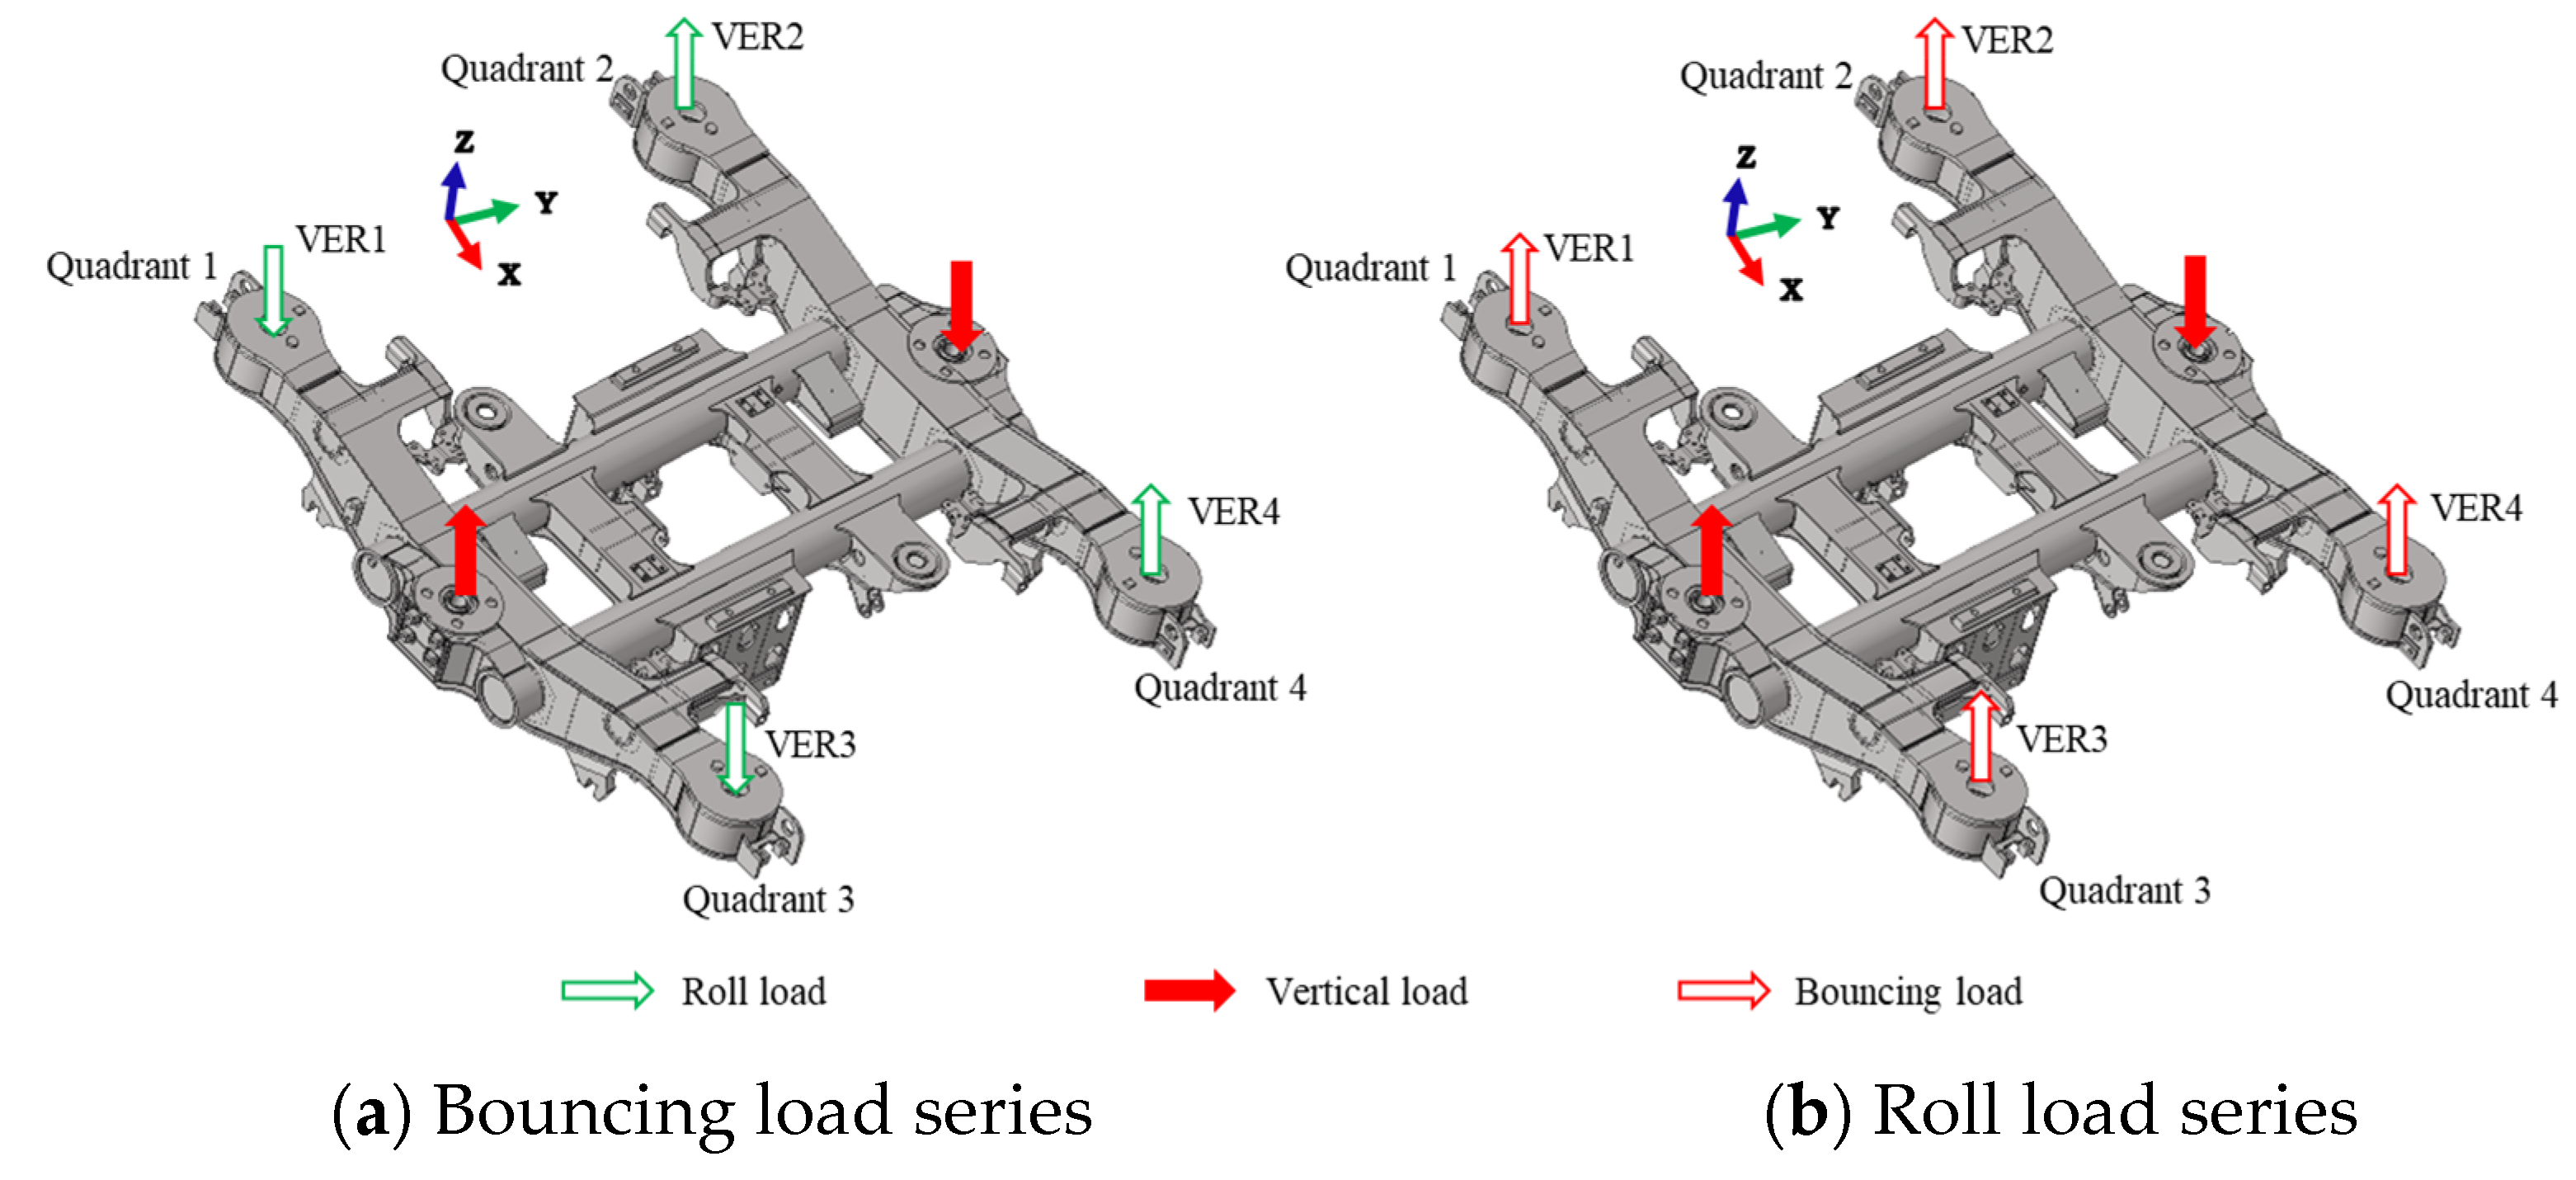
2.1. Bogie Frame Load Series
During the operations of a high-speed EMU, the loading state of the bogie frame is complex, and the bogie frame simultaneously bears and transmits a variety of loads from the car body, wheelset and its own installation components, among which there is a strong coupling relationship [
20]. Taking the power bogie frame with a more complicated loading state as an example, the loads acting on the bogie frame can be divided into 16 load series according to the vehicle motion characteristics, the actual bearing condition of the structure and the systematisms of the load identification of complex structures [
21], as shown in
Figure 1.
According to the effect of loads, the measured loads can be divided into the main load series and the local load series [
22].
The main loads can cause the overall structural stress response, vertical load (including the quasi-static part (the roll load) and dynamic part (the bouncing load)), twist load and transverse load.
The local load system can only have a local impact on the bogie frame, including the motor load (including the motor vertical load and motor transverse load), gearbox vertical load, traction rod load, brake load, anti-roll bar load and damper loads (including the primary vertical damper load, secondary transverse damper load and anti-yaw damper load).
During the operation of a high-speed EMU, the vertical load and transverse load have the most considerable influence on the overall strength of the bogie frame. Therefore, taking the vertical and transverse load of the bogie frame as examples, this paper introduces a method for establishing the load spectrum of the bogie frame of a higher speed EMU.
The car body mass is the main source of the vertical load, including the static load and dynamic load. In the process of dynamic train operation, the vertical load on both sides of the bogie frame changes dynamically due to the vertical motion of the car body. This paper focuses on the bouncing load Fb and rolling load Fr that cause fatigue damage to the bogie frame. As shown in
Figure 2, when the magnitude and direction of the vertical load changes on both sides of the bogie frame are the same, the bogie frame bears bouncing loads. If any of the above conditions are not met, the bogie frame will produce rolling motion, and the difference between the vertical loads on both sides is the rolling load. According to the load characteristics and action forms, the bouncing load Fb and rolling load Fr can be separated from the vertical load at each end by Equations (1) and (2) [
23].
where
FVERi (
i = 1, 2, 3, 4) is the vertical load at the
i-th end of the bogie frame.
In the process of train operation, especially through the curve or switch interval, there is a lateral relative movement between the car body and the bogie. The bogie bears the lateral force from the car body, which is balanced by the lateral force generated when the rail and the wheel are in contact with the positioning boom. Currently, the frame is subjected to transverse loads, the magnitude and direction of which depend on the actual line conditions and the wheel–rail action mode, which changes over time. The transverse loads FTR1_2 and FTR3_4 of the bogie frame from axes 1 and 2 are, respectively, given by Equations (3) and (4):
where
FTRVi (
i = 1, 2, 3, 4) is the transverse load at the
i-th end of the bogie frame.
2.2. Load Identification Method
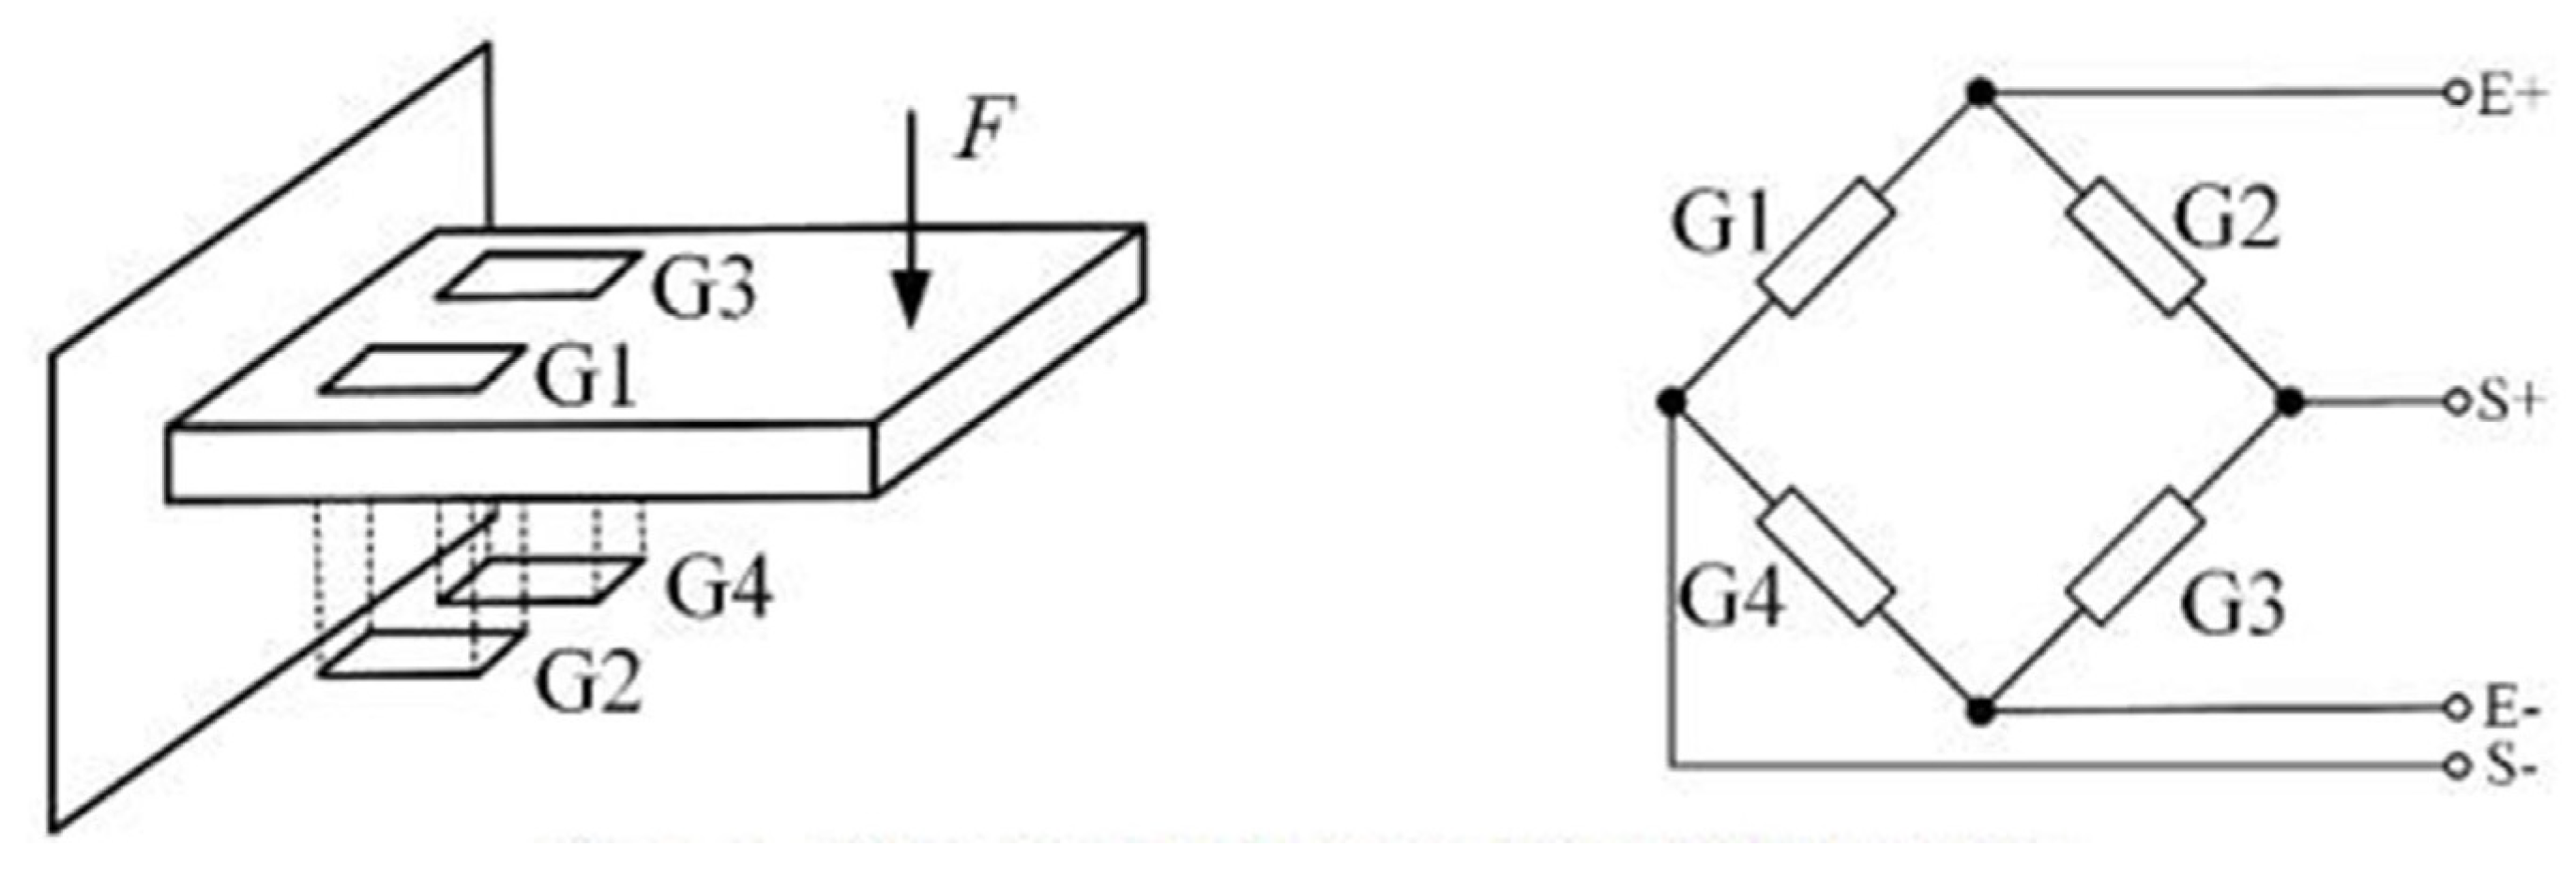
The bogie frame is a typical large structure with a multi-source load system and obvious low damping characteristics. The indirect identification of loads through the bogie frame response can easily diverge from the calculation result due to the ill-condition of the load–response transfer matrix. At the same time, the test cycle of the frame load line is long and the data volume is huge, so the dynamic load of the frame obtained by the inversion calculation is inefficient and it is difficult to ensure the identification accuracy. Therefore, the strain gauge is used to sensor the frame and its connecting parts, and the direct test method is used to identify the frame load.
Under the vertical load and transverse load, the frame structure displays bending deformation. As shown in
Figure 3, four strain gauges G1~G4 of the same specifications are symmetrically arranged on the two surfaces of the cantilever beam, corresponding to the resistance values
R1 =
R2 =
R3 =
R4, and strain gauge sensitivity coefficients are all
K0 to form a full-bridge circuit.
Under the external load, the bridge output voltage
e0 is
where Δ
Ri (
i = 1, 2, 3, 4) is the resistance increment of strain gauges G1~G4, respectively.
Eex is the bridge excite voltage.
Considering the relationship between the resistance value of the bridge in balance, ignoring the high-order trace, and only retaining the linear relationship between the bridge output voltage and the resistance change, Equation (8) can be arranged as
where
(
i = 1, 2, 3, 4) is the strain response of strain gauges G1~G4, respectively.
Under the bending load, the strain response symbols of the strain gauges on the two surfaces are the opposite, and it can be seen from Equation (6) that the bridge output voltage changes the most at this time. Under the action of the axial load, the strain response of strain gauges Gl~G4 cancel each other out, and the bridge can compensate for the axial load.
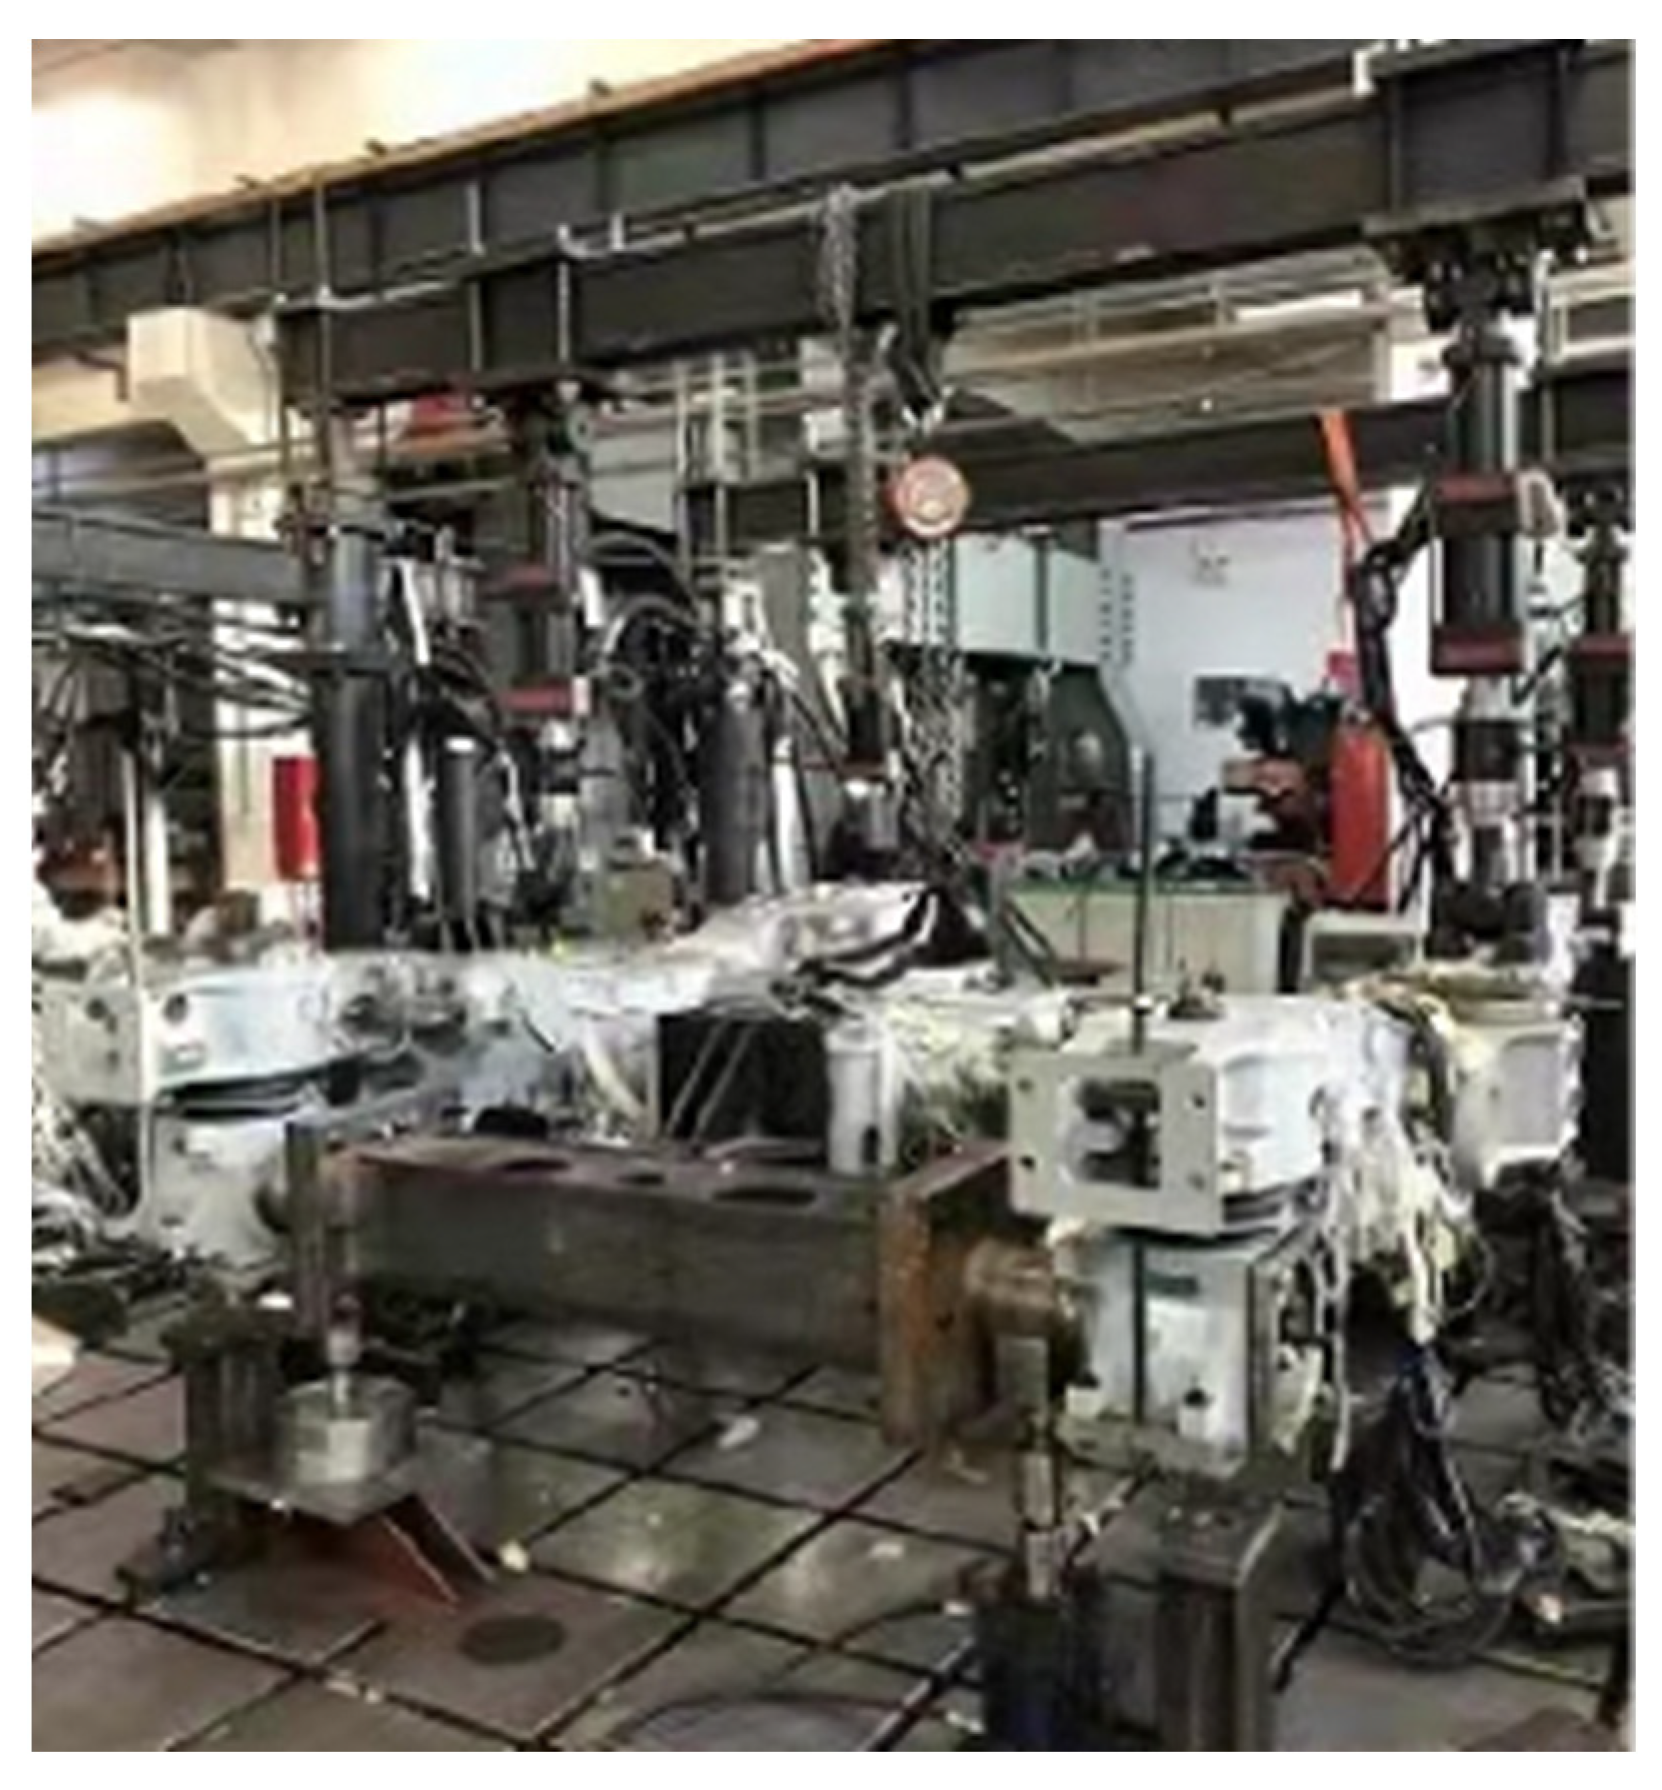
2.3. Static Calibration Test
The static calibration test has two purposes: (1) obtaining the correspondence between the load and bridge output and (2) obtaining the load–stress response transfer relationship between the load and the fatigue key parts of the bogie frame.
Figure 4 shows the bogie frame static calibration test site. By simulating the load state of the bogie frame in service, the corresponding relationship between the load and the bridge output for the load identification is obtained, that is, the load channel coefficient. At the same time, according to the action mode and position of each load series on the bogie frame, the load–stress response relationship between a single load series and all the fatigue key parts was also obtained on the hydraulic test bench, which is the key basis for the fatigue evaluation of the bogie frame based on the measured load. The detailed static calibration of the bogie frame can be found in [
24].
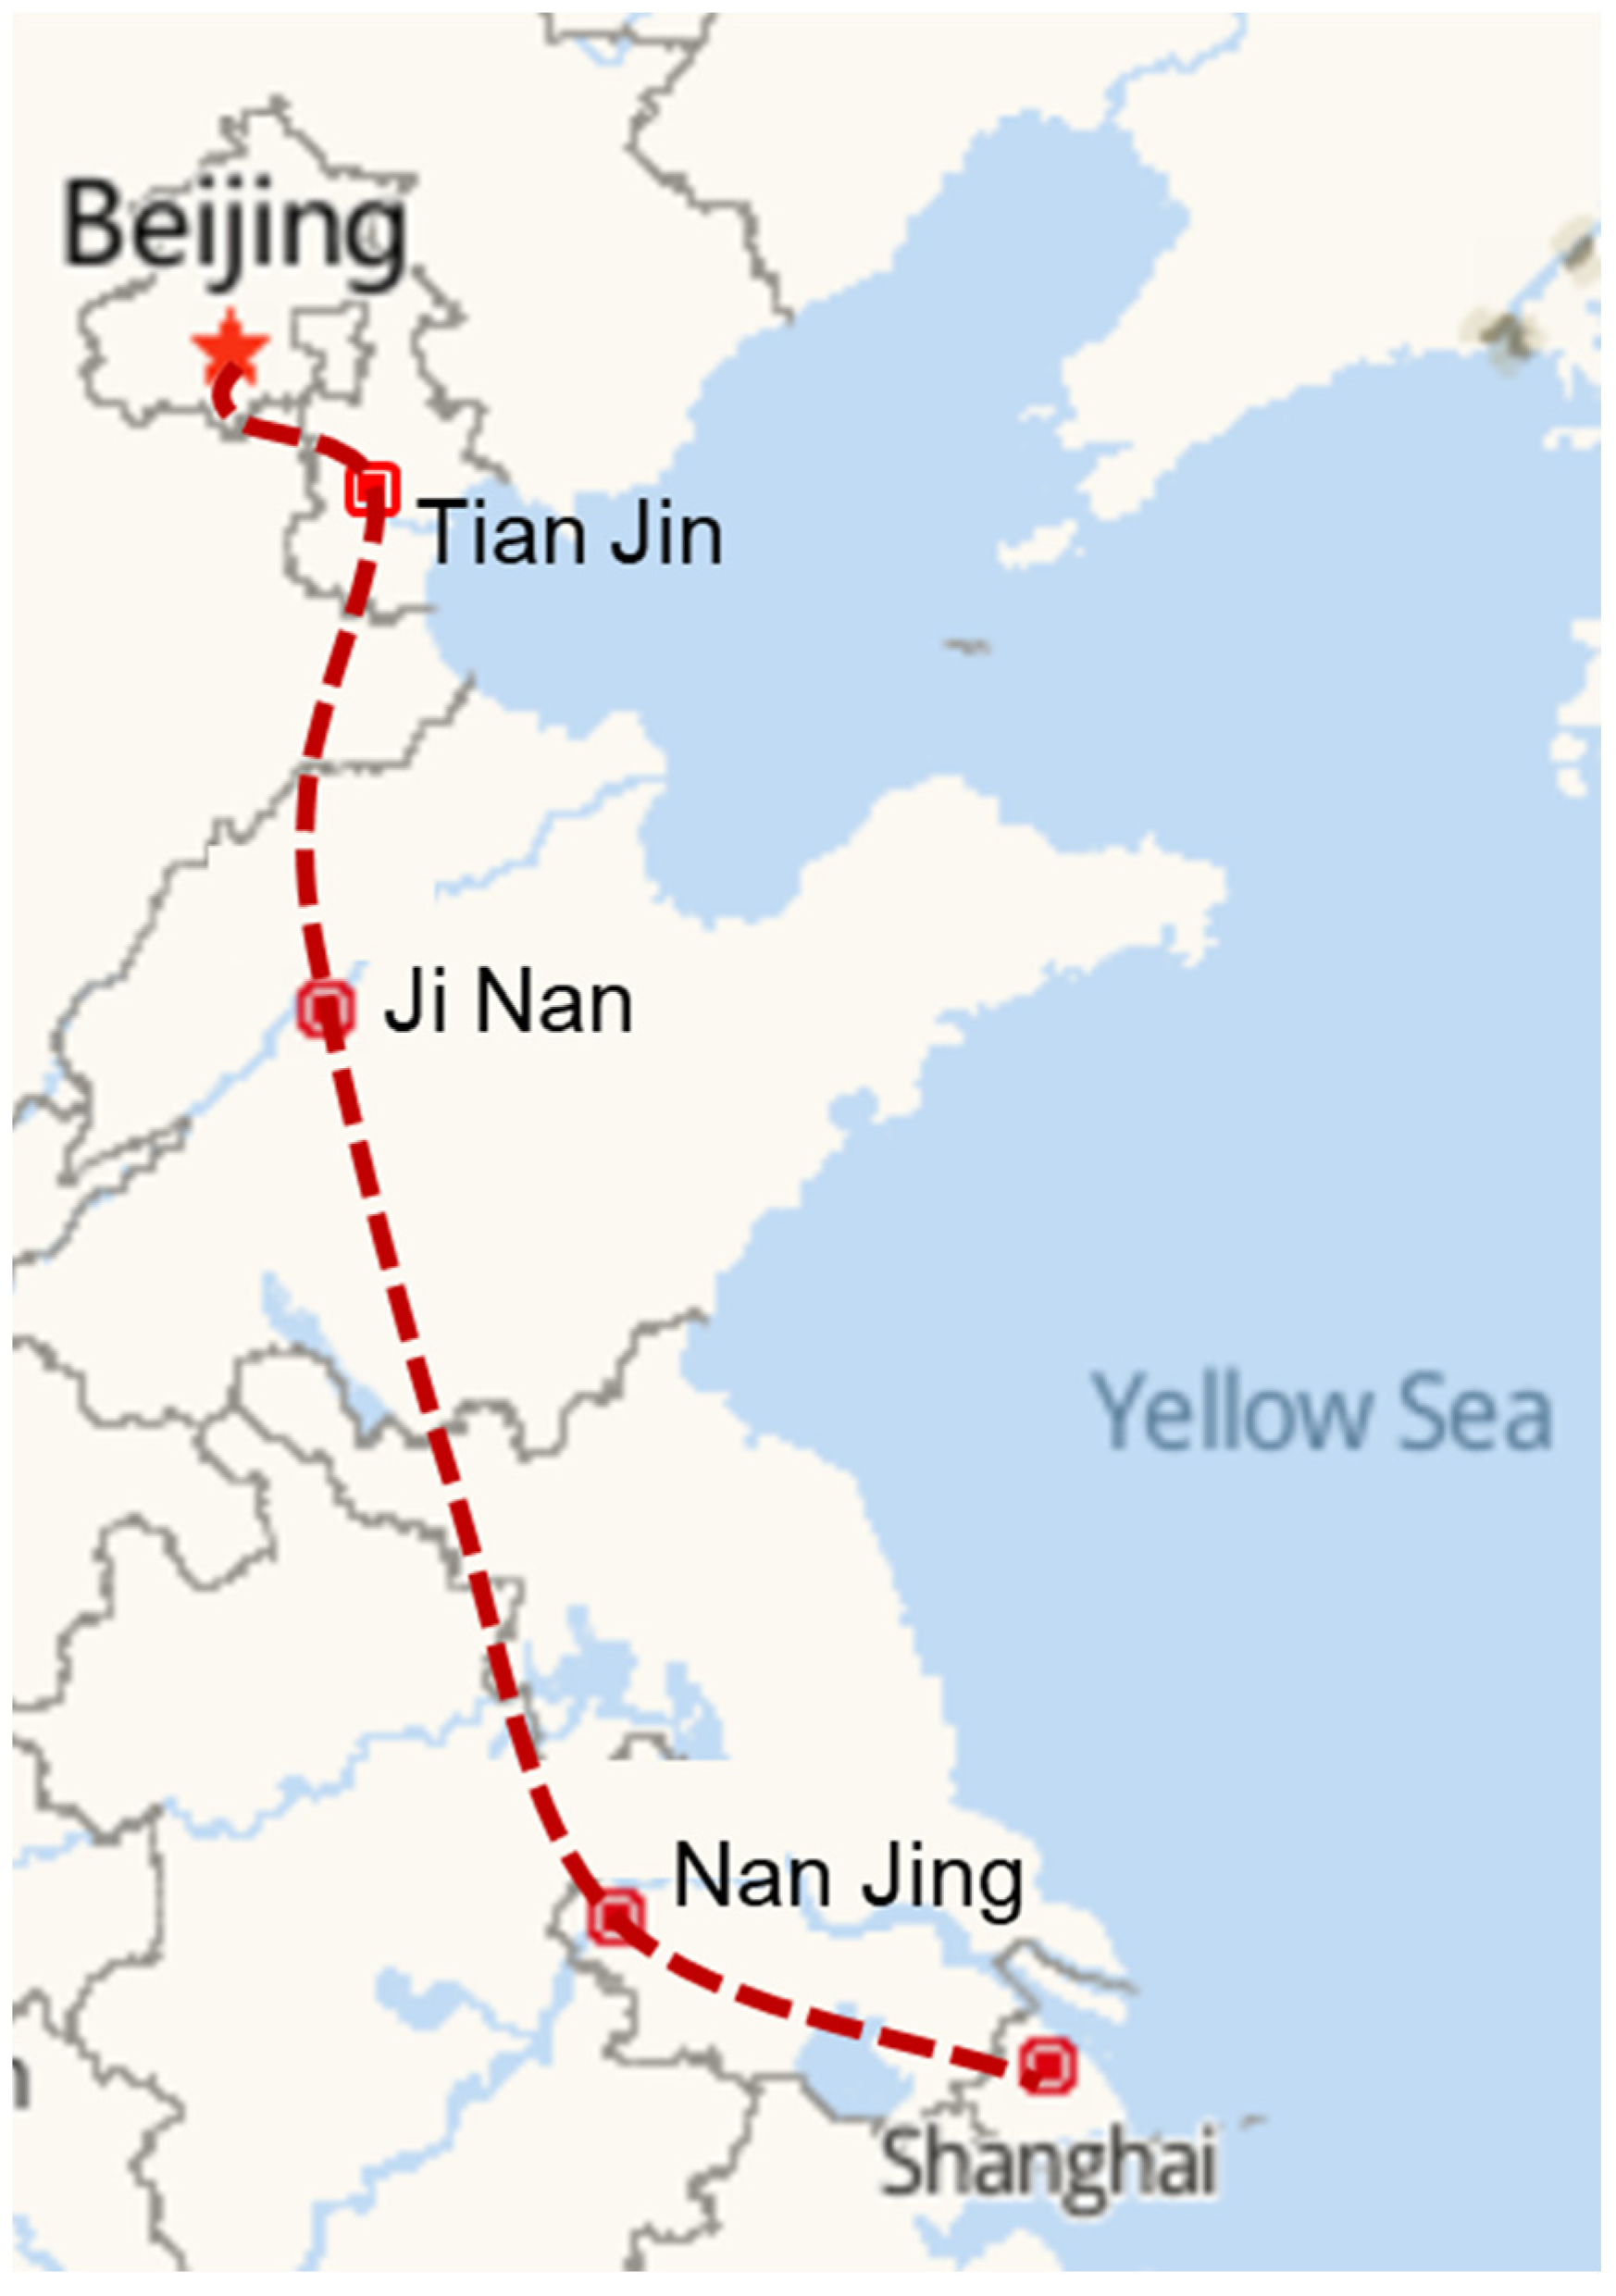
2.4. Track Test
After the static calibration, the load measuring frame was installed on the CR400AF high-speed EMU for line testing. The test route was the Beijing–Shanghai high-speed railway, as shown in
Figure 5. The test speed was 200 km/h, 250 km/h, 300 km/h, 350 km/h and 400 km/h. To identify various typical operating conditions of the high-speed EMU, not only the strain response of the bogie frame identification point but also the running state information of the vehicles, including the GPS signal and gyroscope signal, were collected at the track test. The GPS signal contains the vehicle running speed and position information, and the gyro signal is used to determine the vehicle motion attitude. The SoMat eDAQ data acquisition system was used to realize the synchronous and uninterrupted acquisition of the GPS signal, gyroscope signal and strain signal, and the sampling frequency was 50 Hz, 50 Hz and 2 kHz, respectively. During the track test, all the data of the test train were collected completely, covering the typical operating conditions, such as a straight line, curve, acceleration, deceleration, etc., to ensure the integrity of the test data.
3. Load Characteristics and Load Spectrum
3.1. Time-Domain Characteristics of Typical Loads
3.1.1. Vertical Load
The measured data are used for data analysis after a series of pre-processing processes [
25].
Figure 6 shows the speed, shaking angular velocity, bouncing load, and rolling load between the two stations with a speed class of 300 km/h. Among them, the shaking angular velocity is used to reflect the line condition. When the vehicle runs in a straight line, the shaking angular velocity signal fluctuates near the zero line. When the vehicle passes through the curve, the amplitude of the shaking angular velocity signal increases, and its value and duration are related to the radius and length of the curve, respectively. The positive value represents the fact that the vehicle body deflects to the right side of the traveling direction, and vice versa.
By combining the speed and shaking angle velocity signals in
Figure 6, the train is in an acceleration condition within 0–450 s and the overall amplitude of the bouncing load is positively correlated with the speed. Near 100 s and 1350 s, the shaking angle velocity signal fluctuates in the positive and negative directions for a short time, indicating that the train is passing through the switch section. The roll load changes significantly when passing through switches and small radius curves around 100 s and 300 s, respectively, and obvious trend items appear in the curve section. Within 450 s–1100 s, the train is operating in constant speed operation on a straight line or curved line, the overall amplitude of the bouncing load and rolling load is stable, and the rolling load has a trend item of a small value in the curve section. The time-domain characteristics of the bouncing load and rolling load are similar to those of the accelerating condition. The maximum and minimum values of the rolling load appear in the small curve section, which are 10.0 kN and −8.0 kN, respectively. It can be seen that the load characteristics of the bogie frame are closely related to the train operating conditions.
3.1.2. Transverse Load
Figure 7 shows the speed, shaking angular velocity and transverse load–time history between the above two stations. Under the acceleration and deceleration conditions, the transverse load in the switch area (around 100 s and 1350 s) changes significantly, with the maximum and minimum values of 17.0 kN and −12.6 kN, respectively. Under the condition of constant speed, the overall amplitude of the transverse load is small, and the trend term appears in the curve section.
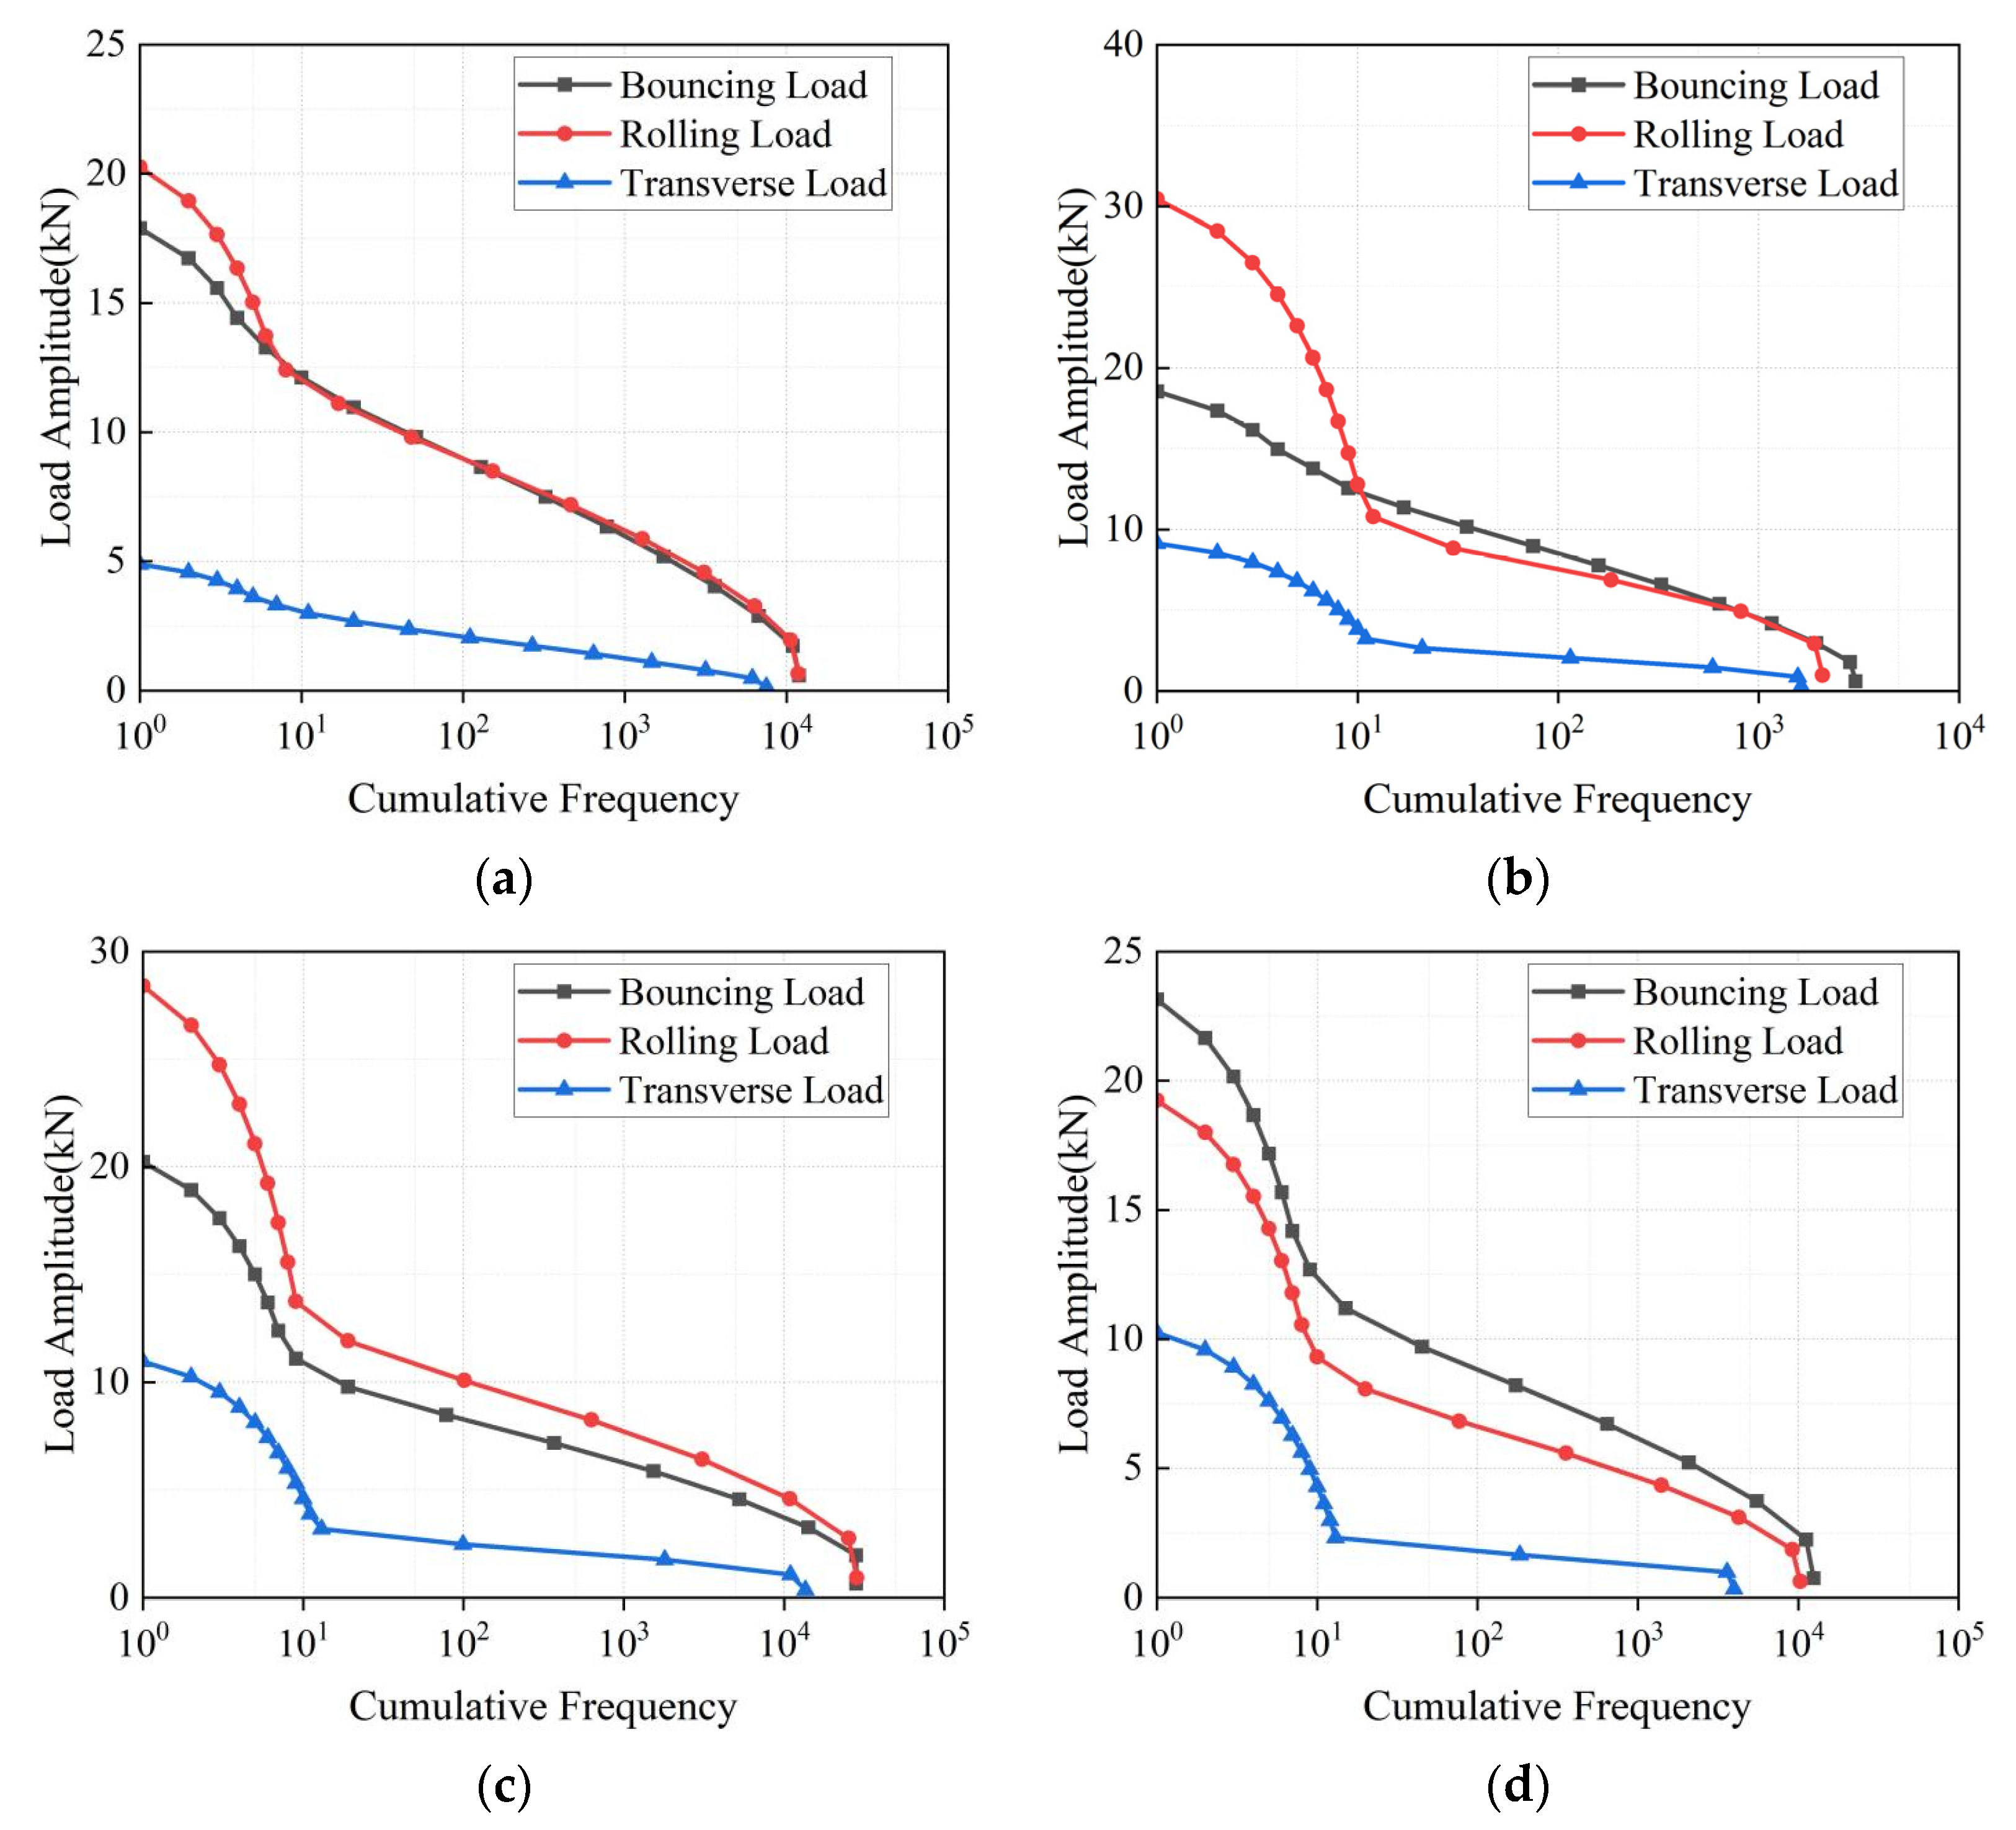
3.2. Load Spectrum Compilation
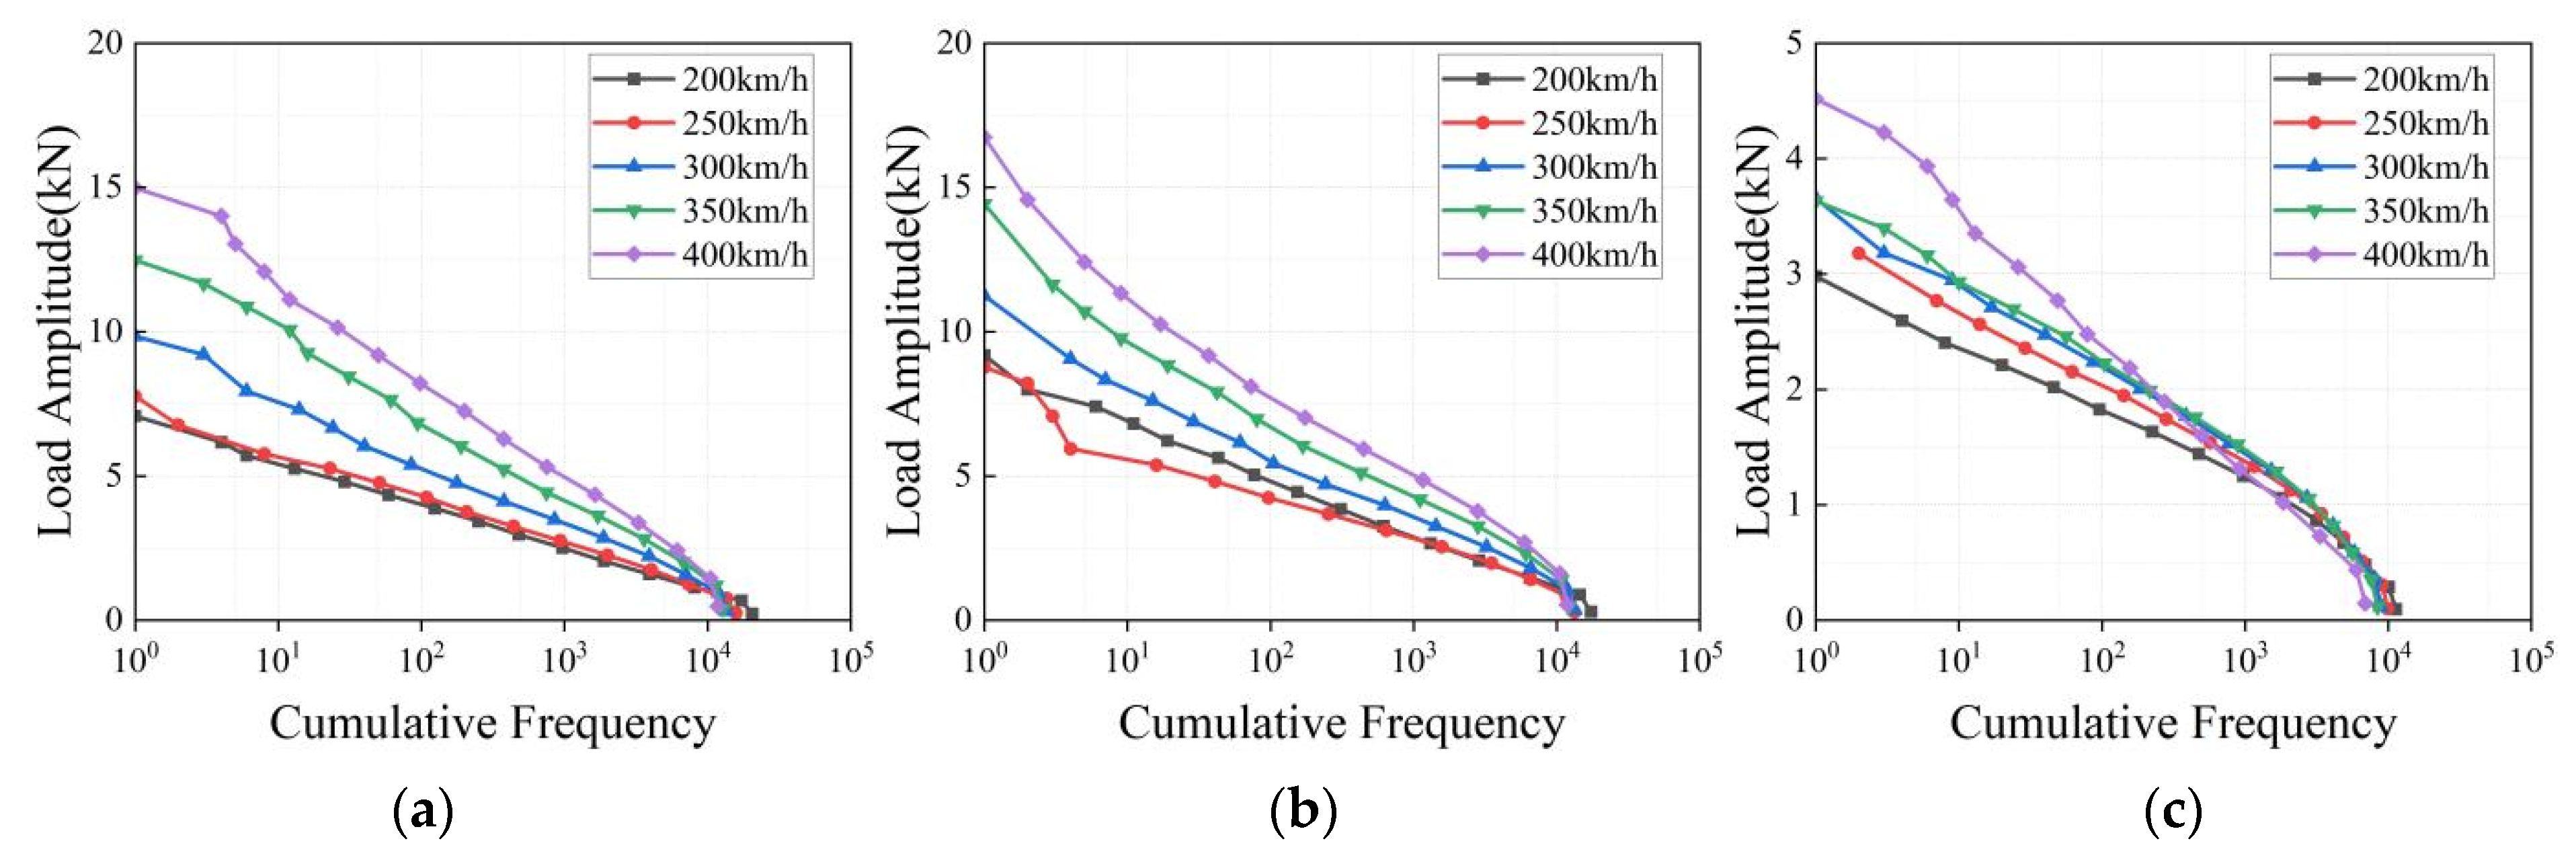
The load–time history of the high-speed EMU passing through the same straight road section at a constant speed under five typical speed stages was selected to compile the load spectrum, as shown in
Figure 8.
For the bouncing load spectrum and roll load spectrum, the larger the velocity stage in the low cumulative frequency range, the larger the load amplitude. For the transverse load, the load amplitude is the smallest at 200 km/h, the same at 300 km/h and 350 km/h, and the largest at 400 km/h.
The load–time history of the high-speed EMU passing through the same curve section at a constant speed under five typical speed stages was selected to compile the load spectrum, as shown in
Figure 9.
Under the curve conditions, the variation relationship between the cumulative frequency of the bouncing loads and the load amplitude is the same as that under linear conditions. In the low cumulative frequency range, the load amplitude of the rolling load at 200 km/h is larger than that at 250 km/h and 300 km/h, and with the increase in the load amplitude, the larger the speed level, the larger the load amplitude. For the transverse load, the law between the velocity and the load amplitude is not obvious in the low cumulative frequency range. With the increase in the cumulative frequency, the transverse load amplitude shows a trend of increasing with the velocity level.
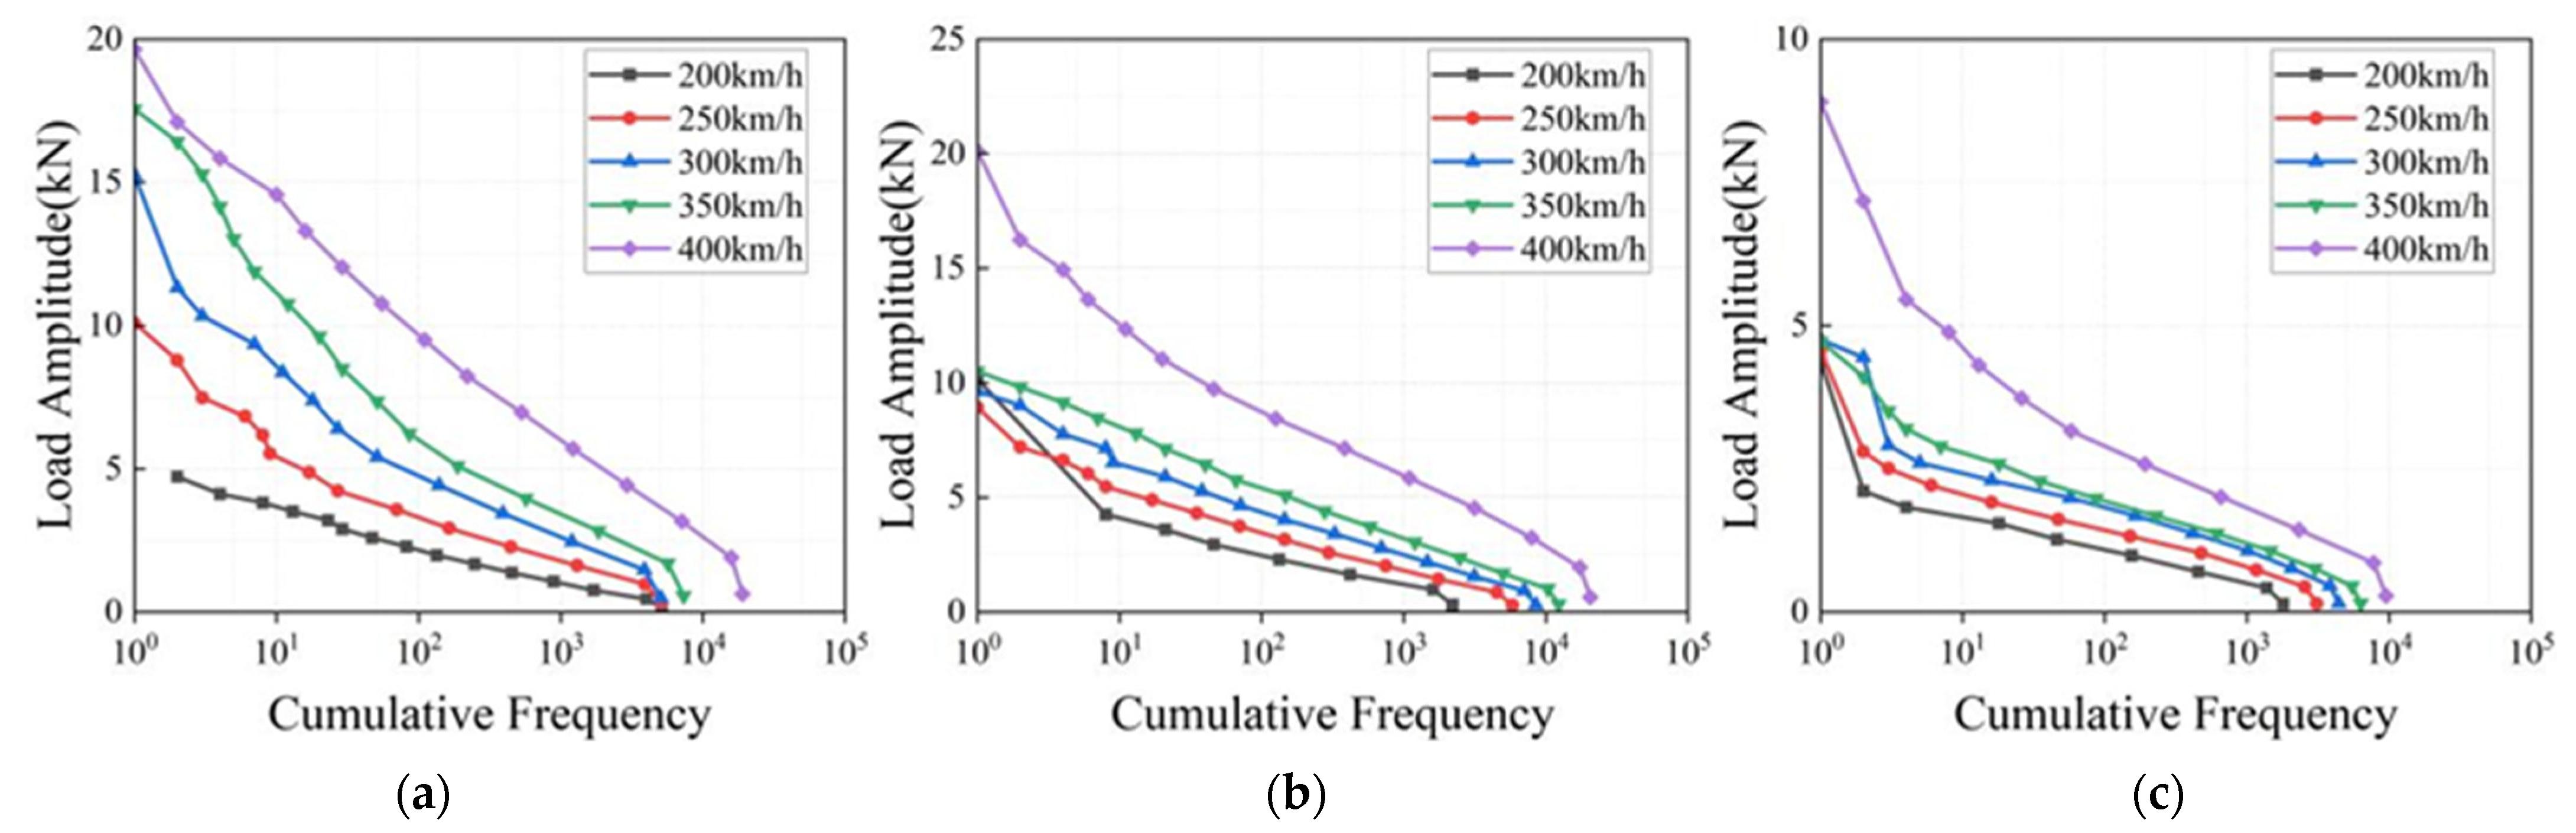
The load–time history of the high-speed EMU under five typical speed stages was selected to compile the load spectrum, as shown in
Figure 10.
Under accelerating conditions, the variation relationship between the cumulative frequency of the bouncing loads and the amplitude of the loads is the same as that under linear conditions. For the transverse load and roll load, in the low cumulative frequency range, the load amplitude at 400 km/h speed level is much higher than that at the other speed levels, indicating that a high speed has a profound influence on the amplitude of the roll load and transverse load under accelerating conditions.
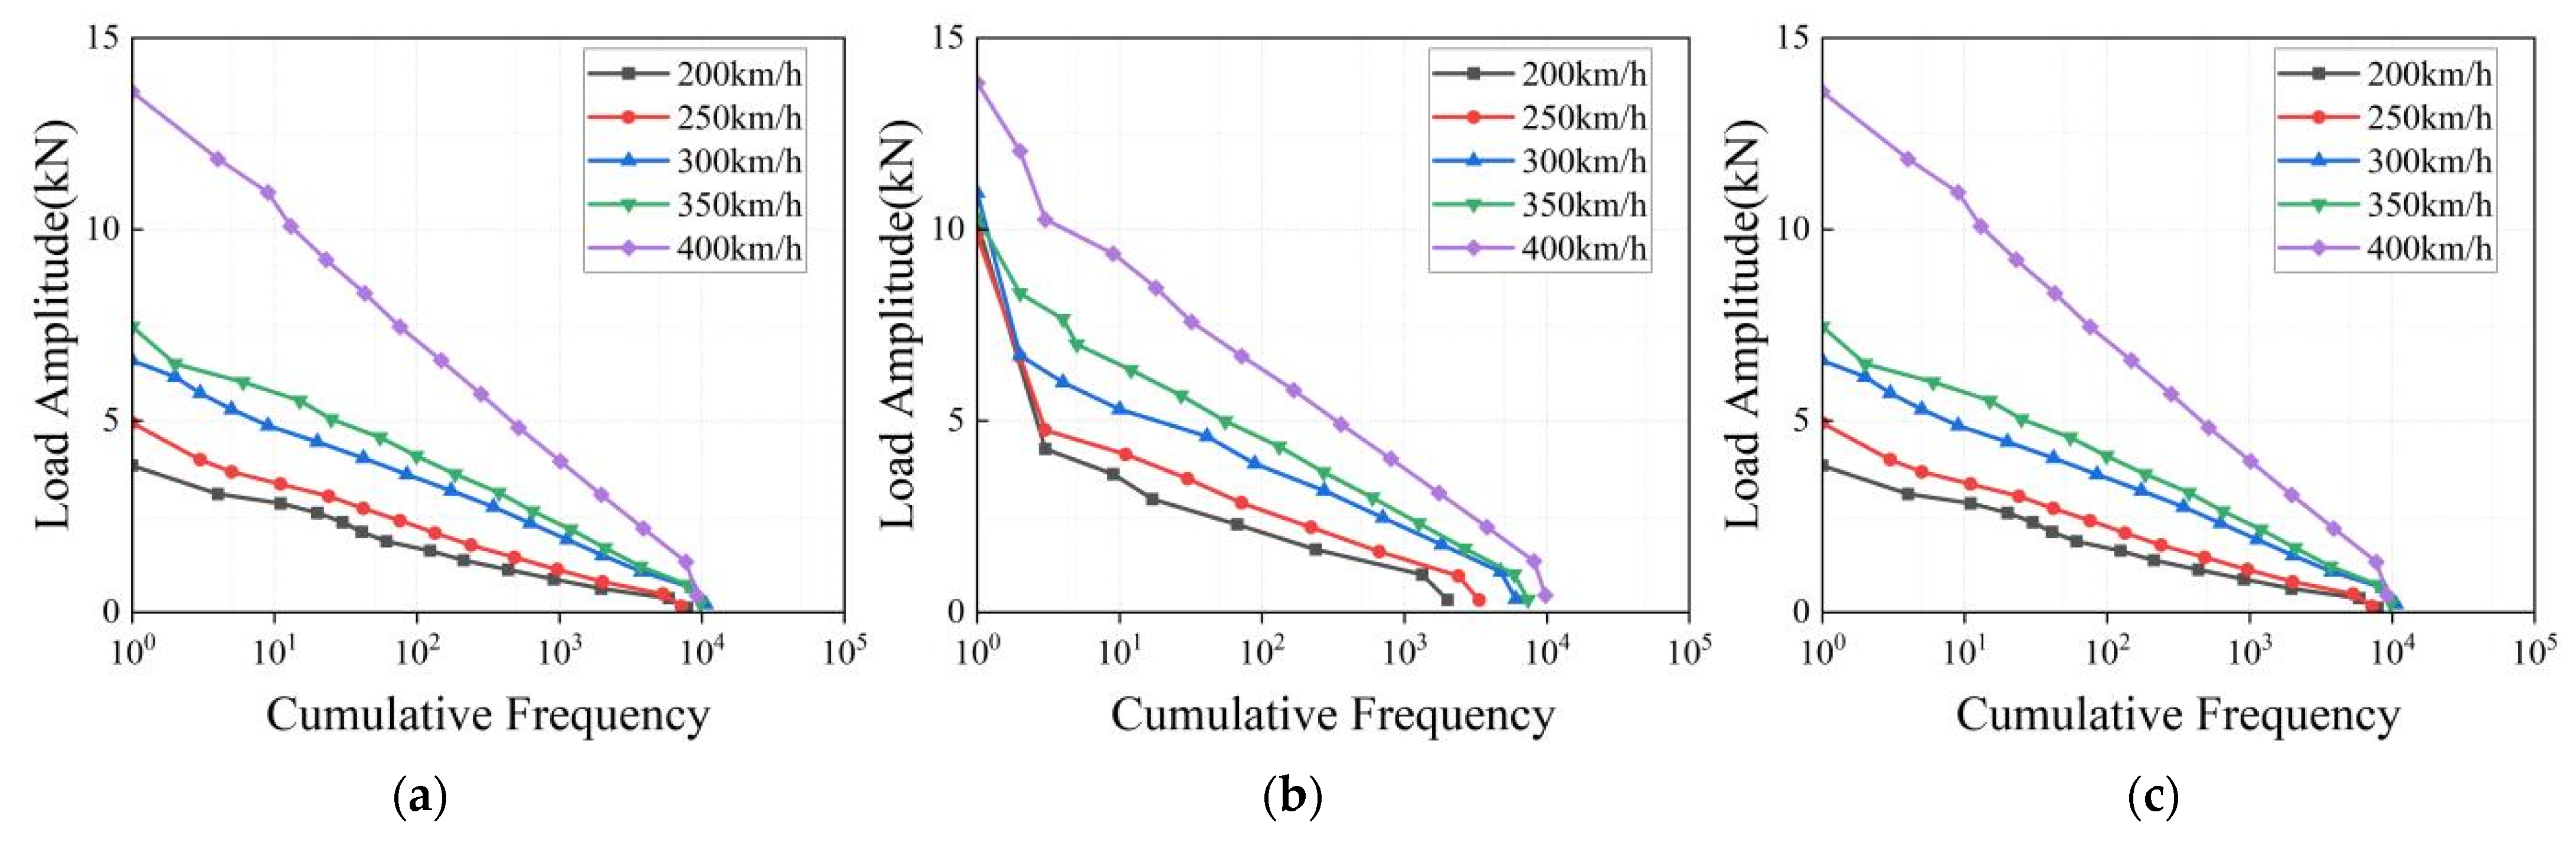
The load–time history of the frame under five typical speed stage deceleration conditions of the high-speed EMU was selected to compile the load spectrum, as shown in
Figure 11.
Under deceleration conditions, for the three loads, in the low cumulative frequency range, the load amplitude at the 400 km/h speed stage is much higher than that at the other speed stages, indicating that the high-speed stage has a great impact on the three load amplitudes under deceleration conditions.
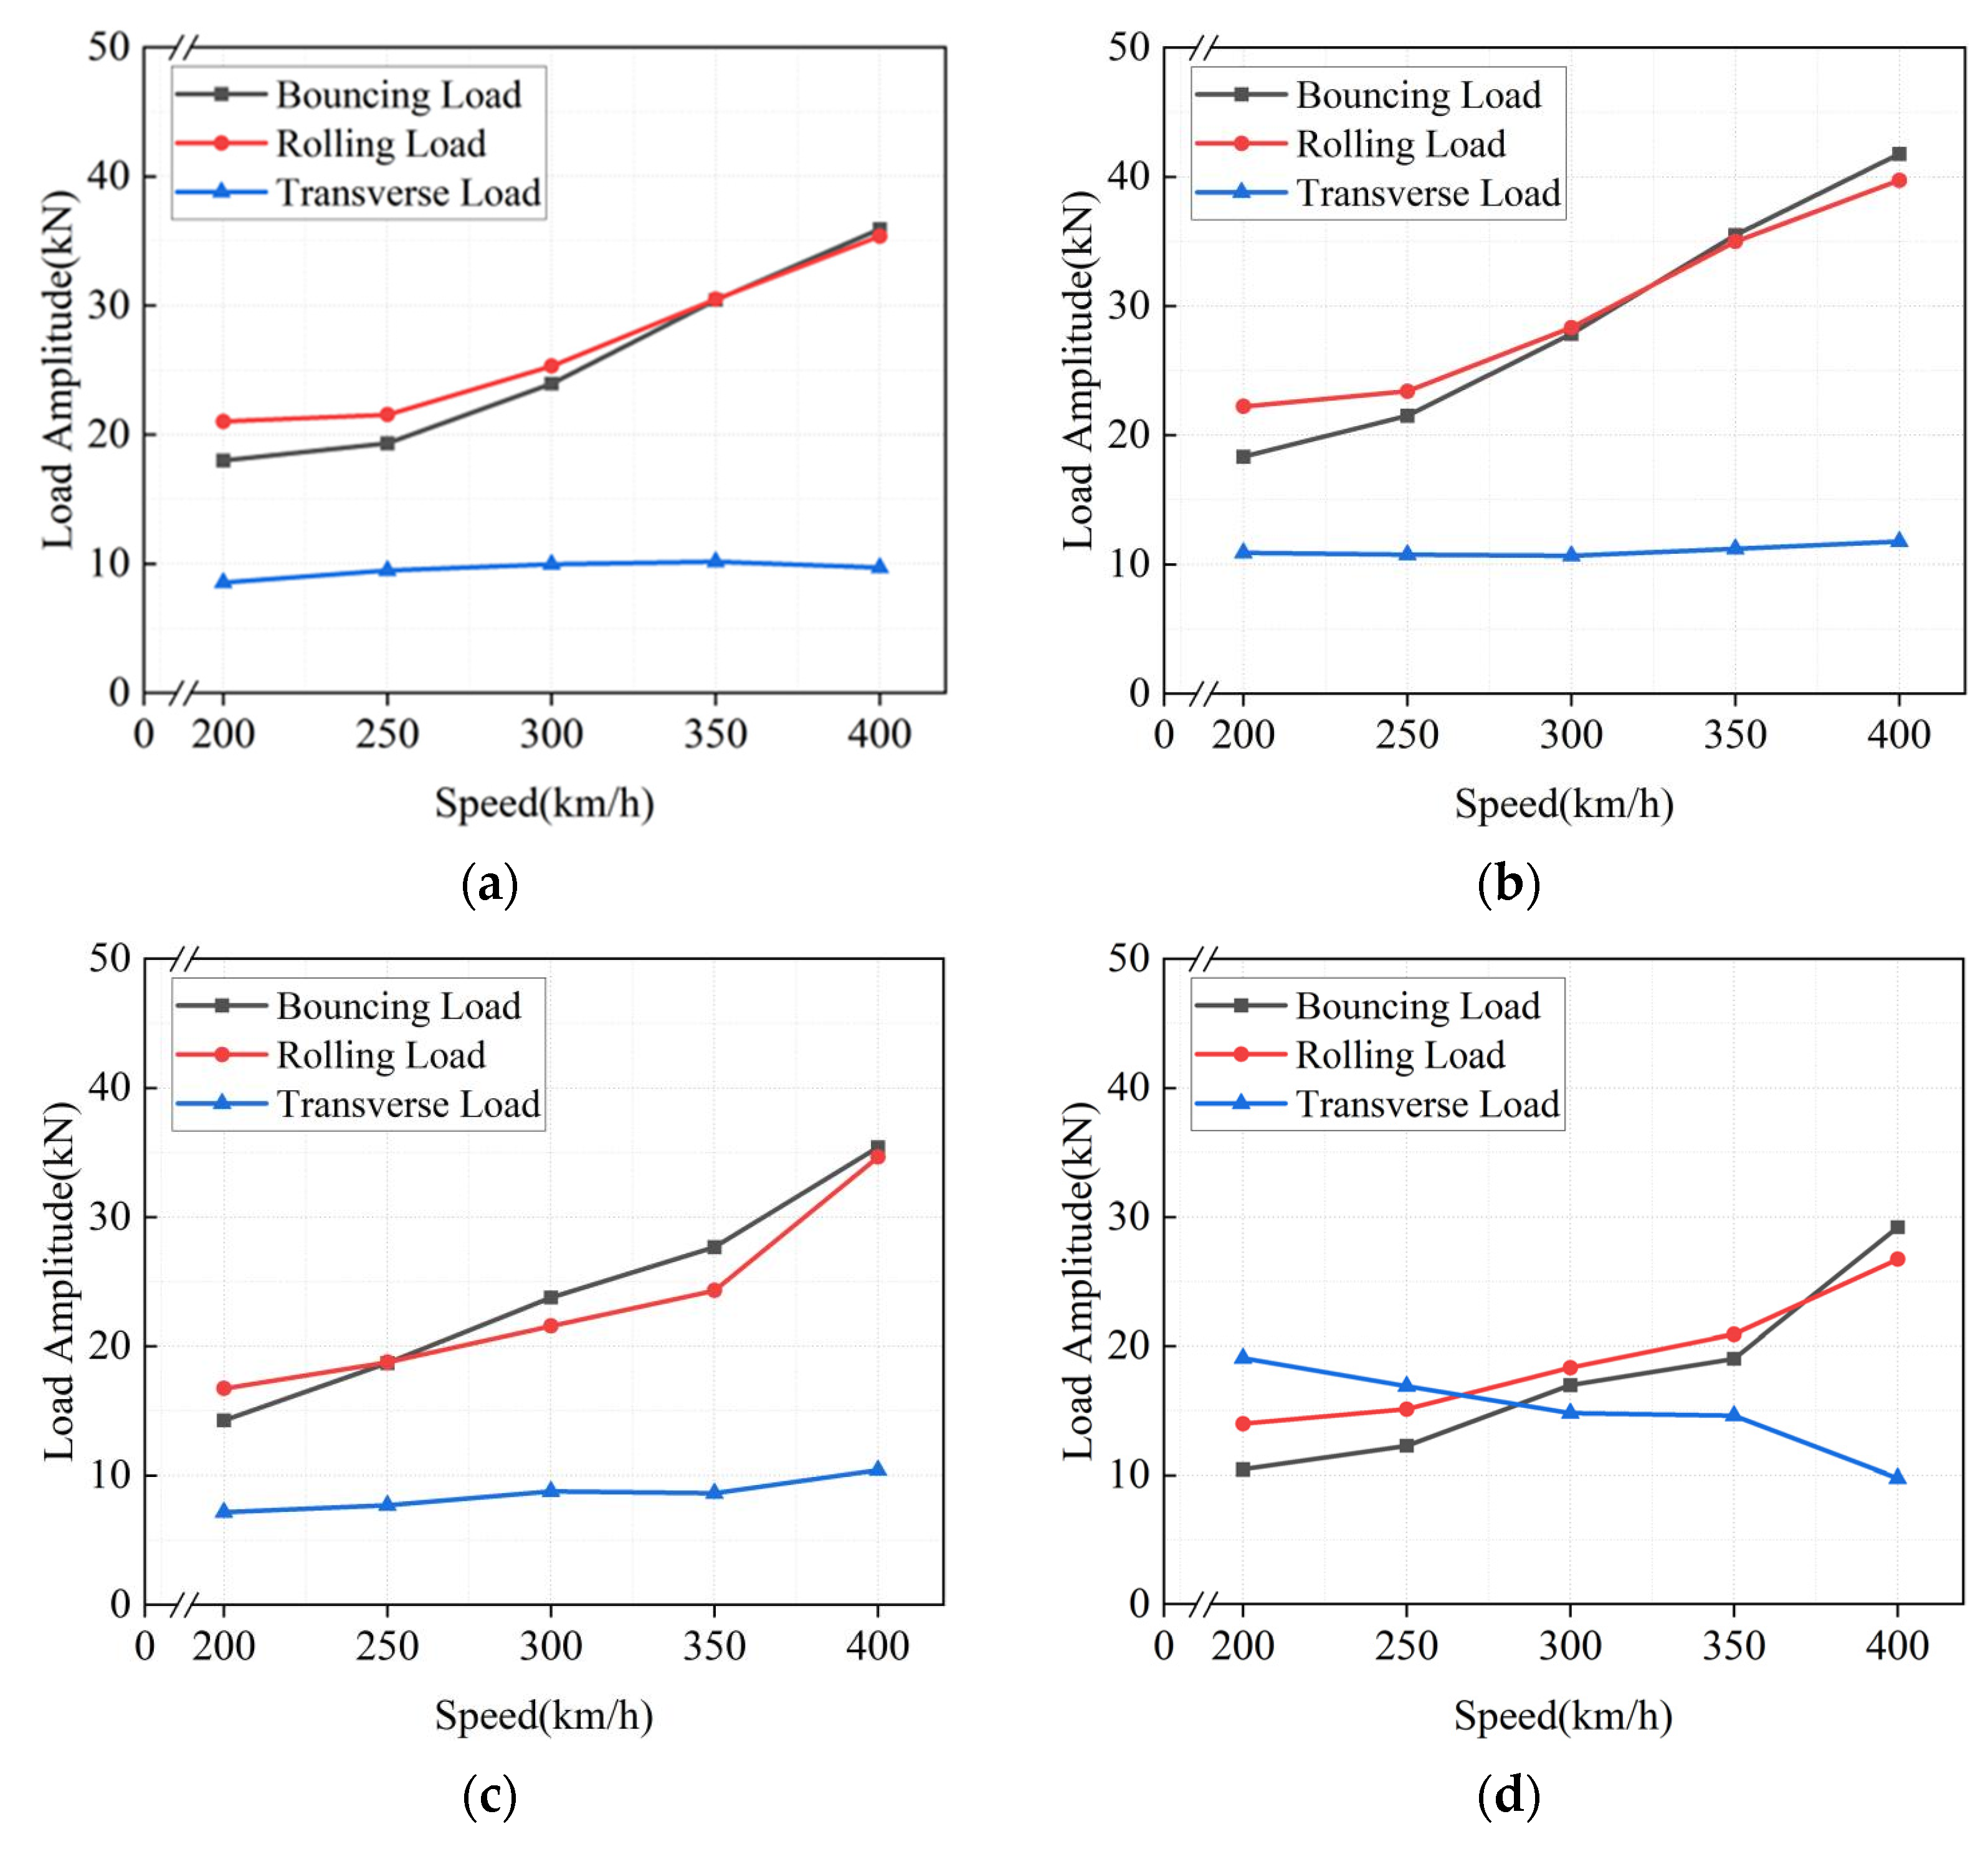
3.3. Equivalent Load Amplitude
To intuitively observe the effect of the operating speed on the bogie frame load, the random load–time history is equivalent to a constant amplitude load according to the principle of damage equivalence, that is, the equivalent load amplitude [
26].
According to Miner’s linear cumulative damage rule [
27], the damage caused by the measured load on a certain fatigue key part of the bogie frame within a certain operational mileage is shown in Equation (7).
where
n is the load spectrum series,
ni is the number of cycles corresponding to the
i-th class load–stress amplitude of the load–stress spectrum,
is the load–stress response transfer coefficient between the load and the fatigue key part of the bogie frame,
σ-1ai is the
i-th class stress amplitude of the stress spectrum,
F-1ai is the
i-th class load amplitude of the load spectrum,
Ni is the number of cycles to failure at
σ-1ai,
m and
C are the parameters of the S-N curve.
Assuming that the equivalent constant amplitude load
Faeq acts for
N cycles, the damage to the structure is shown in Equation (8).
where
N is the number of cycles corresponding to the fatigue limit of the material or welded joint. For welded joints, it is generally taken as 2 × 10
6.
The test mileage of the train is known as
L1, and the damage caused by the measured load spectrum at the fatigue key part of the bogie frame is
D1. Assuming that the corresponding damage of the operating mileage
L in the whole life cycle is
D, the design life of the high-speed EMU is 30 years, and the average annual operation is 5 × 10
5 km, so the
L = 1.5 × 10
7 km. Based on the assumption that the damage is equal within the unit mileage, then
By combining Equations (7) and (8), the
Faeq can be obtained by Equation (10)
Figure 12 shows the equivalent load amplitudes of the bogie frame loads under different operating conditions for five typical speed classes. It can be seen that the equivalent load amplitudes of the bouncing load and rolling load increase significantly with the increase in the speed classes under four operation conditions, and the equivalent load amplitude of the transverse load changes are relatively small except for the deceleration condition.


