Article

Influence of Runner Downstream Structure on the Flow Field in the Runner of Small-Sized Water Turbine

1
Research Center of Fluid Machinery Engineering and Technology, Jiangsu University, Zhenjiang 212013, China
2
School of Intelligent Manufacturing, Luoyang Institute of Science and Technology, Luoyang 471023, China
*
Author to whom correspondence should be addressed.
Machines 2024, 12(6), 392; https://doi.org/10.3390/machines12060392
Submission received: 27 April 2024 / Revised: 28 May 2024 / Accepted: 5 June 2024 / Published: 7 June 2024
(This article belongs to the Section Turbomachinery)

Abstract

:
Unstable flows in the runner of water turbines, such as reverse flow, vorticity and flow direction transition, are the main factors causing increased losses and decreased efficiency, and changing the geometry structure in the downstream of the runner is an important means of mitigating these instabilities. The different flow fields downstream of runners induced by different locking nut structures are numerically calculated and verified by experimental results. The flow states are evaluated in terms of characteristic quantities such as pressure gradient, swirling flow, reverse flow, and vorticity. The results show a non-negligible effect of the locking nut, which leads to a more uniform pressure distribution, increases the descending speed of the reverse flow rate, and reduces the volume and strength of the vortex. The small locking nut significantly weakens the pressure gradient, reduces the top reverse flow zone, and decreases the vortex volume at the blade flow passage outlet and the size of the downstream disturbance vortex. The extended lock nut reduces the growth rate of the vortex generation rate and the size of the partial vortex, but increases the range of the high-pressure zone, causing the bottom reverse flow and increasing the vortex.

1. Introduction

As a power machine driven by clean energy, a hydraulic turbine uses water pressure to drive the rotation of the runner and converts the pressure energy of water into mechanical energy or electric energy of the hydraulic turbine. As a driving element, it is widely used in electric power, agriculture, the ocean and other fields. The efficient and safe utilization of water energy puts forward stricter requirements for the stable operation of hydraulic turbines [1,2]. The unstable operation of a turbine is largely due to the hydrodynamic instability downstream of the turbine runner blade, including the unstable flow near the runner cone and in the draft tube [3]. Due to the rotation of the runner, the blade outlet has a velocity circulation, and there is a highly unstable turbulent vortex flow near the runner cone accompanied by a strong inverse pressure gradient. Due to the pressure change as well as the interaction with large and small vortices, the vortex rope starts near the runner cone, and the existence and interference of the vortex rope not only increases the hydraulic loss but also causes a strong pressure pulsation [4], resulting in a decrease in the overall efficiency of the hydraulic turbine and an unstable operation. It also seriously affects the durability of the hydraulic turbine, which is prone to producing a potential safety hazard [5].
In order to improve the unstable flow downstream of the hydraulic turbine runner blade, it is common to change the shape and structure of the runner cone or draft tube. The diameter and length of the runner cone, the profile and angle of the draft tube and other structural forms may change the flow characteristics of the runner outlet velocity component, the swirling flow characteristics of the draft tube inlet, the pressure distribution, and the pulsation characteristics downstream of the runner blade. The water flow is successfully guided into the draft tube to improve the disorder and instability of the water flow in the draft tube.
Different runner cone shapes have an impact on the performance characteristics of a hydraulic turbine. Too long or too thick runner cones will lead to a performance reduction. There is always an optimal runner cone scheme for a certain runner [6]. The lengthened runner cone makes the vortex rope generated nearby have a tendency to become smaller, and the eccentricity of the vortex rope is slightly increased, which changes the distribution pattern of the vortex rope in the draft tube and reduces the hydraulic loss and pressure pulsation [7,8]. The lengthened and thickened runner cone reduces the volume and eccentricity of the draft tube vortex rope, but the length and thickness of the vortex rope will increase, and to a certain extent, the pressure pulsation and vibration amplitudes of the draft tube are reduced, but the pressure pulsation frequency cannot be effectively changed [9,10]. The slotted runner cone mitigates the inverse flow downstream of the runner cone, reduces the tangential velocity [11], and decreases the magnitude of the pressure fluctuation [12]. The runner cone drilling can reduce the vortex intensity, and with an increase in the number of drilling holes, the vortex movement is smaller. It can reduce the volume of the vortex rope, decrease the rotational strength and attachment of the vortex rope, and weaken or eliminate the pressure fluctuation caused by the vortex rope, but the drilling will increase the peak value of the draft tube pressure fluctuation [13,14].
Different draft tube shapes have an effect on the performance characteristics of the hydraulic turbine, especially on the turbulence dynamics level, pressure pulsation and vibration level of the draft tube. The change in the diffusion section of the draft tube to an inclined conical shape eliminates the vortex rope and reduces flow instability while disrupting the development of strong swirling flow and mitigating the related pressure fluctuations [15,16]. The change in the elbow section of the draft tube affects the equivalent amplitude corresponding to the root mean square of the plunging power spectrum, as well as the efficiency and loss coefficient of the draft tube [17,18]. The slotted draft tube controls the axial flow in the dead water zone, reduces the degree of vortex and turbulence, and straightens the vortex rope, thus reducing the pressure pulsation [19,20]. The guide plate added to the draft tube corrects the flow direction and reduces the circumferential velocity, thus destroying the development of a strong swirling flow. To some extent, the vortex rope is weakened and the eccentricity of the vortex rope is reduced, thus reducing the pressure pulsation amplitude and changing the frequency of the pressure pulsation [21]. The addition of fins in the draft tube leads to significant mitigation of vortex rope formation [22], which can inhibit the unstable vortex rope to a certain extent regardless of the length of the fins, and significantly reduce the instability and vibration [23,24]. The intensity of the swirling flow is significantly reduced and the pressure pulsation is significantly reduced [25,26].
Up to now, most of the research has focused on the effects of downstream flow structure changes on vortex rope characteristics and their induced vibration characteristics—in particular, methods to mitigate the rotating vortex rope in the draft tube and reduce pulsation amplitude and pulsation frequency to minimize pressure fluctuations. The effect on the flow near the hub within the runner prior to the vortex rope has not been adequately addressed. This is mainly due to the fact that for most hydraulic turbines, the flow near the hub is simply the rotating flow around the hub, and the blade outlet flow is the runner outlet flow without additional disturbance. The small-sized water turbine studied in this paper has its structural particularity. The flow direction of the blade outlet is not consistent with the flow direction of the runner outlet, and the flow direction is changed from radial to axial. There are many unstable flows such as swirling flow, inverse flow and vortex, which will produce more flow losses.
In addition, the simulation calculations of existing hydraulic turbines are simplified and ignore the structures, such as bolts and nuts [27,28,29]. For the small-sized water turbine studied in this paper, the influence of structures such as bolts and nuts on the flow field is not negligible, and the role of the locking nut downstream of the runner blade is similar to that of the runner cone. However, due to the space limitation, the slightly larger locking nut can ensure safety, but it will have a negative impact on the downstream flow field. Therefore, this paper investigates the effects of no locking nut and different locking nut structures on the flow pattern downstream of the runner blade.

2. Methodology

2.1. Physical Model

The research object is a small-sized water turbine, as shown in Figure 1. The water turbine contains a nozzle, runner, runner housing and draft tube. The operating and structural parameters are shown in Table 1. The internal flow of the draft tube is analyzed with and without a locking nut and with different locking nut sizes. The structure with no locking nut (NLN) is shown in Figure 2a, the structure with a small locking nut (SLN) is shown in Figure 2b, and the structure with an extended locking nut (ELN) is shown in Figure 2c.

2.2. Numerical Methods

2.2.1. Governing Equations

The numerical calculations are performed using the Reynolds-average Navier–Stokes (RANS) method.
The continuity equation is given as:
ρ t + x j ρ u j = 0
and the momentum equation becomes:
x j ρ u i u j = p x i + x j μ u i x j + u j x i + x j ρ u i ' u j ' ¯ + F i
where ui and uj are the three-dimensional velocity components of the fluid, μ is the dynamic viscosity, and Fi is the external source term in the i direction.
The transport equation for the turbulent kinetic energy and turbulent frequency:
t ρ k + x i ρ u i k = P ~ k β ρ k ω + x i μ + σ k μ t k x i
t ρ ω + x i ρ u i ω = α 1 v t P ~ k β ρ ω 2 + x i μ + σ ω μ t ω x i + 2 1 F 1 ρ σ ω 2 1 ω k x i ω x i
v t = a 1 k m a x a 1 ω , S F 2
P k = μ t u i x j u i x j + u j x i P ~ k = m i n P k , 10 · β ρ k ω
F 1 = t a n h m i n m a x k β ω y , 500 v y 2 ω , 4 ρ σ ω 2 k C D k ω y 2 4
F 2 = t a n h m a x 2 k β ω y , 500 v y 2 ω 2
C D k ω = m a x 2 ρ σ ω 2 1 ω k x i k x i , 10 10
where k is turbulent kinetic energy, ω is turbulent frequency, S is an invariant measure of the strain rate, y is the distance to the nearest wall, νt is the eddy viscosity coefficient, β∗ = 0.09, α1 = 5/9, β1 = 0.075, σk1 = 0.85, σω1 = 0.5, α2 = 0.44, β2 = 0.0828, σk2 = 1.0, σω2 = 0.856.
Turbulence modeling was performed using the k-ω SST (Shear Stress Transport) model, which more accurately predicts vorticity formation in the water turbine with flow separation under reversed pressure gradients [30,31].

2.2.2. Numerical Model

The hexahedral mesh of the computational domain, including inlet pipe, inlet nozzle, runner and outlet pipe, were generated using the commercial software ICEM CFD 17.2, as shown in Figure 3 with the maximum nondimensional wall distance y + value less than 1. The inlet boundary condition is the velocity at the design flow rate, and the outlet boundary condition is the system back pressure of 0.3 MPa. No-slip wall conditions are used for all the wall boundaries. The calculations were considered converged when the RMS (root mean square) was less than 1 × 10⁻⁵.

2.2.3. Grid Independence Analysis

Steady-state calculations were performed for different grid sizes for water turbine design conditions, and the dependence between the results and the grid size was judged by the efficiency values. When the relative error is less than 2%, the calculation results are considered to be almost independent of the grid size, and an acceptable convergence is achieved. As shown in Table 2, the computational results when the number of grids reaches 4.6 million are acceptable and used for further analysis.

3. Results and Discussions

3.1. Hydraulic Performance

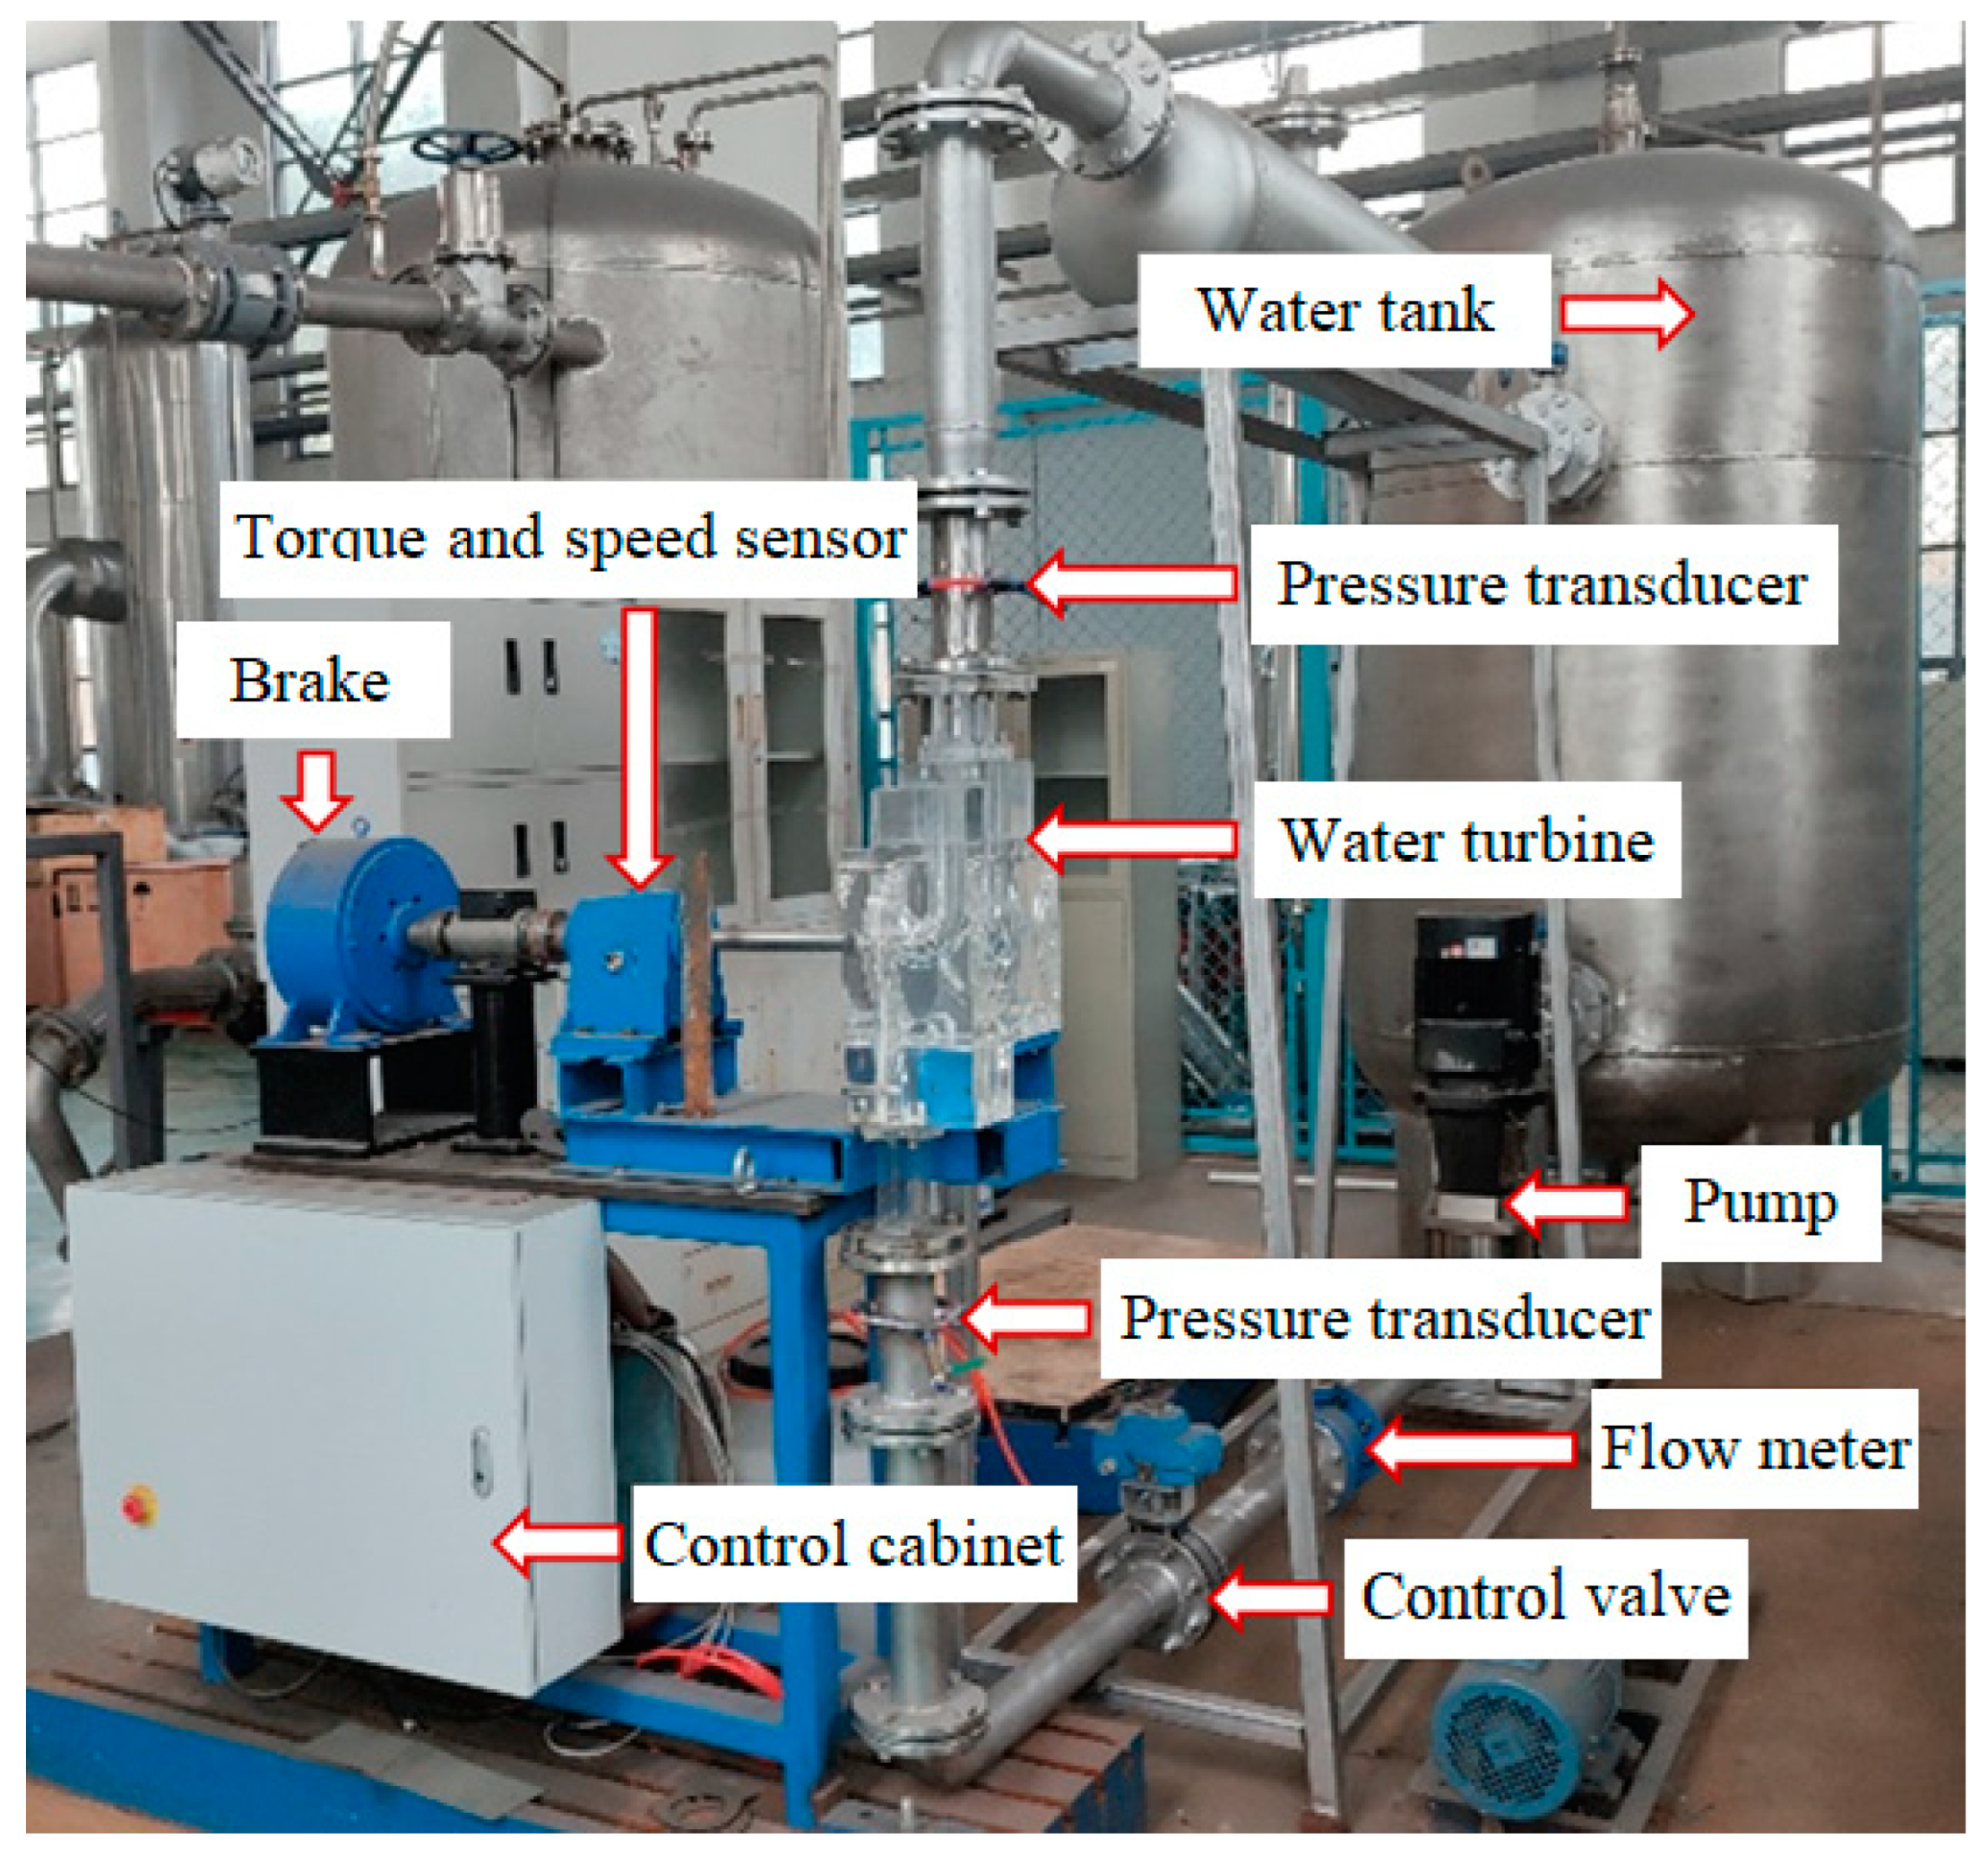
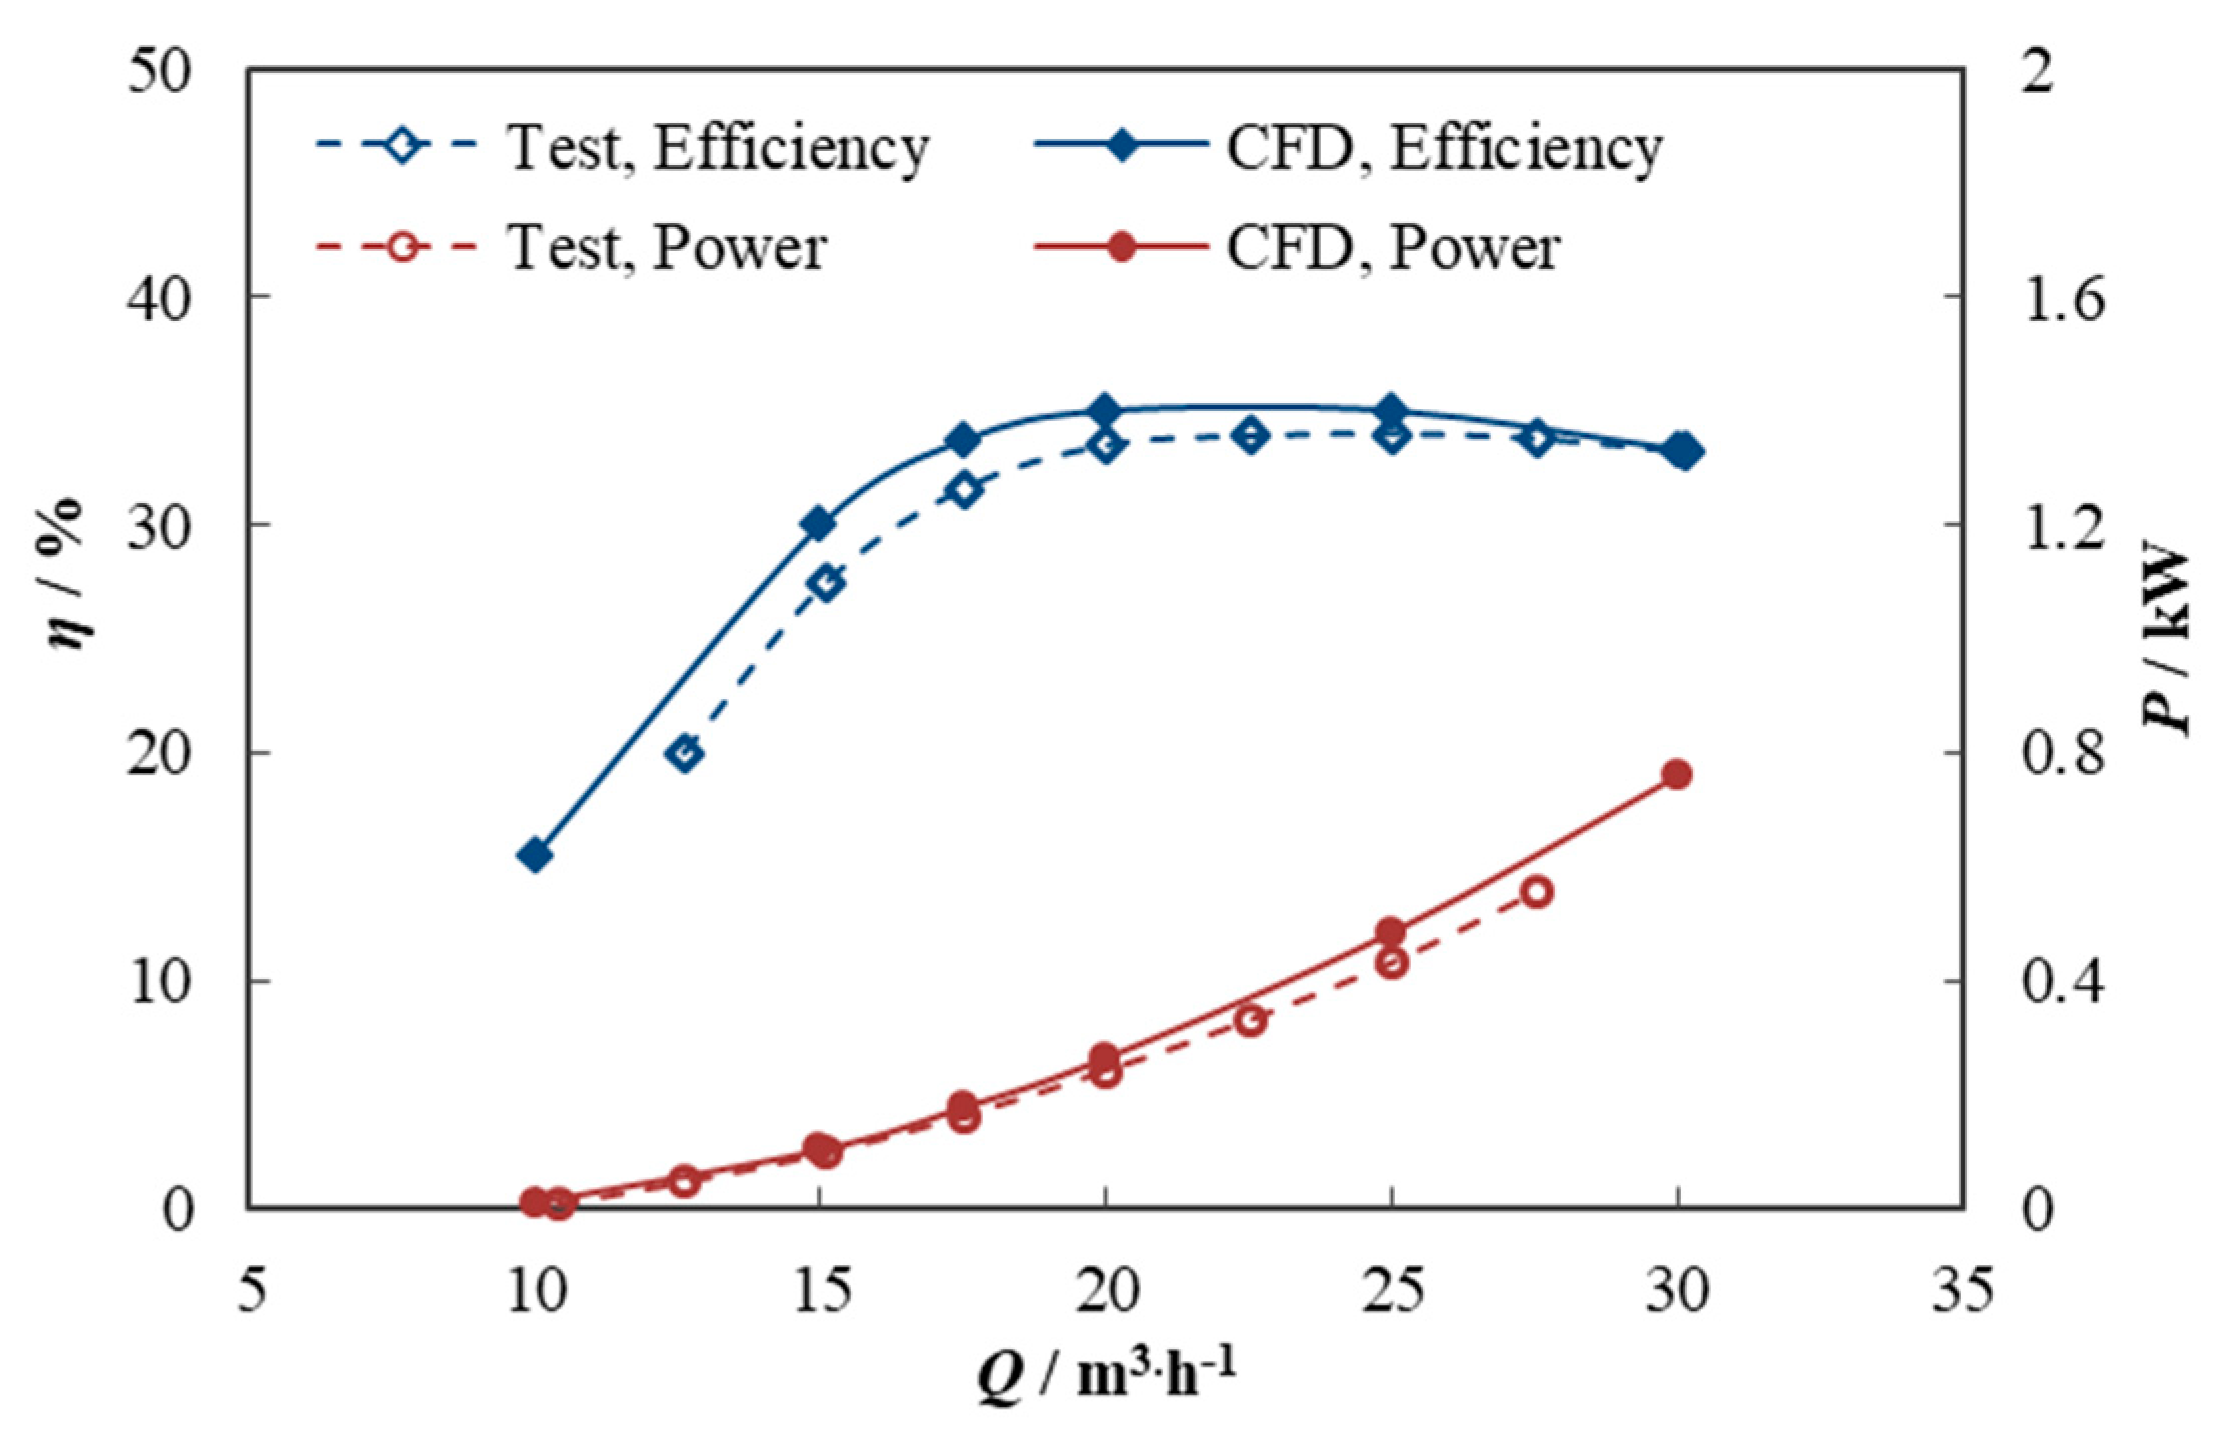
Suitable experimental devices (Table 3) were selected to conduct hydraulic performance tests of the water turbine on the test bench shown in Figure 4. The comparison of the experimental results with the calculated results for the design conditions is shown in Figure 5, with an efficiency error of 4.6% and a power error of 3.8%, which are within acceptable limits for turbine performance prediction. Therefore, the numerical model is considered to have good accuracy in predicting the flow field of the water turbine.
The experimental device uncertainty is synthesized by the uncertainty of the measuring instrument according to the square sum root method, namely
e = ± i = 1 n e i 2
where e is the uncertainty of the experimental instrument, and ei is the accuracy of each instrument. According to the uncertainty calculation of each instrument in Table 3, the uncertainty of the experimental device is ±0.59%.
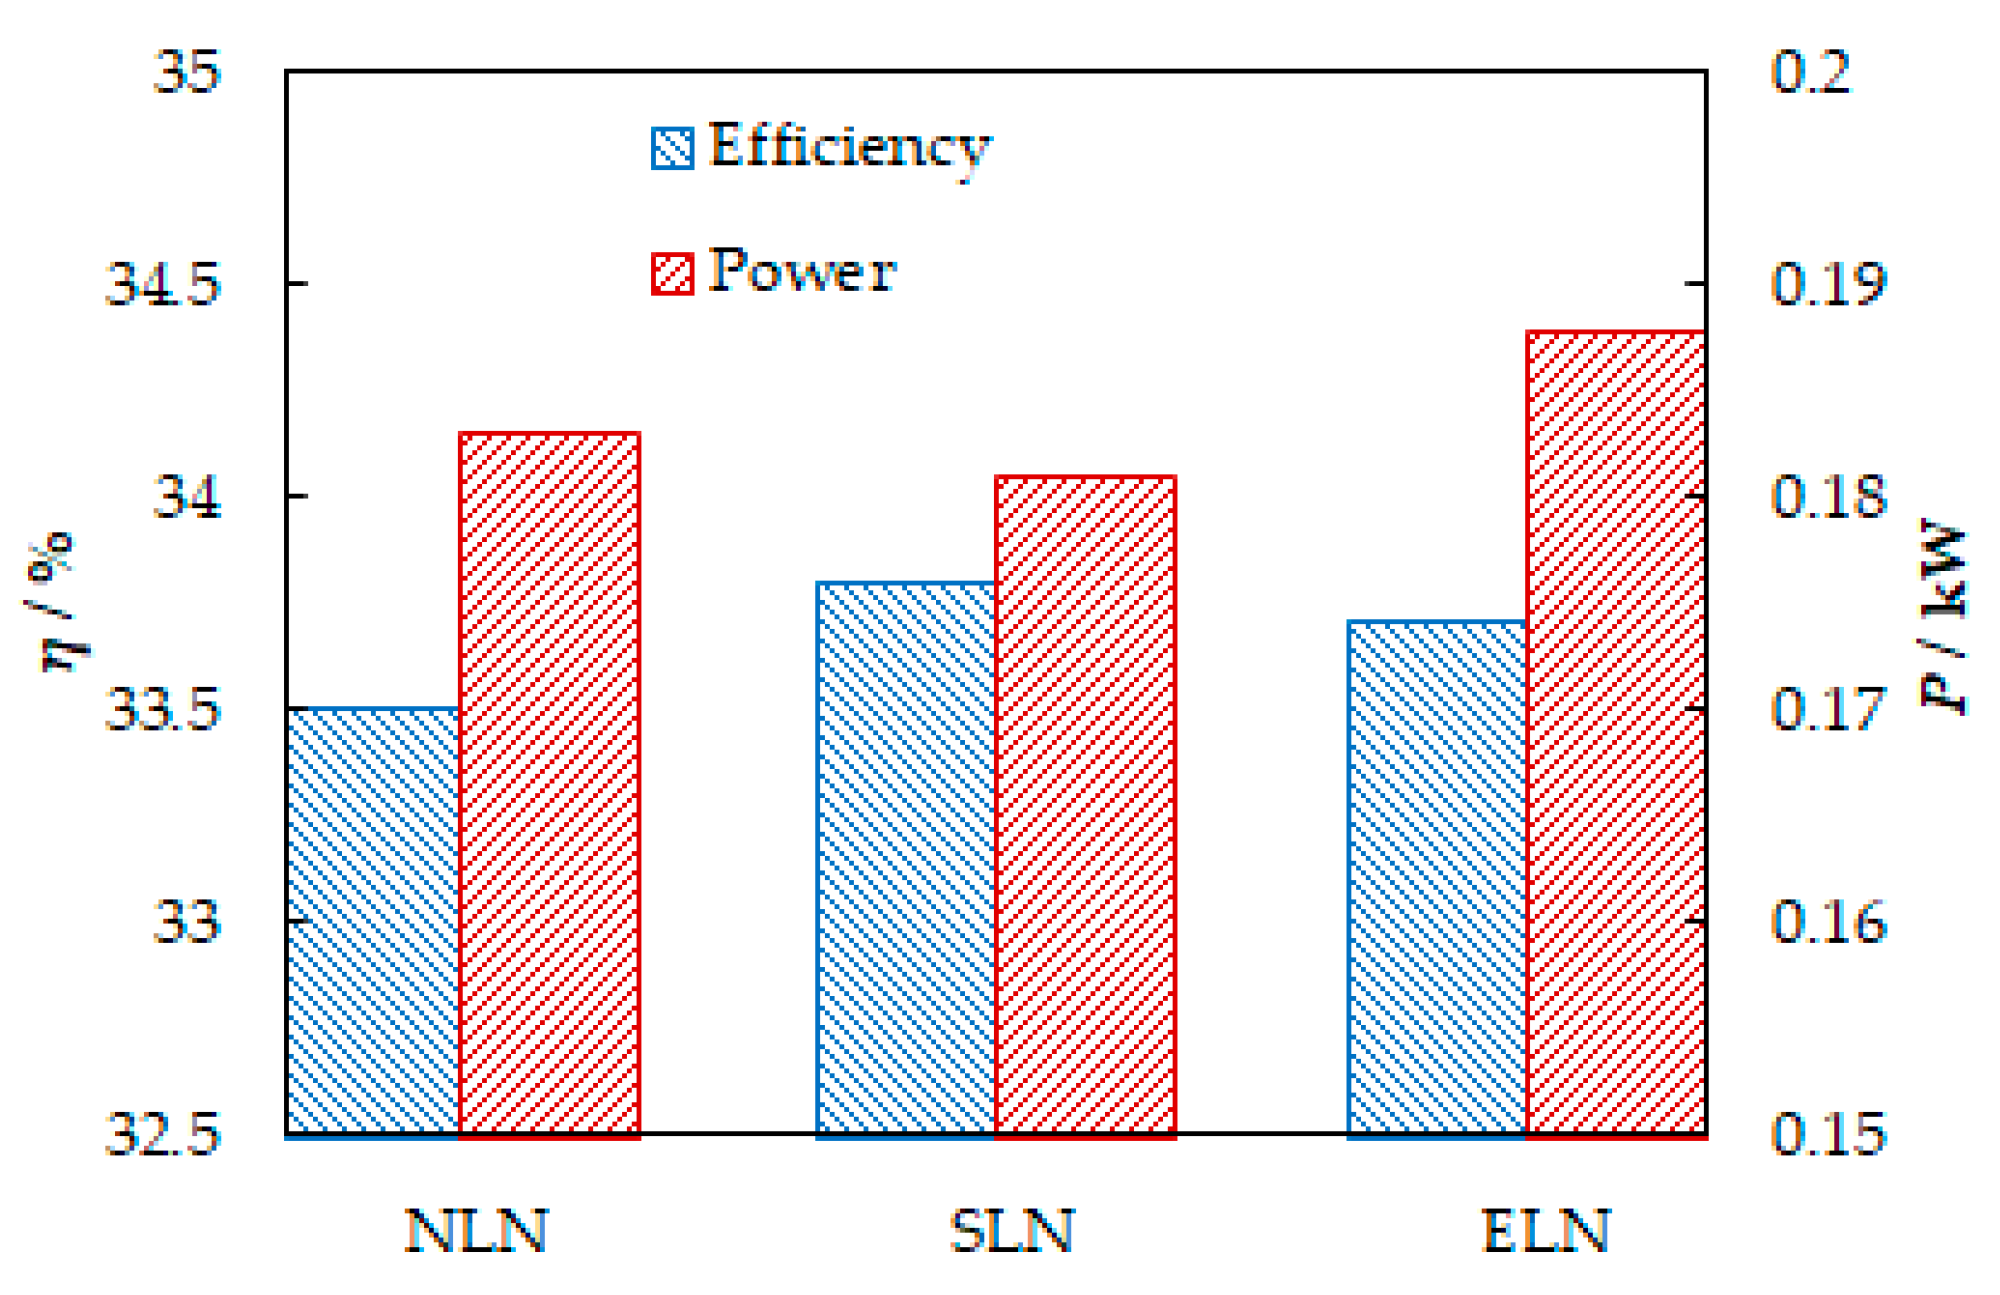
The influence of the locking nut on the hydraulic performance of the water turbine is shown in Figure 6, which improves the efficiency to a certain extent, but the influence on the power is not consistent depending on the specific structure. Therefore, the flow field near the locking nut is further analyzed.

3.2. Head Loss in the Flow Field of the Runner Blade Downstream

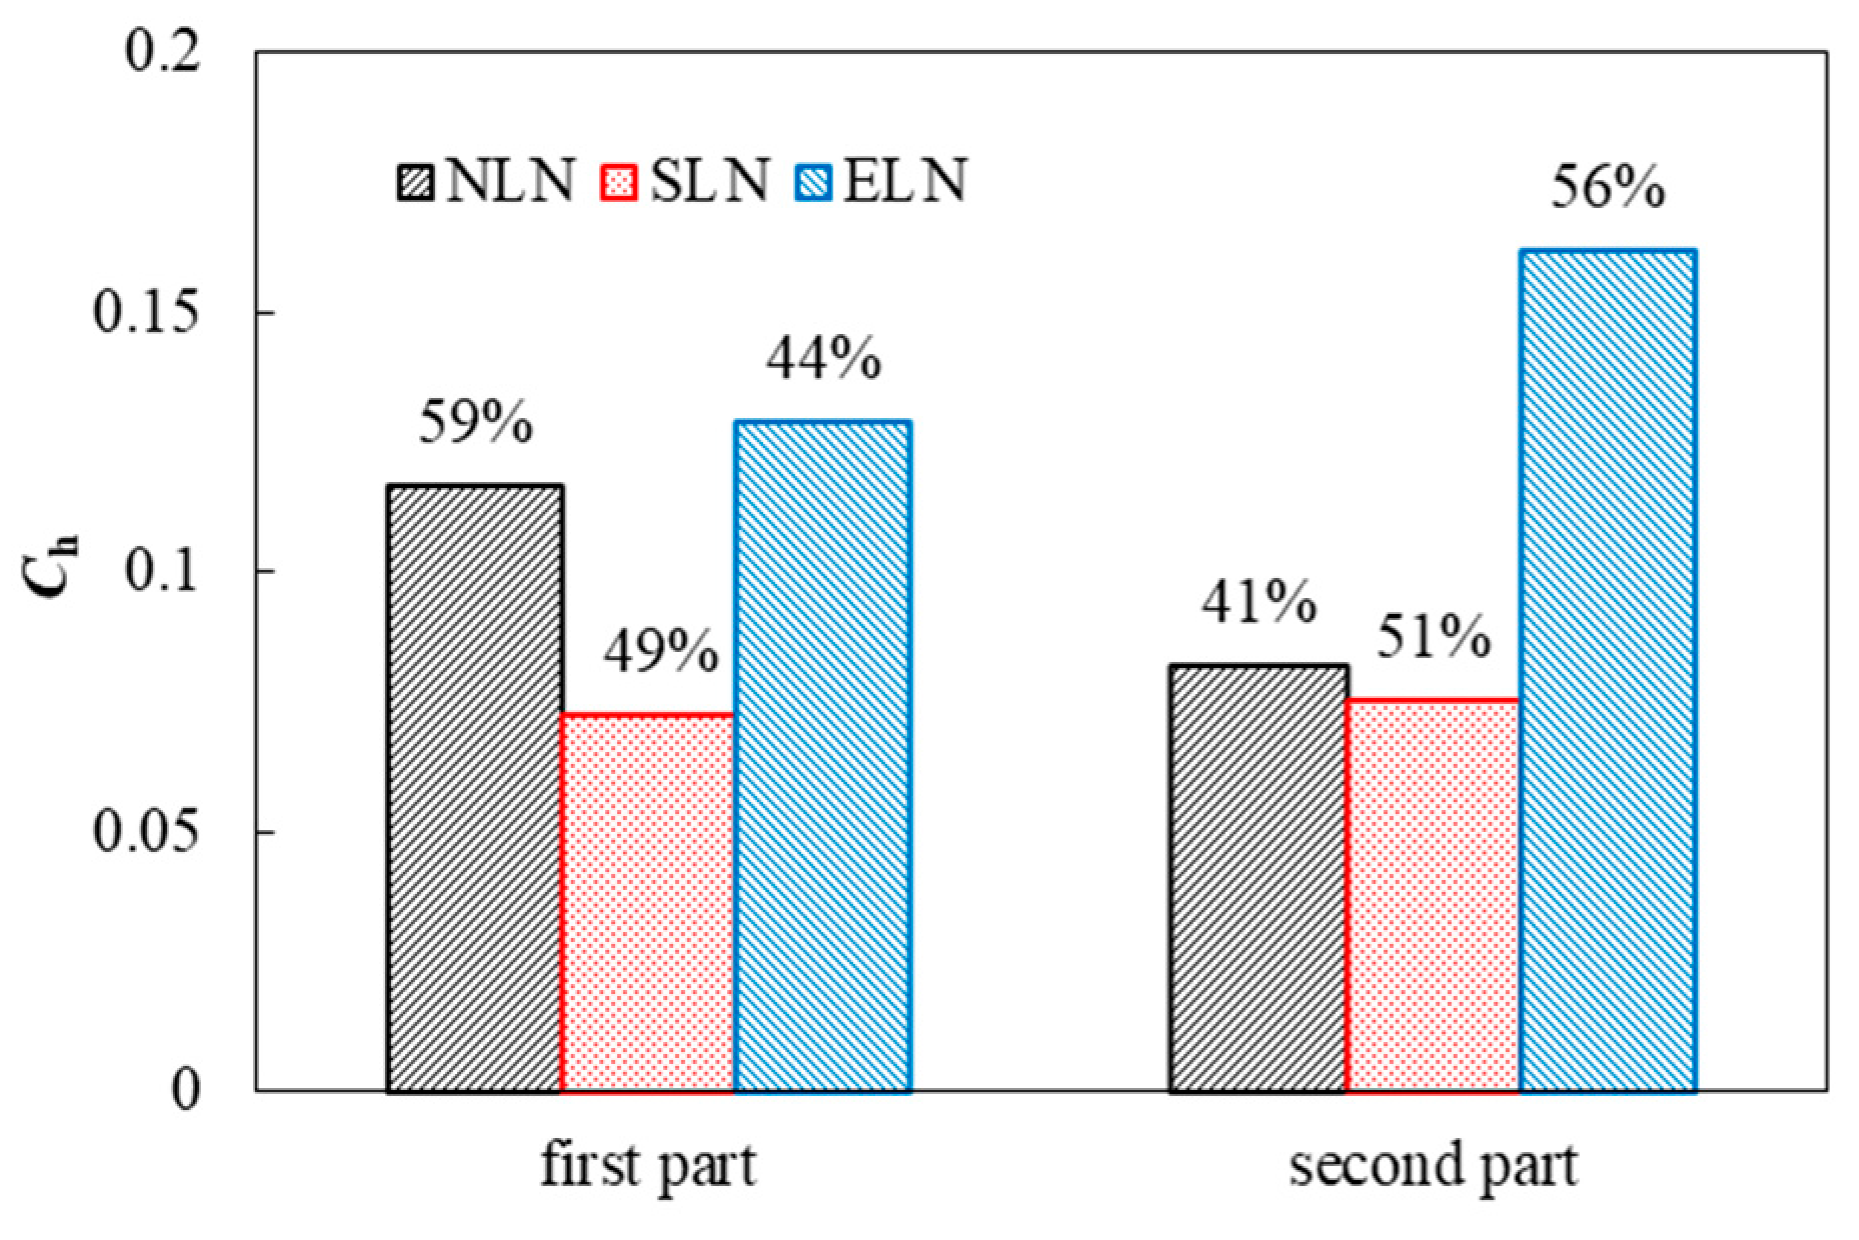
The downstream of the blade in the runner domain is divided into two parts, i.e., the first part between the outlet cross-section of the blade top (S1) and the middle cross-section of the blade downstream (S2), and the second part between the middle cross-section of the blade downstream (S2) and the outlet cross-section of the runner (S3), as shown in Figure 7.
The head loss coefficient is introduced to express the head loss in the flow field of the runner blade downstream, and its expression is:
C h = g H U 1 2 / 2
The lowest head loss of the blade downstream is SLN, followed by NLN, and the largest is ELN, as shown in Figure 8. For NLN, the head loss in the first half is greater than that in the second half. For SLN, the head loss in the first half is significantly smaller than that of NLN, and the head loss in the second half is slightly smaller than that of NLN, but the head loss in the first half is smaller than that in the second half. For ELN, the head loss in the first half is slightly larger than that of NLN, and the head loss in the second half is significantly larger than that of NLN, but the head loss in the first half is less than that in the second half. The added locking nut changes the downstream flow pattern, making the loss in the first half less than that in the second half. The small locking nut can effectively improve the flow pattern and reduce the flow loss, while the extended locking nut increases the flow loss. Therefore, the influence of the locking nut downstream of the blade is both positive and negative depending on the structure of the locking nut. It is necessary to master the internal flow characteristics under different structures and adopt the structure that is most conducive to reducing hydraulic loss.

3.3. Radial Flow Characteristics of Blade Downstream Flow Field

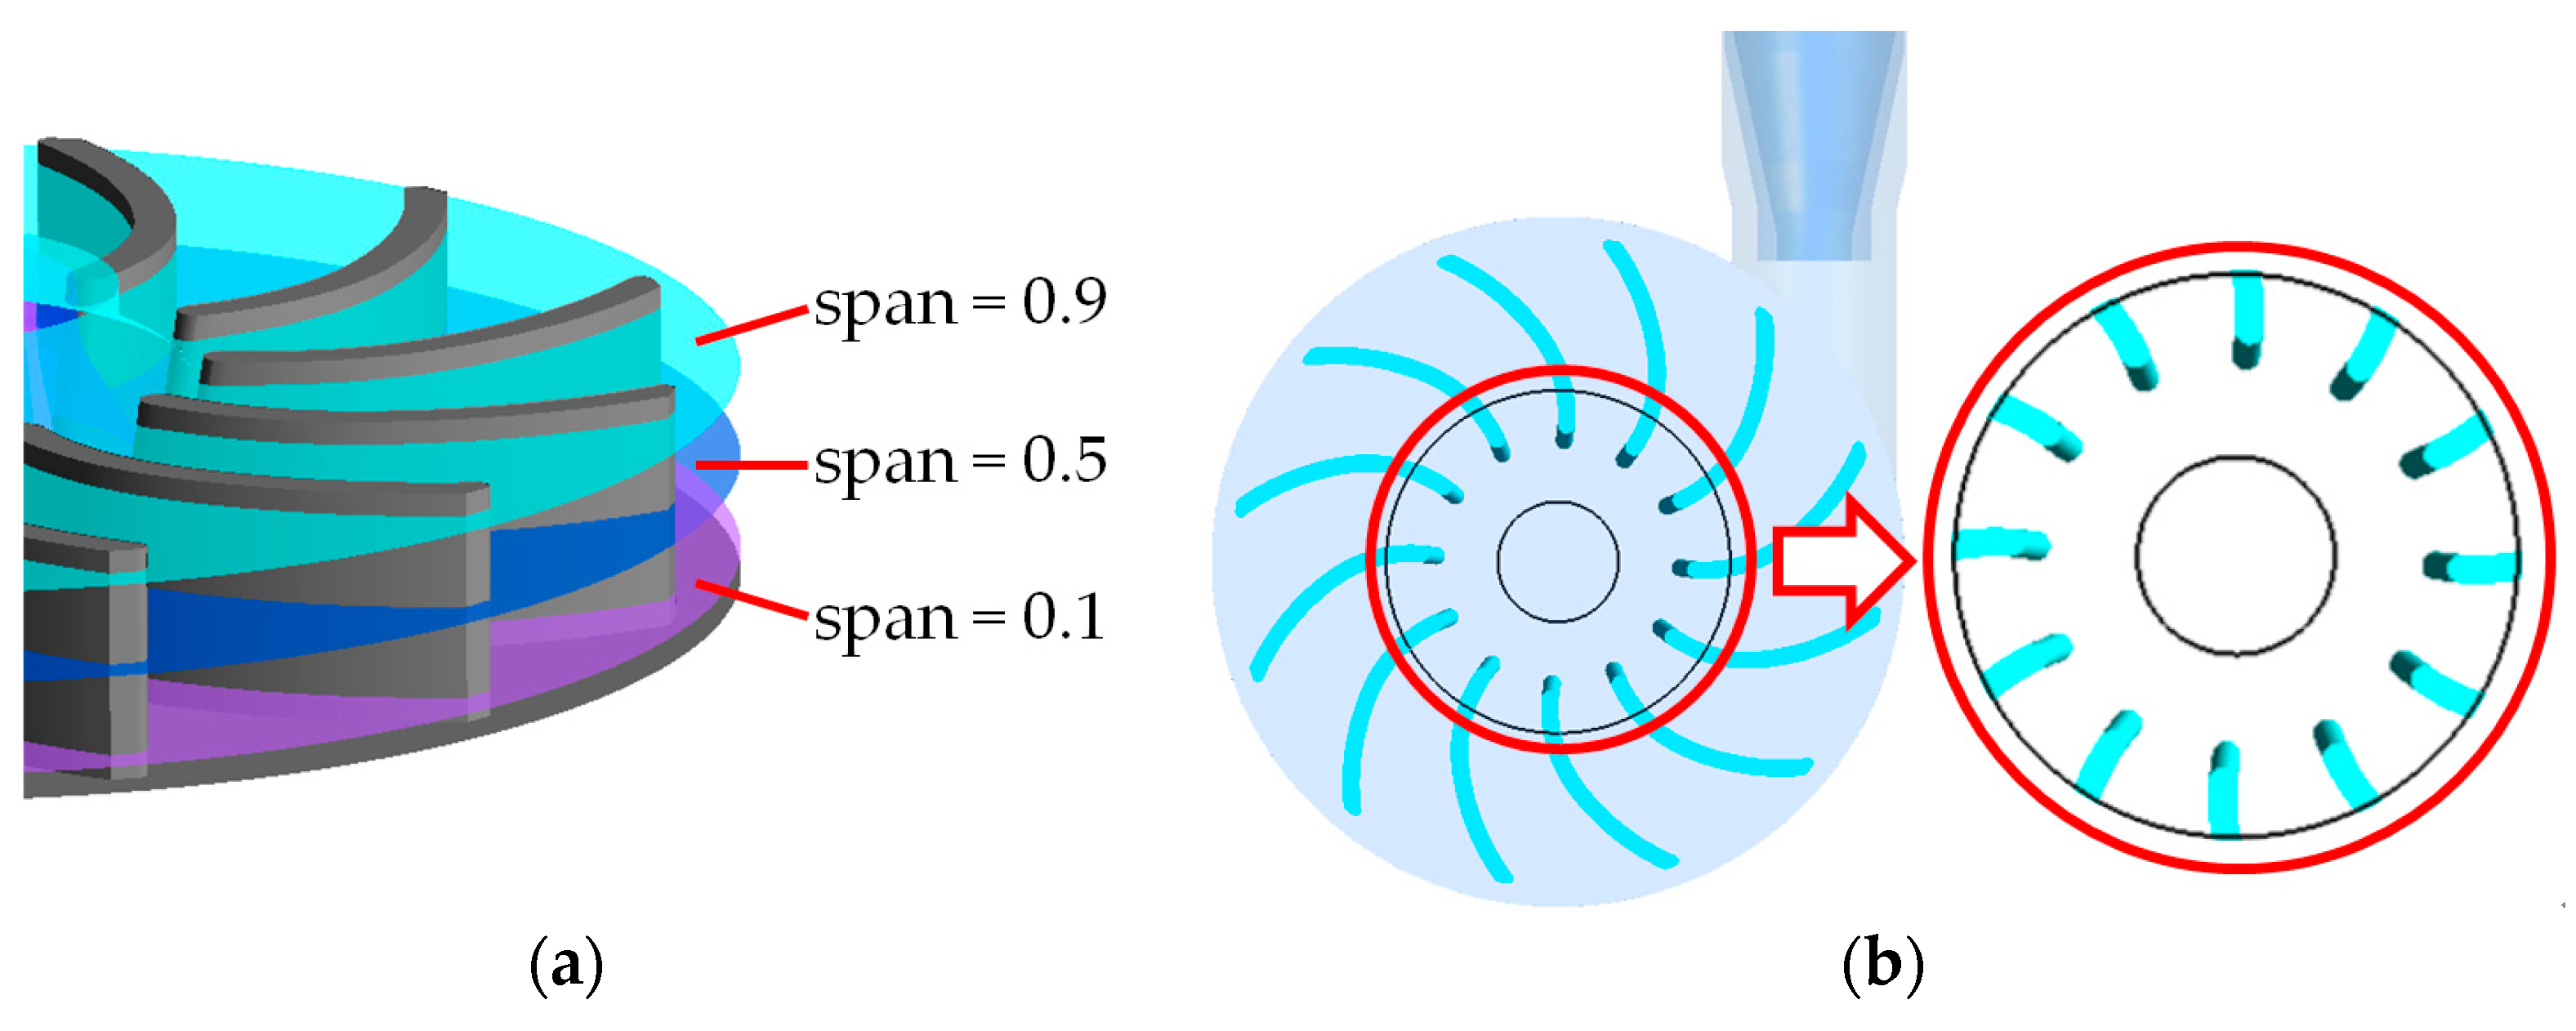
The radial distribution characteristics of the downstream flow field are obtained by the pressure field and swirling flow field characteristics of different spans, as shown in Figure 9. Figure 9a is the selected radial surface position. Figure 9b is the selected runner’s fixed position.

3.3.1. Non-Uniform Pressure Field of Blade Downstream Flow Field

The pressure coefficient is introduced to represent the distribution of cross-sectional pressure, and its expression is:
C p = P P o u t 1 2 ρ U 1 2
where P is the total pressure, Pout is the total pressure of the water turbine outlet, ρ is the fluid density, U1 is the runner inlet velocity.
The main impacted flow passage is defined as flow passage 1, which is defined as flow passage 2 to flow passage 12 according to the rotation direction of the runner, as shown in Figure 10. The radial pressure distribution of the blade downstream flow field shows a high-pressure zone at the impacted flow passage and around the flow passage outlet, and the pressure along the clockwise direction is significantly greater than that in the counterclockwise direction, as shown in Figure 10, Figure 11 and Figure 12. With the increase in span, the range of high-pressure zone decreases, but the radiation range increases gradually, and the range of low-pressure zone increases gradually. The pressure distribution is roughly the same at the span of 0.1 and 0.5 but changes slightly at the span of 0.9.
For NLN, the low-pressure zone is elliptical and exists in the middle of the downstream between flow passages 10 and 11, as shown in Figure 10. It extends slightly at a span of 0.9, and there is a low-pressure zone in the half-cycle of the hub not facing the impacted flow channel. The radiation range of the high-pressure zone of the impacted flow passage increases with the span and gradually leaves from the hub. The radiation range extends clockwise to the flow passage 7 and downstream at the span of 0.1 and gradually extends to the flow passage 8 at the span of 0.9. For SLN, the overall pressure variation range is less than that of NLN, as shown in Figure 11. The range of the low-pressure zone is significantly smaller than that of NLN. The elliptical low-pressure zone exists in the downstream of flow passage 11, and its position is about half of the blade flow passage angle along the clockwise direction compared to the NLN. The radiation range of the high-pressure zone of the impacted flow passage is reduced by one flow passage region compared to NLN. For ELN, the overall pressure variation range is greater than that of NLN, as shown in Figure 12. The range of the low-pressure zone is significantly smaller than that of NLN. At the span of 0.1, the low-pressure zone is sporadically distributed in three points, which exists in the downstream of flow passage 10, and its position is about half of the blade flow passage angle along the counterclockwise direction compared to NLN. At spans of 0.5 and 0.9, the low-pressure zone is elliptical and exists in the middle of the downstream between flow passages 10 and 11, and the low-pressure zone around the hub disappears at the span of 0.9. The high-pressure zone is significantly larger compared to NLN, extending from the impacted flow passage to the hub circumference. The radial extent of the high-pressure zone in the impacted flow passage increases by 2 flow passage regions compared to NLN. It can be seen that the locking nut effectively reduces the range of the low-pressure zone in the downstream, resulting in a more uniform pressure distribution. The small locking nut reduces the high-pressure zone range, and the extended locking nut increases the high-pressure zone range. The downstream flow field exhibits more pronounced pressure changes with increasing span.

3.3.2. Swirling Motion of Blade Downstream Flow Field

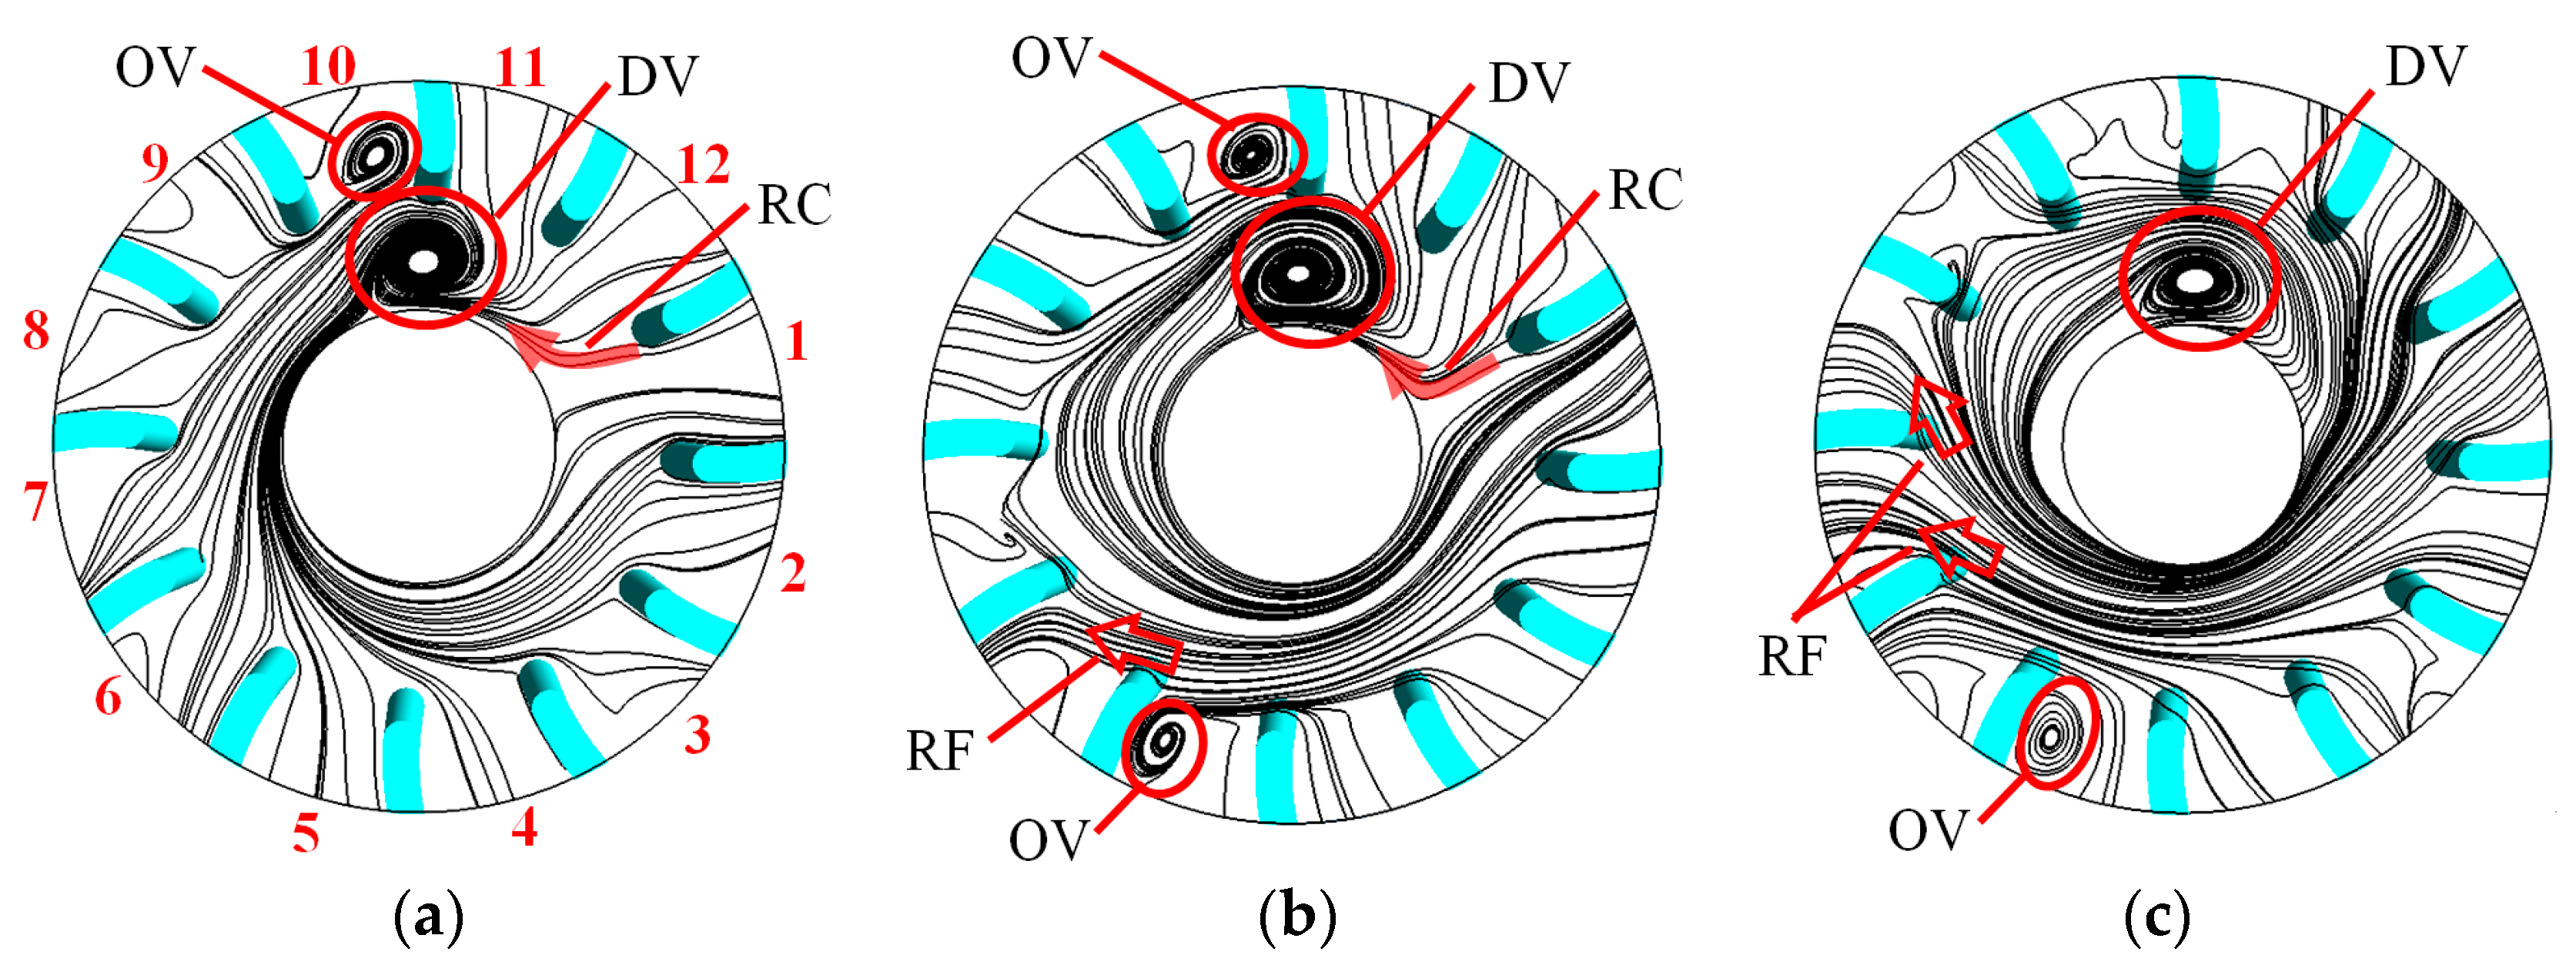
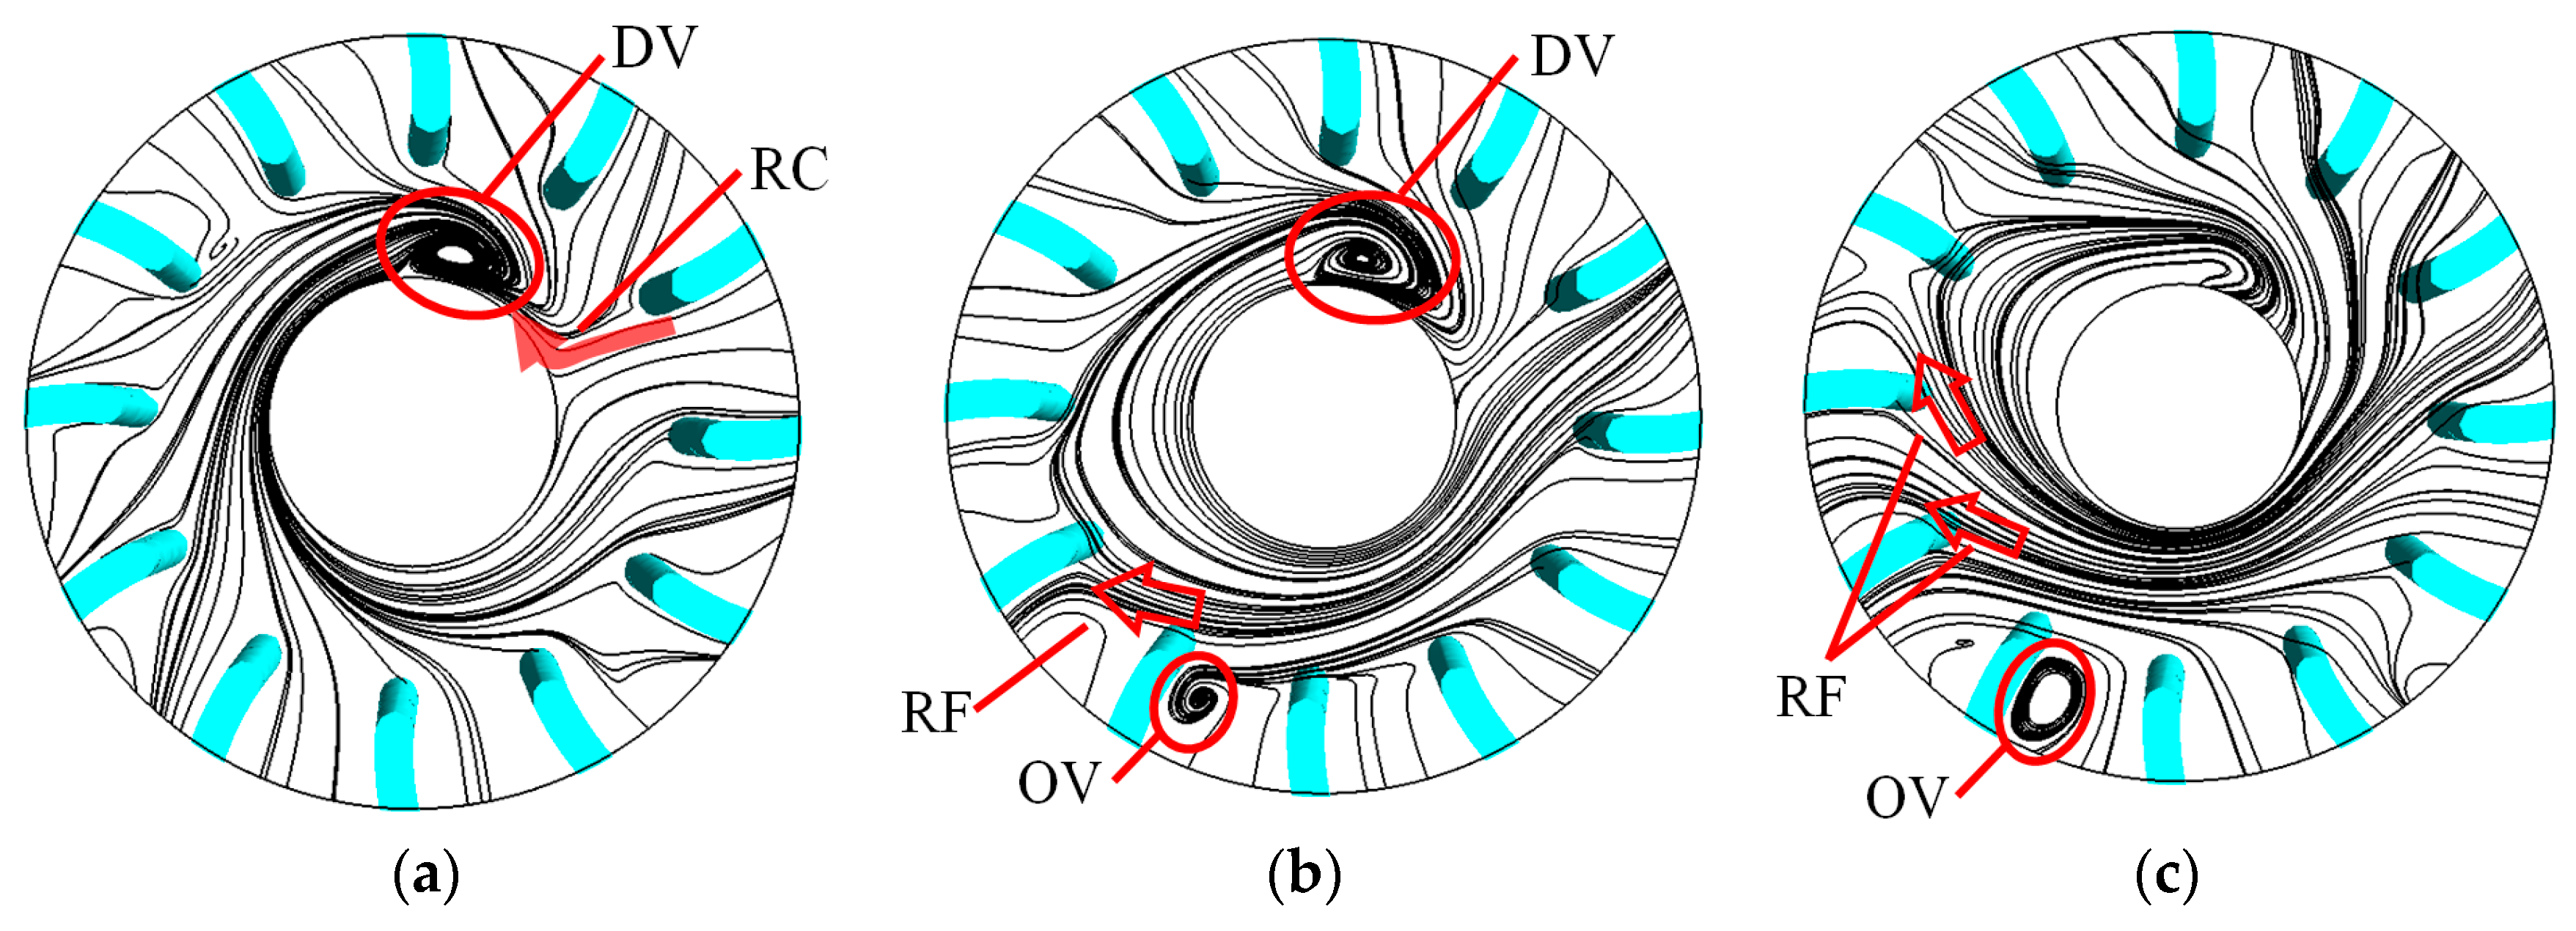
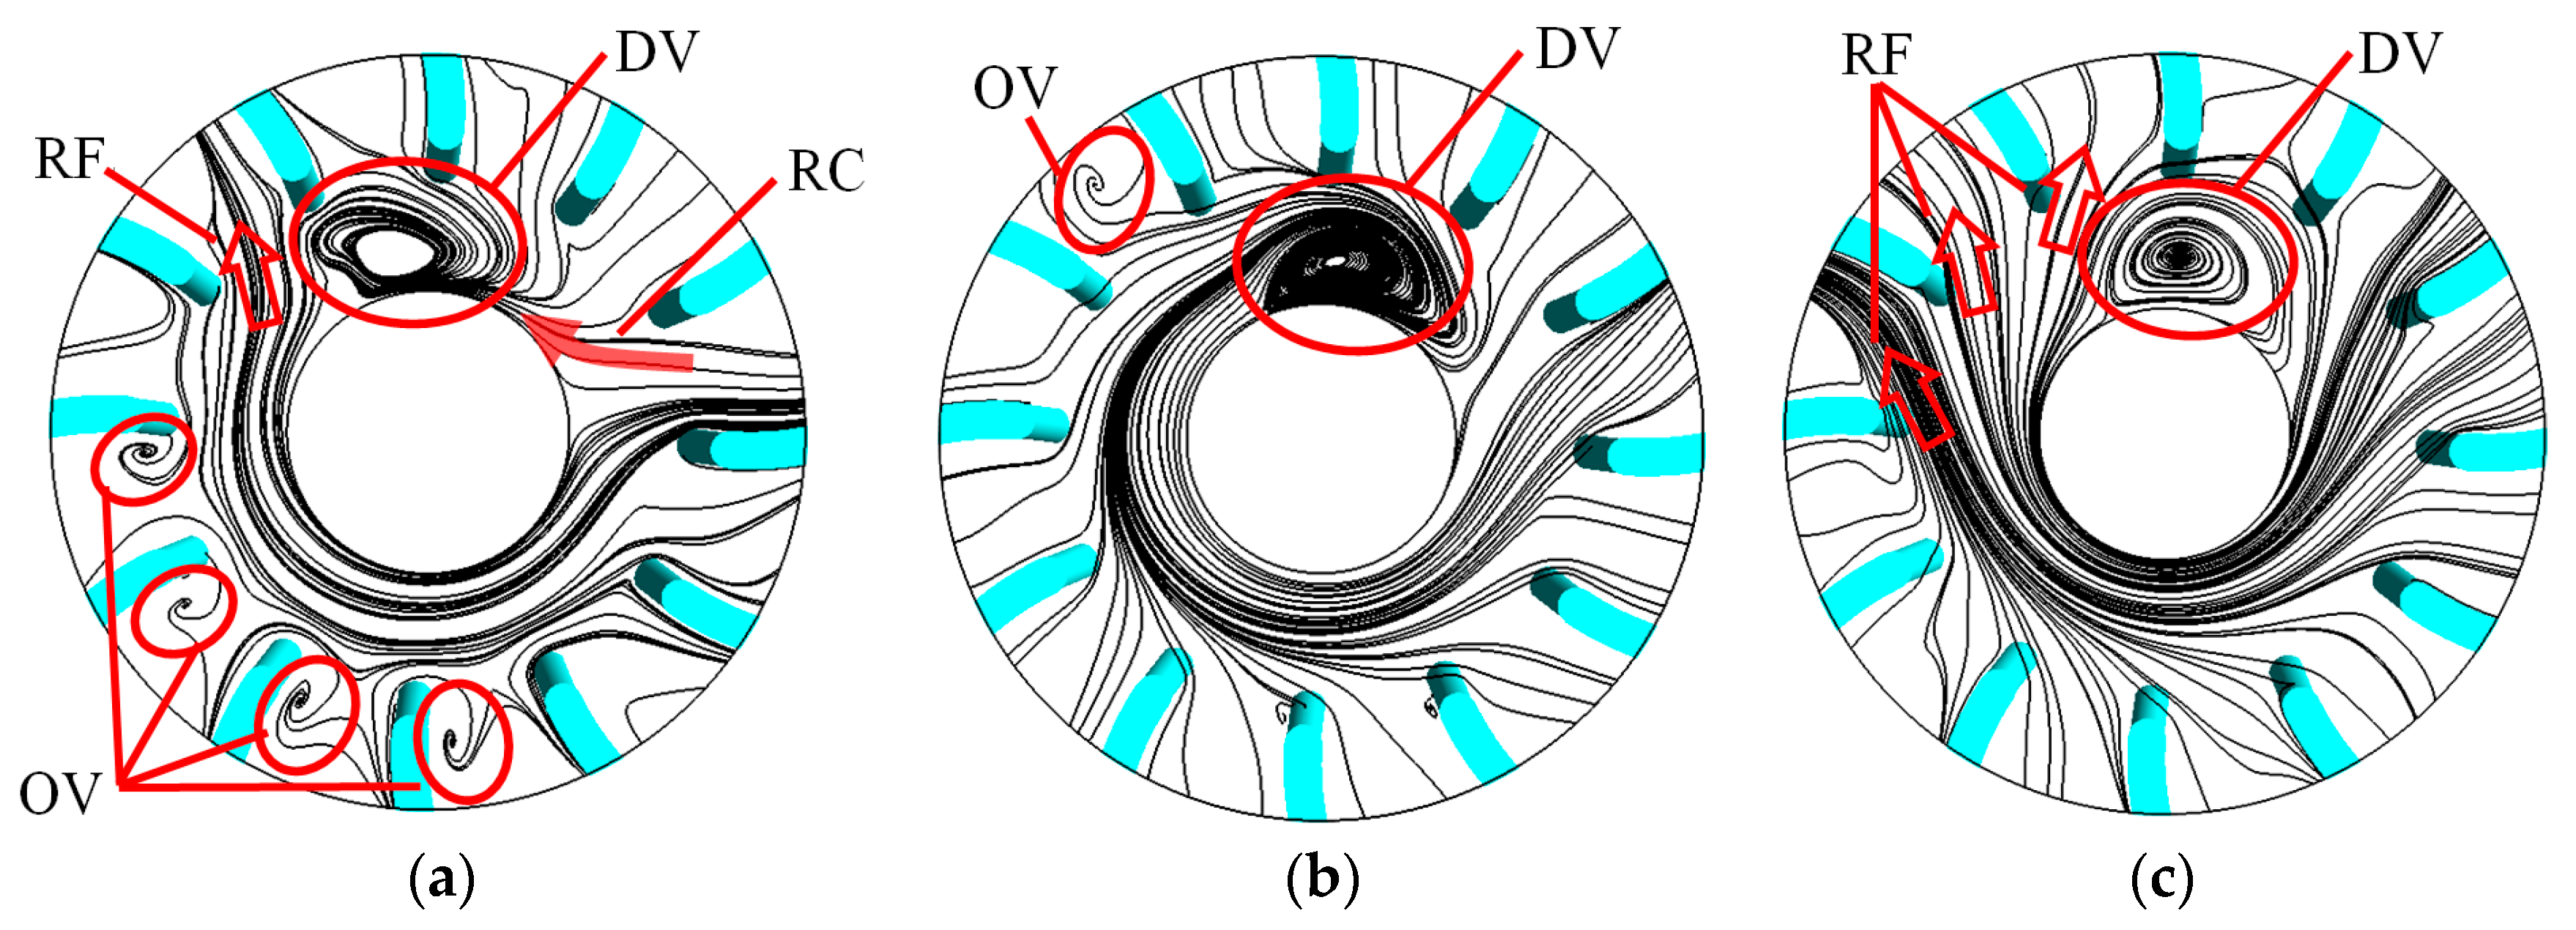
The downstream flow field of the blade presents an obvious rotating flow around the hub, as shown in Figure 13, Figure 14 and Figure 15. In the downstream between flow passages 10 and 11, there is a disturbance vortex (DV) with the same rotation direction as the runner, which means that there are different degrees of outlet vortex (OV) in the blade flow passage, and it even generates a reverse flow (RF) in a few blade flow passages. The outflow of most blade flow passages flows into the mainstream in the direction of the runner rotation, and the outflow of a few blade flow passages affected by the DV flows into the mainstream in the form of reverse confluence (RC). The outflow direction of the main impacted flow passage 1 changes with increasing span, from a horizontal outflow almost consistent with the horizontal axis to an oblique outflow at about 45° to the horizontal axis.
For NLN, the DV presents a rounded oval shape and occupies a large area of the downstream flow passage, as shown in Figure 13. At the span of 0.1, the OV appears in flow passage 10, which is mainly affected by nearly half of the outflow of flow passage 1 flowing into the mainstream in the form of an RC. At the span of 0.5, the OV appears in flow passages 5, 7 and 10, the reverse flow appears in flow passage 6, and a small part of the outflow from flow passage 1 forms an RC. At the span of 0.9, the OV occurs in flow passage 5, the reverse flow occurs in flow passages 7 and 8, and the outflow of flow passage 1 does not form an RC. For SLN, the DV exhibits a flattened small oval shape, occupies a smaller area of the downstream flow passage, about only half the size of the NLN, and is located downstream of flow passage 11, which is rotated clockwise by an angle of about half a blade flow passage compared to that of NLN, as shown in Figure 14. At span the of 0.1, there is no OV near the blade flow passage outlet. At the span of 0.5, the OV occurs in flow passage 5, with the RF in flow passage 6, and almost no RC. At the span of 0.9, the DV does not form a complete vortex pattern, the OV appears in runner 5, and RF occurs in flow passages 7 and 8. Compared to that of NLN, both OV and DV are significantly reduced, and the amount of RC is also slightly reduced. For ELN, the DV shows an elliptical shape and occupies a larger area of the downstream flow passage, which is basically the same compared to that of NLN, except for a larger area at the span of 0.1, as shown in Figure 15. At the span of 0.1, the OV appears in flow passages 4 to 7, with the RF in runner 9. At the span of 0.5, the OV occurs in flow passage 9, and the outflow from runner 1 does not cause an RC. At the span of 0.9, the OV appears in flow channel 11, and the RF appears in flow passages 8 to 10. Compared to that of NLN, the DV is slightly reduced. The RF region decreases at the span of 0.5 but increases at spans of 0.1 and 0.9. It can be seen that the locking nut makes the outflow of the main impacted flow passage 1 produce less RC. It has different degrees of inhibition on the DV, OV and RF, but the ELN increases the RF area at spans of 0.1 and 0.9.

3.4. Circumferential Flow Characteristics of Blade Downstream Flow Field

The circumferential distribution characteristics of the downstream flow field are obtained from the pressure distribution, reverse flow distribution and vortex cluster distribution characteristics of different circumferential sections along the main flow direction.

3.4.1. Non-Uniform Pressure Field of Blade Downstream

The pressure in the downstream gradually decreased, with the rate of decline experiencing a fast and then slow decline. Both the extent and rate of decline are greatest in ELN, followed by NLN, and the smallest in SLN, as shown in Figure 16.
The pressure distribution of the blade downstream in the circumferential direction shows that the high-pressure zone located in the downstream of the main impacted flow passage 1, which is distributed in a long strip along the flow passage, and the top high-pressure zone spreads in the opposite direction to the rotation of the runner, as shown in Figure 17, Figure 18 and Figure 19. There is an elliptical sub-high-pressure zone in the upper part of the cross-section, and its range gradually expands along the mainstream direction and affects the surrounding area. In the mainstream direction, the center of the sub-high-pressure zone slightly turns about half of the flow passage width to the runner rotational direction, and the shape of the sub-high-pressure zone deflects counterclockwise at a certain angle.
For NLN, the high-pressure zone in the downstream of flow passage 1 shrinks longitudinally and expands circumferentially in the mainstream direction, as shown in Figure 17. The sub-high-pressure region occurs in the downstream of flow passages 7 and 8 and is bounded by flow passage 1, which shows obvious pressure variations on both sides, and the pressure of flow passage 1 along the runner rotational direction is obviously smaller than that in the opposite direction. The sub-high-pressure zone expands about three blade flow passage widths in the circumferential direction and moves down about 0.1 spans in the longitudinal direction. The area where the pressure fluctuation is affected by the diffusion of the sub-high-pressure zone includes the downstream of flow passages from 4 to 12, and the overall pressure value increases. The area without pressure fluctuation is only the downstream of flow passages 2 and 3. For SLN, the range of the high-pressure zone in the downstream of flow passage 1 is significantly smaller than that of NLN, and the range of the low-pressure zone is significantly larger than that of NLN, as shown in Figure 18. There is no obvious pressure change on both sides of flow passage 1 except the sub-high-pressure zone, and the pressure gradient and the range of pressure changes are significantly smaller than those of NLN. The sub-high-pressure zone expands about 1 blade flow passage width in the circumferential direction, which is slightly smaller than that of NLN, and moves down about 0.1 spans in the longitudinal direction. The area affected by the diffusion of the sub-high-pressure zone includes the downstream of flow passages from 8 to 12, which are reduced by nearly half of the area compared to that of NLN, but the amplitude is smaller than that of NLN. There is almost no pressure fluctuation in the downstream of flow passages from 2 to 7, and its range is significantly increased compared to that of NLN. For ELN, the high-pressure zone in the downstream of flow passage 1 is larger than that of NLN in the longitudinal direction, as shown in Figure 19. Along the mainstream direction, the variation range of the high-pressure zone is smaller than that of NLN, which is not reduced in the longitudinal direction, and there is no reverse diffusion at the top of the middle downstream. The range of low-pressure zone is significantly larger than that of NLN. There is no obvious pressure change on both sides of flow passage 1 except the sub-high-pressure area, and the pressure gradient and pressure range are significantly smaller than those of NLN. The sub-high-pressure zone appears in flow passages 5 and 6, which are about two blade flow passage widths away from that of NLN along the opposite direction of the runner rotation. In the mainstream direction, it expands about one blade flow passage width in the circumferential direction, which is slightly smaller than that of NLN, and there is almost no change in the longitudinal direction. Compared to that of NLN, a new sub-high-pressure zone appears at the bottom of the blade, and the range gradually expands from the downstream bottom of flow passages 7 to 10 to the downstream bottom of flow passages 5 to 12. The area affected by the diffusion of the sub-high-pressure region to produce a pressure increase includes the downstream of flow passages from 3 to 12, which is slightly increased compared to that of NLN, but the magnitude is smaller than that of NLN. It can be seen that the locking nut can improve the pressure distribution in the circumferential direction, weaken the pressure fluctuation, reduce the pressure gradient, reduce the sub-high-pressure range, and make the center of the sub-high-pressure zone move up longitudinally. However, the improvement of ELN is not as good as that of SLN.

3.4.2. Non-Uniform Velocity Field of Blade Downstream

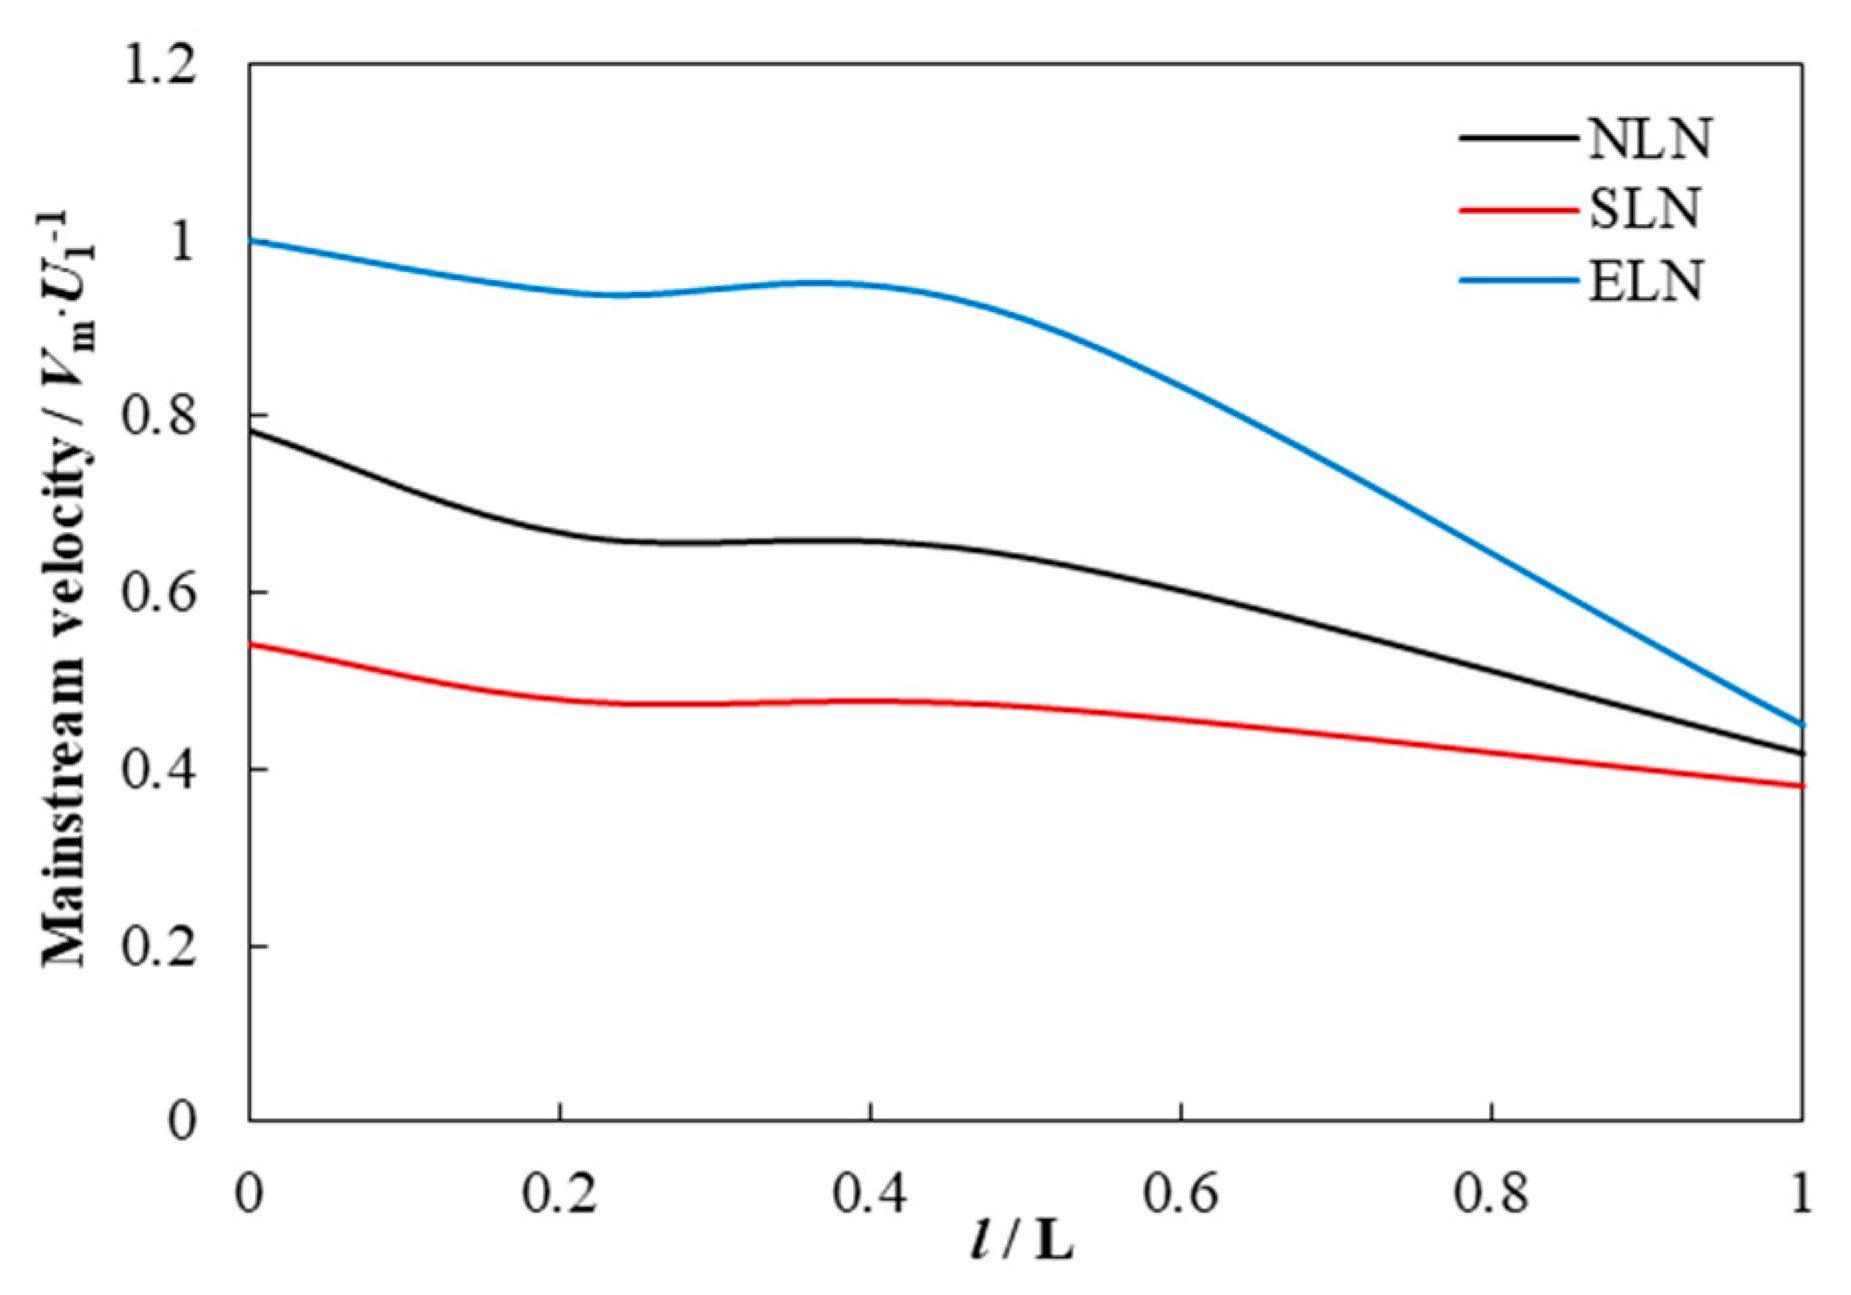
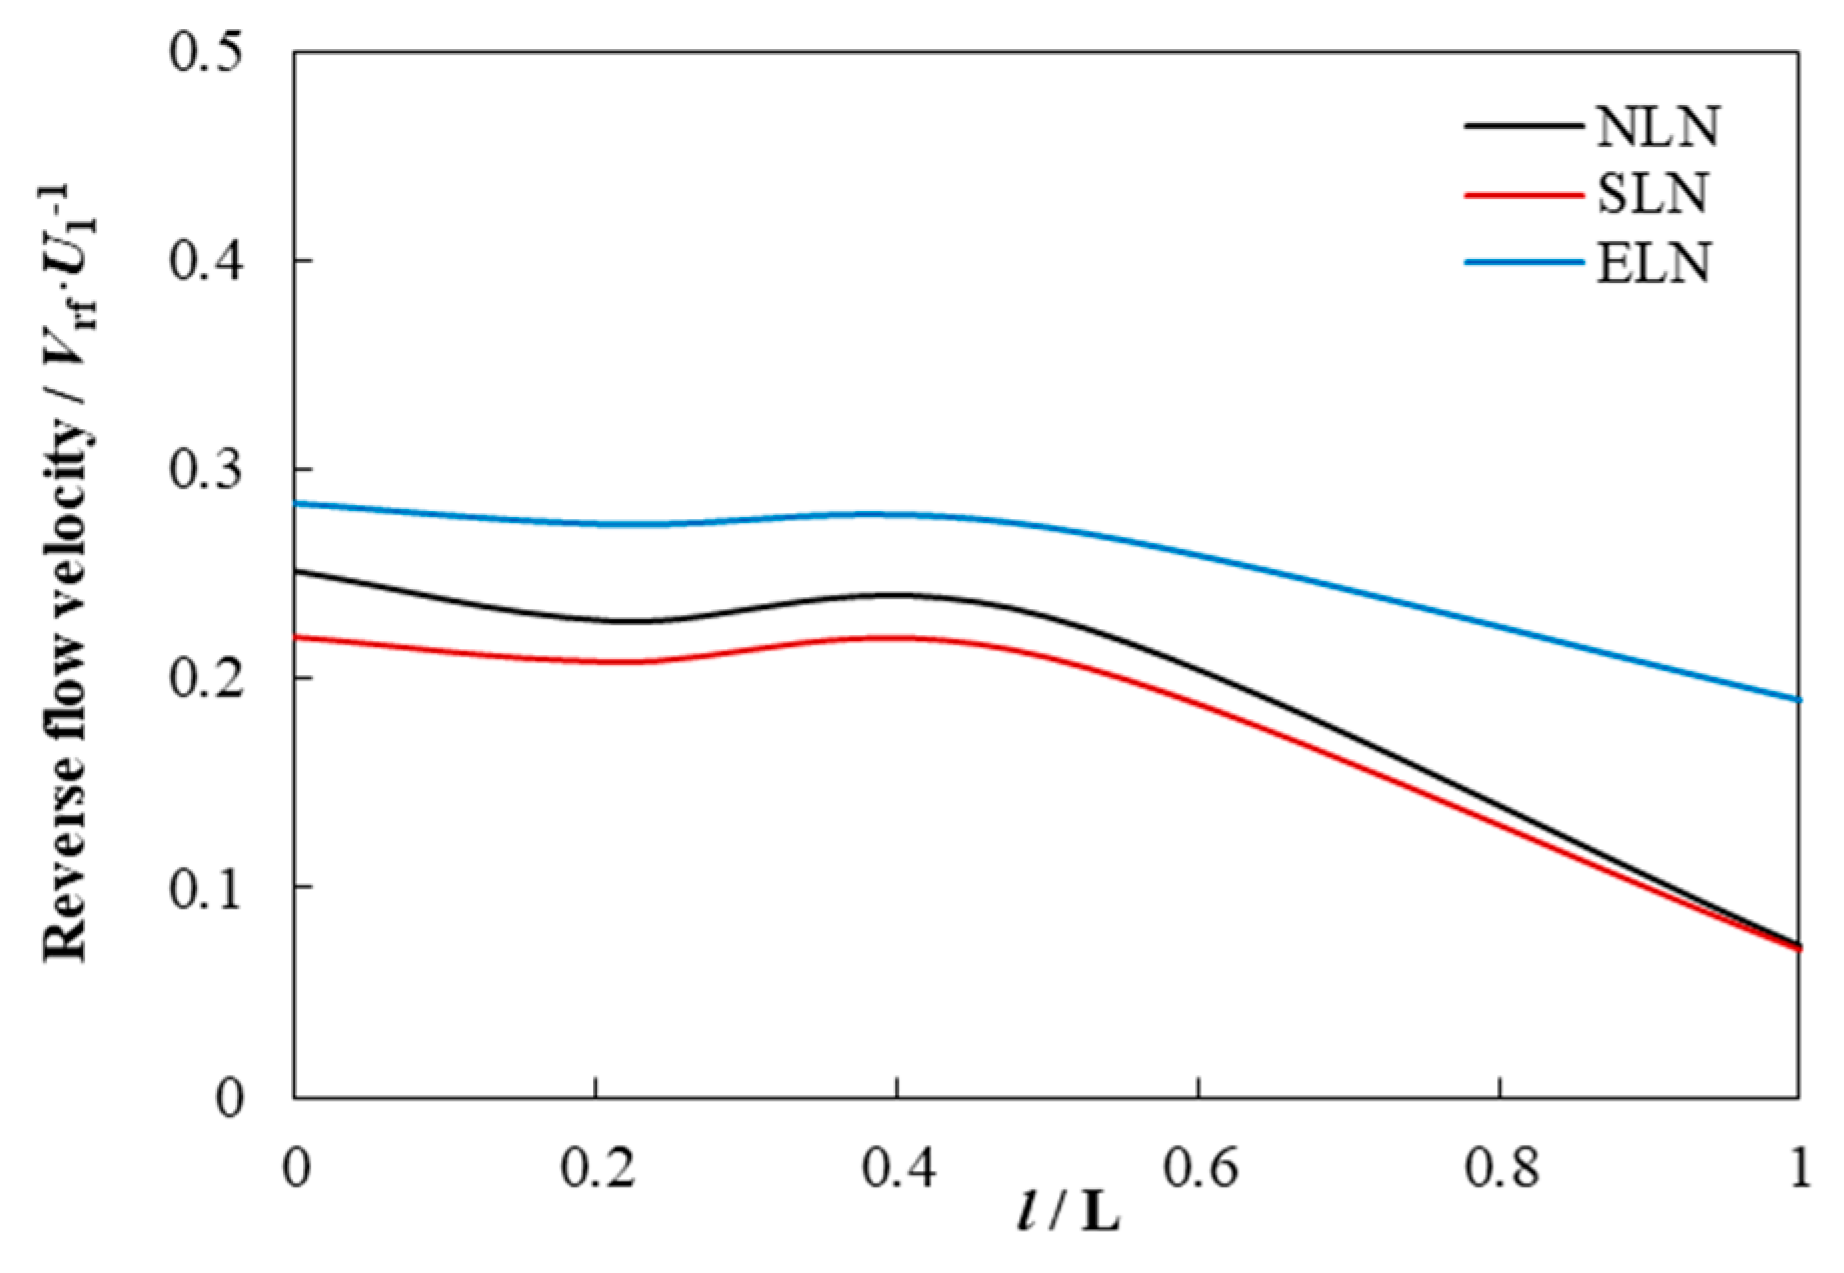
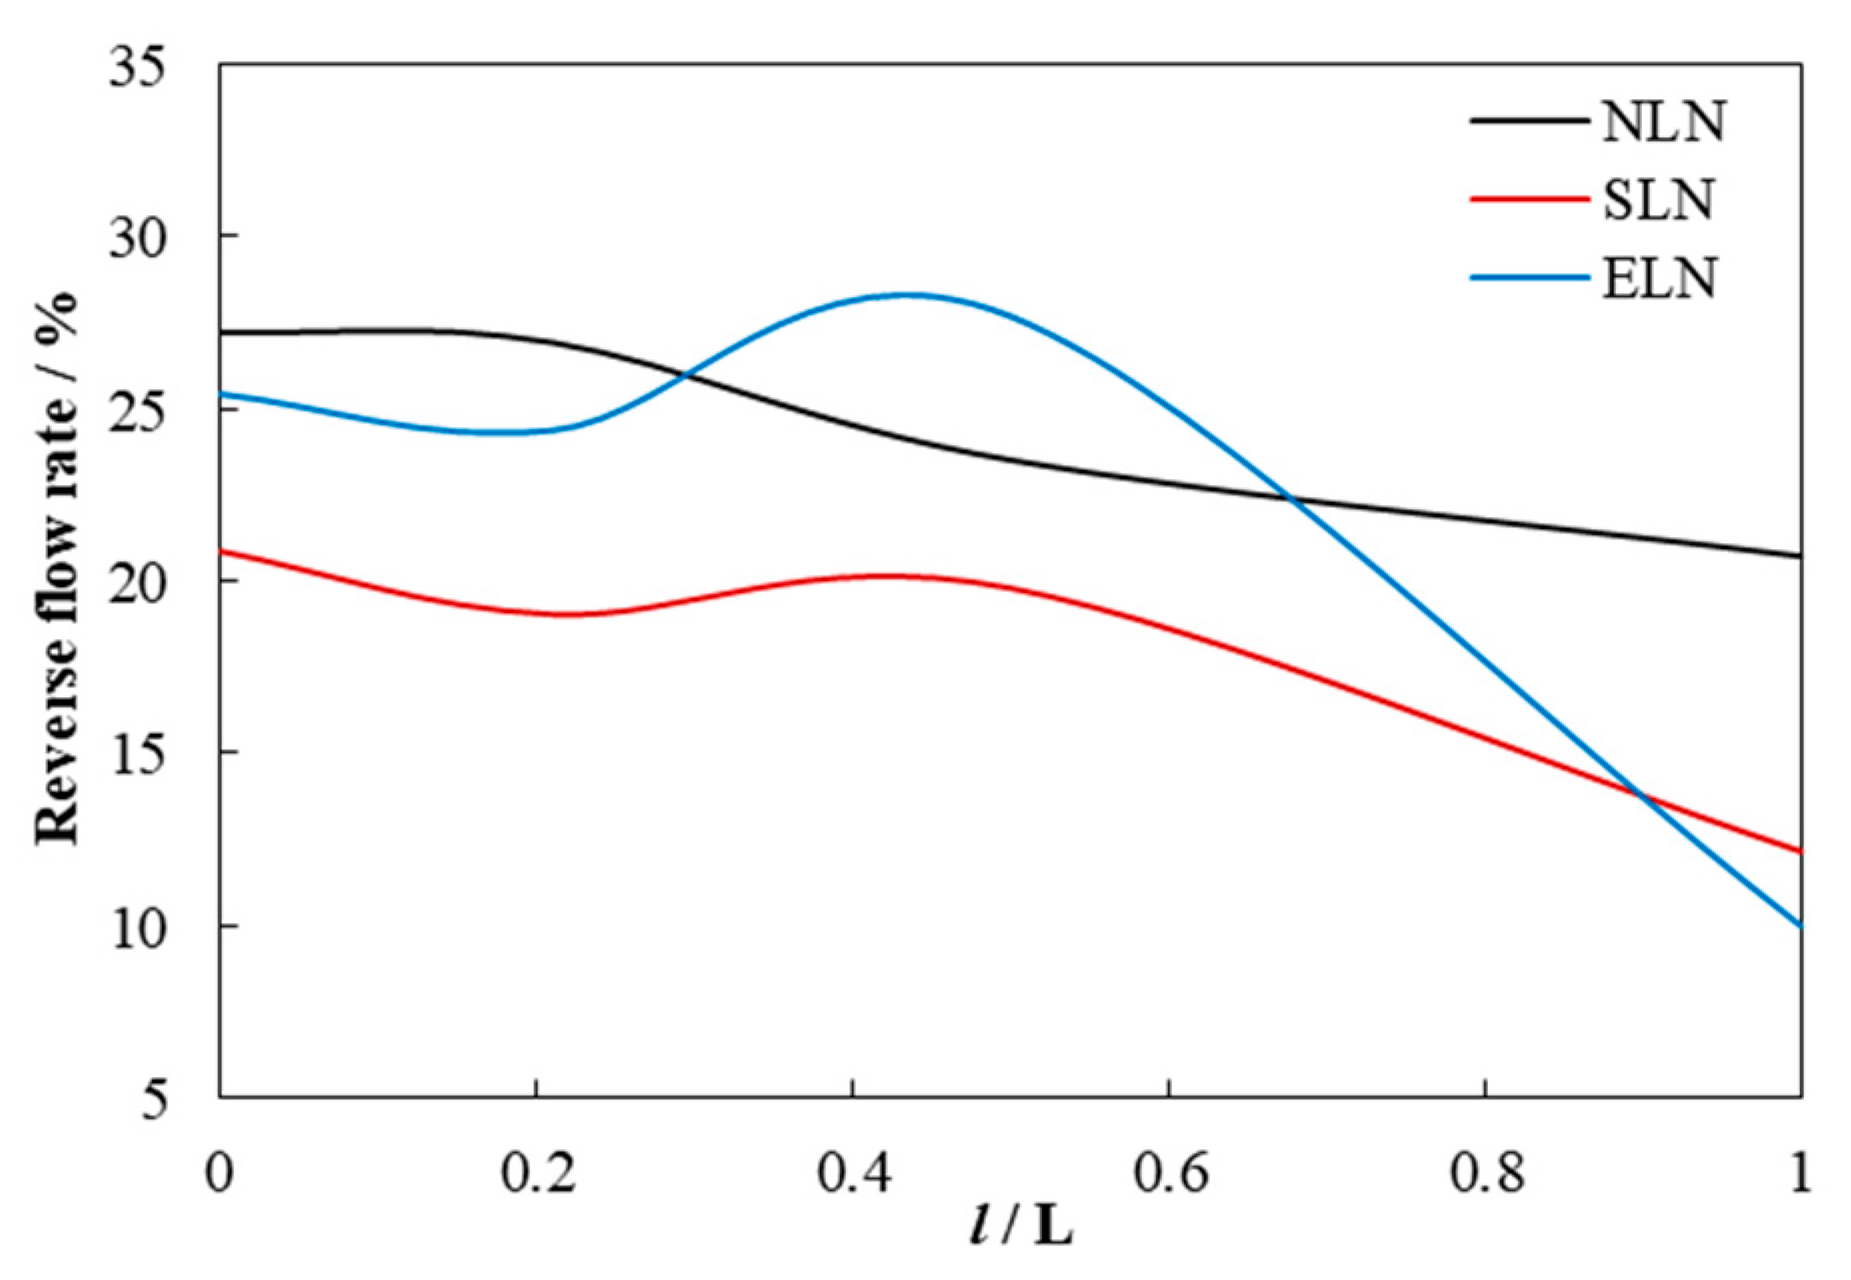
The mainstream velocity and reverse flow velocity downstream of the blade gradually decrease, and the reverse flow rate fluctuates slightly, but the overall trend is downward, as shown in Figure 20, Figure 21 and Figure 22.
For NLN, the decrease rate of mainstream velocity changes from fast to slow, while the decrease rate of reverse flow velocity changes from slow to fast. The reverse flow rate first remains unchanged, then decreases rapidly and finally decreases slowly. For SLN, the mainstream velocity, reverse flow velocity and reverse flow decrease rate are always smaller than those of NLN. The reverse flow rate decreased at the blade outlet, then increased slightly, and finally decreased. For ELN, the mainstream velocity and reverse flow velocity are greater than that of NLN, and the peak value of the reverse flow rate is greater than NLN. The decrease rate of the mainstream velocity near the blade outlet is slightly smaller than that of NLN, and the subsequent decrease rate of the mainstream velocity is significantly larger than that of NLN. The decrease rate of the reverse flow velocity is always smaller than that of NLN. The rate of reverse flow rate in the descending section is greater than that of NLN. It can be seen that the locking nut reduces the decrease rate of the mainstream and reverse flow at the blade outlet and increases the decrease rate of the reverse flow rate at the blade outlet. It makes a short increase in the reverse flow rate in the downstream middle section, and the subsequent decline rate of the reverse flow rate also increases significantly.
The downstream radial velocity distribution shows that downstream of the main impacted flow passage 1 is a high-velocity zone, which is distributed in a long strip along the flow passage, as shown in Figure 23, Figure 24 and Figure 25. There is a negative velocity region in the upper half of the downstream of some flow passages, which is almost equivalent to the mainstream velocity, and it is an ellipse that inclines downward along the rotation direction of the runner. The negative velocity region is the reverse flow region, which is elliptical, mainly due to the high-speed jet flow in flow passage 1. Part of the jet flow does not obtain enough circumferential velocity in the downstream to the runner outlet and directly rushes into the opposite flow passage to form a reverse flow. There are also some reverse flow regions formed by reverse vortices formed by diversions that do not flow into the mainstream.
For NLN, the high-velocity zone in the downstream of flow passage 1 shrinks longitudinally and expands slightly in the circumferential direction in the mainstream direction, and the high-velocity decreases significantly, as shown in Figure 23. The elliptical reverse flow region appears in the upper part of the downstream of flow passages 5 to 9 and gradually moves down along the mainstream direction and expands slightly in the circumferential direction. The reverse flow region occurs at the top of the downstream of flow passages 3 and 11 and gradually disappears along the mainstream direction. The reverse flow region also occurs in the downstream of flow passage 4, gradually expanding longitudinally and circumferentially along the mainstream direction to form a long strip of reverse flow region. For SLN, the range of high-velocity zone in the downstream of flow passage 1 is slightly smaller than that of NLN, and the high-velocity value is also significantly reduced, as shown in Figure 24. The range of the reverse flow region is slightly reduced compared to that of NLN, and the location of the elliptical reverse flow region is essentially the same as that of NLN, with a slightly greater degree of downward movement along the mainstream than that of NLN. The top of the downstream of flow passage 3 and the downstream of flow passage 4 do not show a reverse flow region. The reverse flow region at the top of the downstream of flow passage 11 is slightly smaller than that of NLN. For ELN, the high-velocity zone in the downstream of flow passage 1 has an additional top region compared to the NLN and penetrates the downstream of flow passage 1 longitudinally, as shown in Figure 25. The elliptical reverse flow region appears in the upper part of the downstream of flow passages 5 to 9, which moves about three blade flow passage widths in the opposite direction of the runner rotation compared to that of NLN but generates little displacement along the main flow direction. A new reverse flow region appears at the bottom of the downstream of flow passages 5 to 11 compared to NLN, and the reverse flow region at the bottom of the downstream of flow passage 5 gradually expands into the upper half of the elliptical reverse flow region. It can be seen that the locking nut can effectively reduce the reverse flow at the top of the downstream, but ELN will cause the reverse flow at the bottom of the downstream.

3.4.3. Vorticity Distribution of Blade Downstream

The head loss within the rotor is mainly used to maintain the vortex motion, and characterizing the vortex motion in terms of vortex intensity can more intuitively demonstrate the different degrees of head loss due to the different downstream structures of the blade [30]. Vortex intensity was characterized by velocity invariant Q, and the definition of Q is:
Q = C Q Ω 2 S 2
where S is the absolute value of the strain rate, and Ω is the absolute value of vorticity. When the velocity invariant Q > 0, it indicates that the rotation rate of the fluid in this region is greater than the strain rate, and the flow vortex structure is dominant.
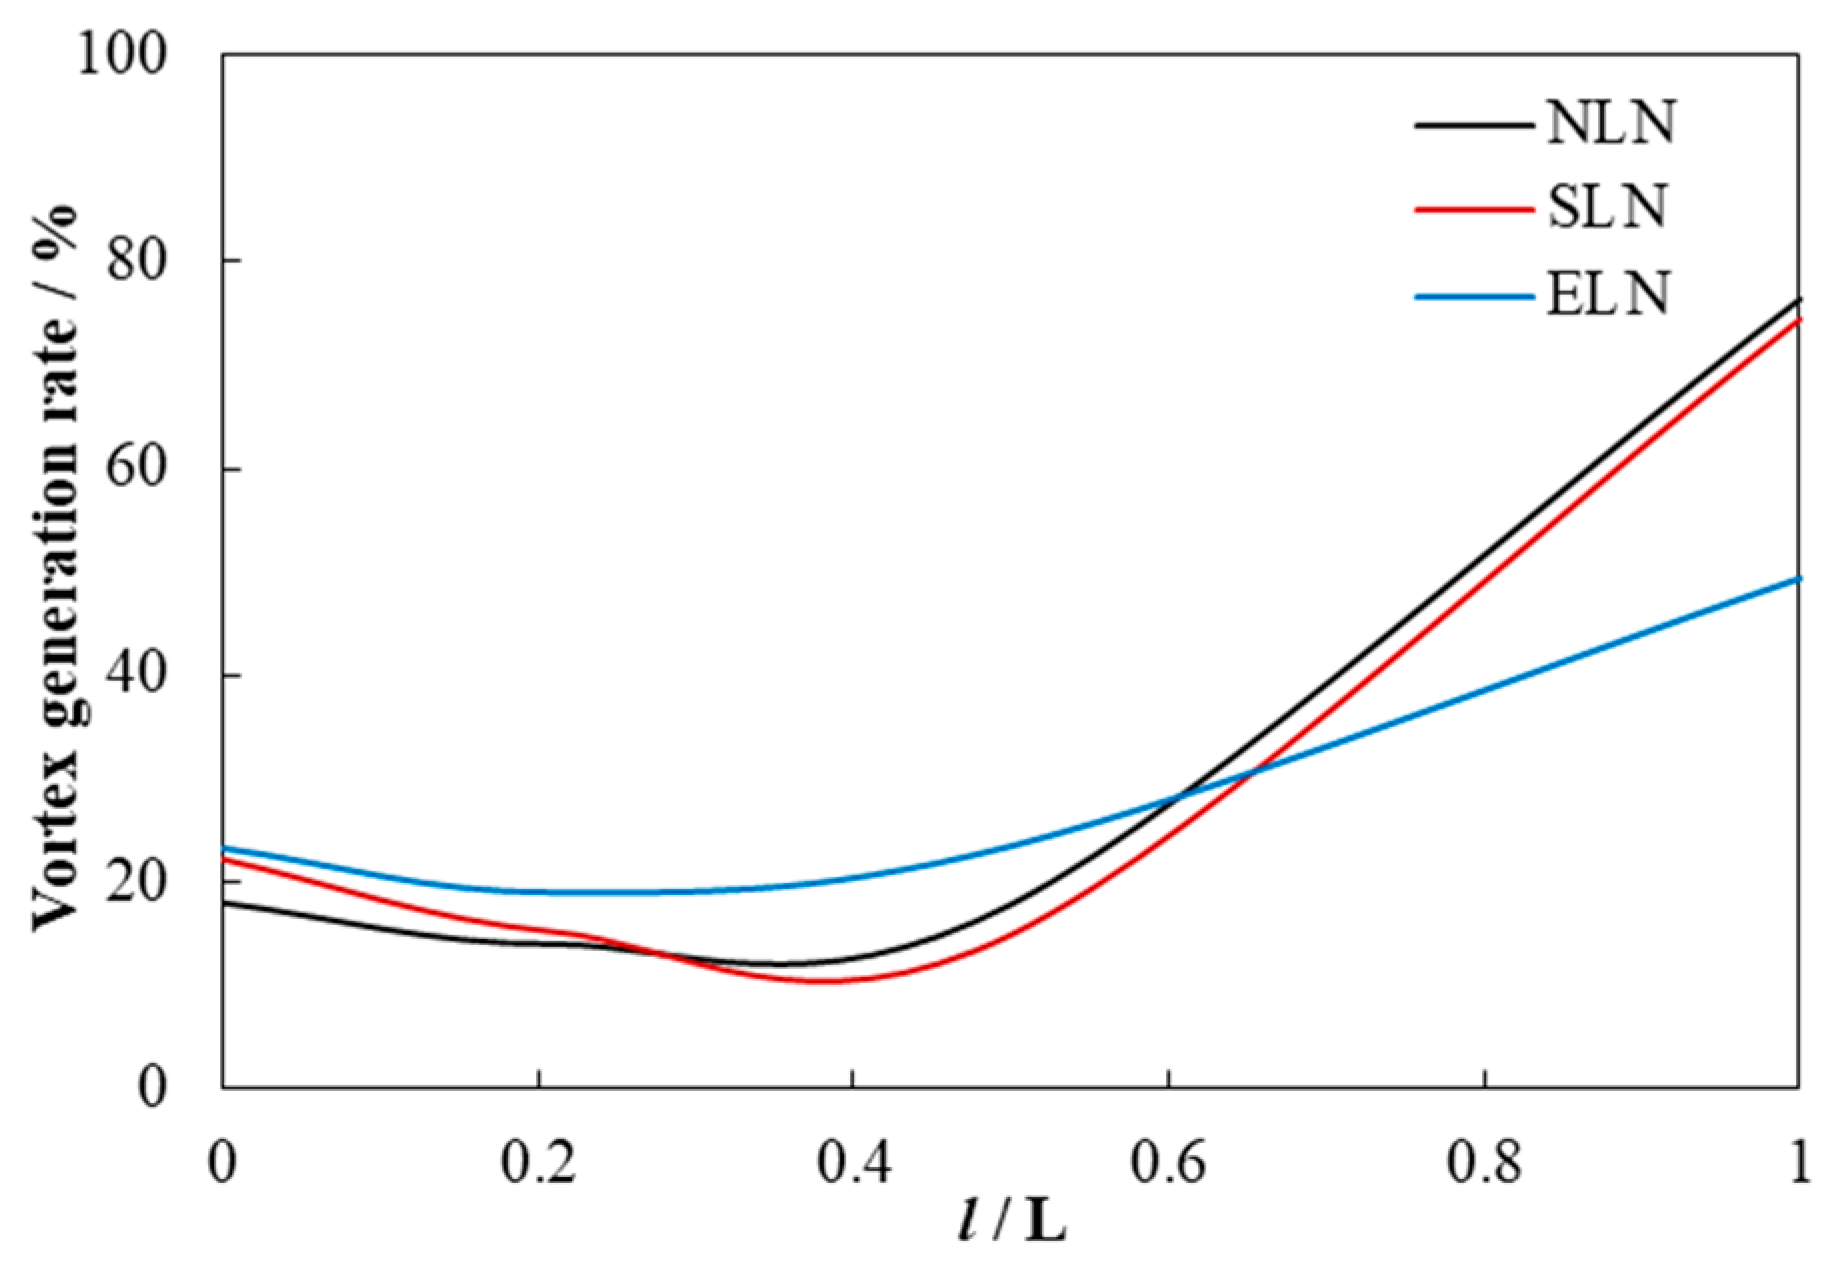
The downstream vortex intensity increases first and then decreases, and a peak appears. The vortex generation first decreases and then increases, and there is a trough, as shown in Figure 26 and Figure 27. For NLN, the downstream vortex intensity experiences an increase followed by a decrease and then an increase. And the increase rate in the first section is greater than that in the latter section. The vortex generation rate first slightly decreases and then increases. Both vortex intensity and vortex generation rate gradually increase in the second half of the downstream where the flow direction changes from radial to axial. For SLN, the downstream vortex strength experiences an increase and then a decrease, with the rate of decrease changing from fast to slow. The intensity of the blade outlet vortex is less than that of NLN, the increase rate is basically the same as that of NLN, the decrease rate is slightly less than that of NLN, and the inflection point value is less than that of NLN. The vortex generation rate first decreases slightly and then increases, and the trend is consistent with that of NLN, but the decrease rate is slightly larger than that of NLN. There is no vortex intensity re-increase process, and both the vortex intensity and vortex generation rate at the runner outlet are less than those of NLN. For ELN, the downstream vortex intensity experiences an increase and then a decrease, and the rate of decrease remains basically the same. The intensity of the blade outlet vortex is less than that of NLN, the increase rate is basically the same as that of NLN, and the peak and decrease rates are less than those of NLN. The vortex generation rate is slightly decreasing and then increasing, the trend is consistent with that of NLN, but the increase rate is obviously smaller than that of NLN. There is no vortex intensity re-increasing process, and both the vortex intensity and vortex generation rate at the rotor outlet are less than those of NLN, but the vortex intensity is greater than that of SLN. It can be seen that the locking nut reduces the vortex intensity of the blade outlet and the runner outlet so that the vortex intensity does not increase again. SLN increases the decrease rate of the vortex generation rate, while ELN decreases the increase rate of the vortex generation rate.
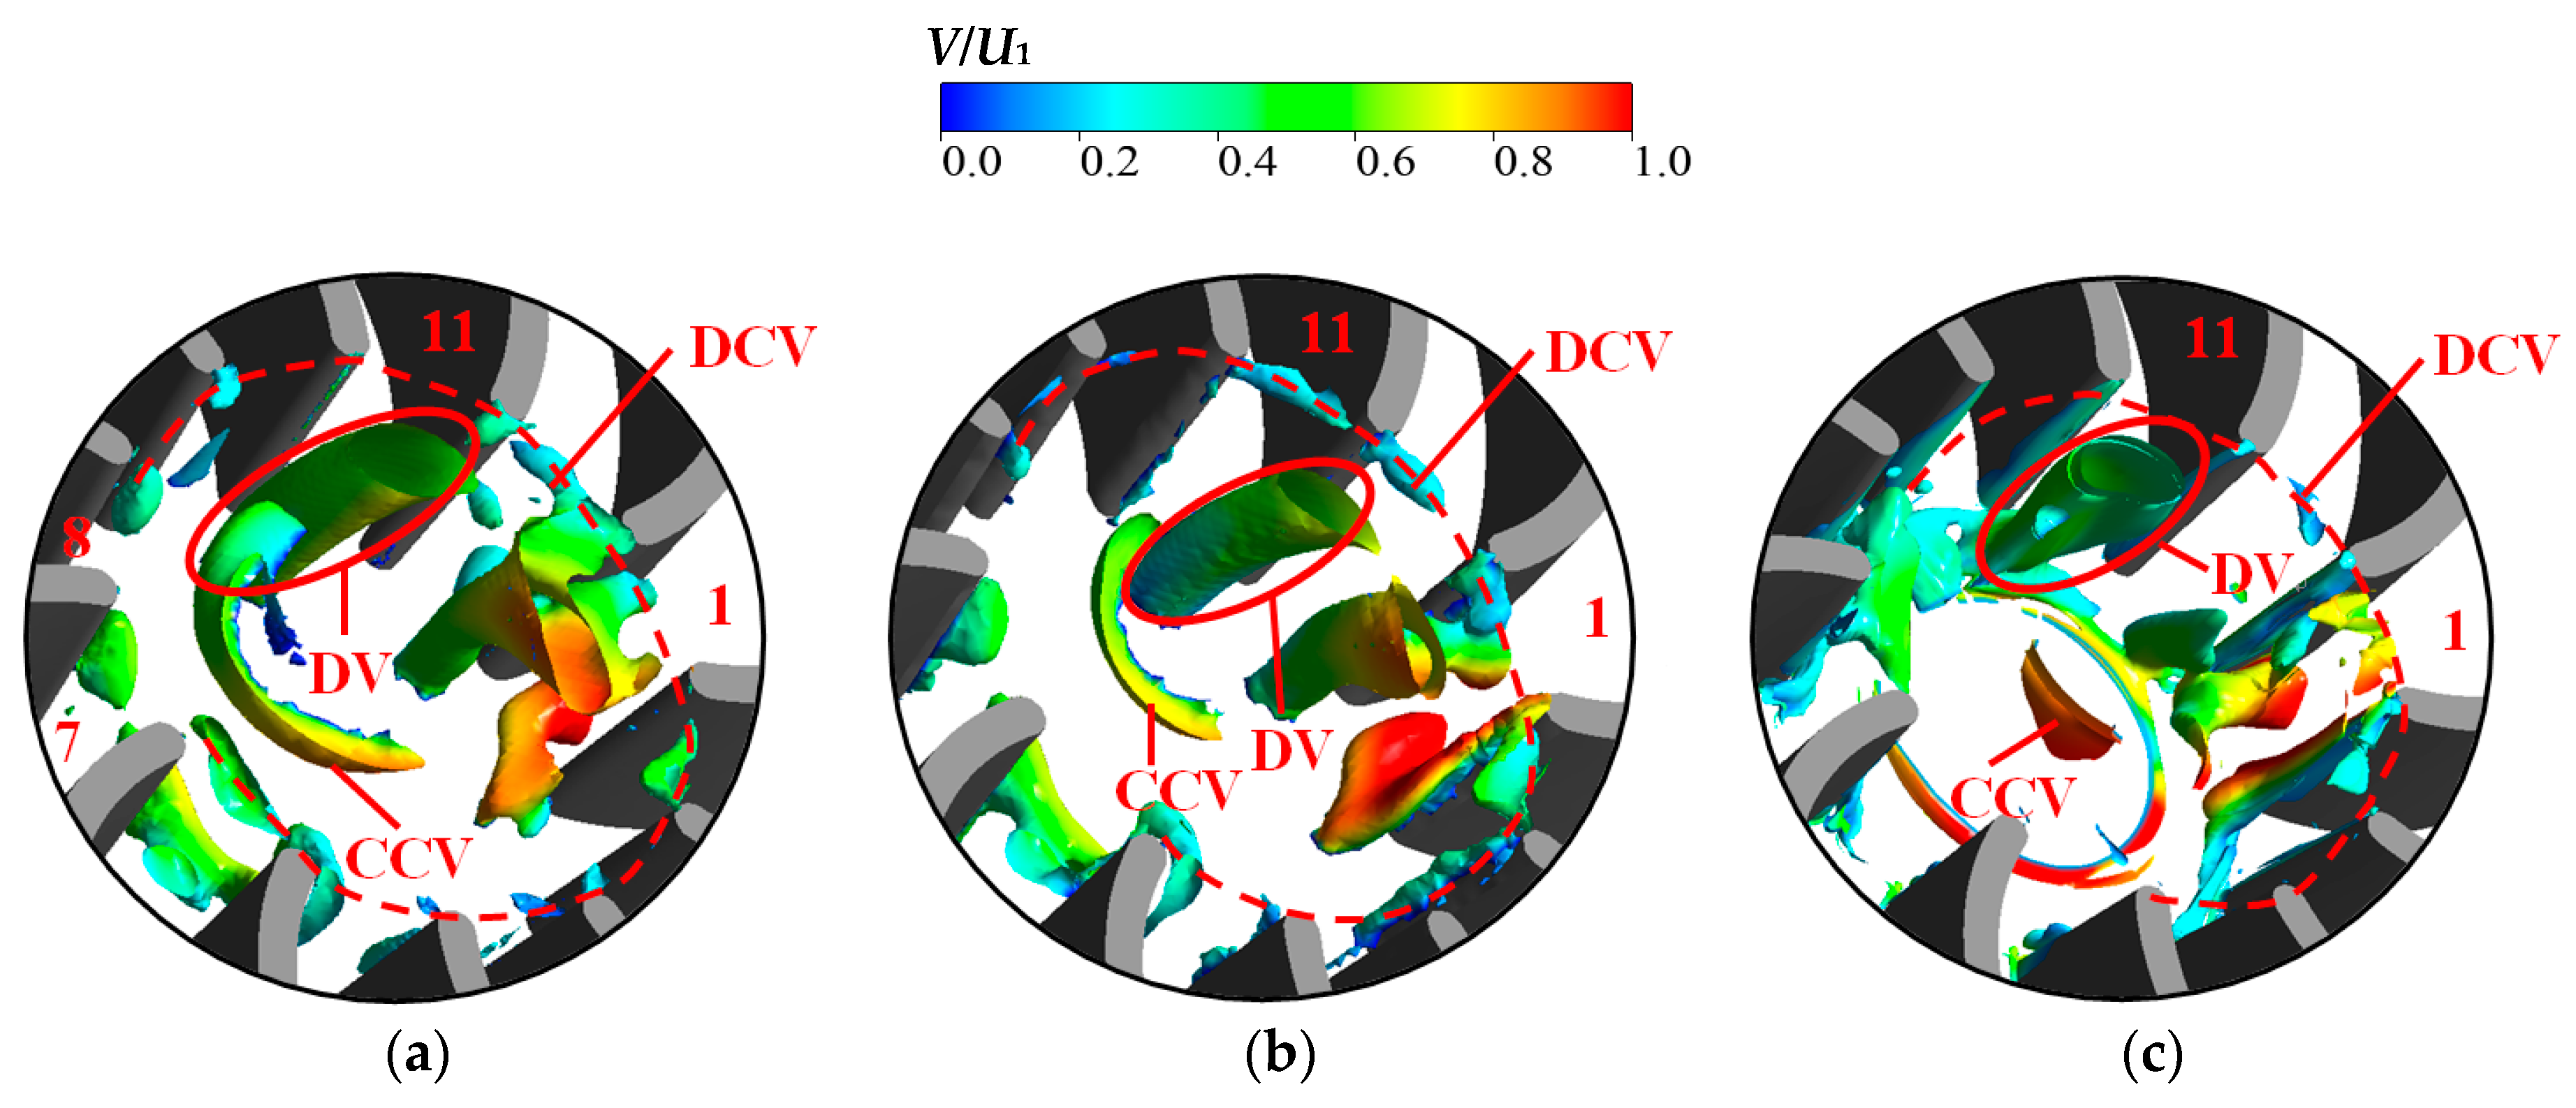
The vortex distribution expressed by the Q criterion method is shown in Figure 28, and the actual value of Q is 2000 s−2. There are C-type radially distributed vortices at the top of the blade outlet and the runner outlet. The C-type vortex at the top of the blade outlet is discontinuously distributed, the C-type vortex at the runner outlet is continuously distributed, and the opening directions of the two C-type vortices are opposite. There is a DV in the downstream of flow passage 11, which penetrates longitudinally. On both sides of the downstream of flow passage 1, there are irregularly distributed vortices in the lower part of some channels. For NLN, the discontinuous C-type vortex (DCV) does not appear only in the downstream of flow passages 7 and 8. The continuous C-type vortex (CCV) corresponded to the downstream position of about three flow passages. The vortices on both sides of the outlet of flow passage 1 are obviously separated at the bottom and gradually merge into larger vortices after reaching the top, which blocks the outflow of flow passage 1. The vortex rope formed by DV is slightly deflected along the direction of runner rotation. For SLN, the DCV is slightly smaller than that of NLN and does not appear in the downstream of flow passages 6 to 8. The CCV corresponds to the downstream position of about two flow passages, which is slightly smaller than that of NLN. The vortices on both sides of the outlet of flow passage 1 are separated from each other from the bottom to the top, which is smaller than the overall vortex volume of NLN and does not block the outflow of flow passage 1. The size of DV is slightly smaller than that of NLN. For ELN, the DCV is significantly smaller than that of NLN and does not appear in the downstream of flow passages 5 to 8. The CCV corresponds to the downstream position of about one flow passage, which is significantly smaller than that of NLN. The vortices on both sides of the outlet of flow passage 1 are more scattered and smaller than those of NLN and do not block the outflow of flow passage 1. The vortex rope formed by DV is barely deflected. There is a new annular vortex generated at the bottom of the middle downstream. It can be seen that the locking nut reduces the C-type vortices at the top of the blade outlet and the runner outlet and weakens the vortex at the outlet of the flow passage 1. However, the ELN generates new vortices to cause additional head loss, and most of the newly generated vortices are distributed at the bottom of the downstream.
The strong vortex region in the downstream gradually develops from the top of the blade outlet and the lower part of the downstream of flow passage 1 to the middle and lower parts of the downstream along the mainstream direction, as shown in Figure 29, Figure 30 and Figure 31. For NLN, the strong vortex zone initially appears almost at the top of each flow passage outlet and the lower part of flow passage 1, as shown in Figure 29. Then it develops along the mainstream direction to the middle of the downstream, and the strong vortex zone at the top of the flow passage outlet disappears. There are elliptical strong vortex areas in the upper and lower parts of the downstream of flow passage 1, and in the lower part of the downstream of flow passages 7 and 8. Furthermore, there is a long strip strong vortex zone in the lower part of the downstream of flow passage 4. For SLN, the strong vortex zone initially appears only at the top of very few flow passage outlets, which is significantly smaller than that of NLN, as shown in Figure 30. The strong vortex region in the lower part of the downstream of flow passage 1 is slightly smaller than that of NLN. Then, it develops along the mainstream direction to the middle of the downstream, and the elliptical strong vortex zones in the upper part of the downstream of flow passage 1 and the lower part of the downstream of flow passages 7 and 8 are significantly larger than that of NLN. There is no strong vortex zone in the downstream of flow passage 4, but the elliptical strong vortex zone in the lower part of flow passage 1 increases. For ELN, the strong vortex zone initially appears at the top of most flow passage outlets, which is significantly smaller than that of NLN, as shown in Figure 31. The strong vortex zone in the lower part of the downstream of flow passage 1 is significantly increased compared to that of NLN. Then it develops along the mainstream direction to the middle of the downstream, the strong vortex zone in the downstream of flow passage 1 are larger than that of NLN, and the upper and lower parts are almost connected. The rest of the corresponding strong vortex zones do not appear, and the new strong vortex zones appear downstream of flow passage 12 and almost the lower part of the downstream of each flow passage. It can be seen that the locking nut reduces the strong vortex zone in the downstream of flow passage 4. The effect of SLN on reducing the strong vortex zone at the top of the blade and downstream of flow passage 1 is significantly better than that of ELN, and ELN increases the strong vortex zone at the bottom.

4. Conclusions

In this work, the flow field characteristics of different blade downstream structures, namely NLN, SLN and ELN structures, are investigated. The research results are as follows:
(1)
The downstream flow of the runner is mainly the rotating flow around the hub in the runner domain, and the ideal outlet flow is axial. Therefore, the transition from radial flow to axial flow should be completed downstream of the runner. The high-velocity flow at the outlet of flow passage 1 causes the downstream confluence in the opposite direction, resulting in the outlet vortex and the reverse flow of some flow passages, and these unsteady flows increase the flow losses. The installation of the locking nut downstream of the runner is an important measure to mitigate these unstable flows, and its existence cannot be ignored.
(2)
The small locking nut effectively improves the flow pattern downstream of the runner blade, reduces flow losses and pressure gradients, makes the pressure distribution more uniform, reduces the range of sub-high-pressure zone, and shifts the center of the sub-high-pressure zone upward longitudinally. It makes the outflow of the main impacted flow passage produce less confluence in the opposite direction. There are different degrees of inhibition effects on DV, OV and RF, with the number of OV significantly reduced, the size of DV significantly reduced or even disappeared, and the reversed flow zone at the downstream top reduced. The decrease rate of vortex generation rate is increased, the strong vortex zone at the top of the blade and the downstream of flow passage 1 is reduced, the length of the C-type vortex is shortened, and the vortex at the outlet of the flow passage 1 is weakened.
(3)
The extended locking nut causes greater hydraulic losses downstream of the runner blade but has a certain improvement effect on the unstable flow phenomenon, especially the vortex. It enlarges the range of the high-pressure zone, increases the reverse flow region at the outlet of the blade flow passage, causes the reverse flow at the bottom of the downstream, produces new vortices, and increases the vortex intensity. However, it also inhibits the generation and development of reverse flow and vortex. The vortex intensity near the blade and runner outlet is reduced, the vortex intensity does not experience the process of re-increase, and the growth rate of the vortex generation rate is reduced. The C-type vortex is reduced, the vortex at the outlet of flow passage 1 is weakened, and the weakening effect is better than that of SLN.

Author Contributions

Conceptualization, L.T.; methodology, W.W.; software, Z.W.; validation, C.Z.; investigation, W.W.; resources, L.T. and S.Y.; data curation, Z.W.; writing—original draft preparation, L.T. and W.W.; writing—review and editing, L.T. and S.Y.; supervision, S.Y.; project administration, L.T. and S.Y.; funding acquisition, L.T. and S.Y. All authors have read and agreed to the published version of the manuscript.

Funding

This research was funded by the National Natural Science Foundation of China, grant number 52109105, the Jiangsu Association for Science and Technology Young Science and Technology Talent Support Project, grant number JSTJ-2023-XH029, and the National Key Research and Development Program of China, grant number 2023YFD1900704-02.

Data Availability Statement

The data that support the findings of this study are available on request from the corresponding author, [L.T.], upon reasonable request.

Conflicts of Interest

The authors declare no conflicts of interest. The funders had no role in the design of the study; in the collection, analyses, or interpretation of data; in the writing of the manuscript; or in the decision to publish the results.

References

  1. Božić, I. A novel energy losses dependence on integral swirl flow parameters in an elbow draft tube of a Kaplan turbine. Renew. Energy 2021, 175, 550–558. [Google Scholar] [CrossRef]
  2. Cheng, H.; Zhou, L.; Liang, Q.; Guan, Z.; Liu, D.; Wang, Z.; Kang, W. A method of evaluating the vortex rope strength in draft tube of Francis turbine. Renew. Energy 2020, 152, 770–780. [Google Scholar] [CrossRef]
  3. Mulu, B.G.; Cervantes, M.J.; Devals, C.; Vu, T.C.; Guibault, F. Simulation-based investigation of unsteady flow in near-hub region of a Kaplan Turbine with experimental comparison. Eng. Appl. Comput. Fluid Mech. 2015, 9, 139–156. [Google Scholar] [CrossRef]
  4. Goyal, R. Vortex core formation in a Francis turbine during transient operation from best efficiency point to high load. Phys. Fluids 2020, 32, 074109. [Google Scholar] [CrossRef]
  5. Schiffer, J.; Benigni, H.; Jaberg, H. An analysis of the impact of draft tube modifications on the performance of a Kaplan turbine by means of computational fluid dynamics. Proc. Inst. Mech. Eng. Part C J. Mech. Eng. Sci. 2018, 232, 1937–1952. [Google Scholar] [CrossRef]
  6. Takamure, K.; Uchiyama, T.; Horie, K.; Nakayama, H. Effect of cone on efficiency improvement of a self-powered IoT-based hydro turbine. Adv. Mech. Eng. 2022, 14, 16878132221107249. [Google Scholar] [CrossRef]
  7. Qian, Z.D.; Li, W.; Huai, W.X.; Wu, Y.L. The effect of runner cone design on pressure oscillation characteristics in a Francis hydraulic turbine. Proc. Inst. Mech. Eng. Part A J. Power Energy 2011, 226, 137–150. [Google Scholar] [CrossRef]
  8. Khullar, S.; Singh, K.M.; Cervantes, M.J.; Gandhi, B.K. Influence of runner cone profile and axial water jet injection in a low head Francis turbine at part load. Sustain. Energy Technol. Assess. 2022, 50, 101810. [Google Scholar] [CrossRef]
  9. Li, D.; Yu, L.; Yan, X.; Wang, H.; Shi, Q.; Wei, X. Runner cone optimization to reduce vortex rope-induced pressure fluctuations in a Francis turbine. Sci. China Technol. Sci. 2021, 64, 1953–1970. [Google Scholar] [CrossRef]
  10. Gogstad, P.J.; Dahlhaug, O.G. Evaluation of runner cone extension to dampen pressure pulsations in a Francis model turbine. IOP Conf. Ser. Earth Environ. Sci. 2016, 49, 082019. [Google Scholar] [CrossRef]
  11. Khullar, S.; Kumar, S.; Singh, K.M.; Cervantes, M.J.; Gandhi, B.K. Influence of the runner cone design on the pressure fluctuations in the draft tube of a low head Francis turbine. IOP Conf. Ser. Earth Environ. Sci. 2021, 774, 012110. [Google Scholar] [CrossRef]
  12. Sano, T.; Maekawa, M.; Okamoto, N.; Yano, H.; Miyagawa, K. Investigation of flow pattern downstream of spiral grooved runner cone in pump-turbine. IOP Conf. Ser. Earth Environ. Sci. 2012, 15, 022019. [Google Scholar] [CrossRef]
  13. Su, W.-T.; Li, X.-B.; Xu, Y.-N.; Gong, R.-Z.; Binama, M.; Muhirwa, A. The influence of runner cone perforation on the draft tube vortex in Francis hydro-turbine. Therm. Sci. 2018, 22, 557–566. [Google Scholar] [CrossRef]
  14. Qin, Y.; Li, D.; Zhang, N.; Wang, H.; Shi, Q.; Wei, X. Runner cone drilling and slotting to reduce vortex rope-induced pressure fluctuations in a Francis turbine. Proc. Inst. Mech. Eng. Part A J. Power Energy 2023, 237, 1762–1774. [Google Scholar] [CrossRef]
  15. Zhou, X.; Wu, H.; Cheng, L.; Huang, Q.; Shi, C. A new draft tube shape optimisation methodology of introducing inclined conical diffuser in hydraulic turbine. Energy 2023, 265, 126374. [Google Scholar] [CrossRef]
  16. Zhou, X.; Shi, C.; Miyagawa, K.; Wu, H. Effect of modified draft tube with inclined conical diffuser on flow instabilities in Francis turbine. Renew. Energy 2021, 172, 606–617. [Google Scholar] [CrossRef]
  17. Szakal, R.-A.; Doman, A.; Muntean, S. Influence of the Reshaped Elbow on the Unsteady Pressure Field in a Simplified Geometry of the Draft Tube. Energies 2021, 14, 1393. [Google Scholar] [CrossRef]
  18. Arispe, T.M.; de Oliveira, W.; Ramirez, R.G. Francis turbine draft tube parameterization and analysis of performance characteristics using CFD techniques. Renew. Energy 2018, 127, 114–124. [Google Scholar] [CrossRef]
  19. Kc, A.; Lee, Y.H.; Thapa, B. CFD study on prediction of vortex shedding in draft tube of Francis turbine and vortex control techniques. Renew. Energy 2016, 86, 1406–1421. [Google Scholar] [CrossRef]
  20. Chen, Z.; Baek, S.-H.; Cho, H.; Choi, Y.-D. Optimal design of J-groove shape on the suppression of unsteady flow in the Francis turbine draft tube. J. Mech. Sci. Technol. 2019, 33, 2211–2218. [Google Scholar] [CrossRef]
  21. Zhou, X.; Wu, H.-G.; Shi, C.-Z. Numerical and experimental investigation of the effect of baffles on flow instabilities in a Francis turbine draft tube under partial load conditions. Adv. Mech. Eng. 2019, 11, 1687814018824468. [Google Scholar] [CrossRef]
  22. Zhu, L.; Zhang, R.-Z.; Yu, A.; Lu, L.; Luo, X.-W. Suppression of vortex rope oscillation and pressure vibrations in Francis turbine draft tube using various strategies. J. Hydrodyn. 2021, 33, 534–545. [Google Scholar] [CrossRef]
  23. Abu Shahzer, M.; Kim, S.-J.; Cho, Y.; Kim, J.-H. Suppression of vortex rope formation and pressure fluctuation using anti-swirl fins in a Francis turbine model at part load condition with cavitation inception point. Phys. Fluids 2022, 34, 097106. [Google Scholar] [CrossRef]
  24. Urbana, O.; Kurková, M.; Pochylý, F. Mitigation of swirling flow with a vortex rope by passive installations—Theory, simulations, and experiments. Phys. Fluids 2022, 34, 124111. [Google Scholar] [CrossRef]
  25. Abu Shahzer, M.; Cho, Y.; Shamsuddeen, M.M.; Kim, J.-H. Investigation of cavitating vortex rope instabilities and its suppression inside a Francis turbine model with Thoma number variation. Phys. Fluids 2023, 35, 033310. [Google Scholar] [CrossRef]
  26. Kim, S.-J.; Choi, Y.-S.; Cho, Y.; Choi, J.-W.; Hyun, J.-J.; Joo, W.-G.; Kim, J.-H. Effect of Fins on the Internal Flow Characteristics in the Draft Tube of a Francis Turbine Model. Energies 2020, 13, 2806. [Google Scholar] [CrossRef]
  27. Skripkin, S.; Zuo, Z.; Tsoy, M.; Kuibin, P.; Liu, S. Oscillation of Cavitating Vortices in Draft Tubes of a Simplified Model Turbine and a Model Pump–Turbine. Energies 2022, 15, 2965. [Google Scholar] [CrossRef]
  28. Khozaei, M.H.; Favrel, A.; Miyagawa, K. On the generation mechanisms of low-frequency synchronous pressure pulsations in a simplified draft-tube cone. Int. J. Heat Fluid Flow 2022, 93, 108912. [Google Scholar] [CrossRef]
  29. Foroutan, H.; Yavuzkurt, S. Flow in the Simplified Draft Tube of a Francis Turbine Operating at Partial Load—Part I: Simulation of the Vortex Rope. J. Appl. Mech. 2014, 81, 061010. [Google Scholar] [CrossRef]
  30. Qin, Y.-L.; Li, D.-Y.; Wang, H.-J.; Liu, Z.-S.; Wei, X.-Z.; Wang, X.-H. Investigation on the relationship between hydraulic loss and vortex evolution in pump mode of a pump-turbine. J. Hydrodyn. 2022, 34, 555–569. [Google Scholar] [CrossRef]
  31. Zeng, H.; Li, Z.; Li, D.; Chen, H.; Li, Z. Vortex distribution and energy loss in S-shaped region of pump turbine. Front. Energy Res. 2022, 10, 904202. [Google Scholar] [CrossRef]
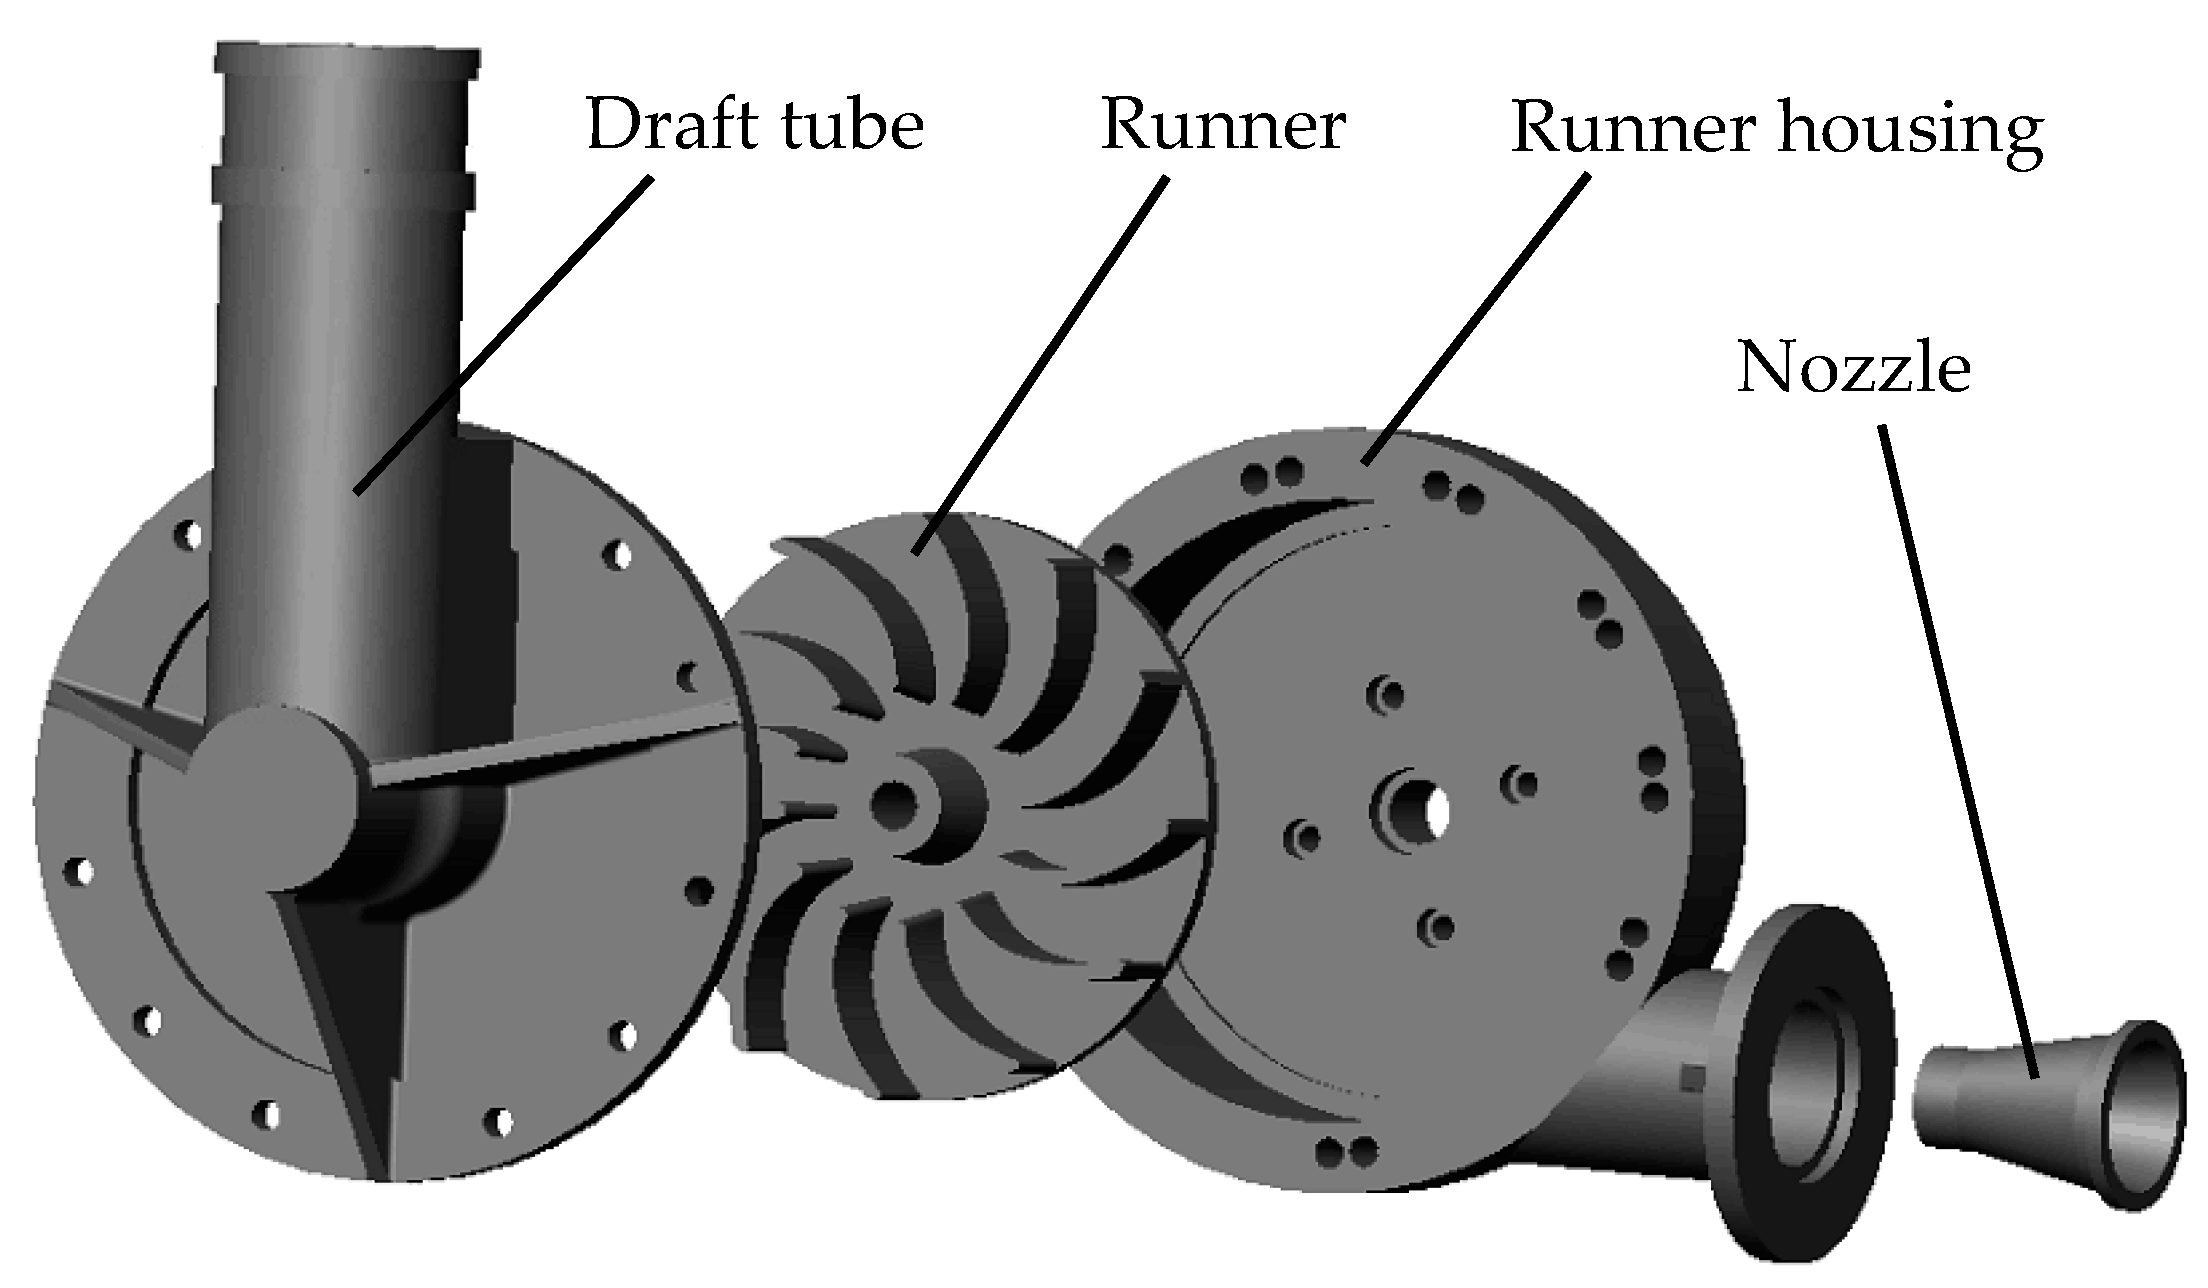
Figure 1. Water turbine structure.
Machines 12 00392 g001
Figure 2. Downstream structures of the runner. (a) NLN; (b) SLN; (c) ELN.
Machines 12 00392 g002
Figure 3. Hexahedral mesh of the small-sized water turbine. (a) Water turbine; (b) runner blade; (c) draft tube (ELN).
Machines 12 00392 g003
Figure 4. Water turbine performance test bench.
Machines 12 00392 g004
Figure 5. Comparison of numerical predictions of water turbine performance with test results.
Machines 12 00392 g005
Figure 6. Comparison of numerical hydraulic performance under different locking nuts.
Machines 12 00392 g006
Figure 7. Blade downstream division diagram.
Machines 12 00392 g007
Figure 8. Head loss of blade downstream.
Machines 12 00392 g008
Figure 9. Radial flow field of blade downstream. (a) The blade downstream region with different radial surfaces; (b) position of the blade downstream in relation to the nozzle (fixed position for analysis).
Machines 12 00392 g009
Figure 10. Radial pressure distributions for NLN. (a) Span = 0.1; (b) span = 0.5; (c) span = 0.9.
Machines 12 00392 g010
Figure 11. Radial pressure distributions for SLN. (a) Span = 0.1; (b) span = 0.5; (c) span = 0.9.
Machines 12 00392 g011
Figure 12. Radial pressure distributions for ELN. (a) Span = 0.1; (b) span = 0.5; (c) span = 0.9.
Machines 12 00392 g012
Figure 13. Radial streamline of swirling flow for NLN. (a) Span = 0.1; (b) span = 0.5; (c) span = 0.9.
Machines 12 00392 g013
Figure 14. Radial streamline of swirling flow for SLN. (a) Span = 0.1; (b) span = 0.5; (c) span = 0.9.
Machines 12 00392 g014
Figure 15. Radial streamline of swirling flow for ELN. (a) Span = 0.1; (b) span = 0.5; (c) span = 0.9.
Machines 12 00392 g015
Figure 16. Average pressure variation along the flow direction of the blade downstream. (L is the length from inlet to outlet in the runner in the streamwise direction when the span is 0.5, and l is the distance from the runner inlet in L, l/L = 0 means at the runner inlet, l/L = 1 means at the runner outlet).
Machines 12 00392 g016
Figure 17. Pressure distribution of the circumferential flow field along the flow direction for NLN. (a) S1 (l/L = 0); (b) S2 (l/L = 0.5).
Machines 12 00392 g017
Figure 18. Pressure distribution of the circumferential flow field along the flow direction for SLN. (a) S1 (l/L = 0); (b) S2 (l/L = 0.5).
Machines 12 00392 g018
Figure 19. Pressure distribution of the circumferential flow field along the flow direction for ELN. (a) S1 (l/L = 0); (b) S2 (l/L = 0.5).
Machines 12 00392 g019
Figure 20. Mainstream velocity of blade downstream (U1 is the runner inlet circumferential velocity).
Machines 12 00392 g020
Figure 21. Reverse flow velocity of blade downstream.
Machines 12 00392 g021
Figure 22. Reverse flow rate of blade downstream.
Machines 12 00392 g022
Figure 23. Radial velocity distribution of the circumferential flow field along the flow direction for NLN. (a) S1 (l/L = 0); (b) S2 (l/L = 0.5).
Machines 12 00392 g023
Figure 24. Radial velocity distribution of the circumferential flow field along the flow direction for SLN. (a) S1 (l/L = 0); (b) S2 (l/L = 0.5).
Machines 12 00392 g024
Figure 25. Radial velocity distribution of the circumferential flow field along the flow direction for ELN. (a) S1 (l/L = 0); (b) S2 (l/L = 0.5).
Machines 12 00392 g025
Figure 26. Vortex intensity of the blade downstream.
Machines 12 00392 g026
Figure 27. Vortex generate rate of the blade downstream.
Machines 12 00392 g027
Figure 28. Vortex distribution of blade downstream. (a) NLN; (b) SLN; (c) ELN.
Machines 12 00392 g028
Figure 29. Vortex intensity of the circumferential flow field along the flow direction for NLN. (a) S1 (l/L = 0); (b) S2 (l/L = 0.5).
Machines 12 00392 g029
Figure 30. Vortex intensity of the circumferential flow field along the flow direction for SLN. (a) S1 (l/L = 0); (b) S2 (l/L = 0.5).
Machines 12 00392 g030
Figure 31. Vortex intensity of the circumferential flow field along the flow direction for ELN. (a) S1 (l/L = 0); (b) S2 (l/L = 0.5).
Machines 12 00392 g031
Table 1. The operating and structural parameters of the water turbine.
ItemParameterValue
OperationFlow rate, Q/m3·h−117.5
Rotational speed, N/r·min−1700
Head, H/m11
GeometryDraft tube diameter, d/mm60.18
Runner inlet diameter, D1/mm88
Runner outlet diameter, D2/mm190
Blade number, Z12
Inclination angle of blade outlet, γ280
Table 2. Grid independence analysis.
No. 1No. 2No. 3No. 4No. 5No. 6
Number of grids N/×1060.92.13.24.66.68.3
Efficiency η/%31.232.333.633.834.034.1
Relative error ε/%/3.534.020.590.590.29
Table 3. Instrument configuration in the test bench.
No.InstrumentTypeSpecificationQuantity
1Torque and speed sensorJN338-A20 N·m, 0.2% F·S1
2Pressure transducerCYG1103160 kPa, 0.25%2
3BrakeTL-POD-2020 N·m, 1500 rpm1
4Flow meterMBmagDN50, 0.5%1
Disclaimer/Publisher’s Note: The statements, opinions and data contained in all publications are solely those of the individual author(s) and contributor(s) and not of MDPI and/or the editor(s). MDPI and/or the editor(s) disclaim responsibility for any injury to people or property resulting from any ideas, methods, instructions or products referred to in the content.