
Analysis and Optimization of a Novel Compact Compliant 2-DOF Positioner for Positioning to Assess Bio-Specimen Characteristics

Abstract
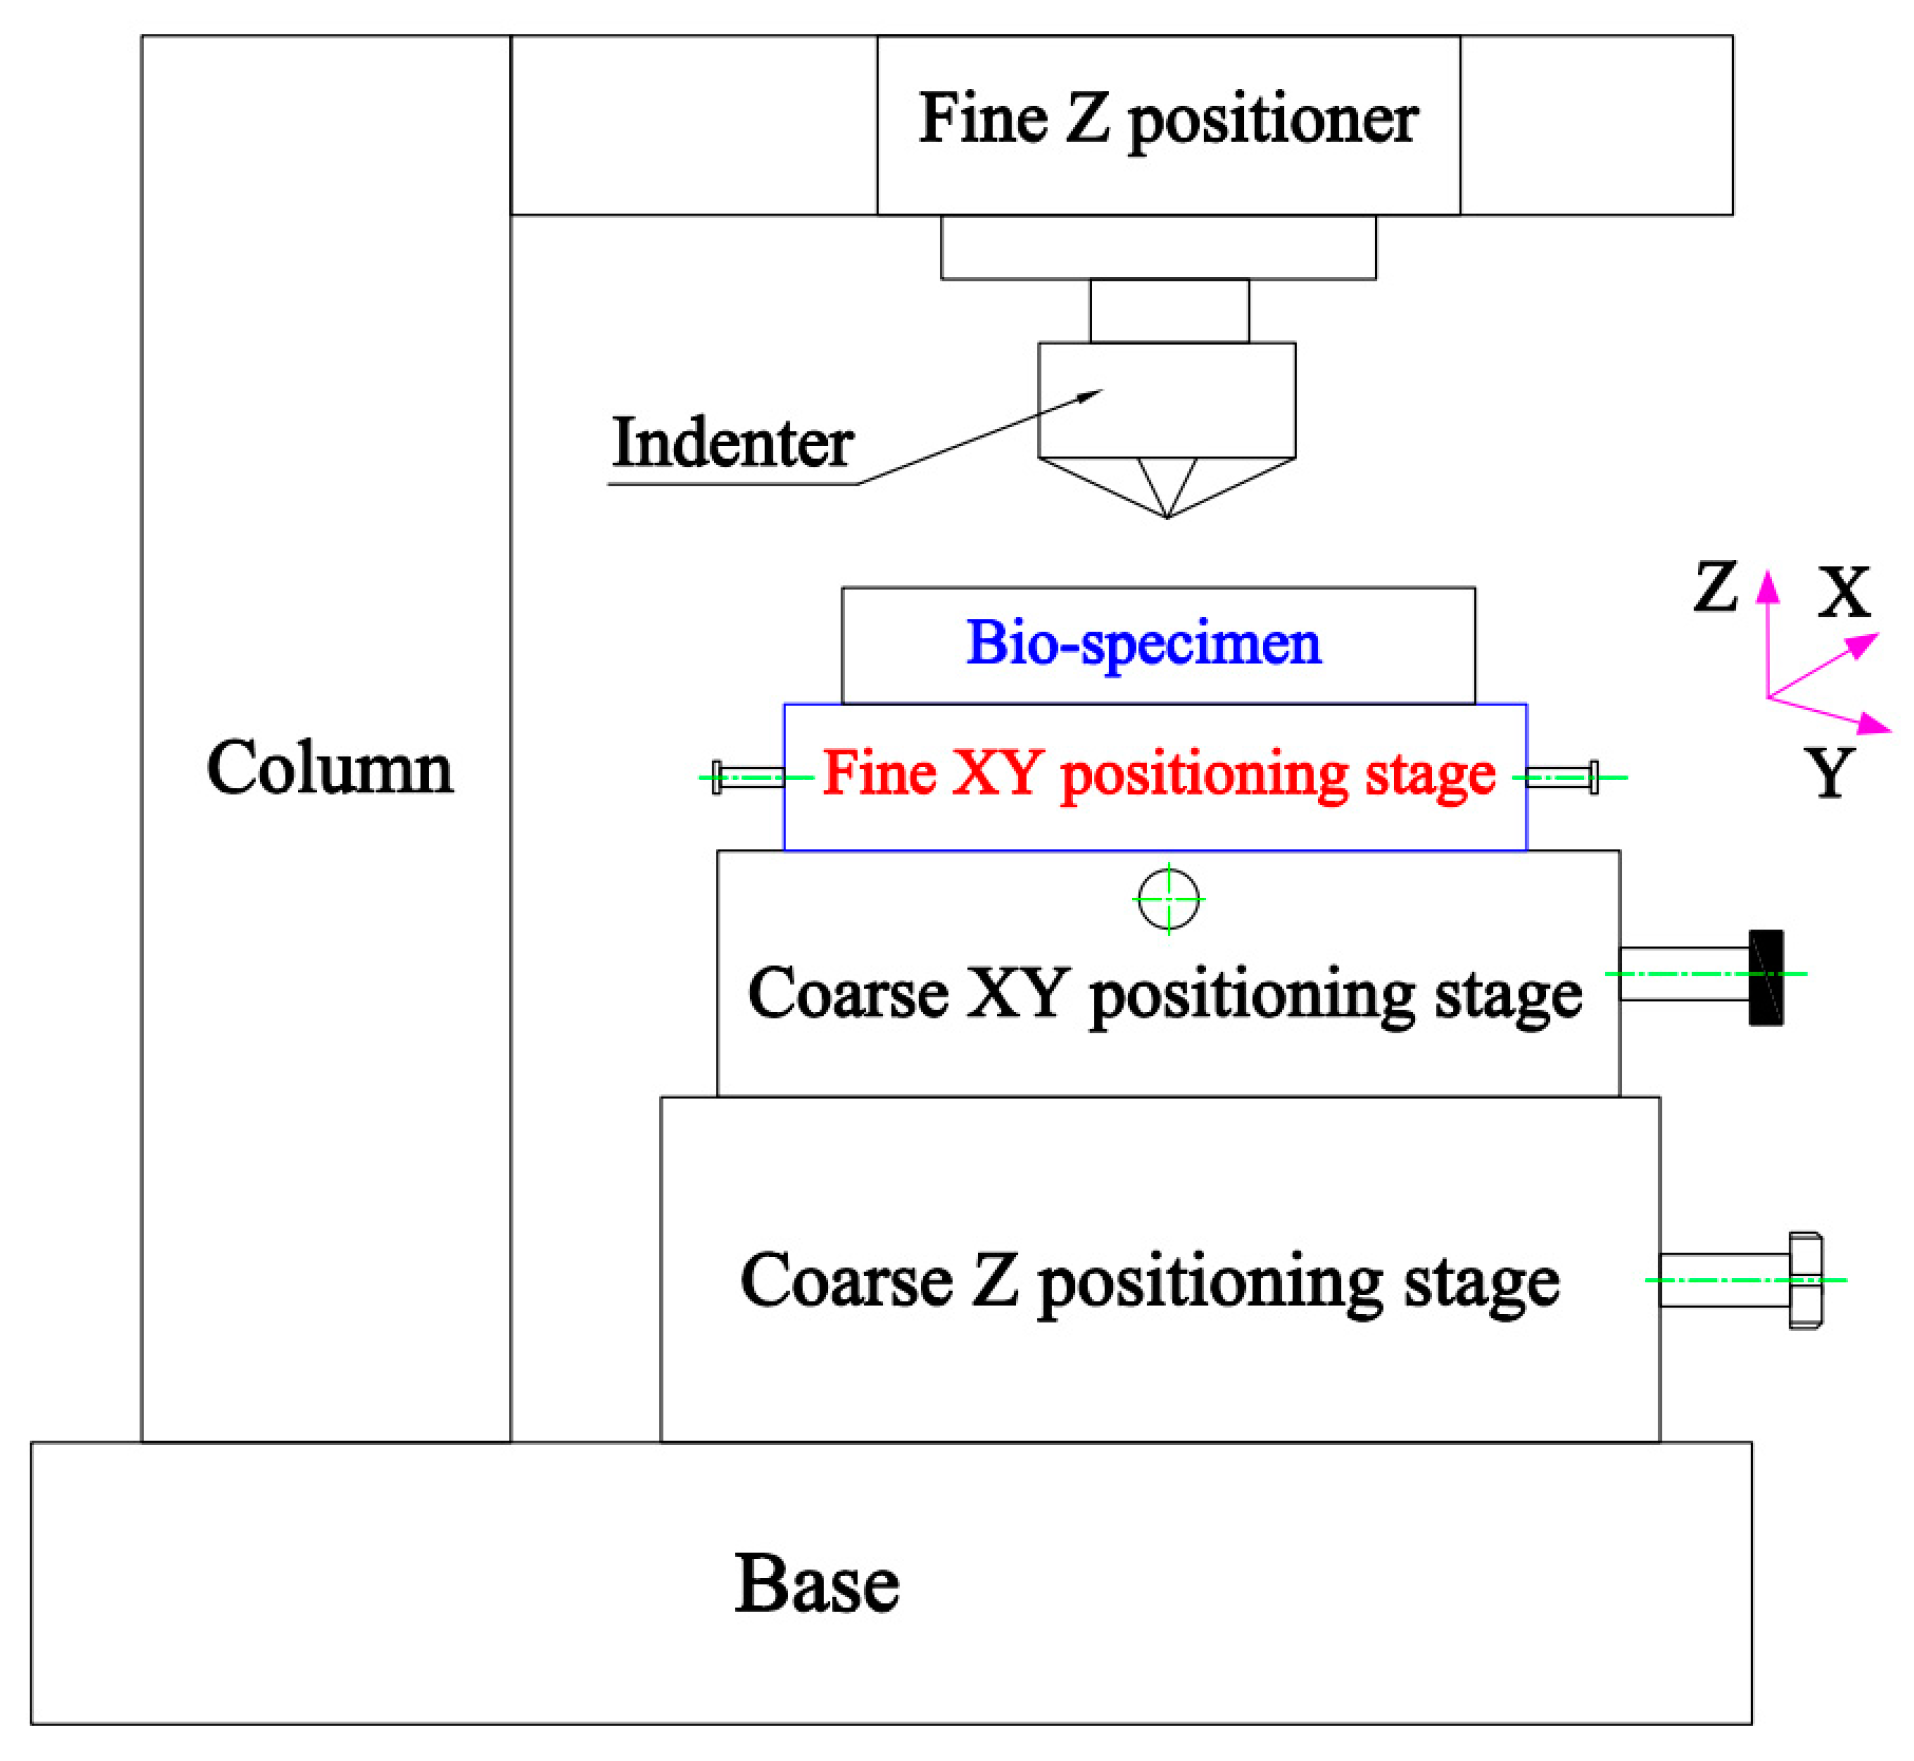
:1. Introduction and Motivation
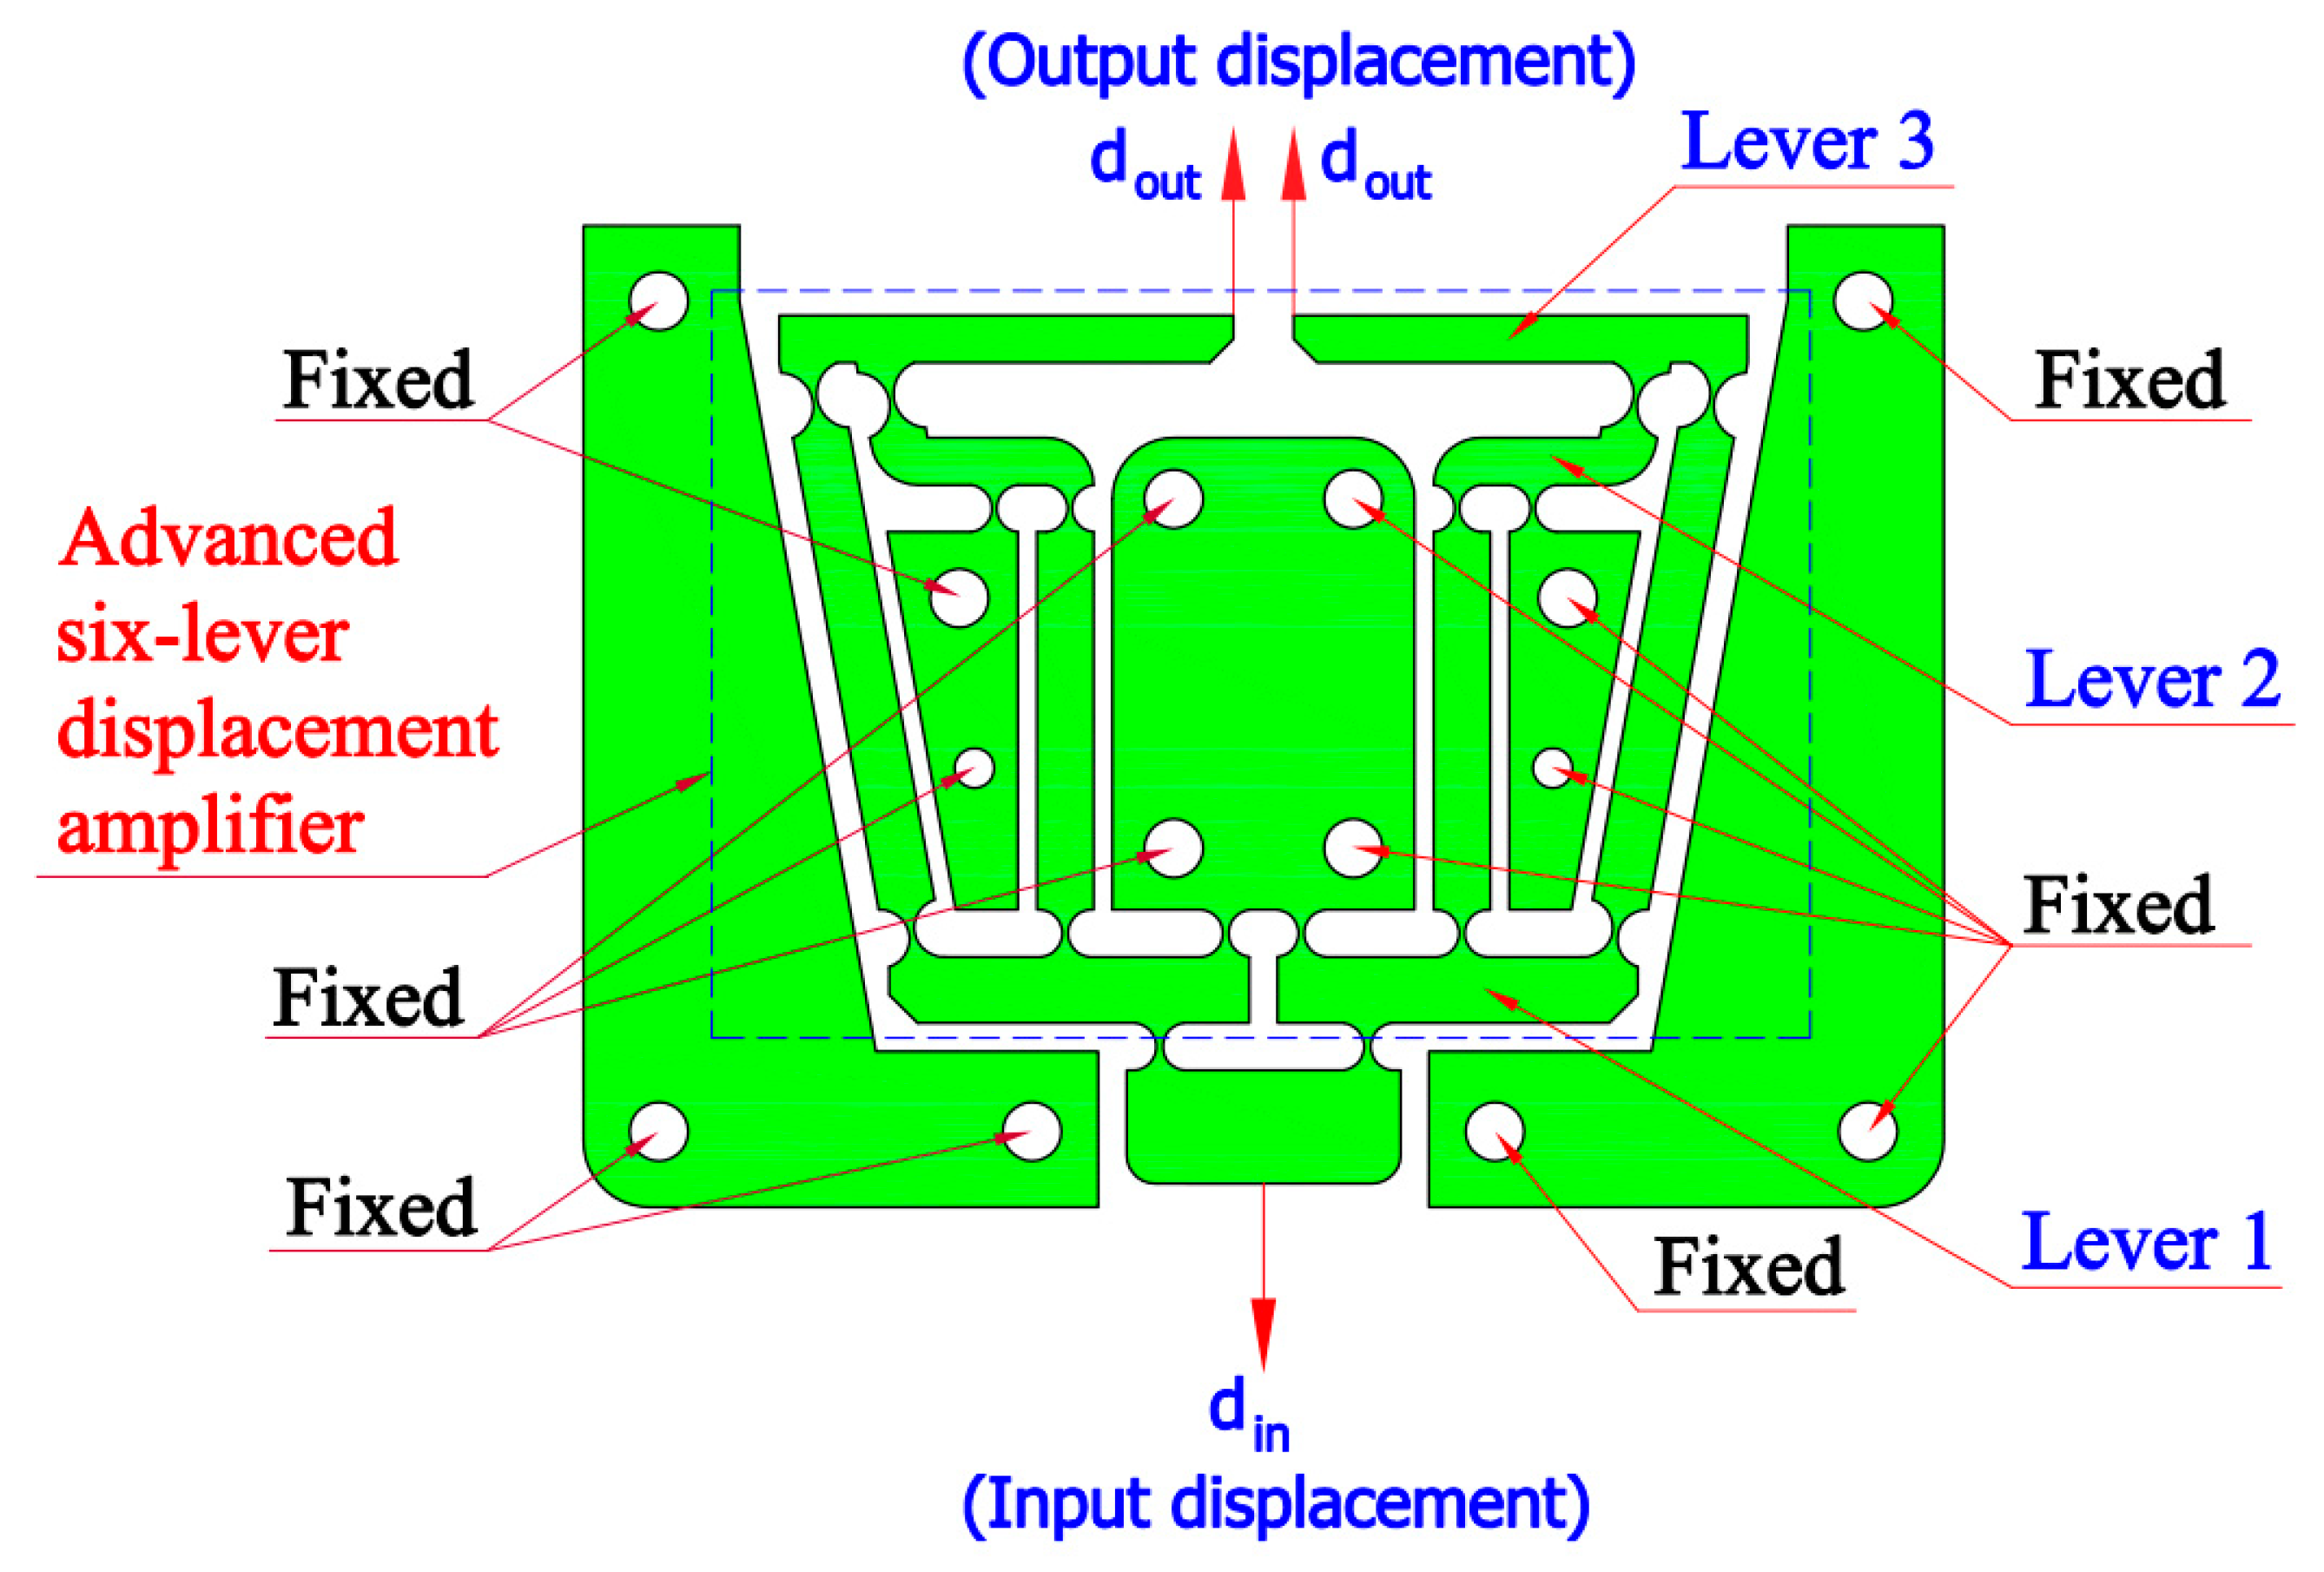
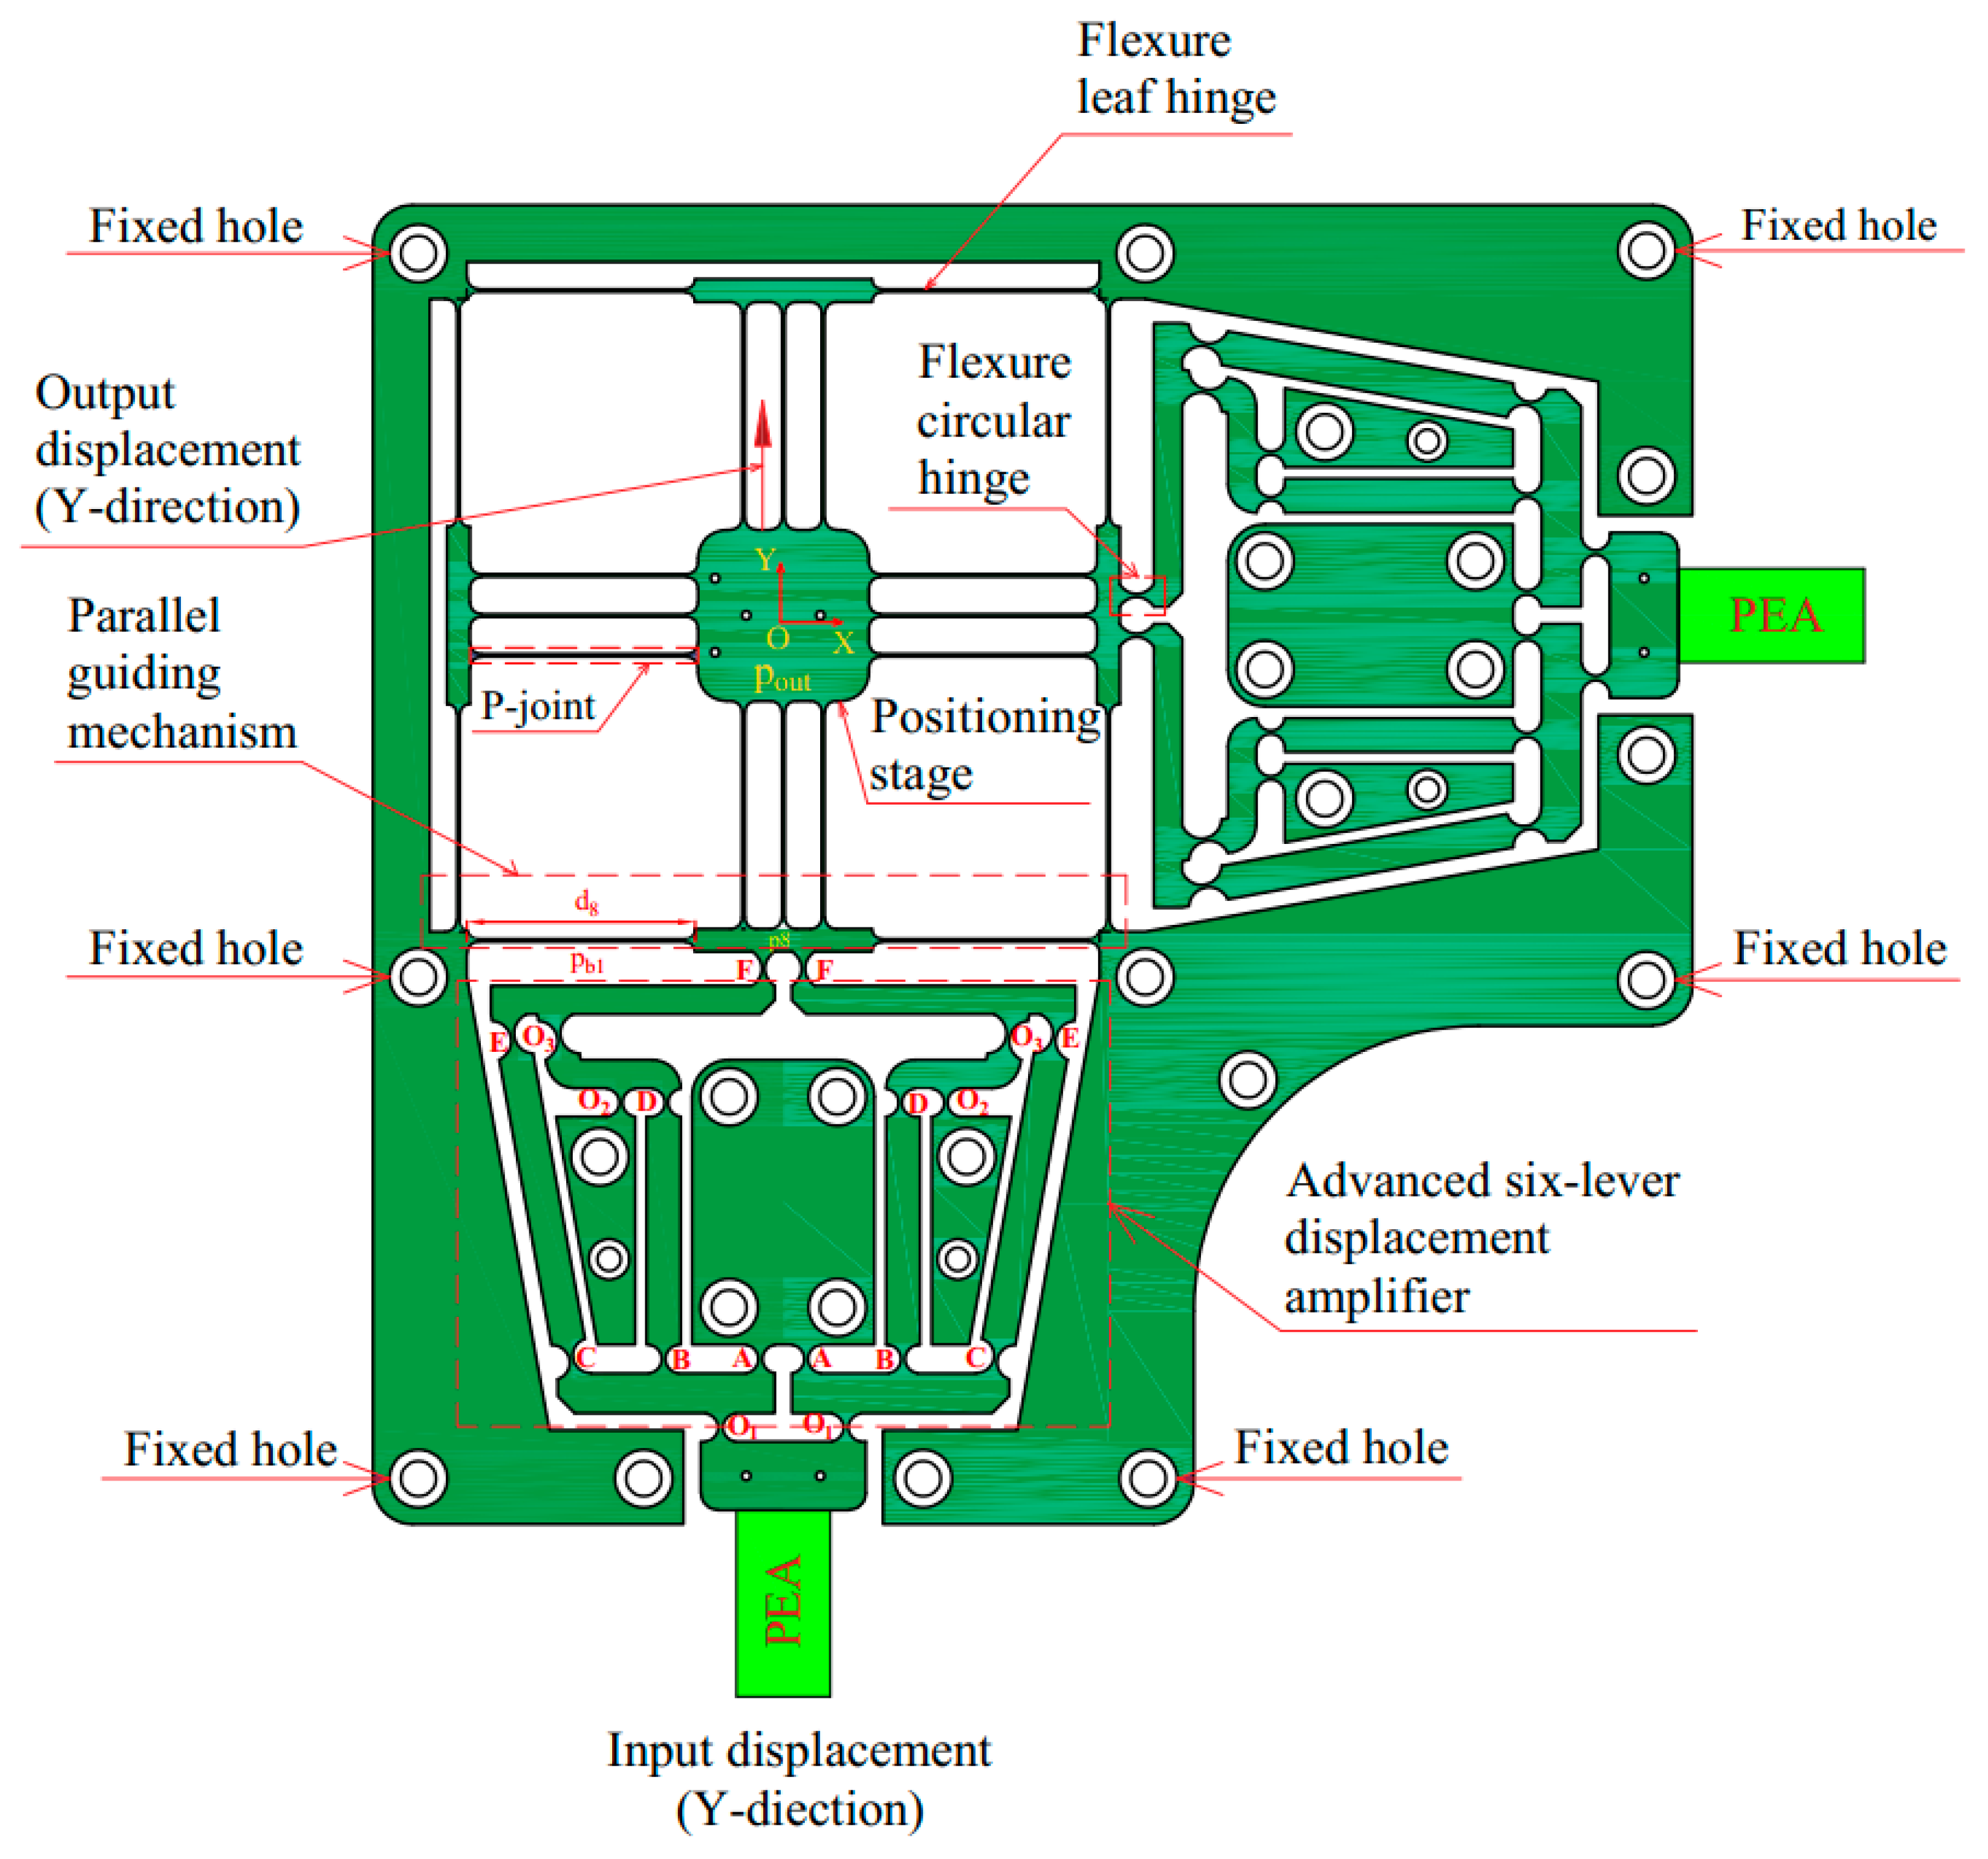
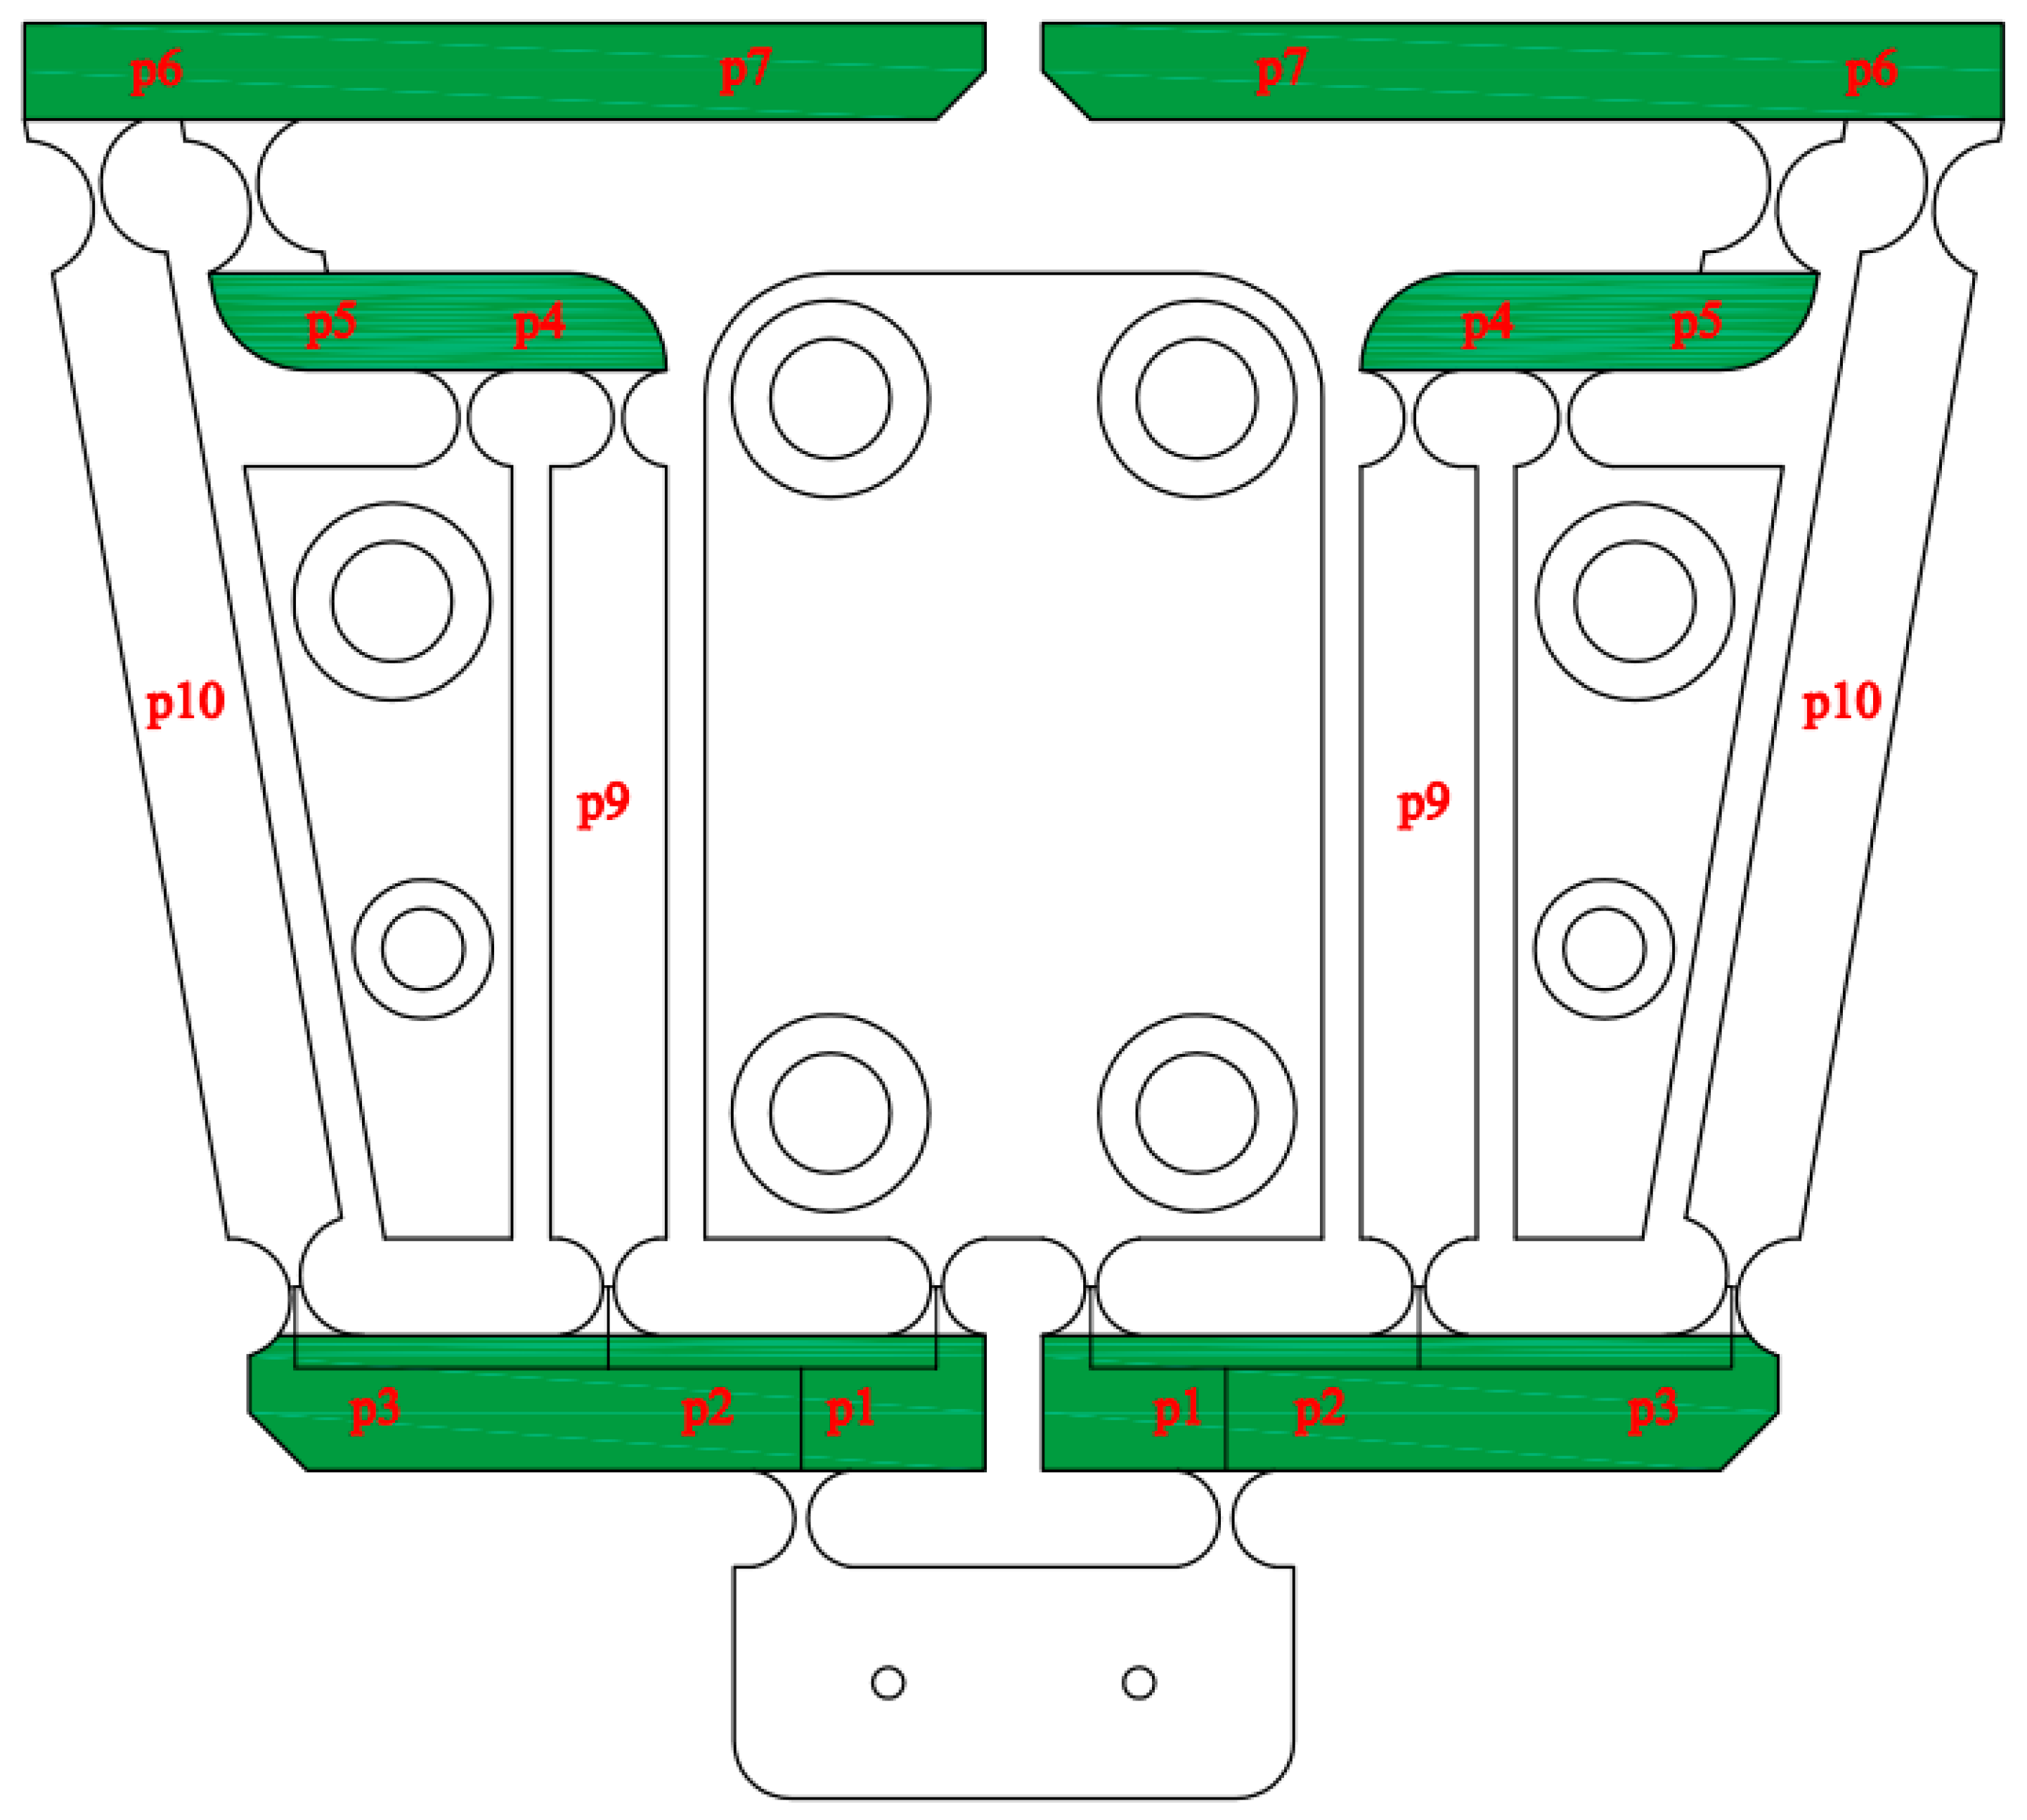
2. Mechanical Compliant XY Positioner Design
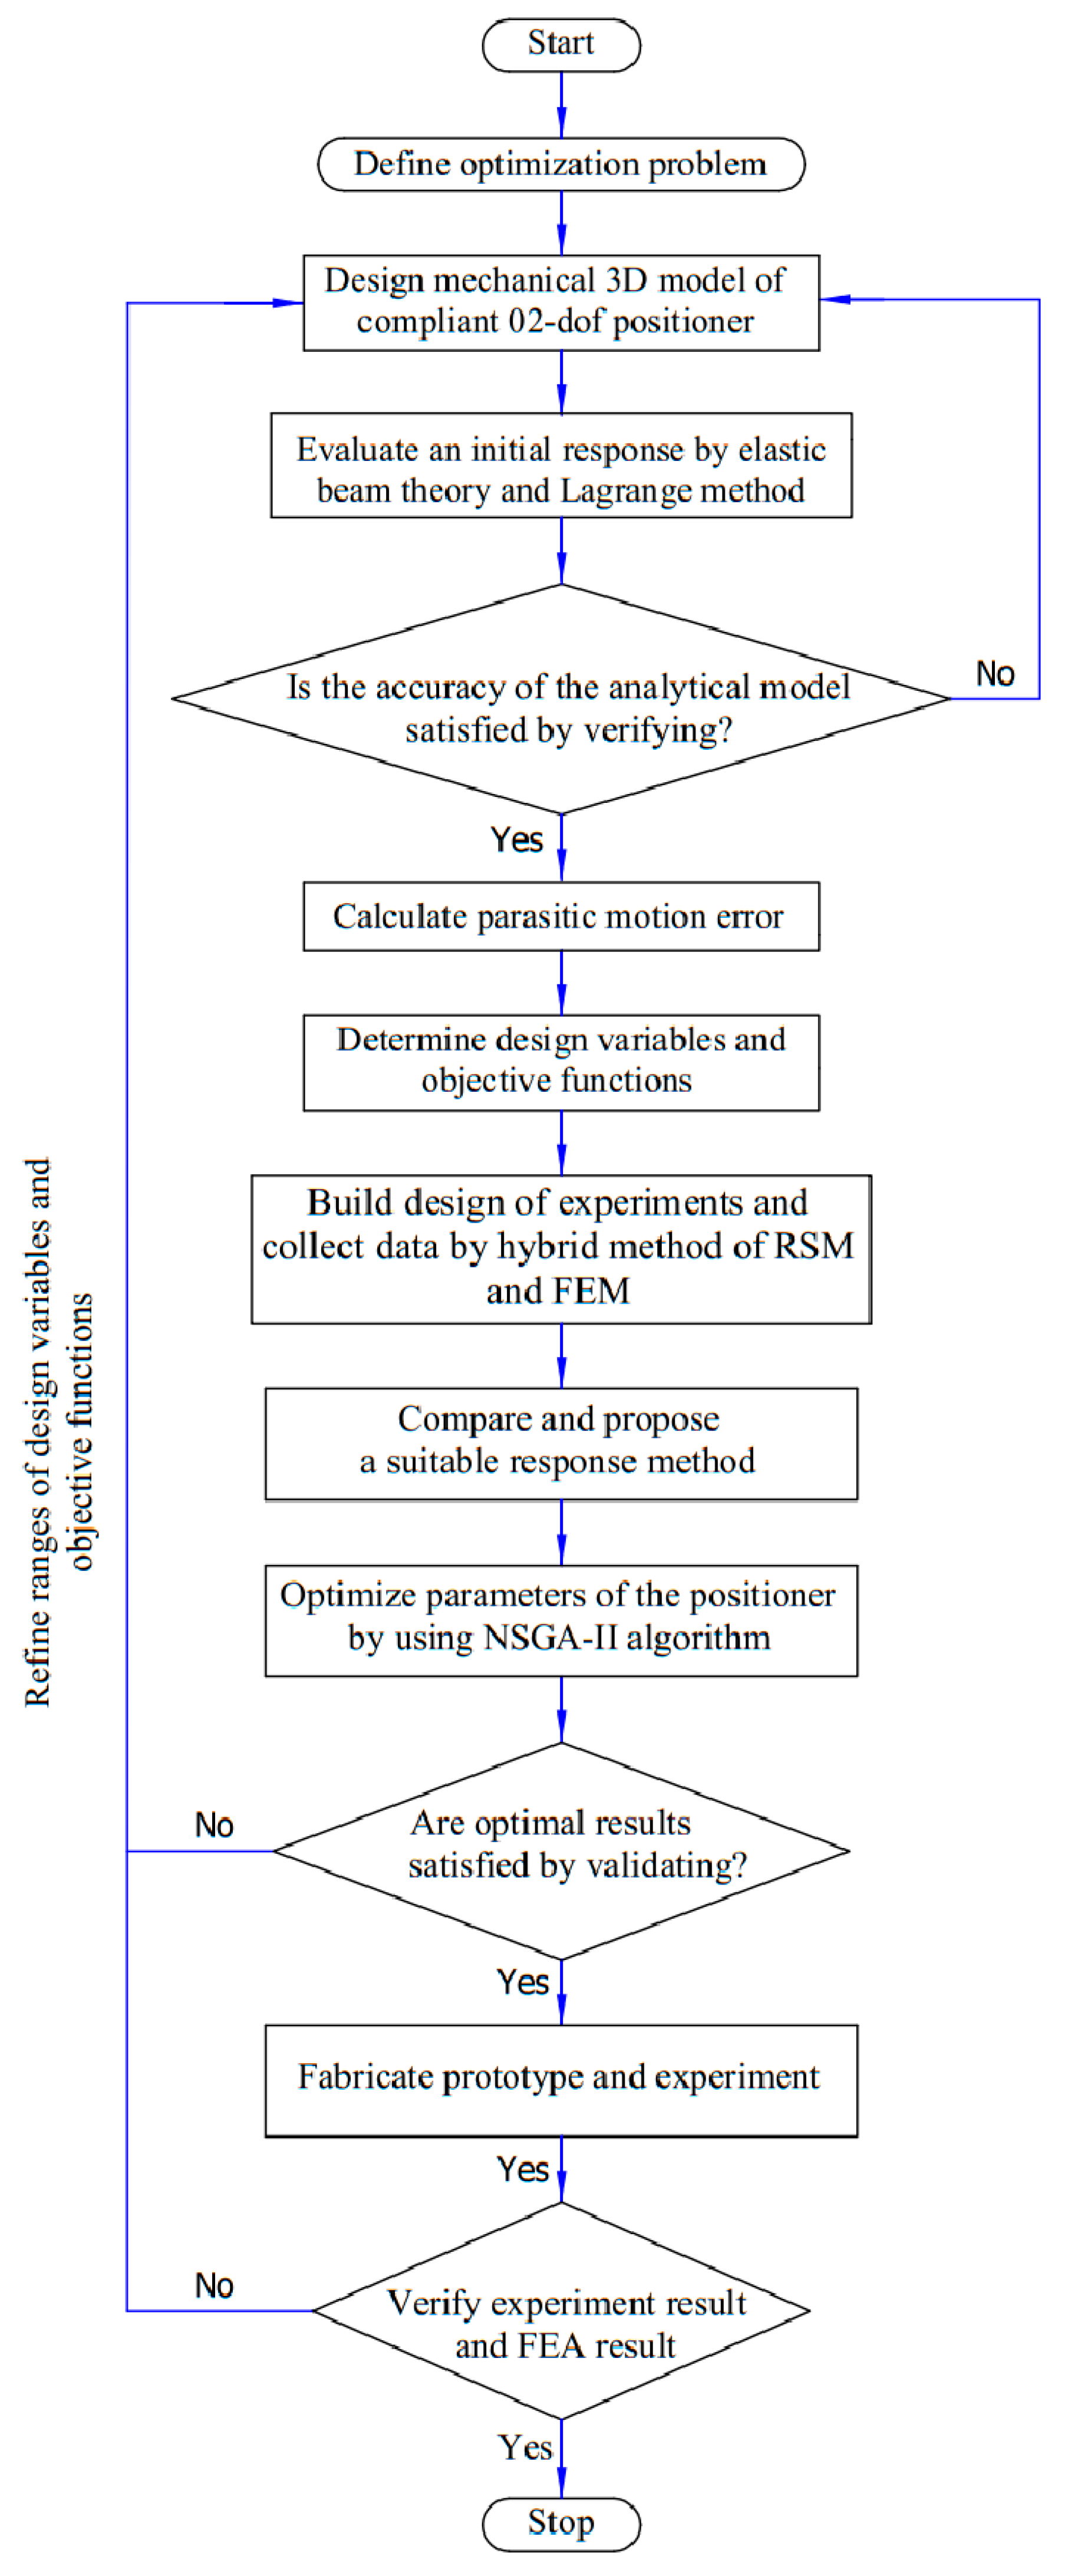
3. Proposed Method for Modeling and Optimization of Compliant XY Positioner
4. Results and Discussion
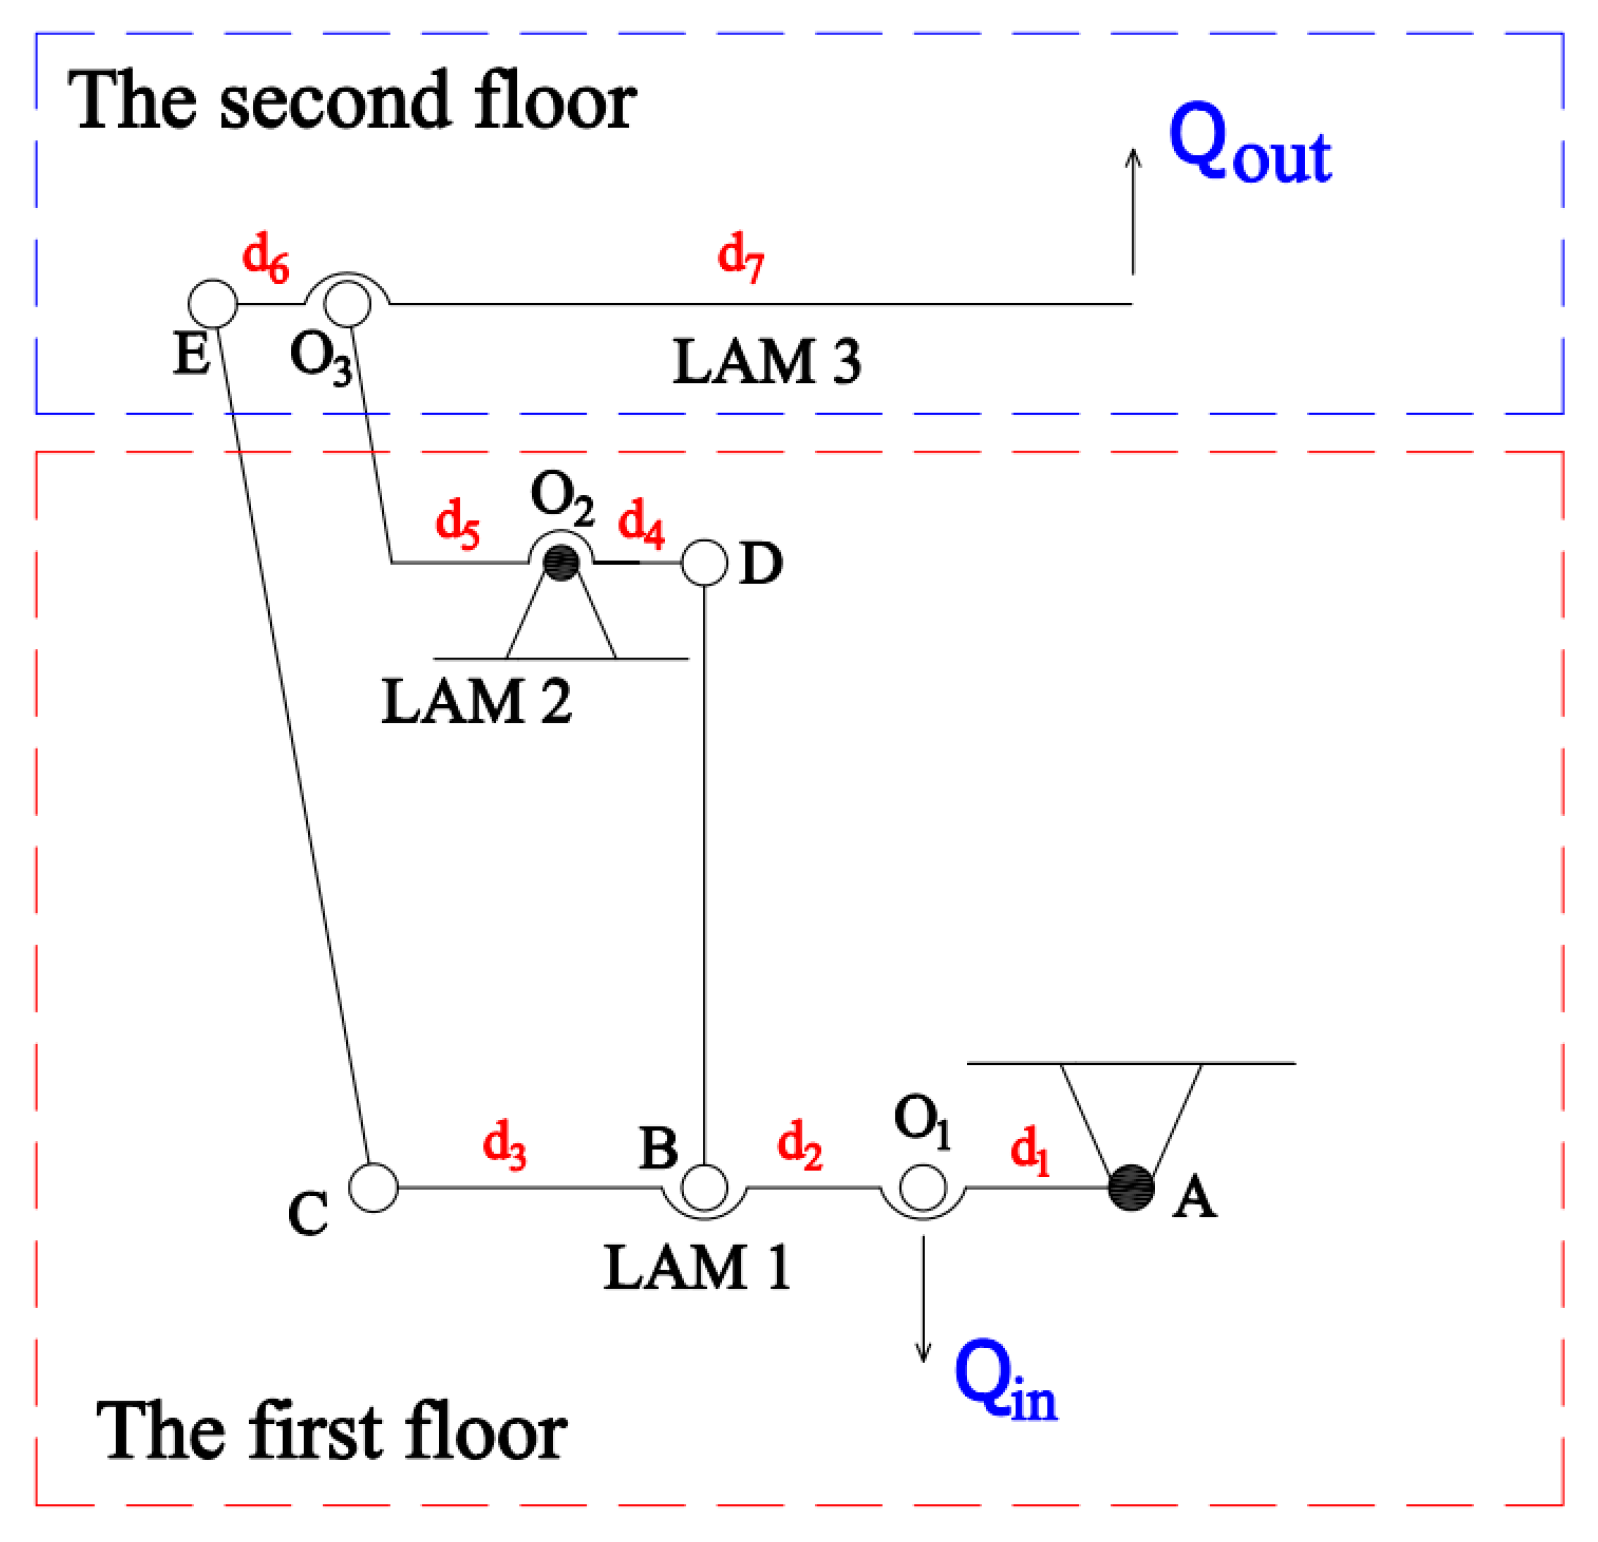
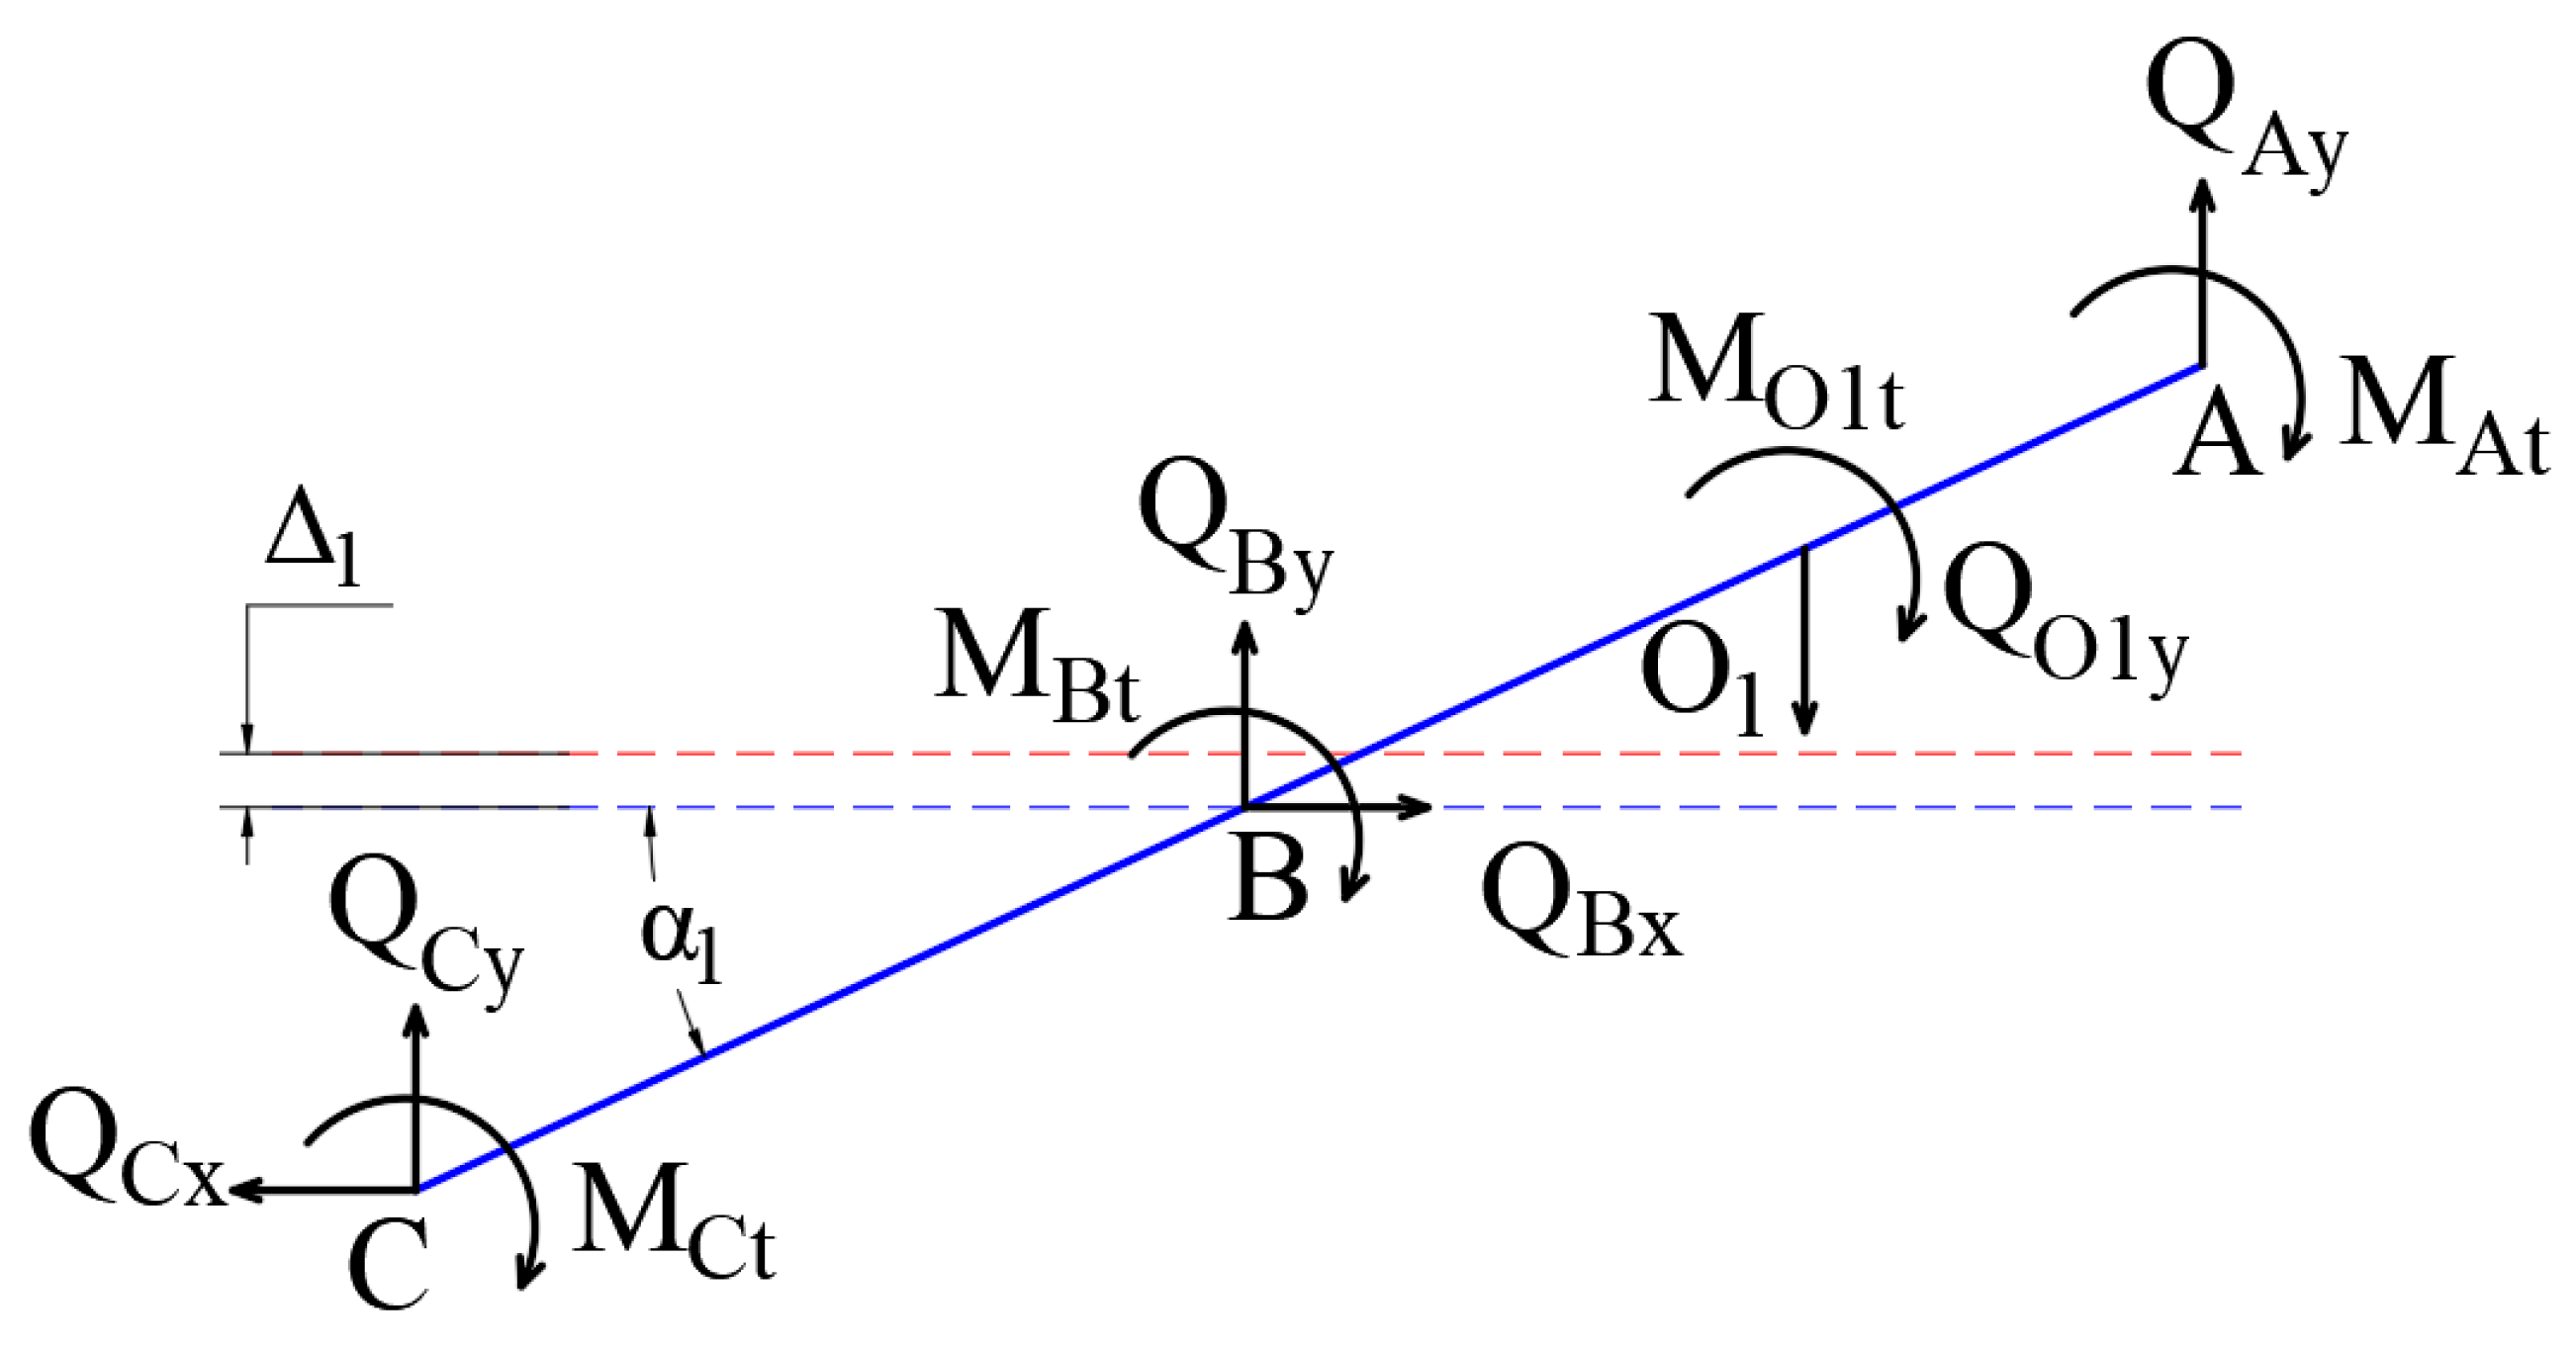
4.1. Modeling of Kinetostatics
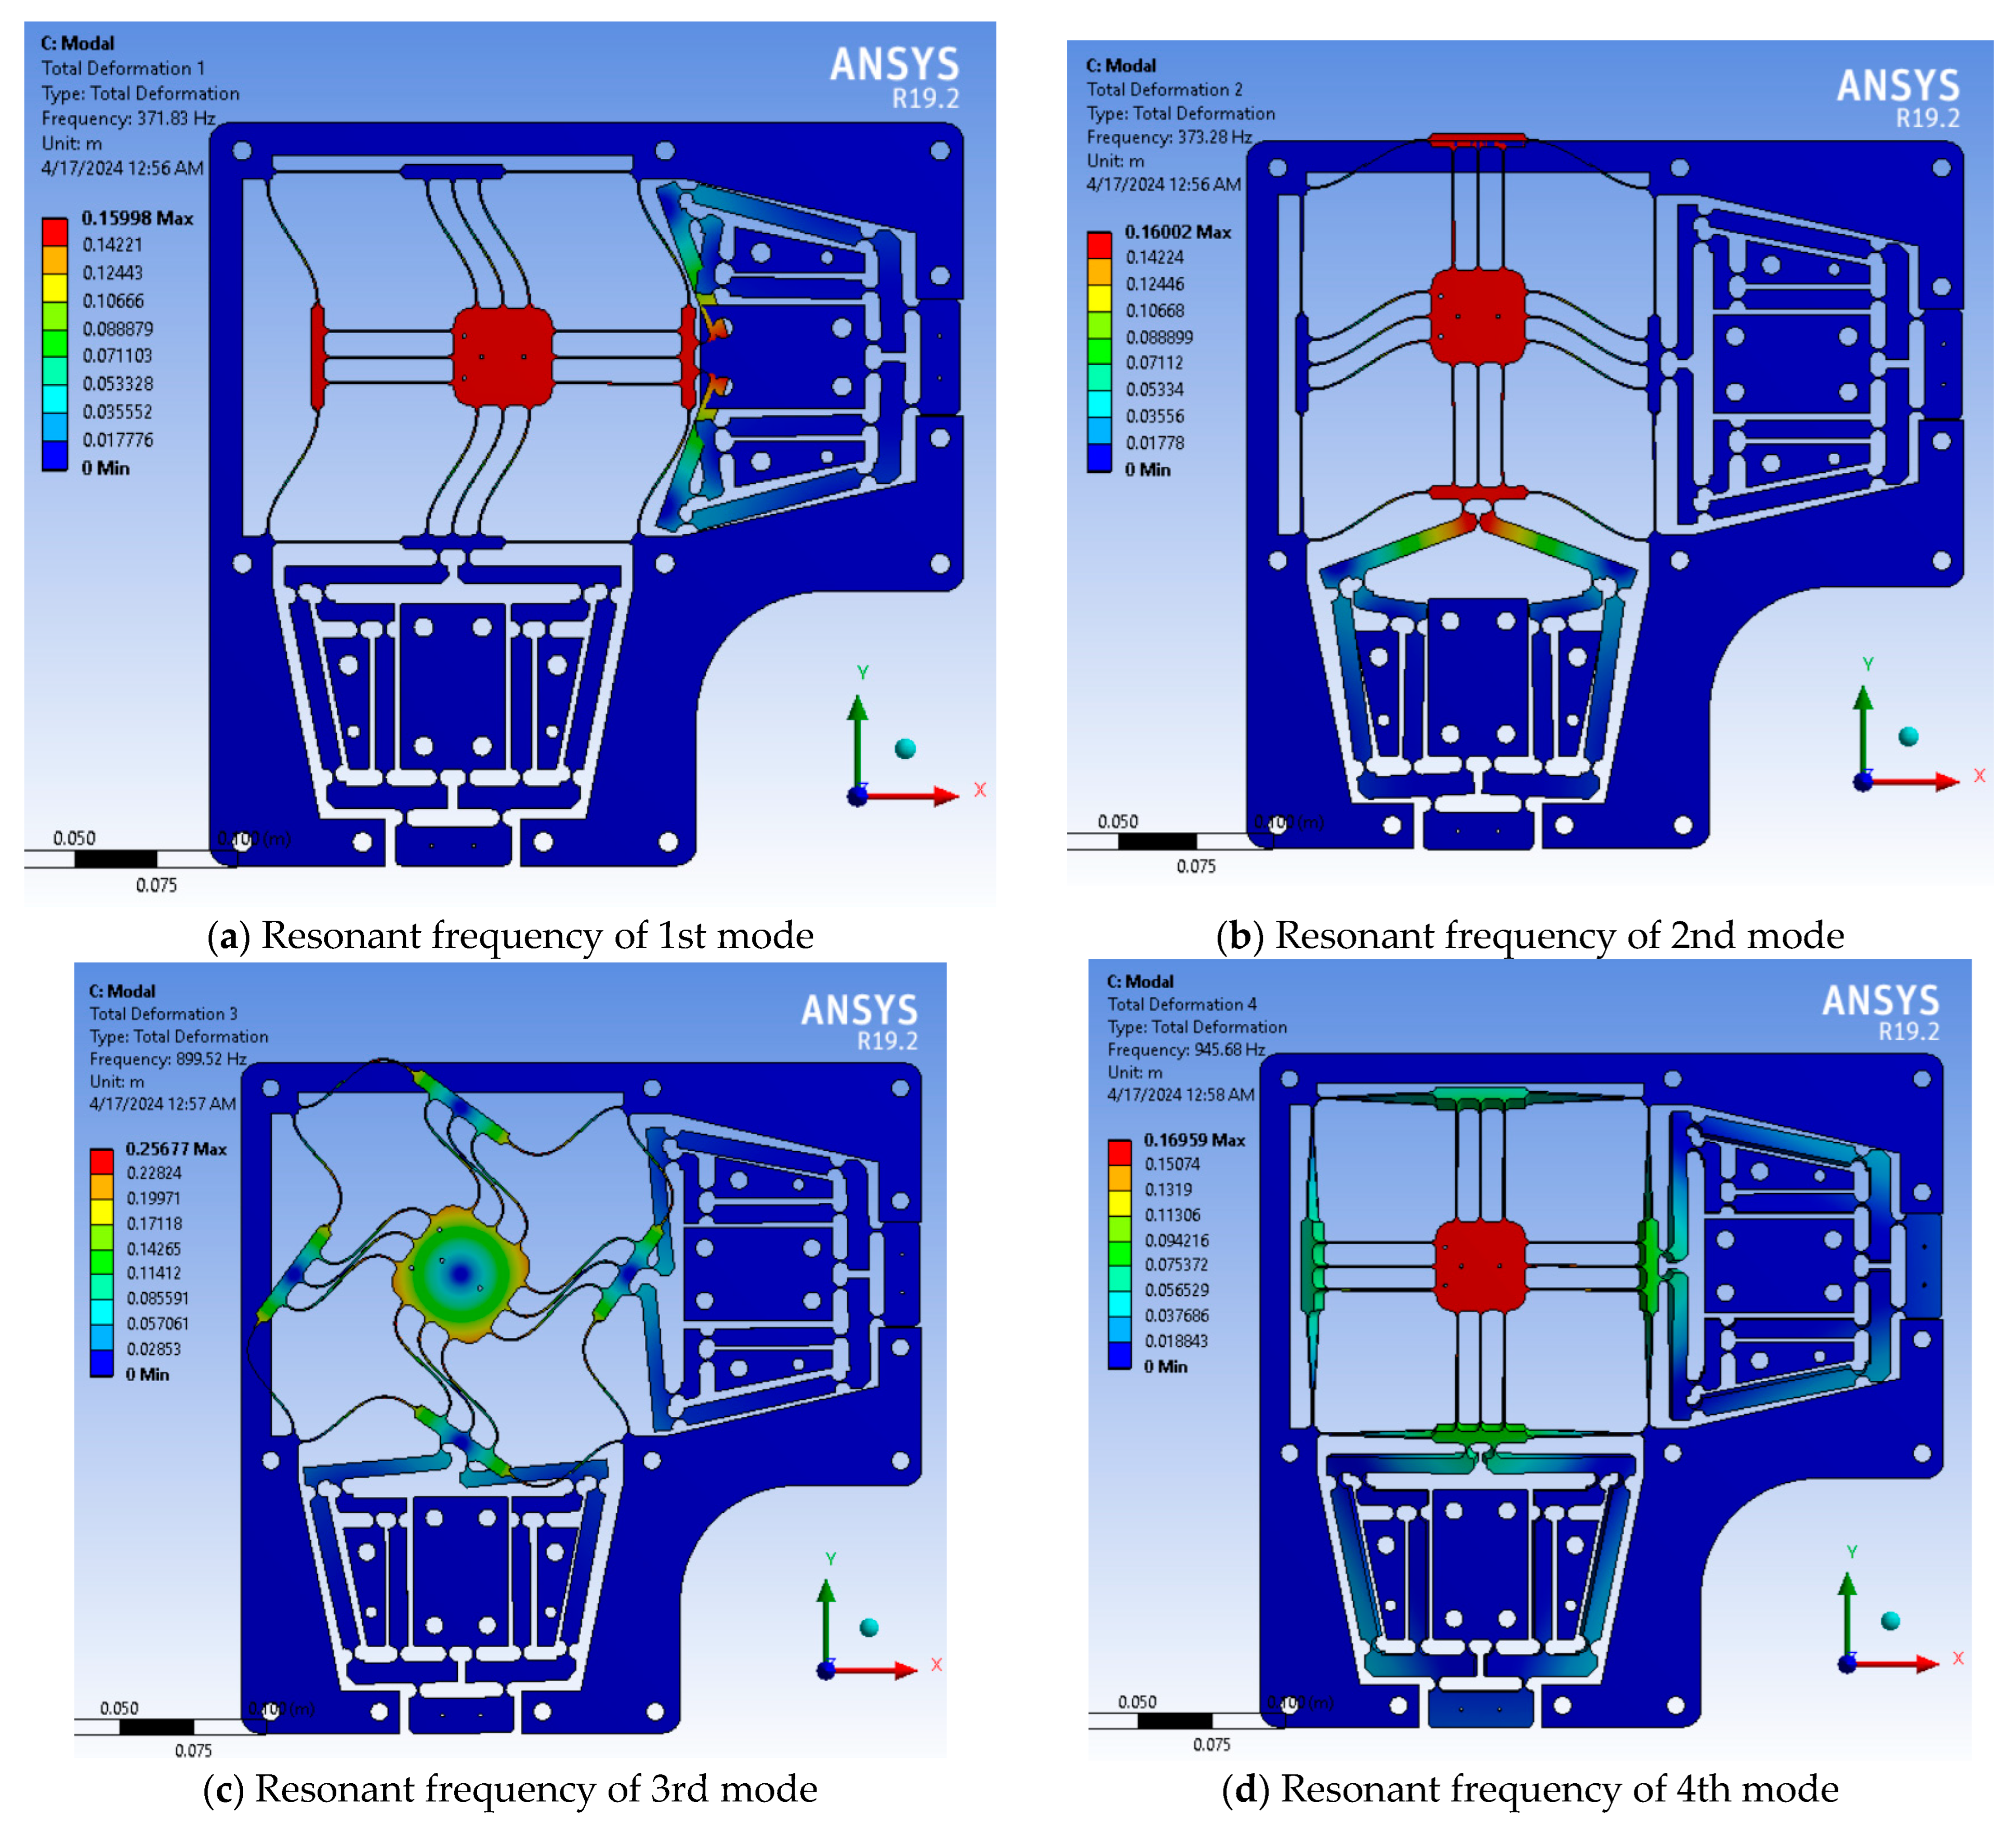
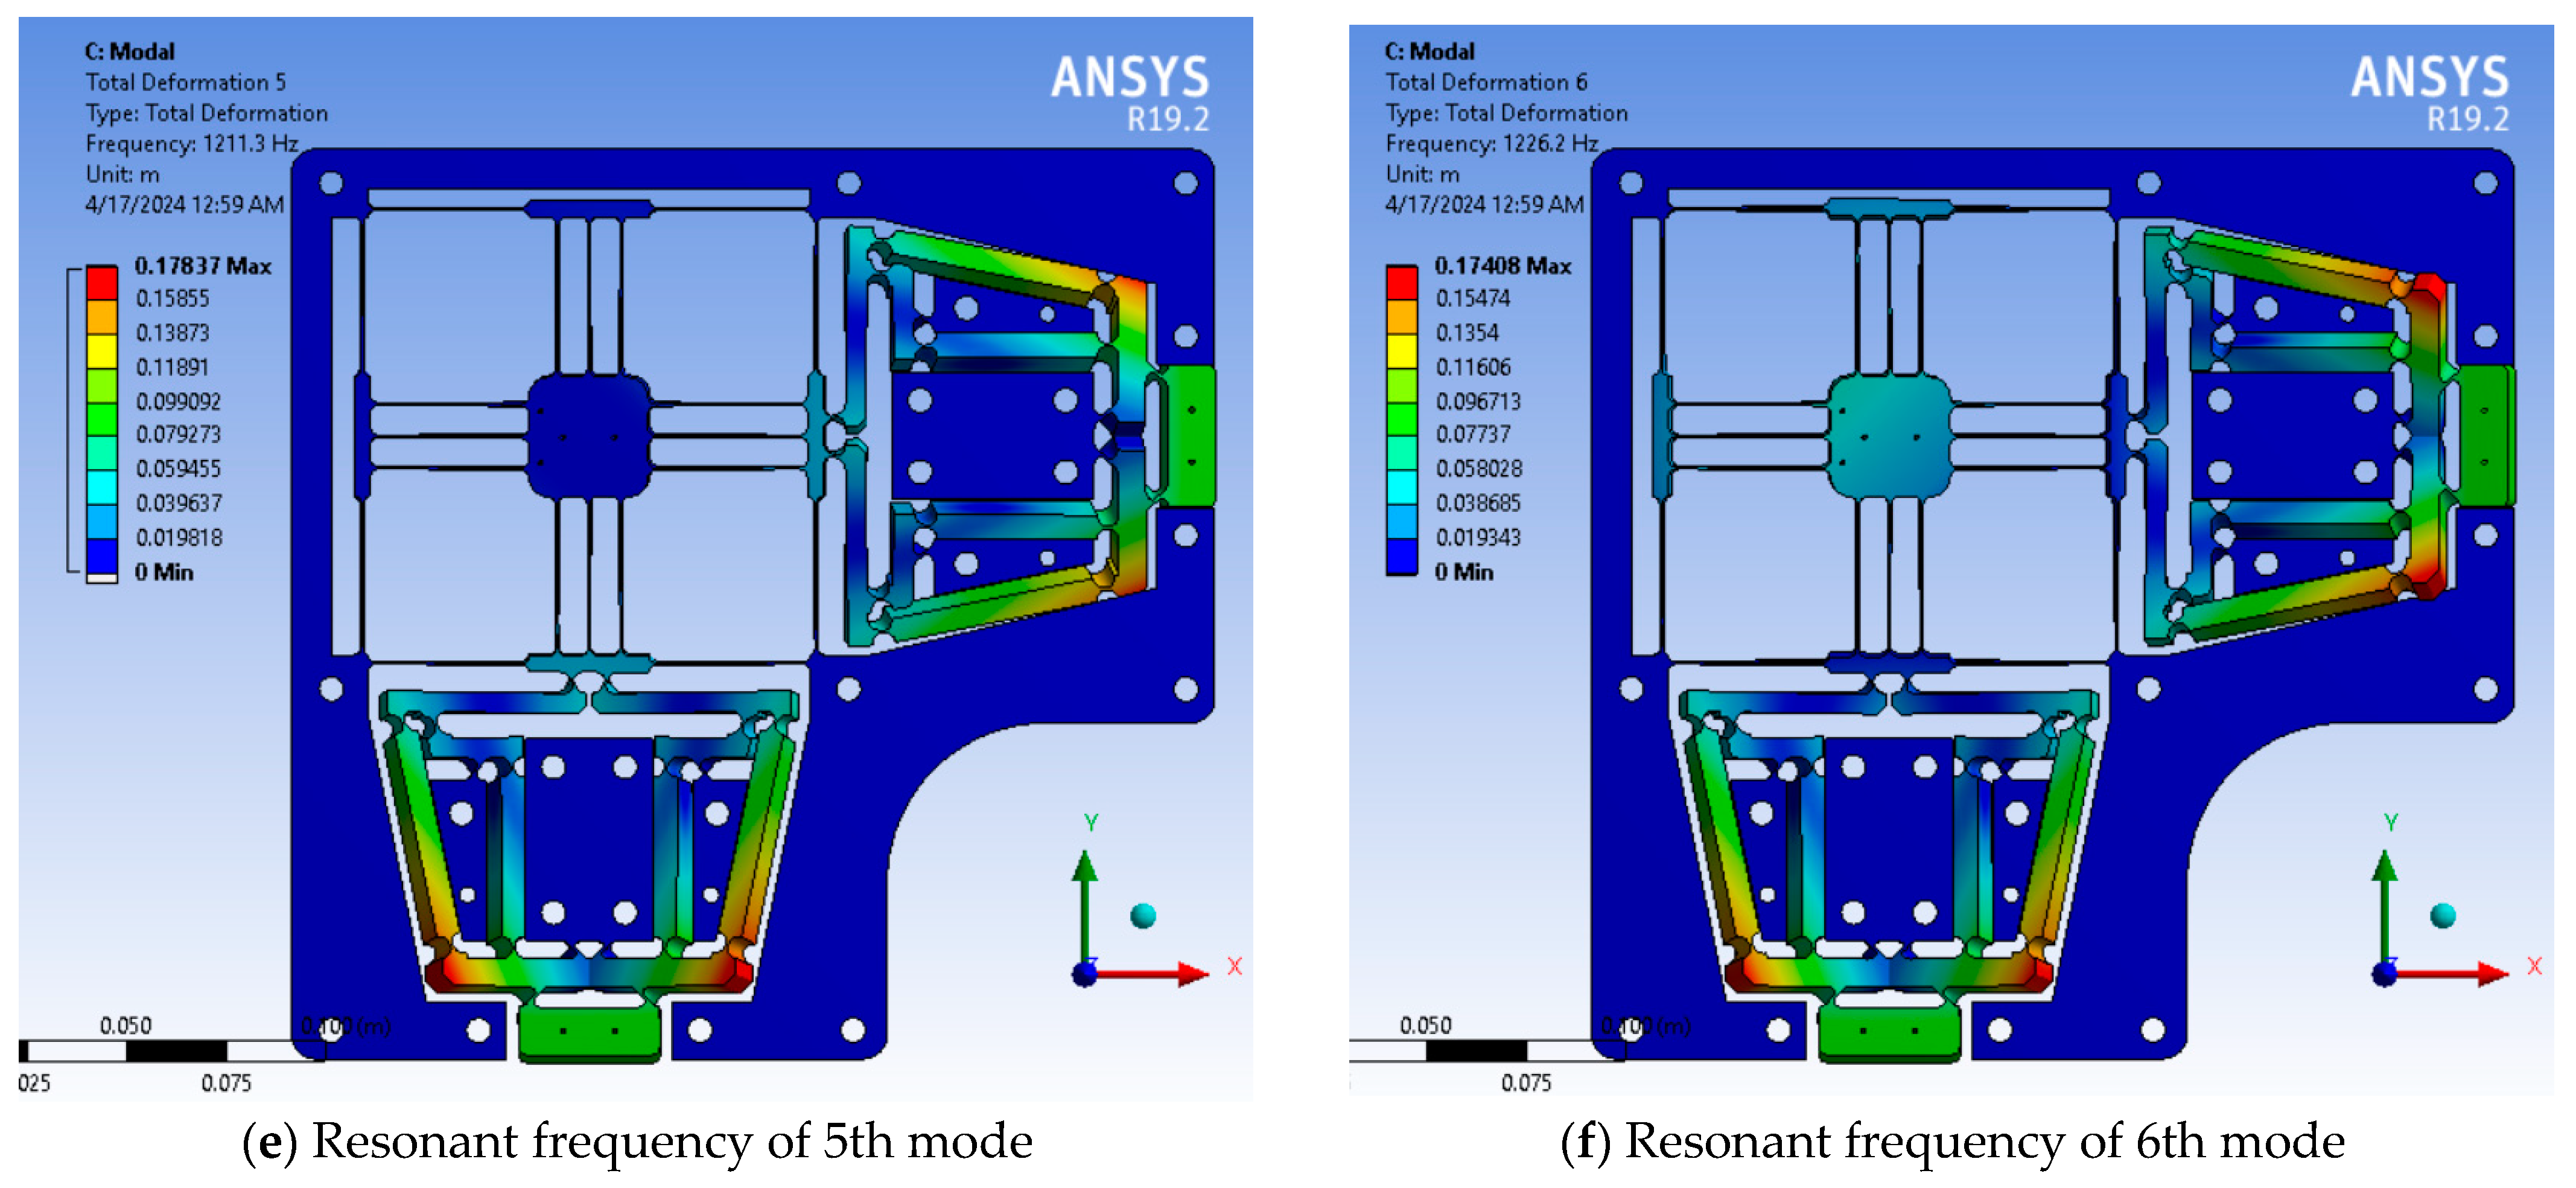
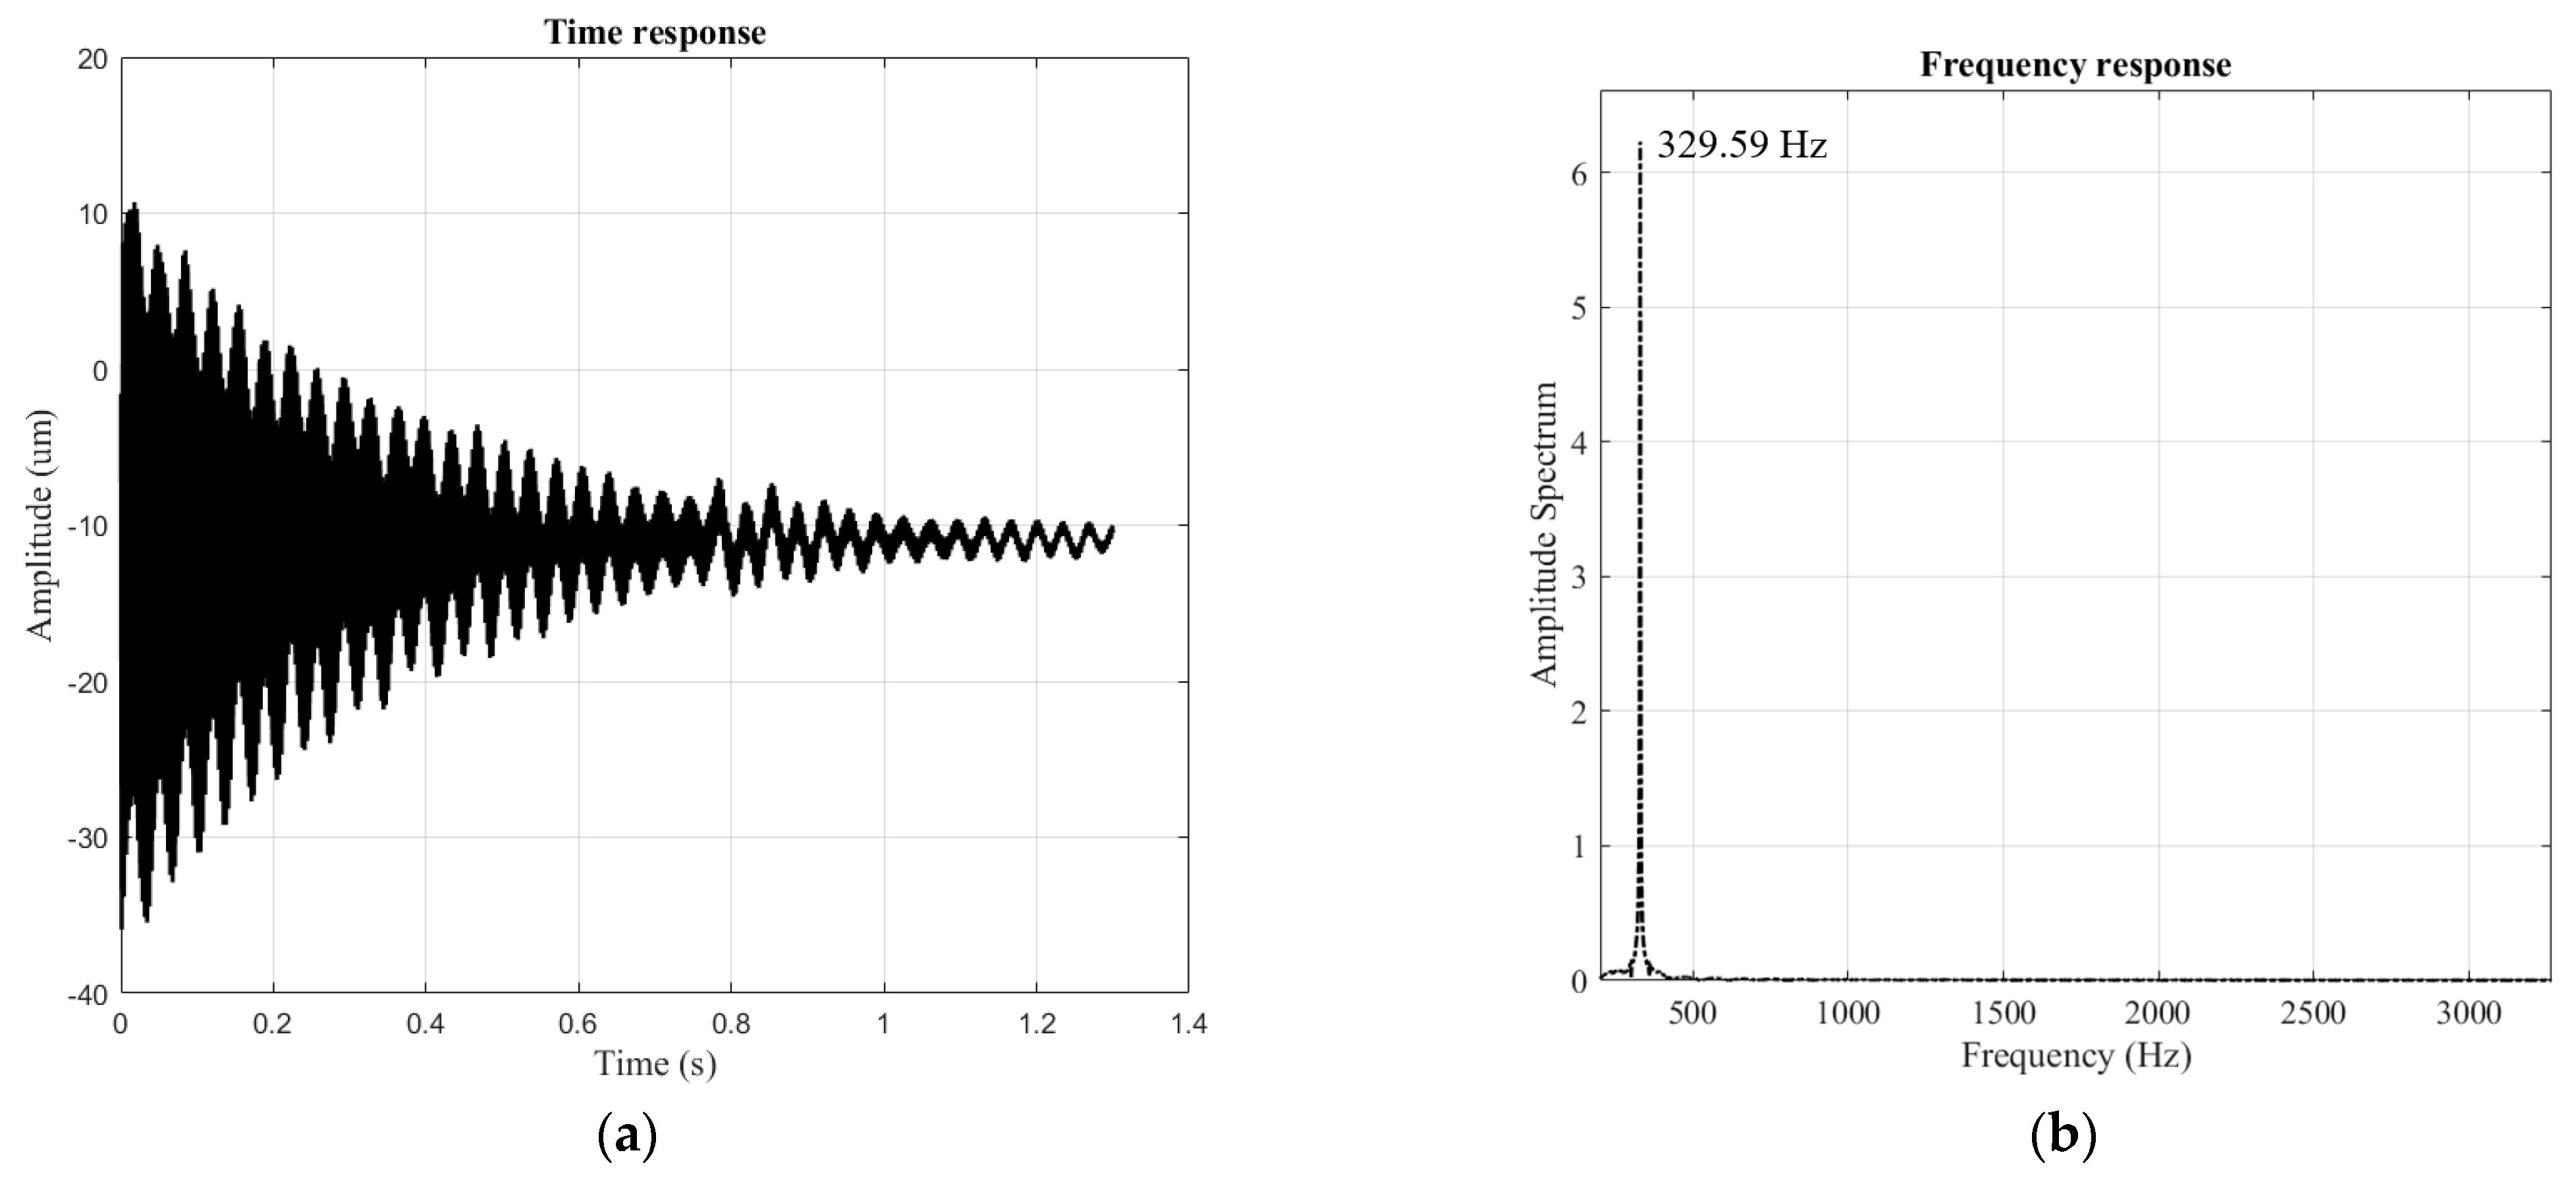
4.2. Dynamic Model Analysis
4.3. Validation of Formed Analytical Model
4.4. Calculation of Parasitic Motion Error for the Proposed Stage
4.5. Parameter Optimization of Proposed XY Positioner
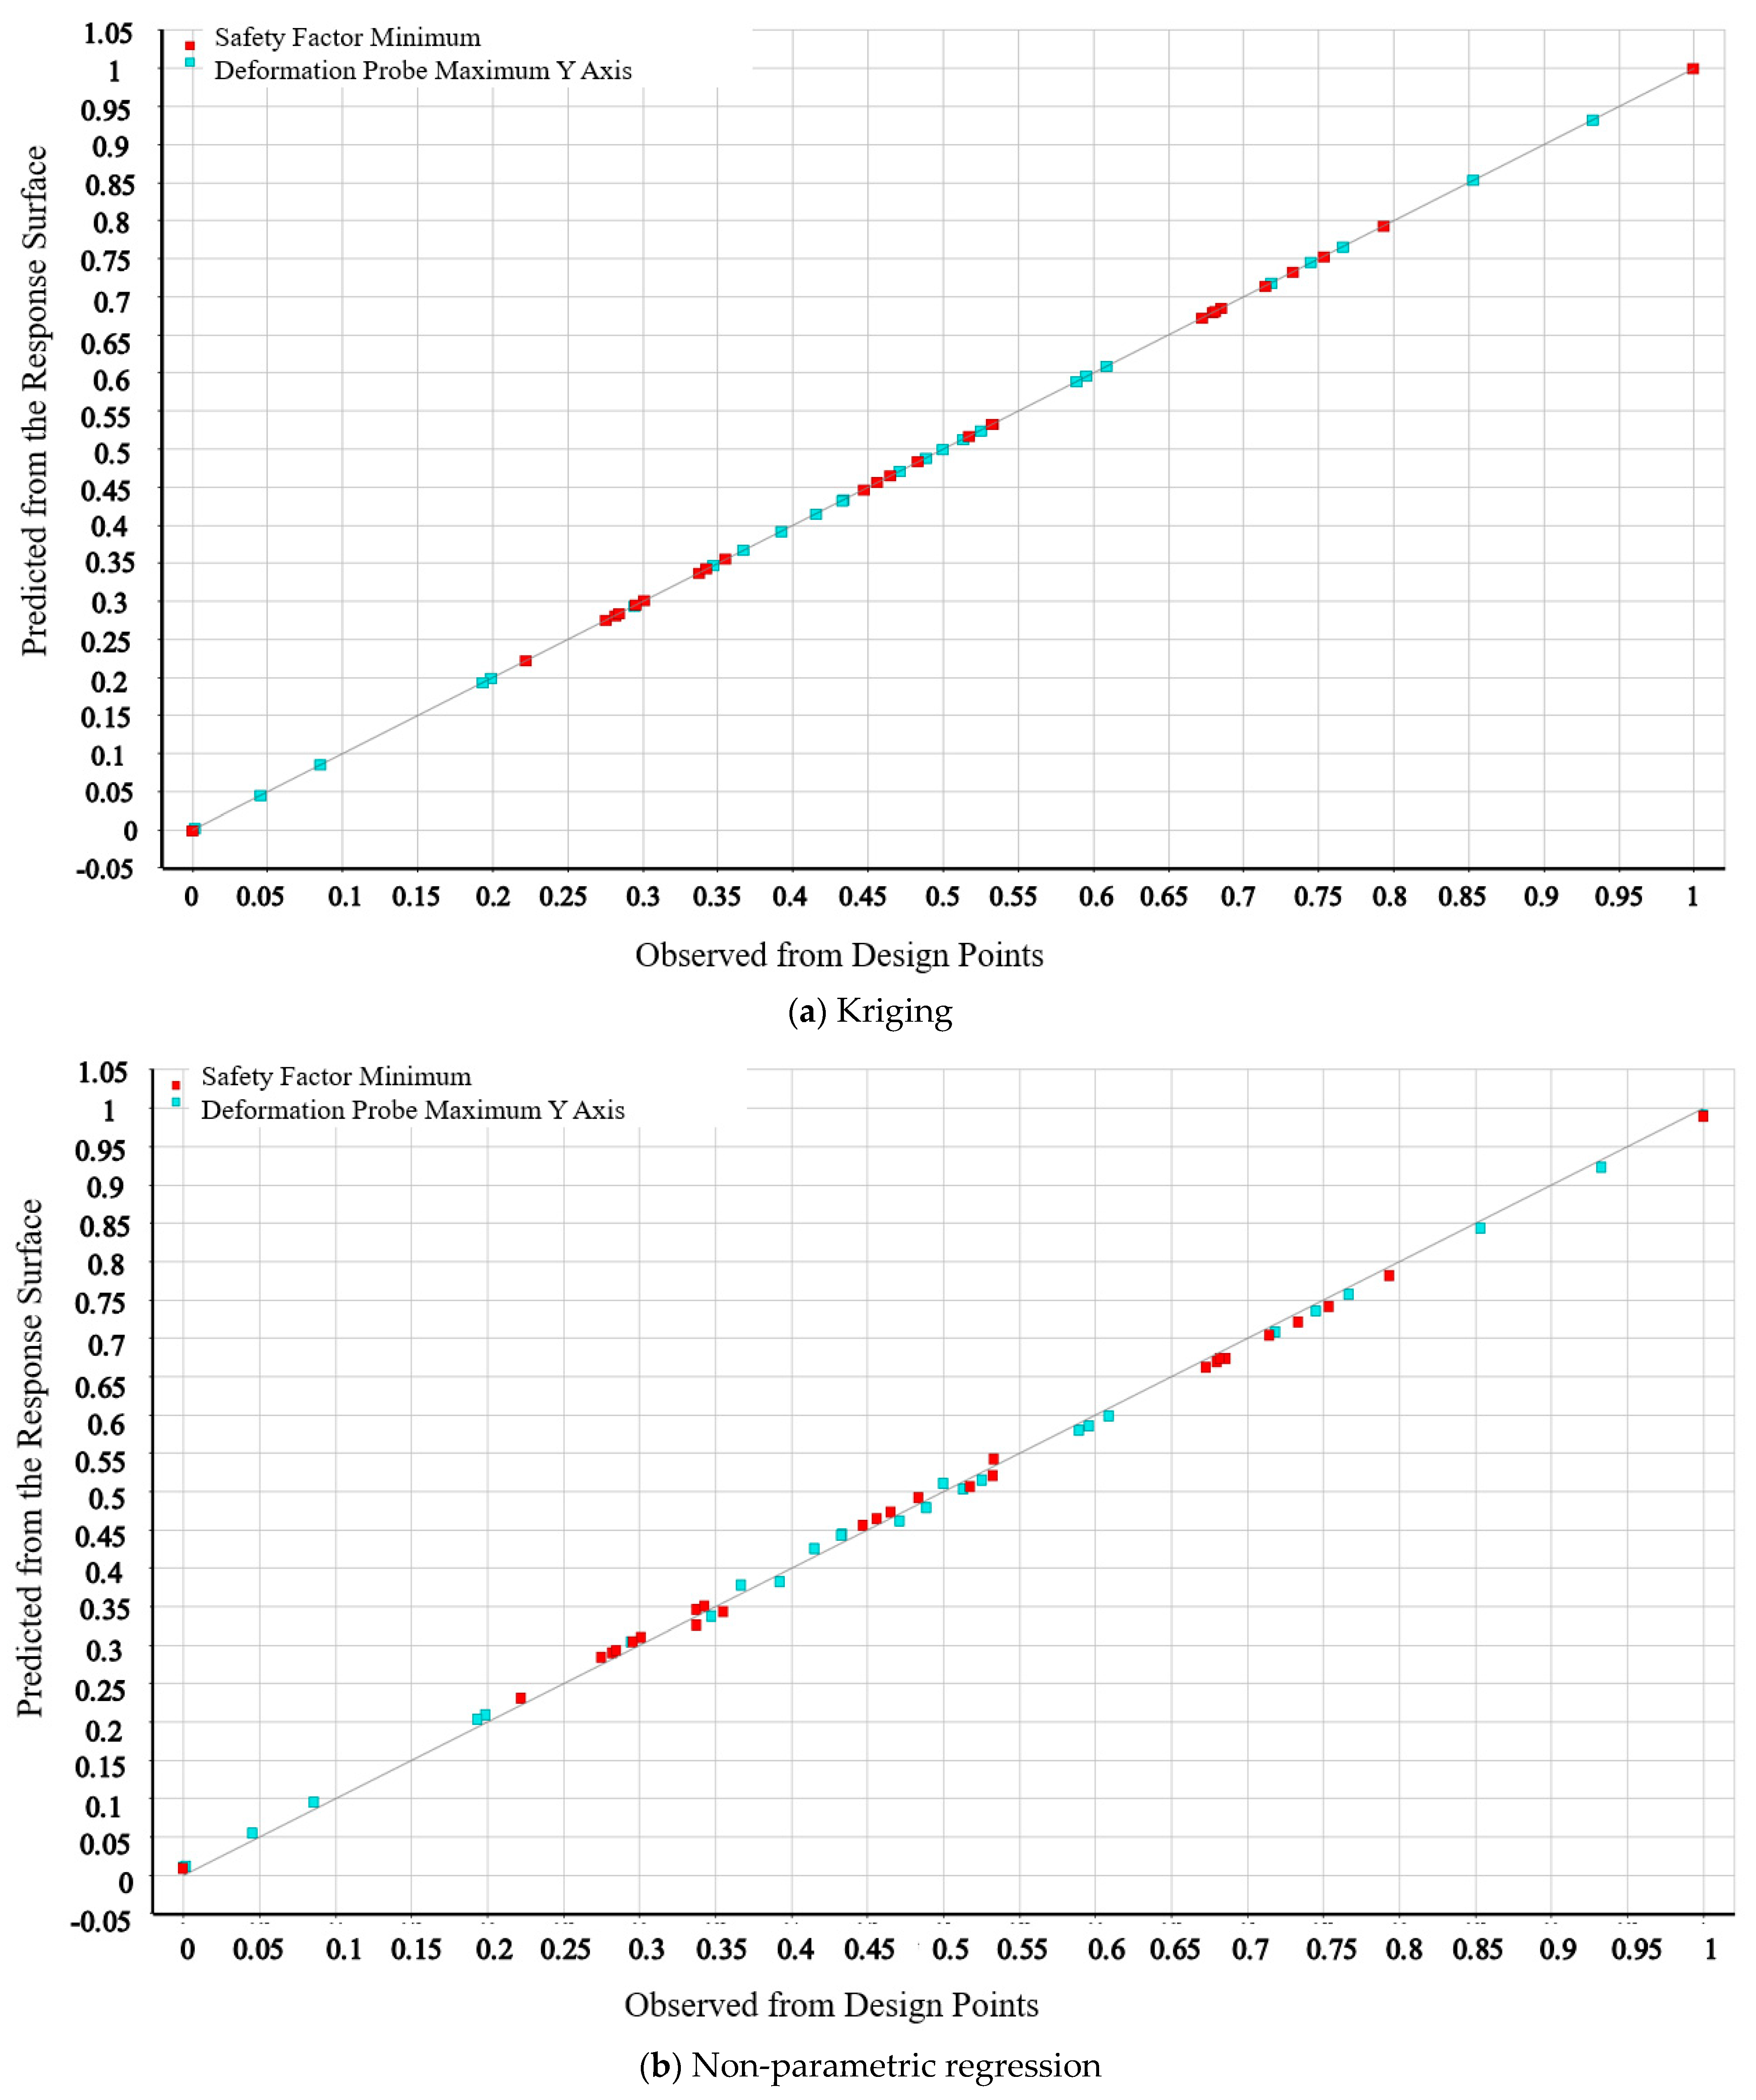
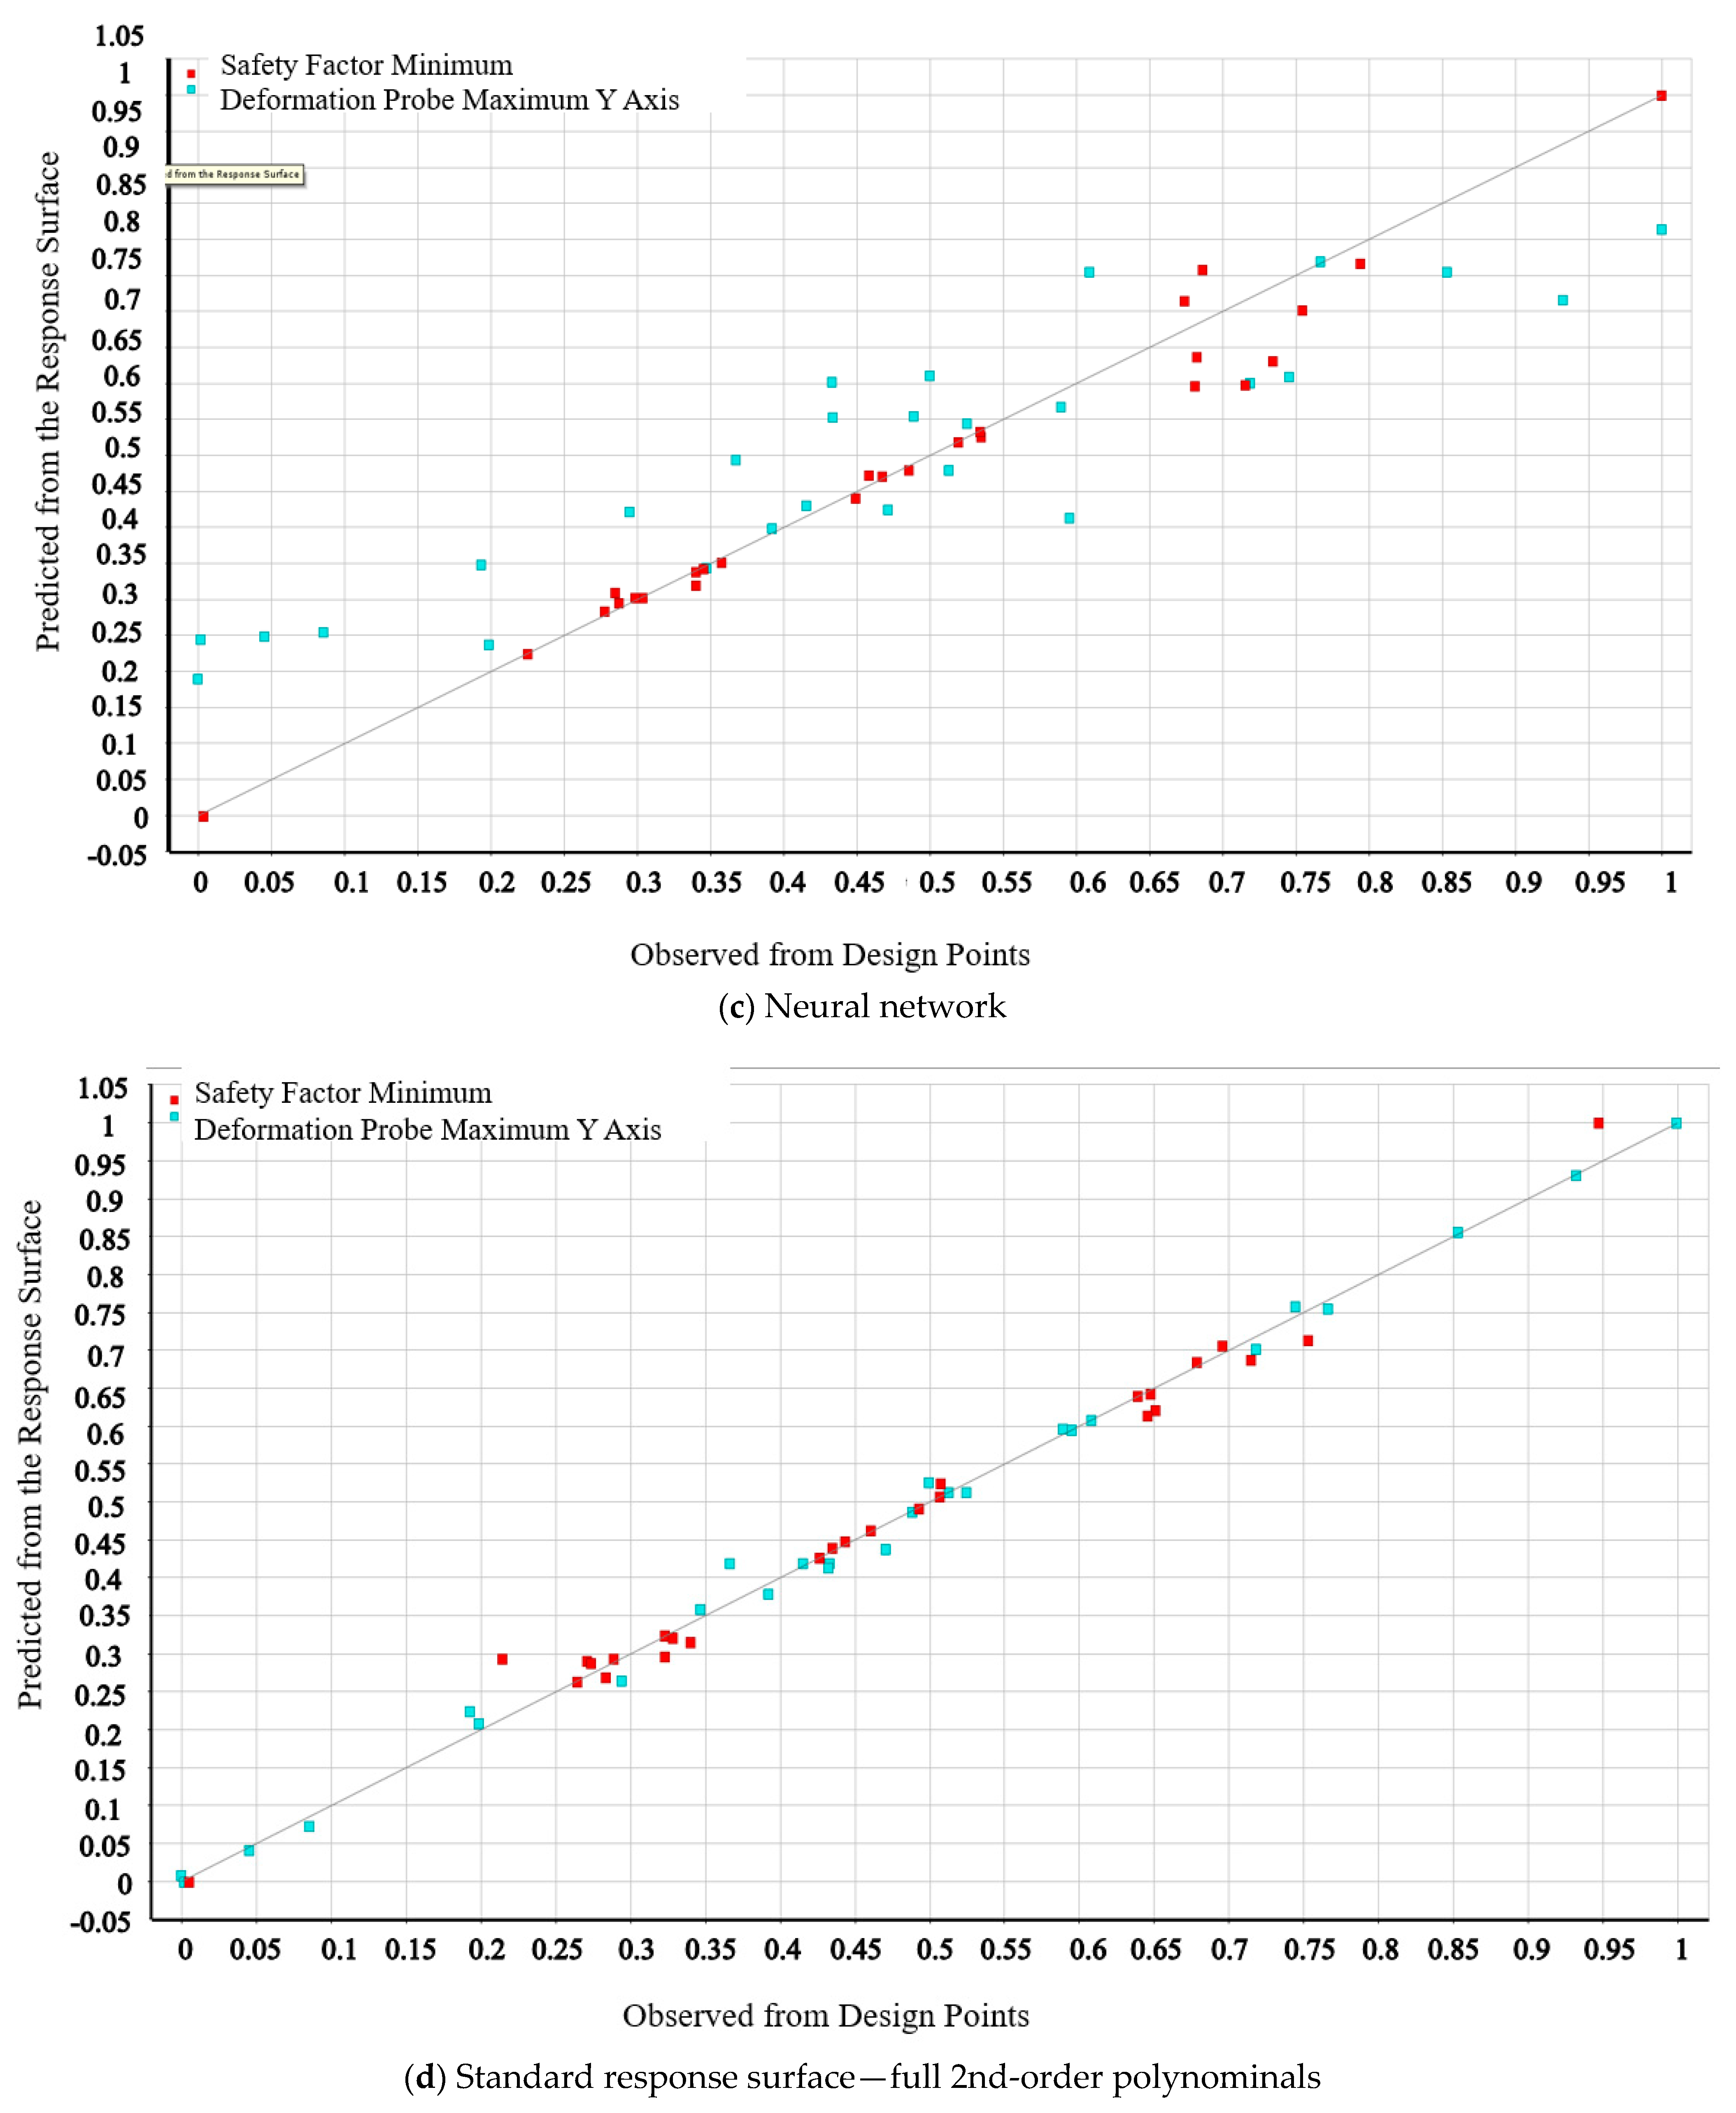
4.5.1. Establishment of Numerical Experiment Data Based on the Response Surface Method
4.5.2. Optimal Result
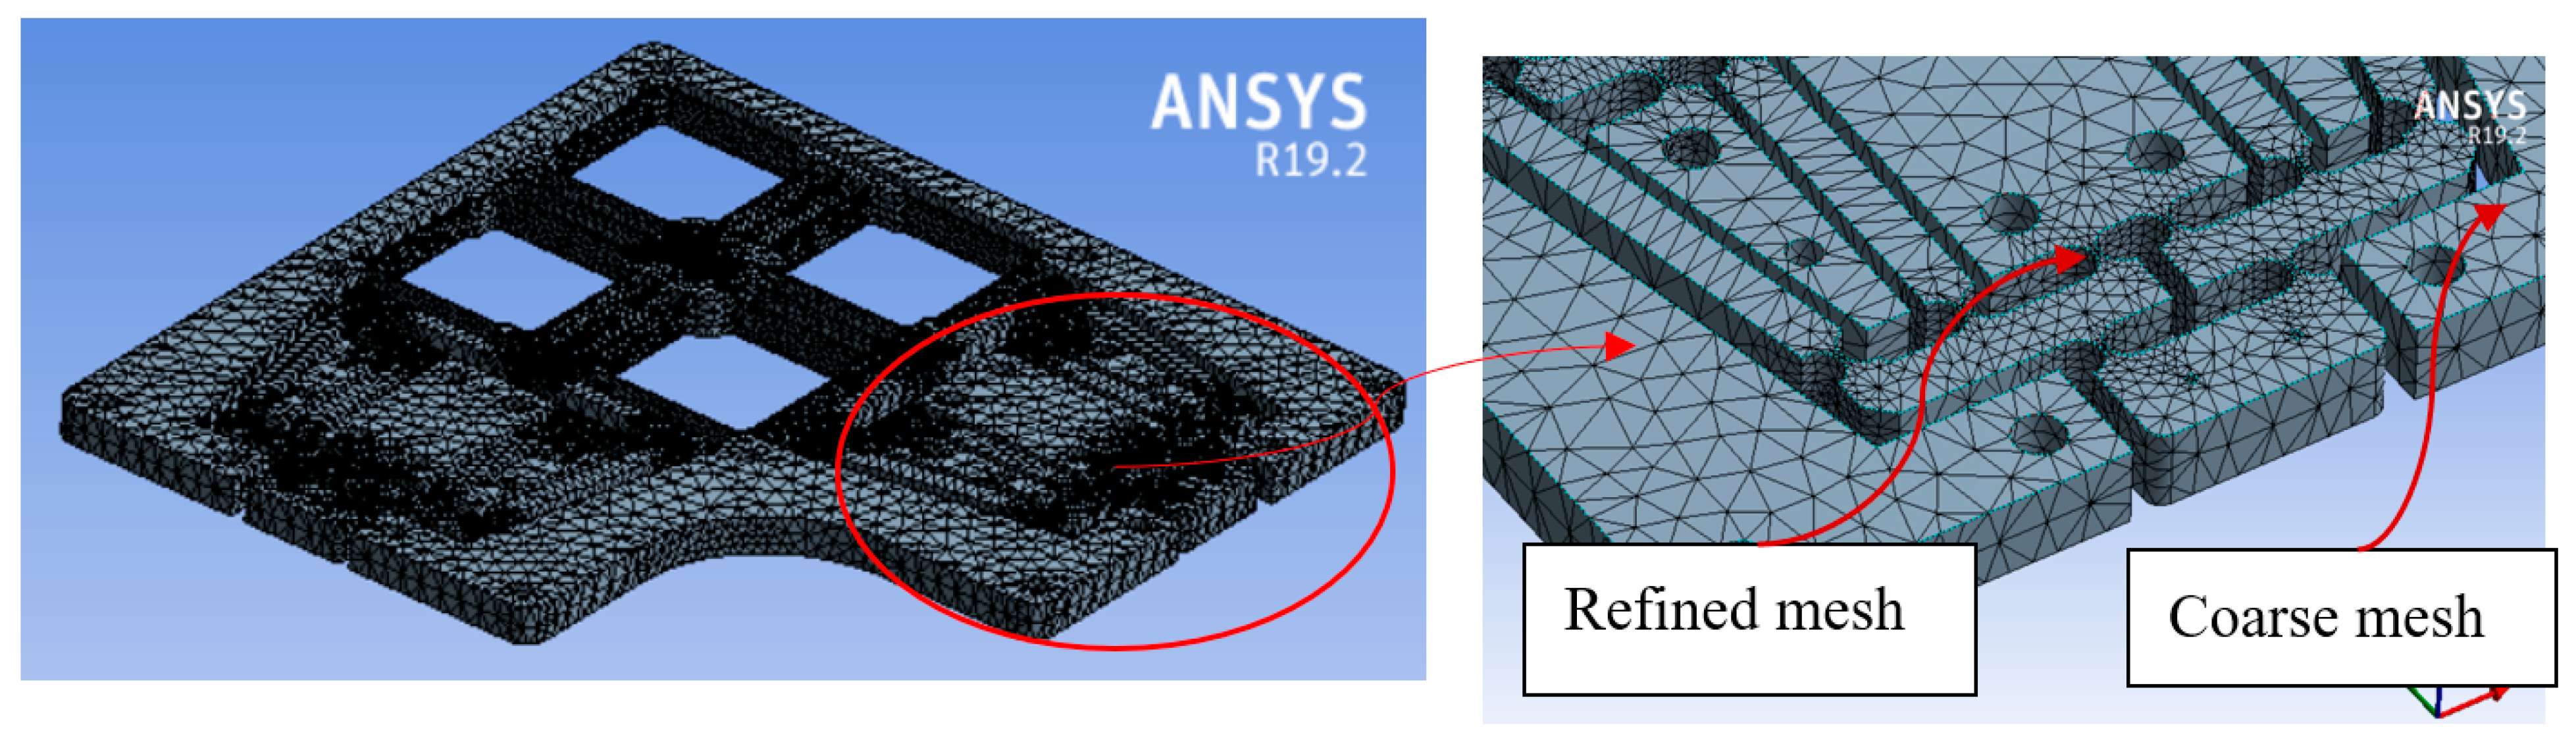
4.5.3. FEA Validation
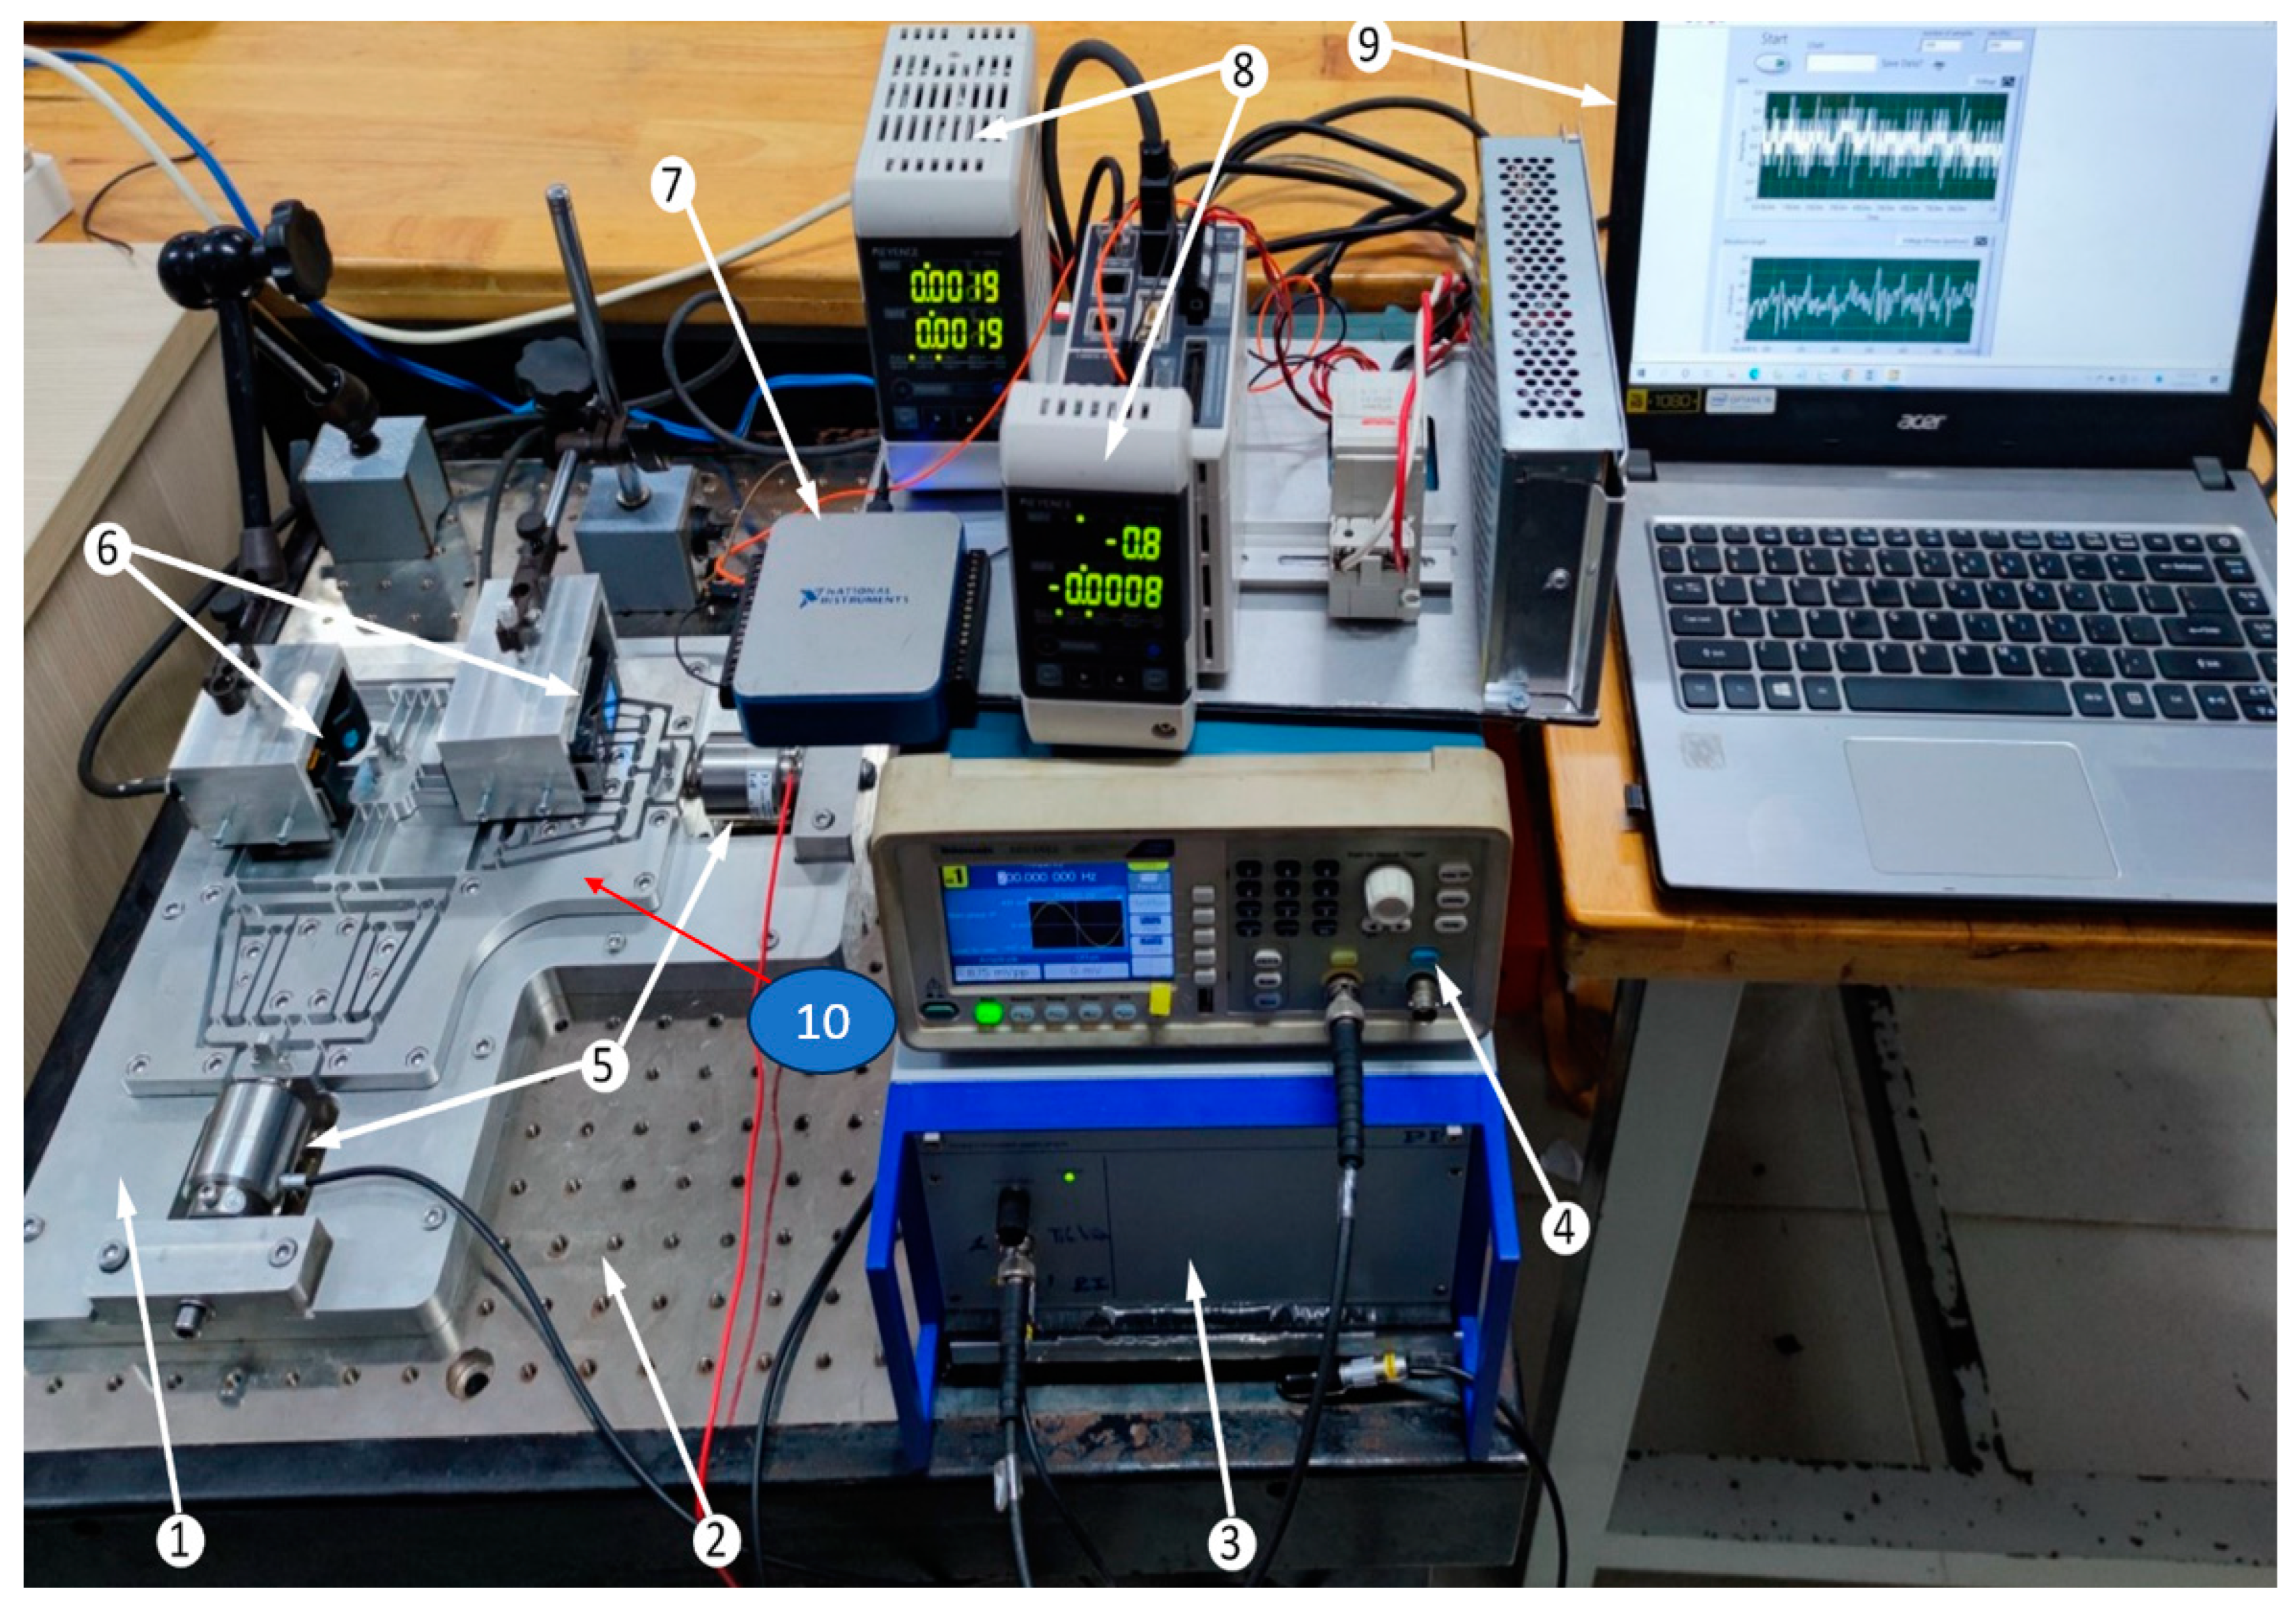
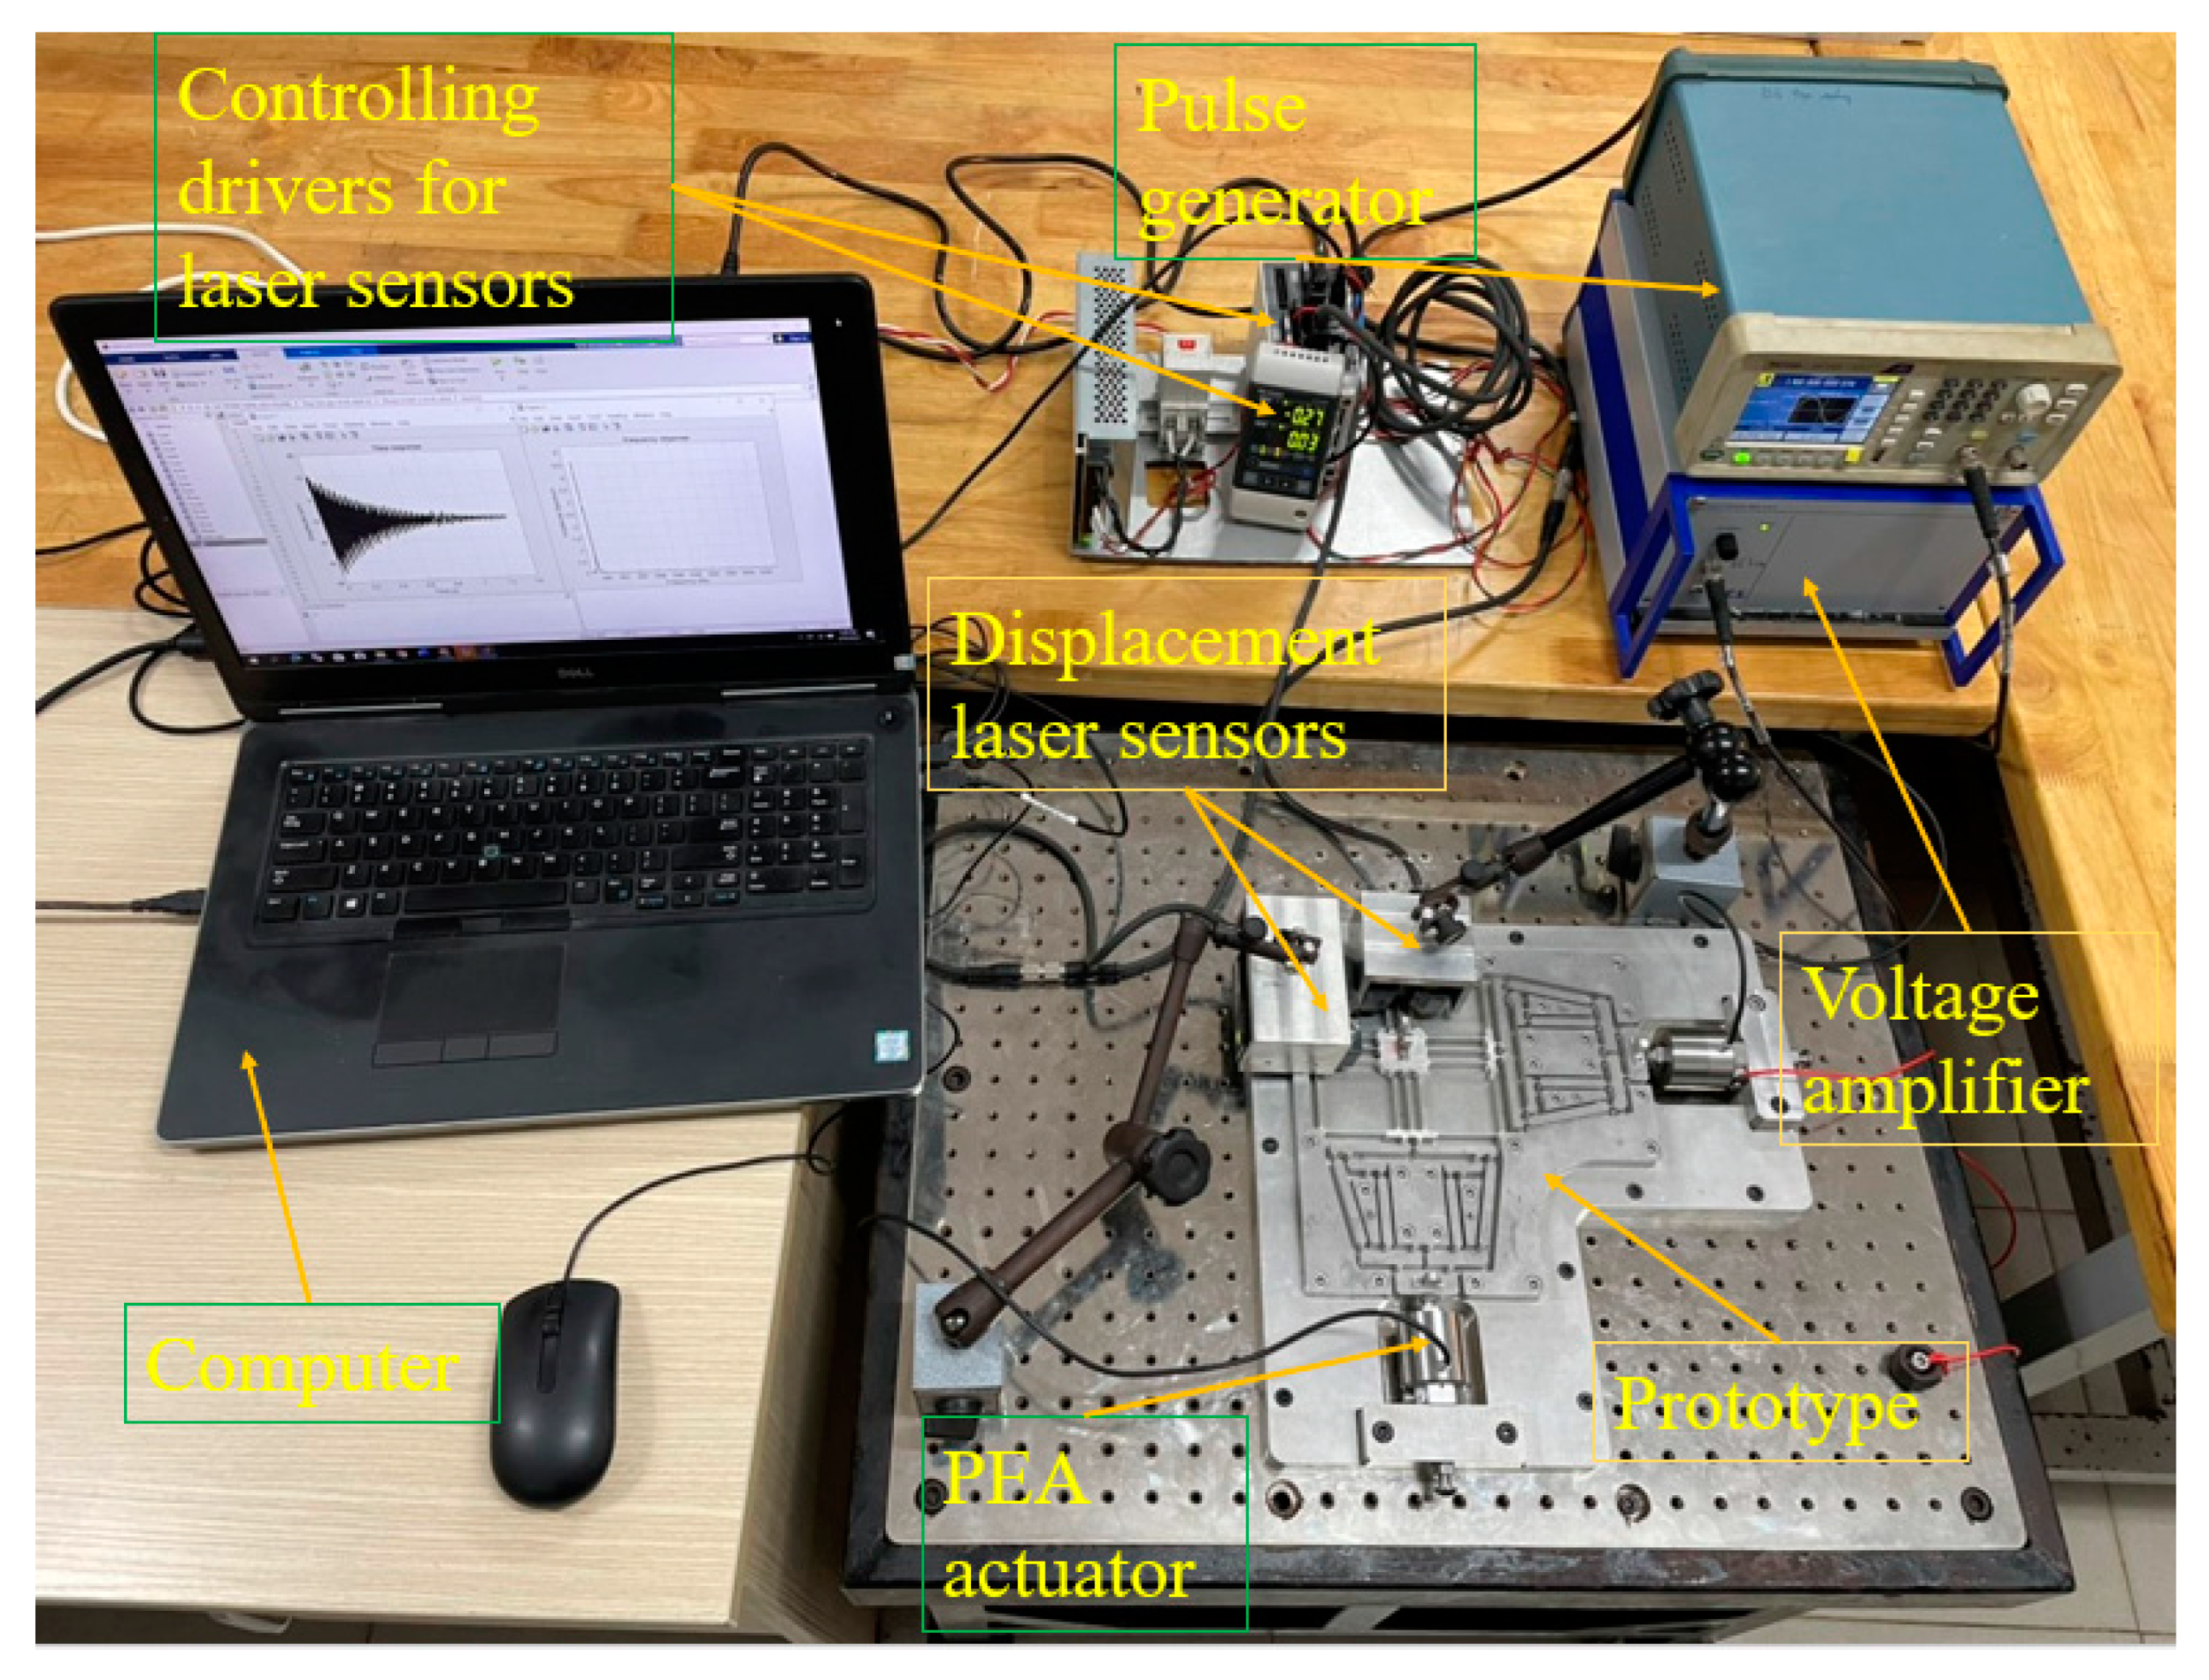
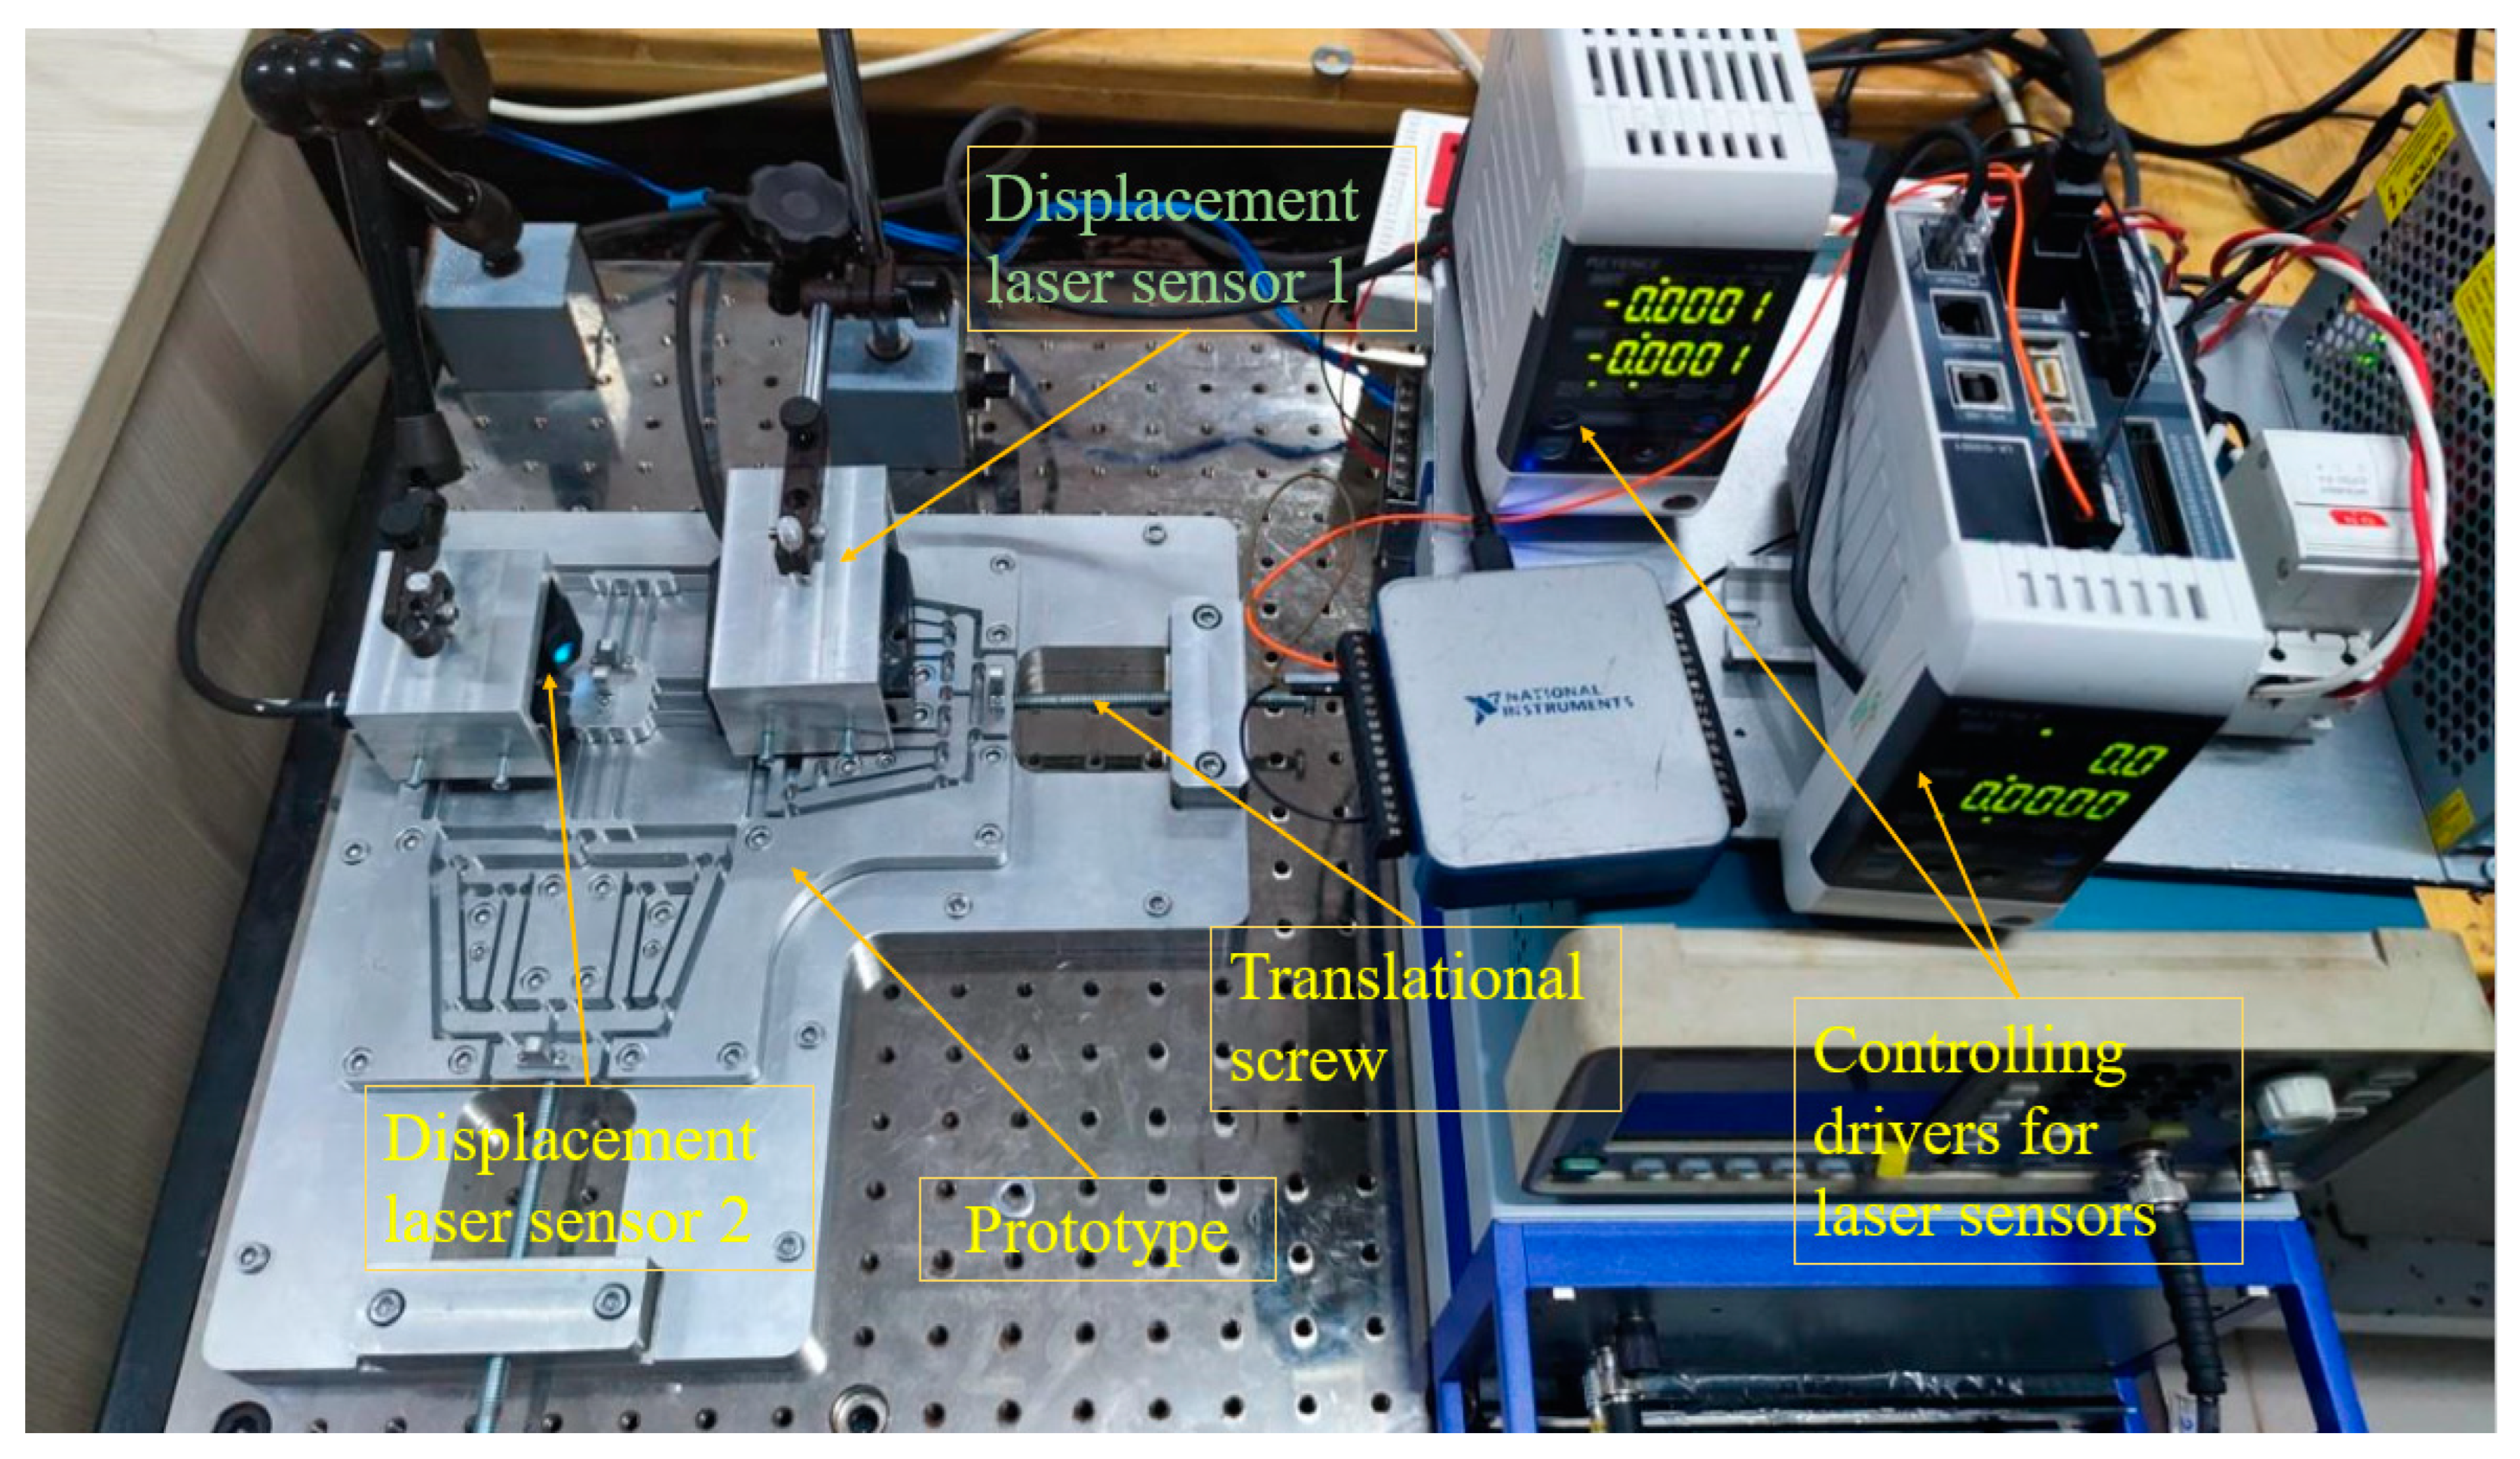
4.6. Experimental Study
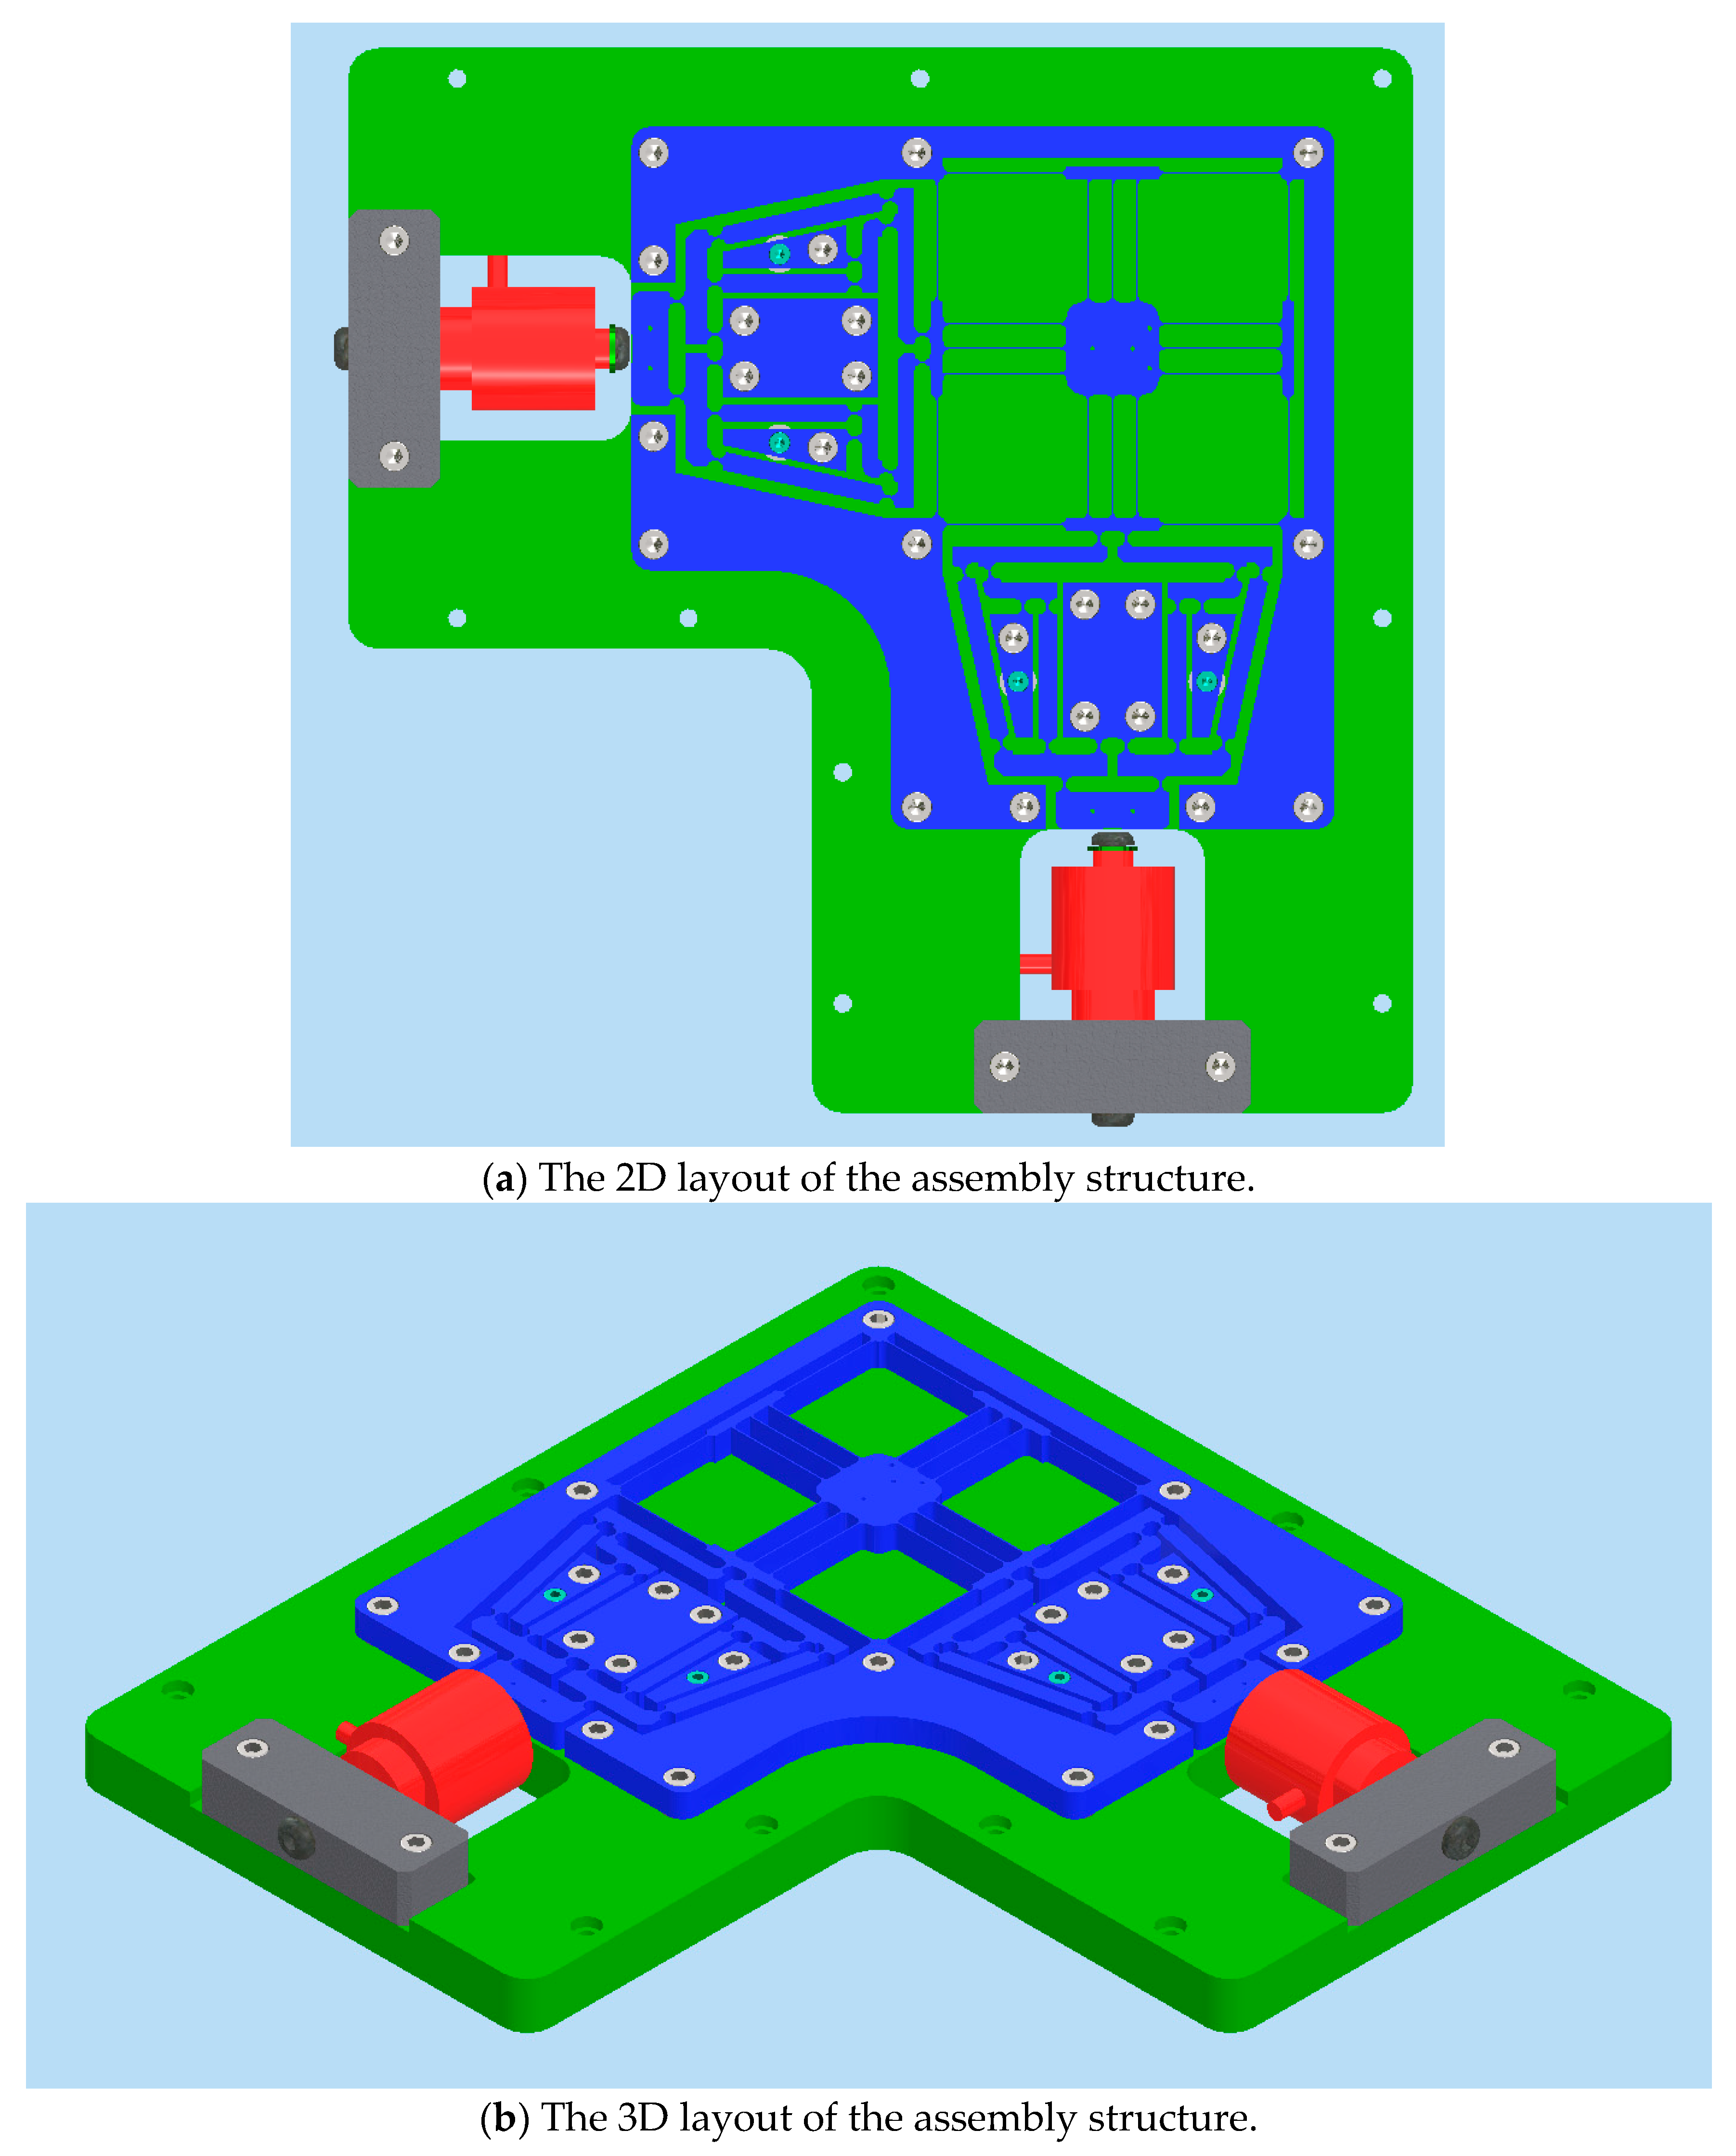
4.6.1. Prototype Fabrication
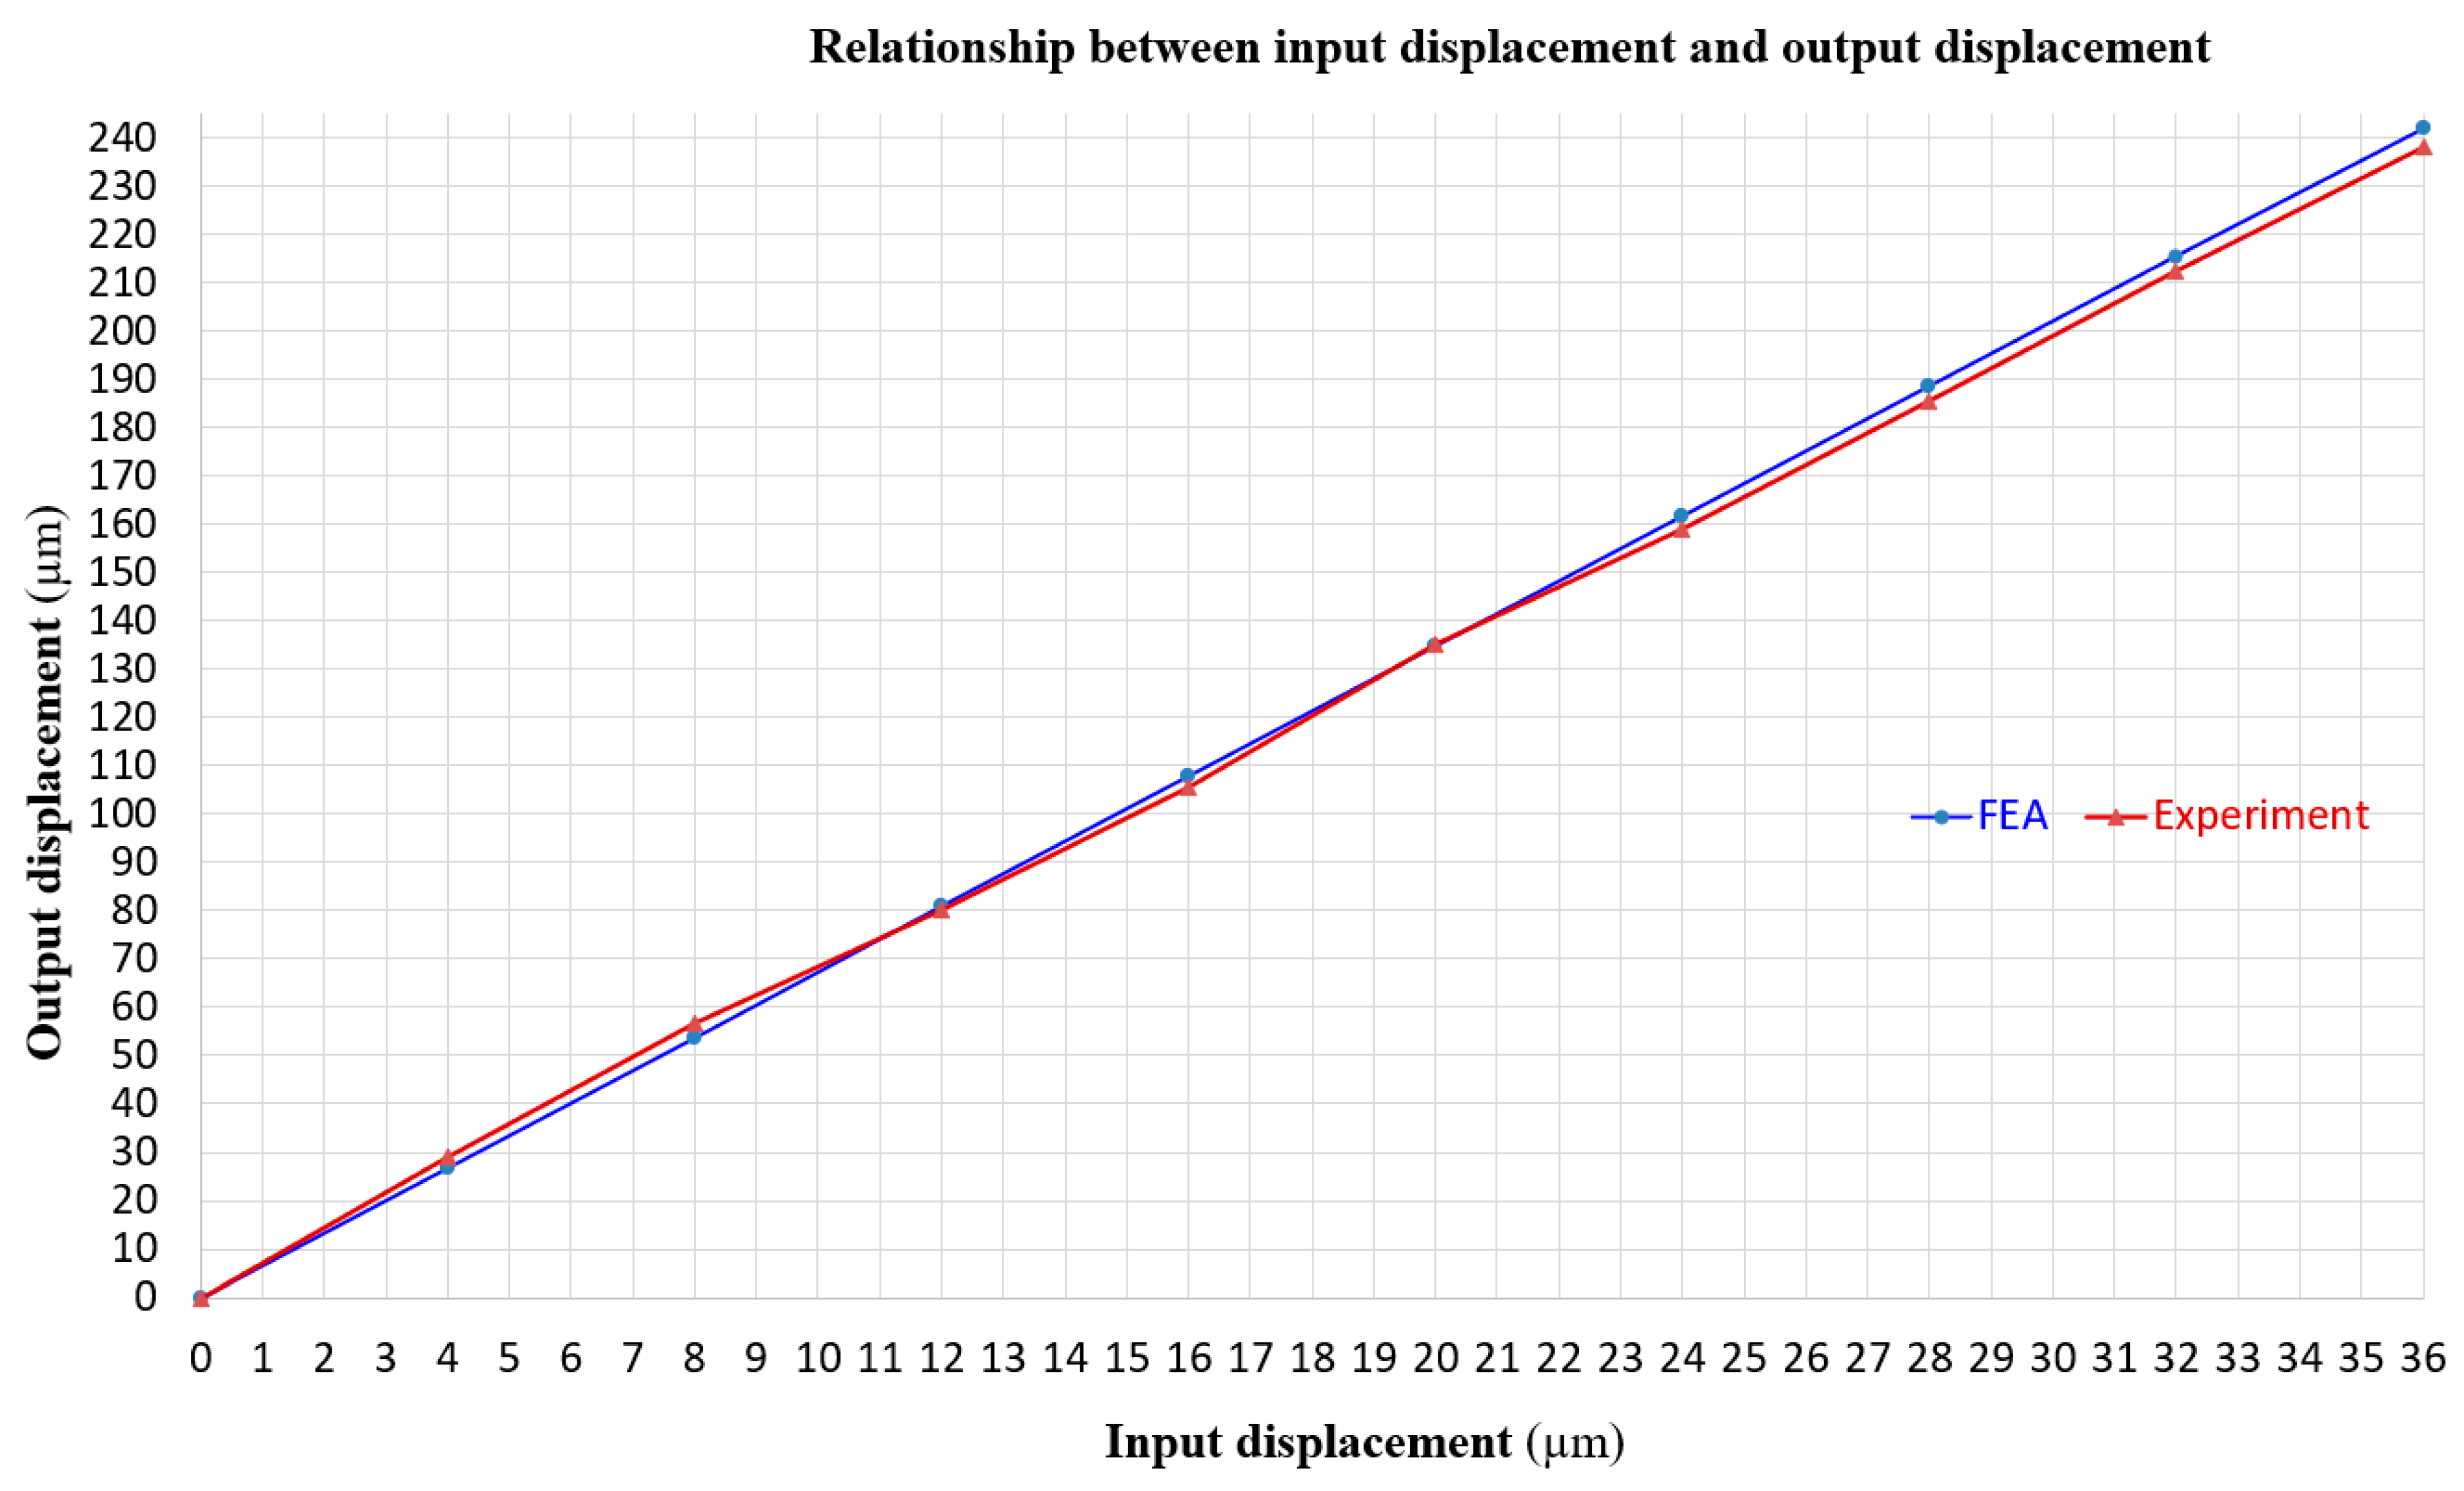
4.6.2. Experimental Results and Discussion
5. Conclusions
Author Contributions
Funding
Data Availability Statement
Conflicts of Interest
Nomenclature
| 1-dof | One degree of freedom |
| 2-dof | Two degrees of freedom |
| TM | Taguchi method |
| RSM | Response surface methodology |
| ASDA | Advanced six-lever displacement amplifier |
| PEA | Piezoelectric actuator |
| LAM | Lever displacement amplifier |
| FEA | Finite element analysis |
| FEM | Finite element method |
| NSGA-II | Nondominated Sorting Genetic Algorithm II |
| f | First natural frequency |
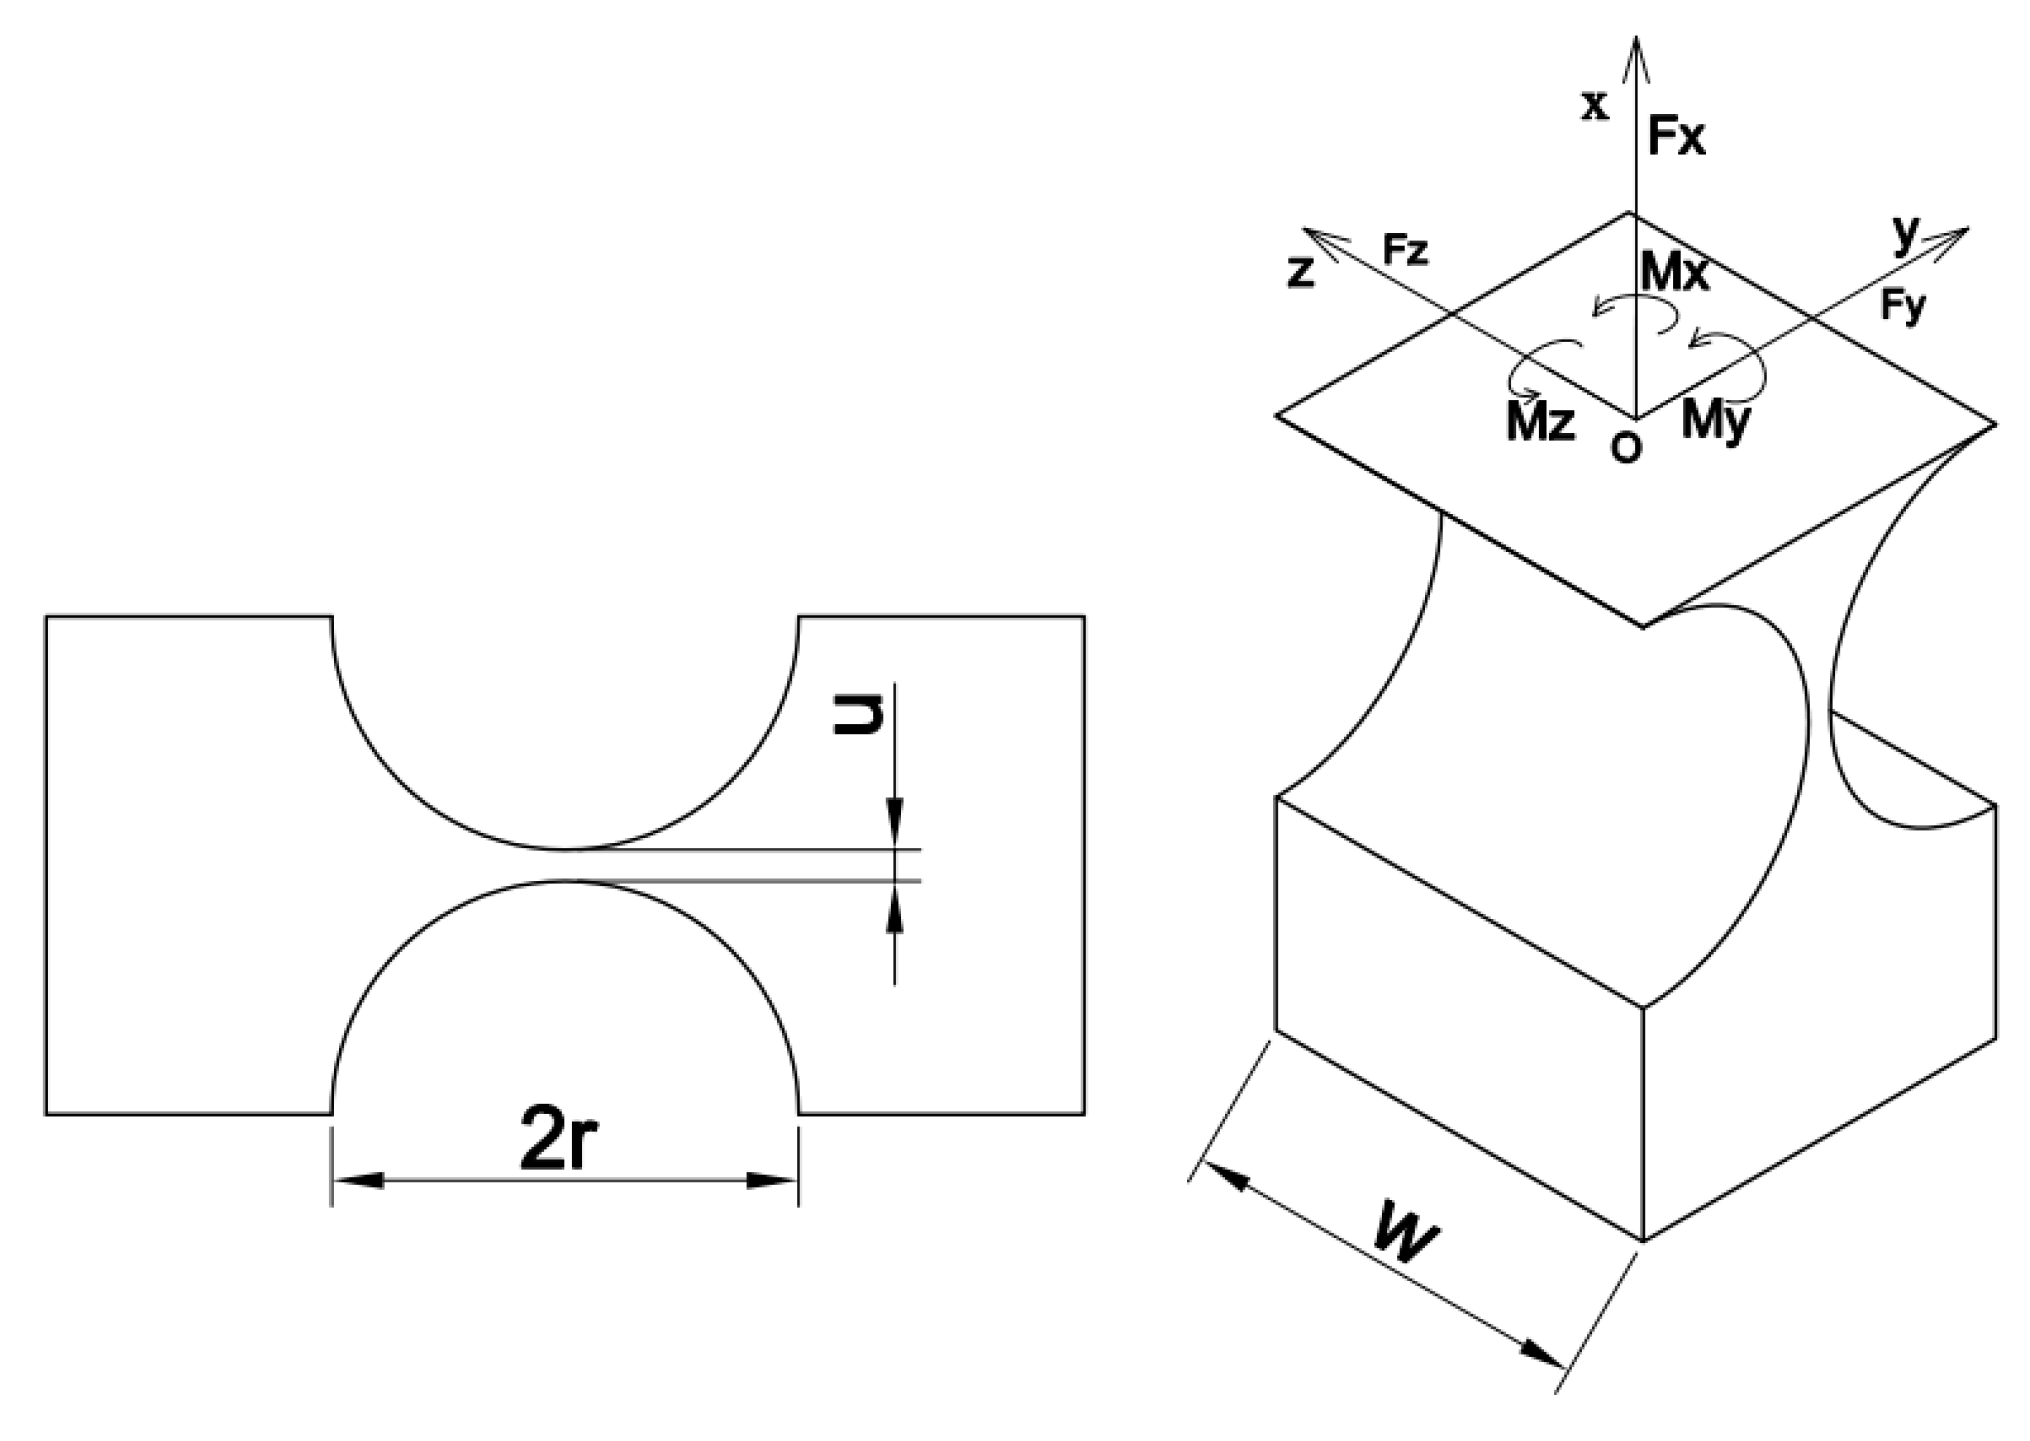
| The bending rigidity of right circular hinge | |
| The rotation rigidity of right circular hinge | |
| Linear stiffness of right circular hinge | |
| CCD | Central composite design |
| The rotation rigidity of leaf hinge | |
| Linear stiffness of leaf hinge |
References
- Hu, Z.; Lynne, K.J.; Markondapatnaikuni, S.P.; Delfanian, F. Material elastic–plastic property characterization by nanoindentation testing coupled with computer modeling. Mater. Sci. Eng. A 2013, 587, 268–282. [Google Scholar] [CrossRef]
- Nowak, J.D.; Rzepiejewska-Malyska, K.A.; Major, R.C.; Warren, O.L.; Michler, J. In-situ nanoindentation in the SEM. Mater. Today 2010, 12, 44–45. [Google Scholar] [CrossRef]
- Guo, Z.; Ma, T.; Yang, X.; Li, J.; Li, W.; Vairis, A. Multi-scale analyses of phase transformation mechanisms and hardness in linear friction welded Ti17 (α + β)/Ti17 (β) dissimilar titanium alloy joint. Chin. J. Aeronaut. 2024, 37, 312–324. [Google Scholar] [CrossRef]
- Alderete, N.; Zaheri, A.; Espinosa, H.D. A novel in situ experiment to investigate wear mechanisms in biomaterials. Exp. Mech. 2019, 59, 659–667. [Google Scholar] [CrossRef]
- Howell, L.L.; Magleby, S.P.; Olsen, B.M.; Wiley, J. (Eds.) Handbook of Compliant Mechanisms; John Wiley & Sons, Incorporated: New York, NY, USA, 2013. [Google Scholar]
- Song, B.; Zhang, D.; Jing, X.; Ren, Y.; Chen, Y.; Li, H. Theoretical and Experimental Investigation of Surface Textures in Vibration-Assisted Micro Milling. Micromachines 2024, 15, 139. [Google Scholar] [CrossRef]
- Rashed, E.O.; Nofal, A.; Abd EI-Malek, A.H.; Hossam, M. Development of a Two-Dimensional Ultrasonic Device for Vibration-Assisted Milling. Machines 2022, 10, 362. [Google Scholar] [CrossRef]
- Dang, M.P.; Le, H.G.; Le, N.N.T.; Le Chau, N.; Dao, T.P. Multiresponse optimization for a novel compliant Z-stage by a hybridization of response surface method and whale optimization algorithm. Math. Probl. Eng. 2021, 2021, 9974230. Available online: https://onlinelibrary.wiley.com/doi/epdf/10.1155/2021/9974230 (accessed on 12 June 2024). [CrossRef]
- Rabe, R.; Breguet, J.M.; Schwaller, P.; Stauss, S.; Haug, F.J.; Patscheider, J.; Michler, J. Observation of fracture and plastic deformation during indentation and scratching inside the scanning electron microscope. Thin Solid Film. 2004, 469, 206–213. [Google Scholar] [CrossRef]
- Huang, H.; Zhao, H.; Mi, J.; Yang, J.; Wan, S.; Xu, L.; Ma, Z. A novel and compact nanoindentation device for in situ nanoindentation tests inside the scanning electron microscope. Aip Adv. 2012, 2, 012104. [Google Scholar] [CrossRef]
- Huang, H.; Zhao, H.; Shi, C.; Hu, X.; Cui, T.; Tian, Y. A tension stress loading unit designed for characterizing indentation response of single crystal silicon under tension stress. AIP Adv. 2013, 3, 092125. [Google Scholar] [CrossRef]
- Dang, M.P.; Le, H.G.; Tran, N.T.D.; Chau, N.L.; Dao, T.P. Optimal design and analysis for a new 1-DOF compliant stage based on additive manufacturing method for testing medical specimens. Symmetry 2022, 14, 1234. [Google Scholar] [CrossRef]
- Huang, H.; Zhao, H.; Mi, J.; Yang, J.; Wan, S.; Yang, Z.; Geng, C. Experimental research on a modular miniaturization nanoindentation device. Rev. Sci. Instrum. 2011, 82, 095101. [Google Scholar] [CrossRef]
- Li, J.; Huang, H.; Morita, T. Stepping piezoelectric actuators with large working stroke for nano-positioning systems: A review. Sens. Actuators A Phys. 2019, 292, 39–51. [Google Scholar] [CrossRef]
- Kim, H.Y.; Ahn, D.H.; Gweon, D.G. Development of a novel 3-degrees of freedom flexure based positioning system. Rev. Sci. Instrum. 2012, 83, 055114. [Google Scholar] [CrossRef]
- Ling, M.; Cao, J.; Jiang, Z.; Zeng, M.; Li, Q. Optimal design of a piezo-actuated 2-DOF millimeter-range monolithic flexure mechanism with a pseudo-static model. Mech. Syst. Signal Process. 2019, 115, 120–131. [Google Scholar] [CrossRef]
- Dao, T.P.; Huang, S.C. Design and multi-objective optimization for a broad self-amplified 2-DOF monolithic mechanism. Sādhanā 2017, 42, 1527–1542. [Google Scholar] [CrossRef]
- Yong, Y.K.; Aphale, S.S.; Moheimani, S.R. Design, identification, and control of a flexure-based XY stage for fast nanoscale positioning. IEEE Trans. Nanotechnol. 2008, 8, 46–54. [Google Scholar] [CrossRef]
- Ding, B.; Li, Y. Design and analysis of a decoupled XY micro compliant parallel manipulator. In Proceedings of the 2014 IEEE International Conference on Robotics and Biomimetics (ROBIO 2014), Bali, Indonesia, 5–10 December 2014; pp. 1898–1903. [Google Scholar]
- Zhou, S.; Yan, P. Design and Analysis of a Hybrid Displacement Amplifier Supporting a High-Performance Piezo Jet Dispenser. Micromachines 2023, 14, 322. [Google Scholar] [CrossRef]
- Wu, H.; Lai, L.; Zhang, L.; Zhu, L. A novel compliant XY micro-positioning stage using bridge-type displacement amplifier embedded with Scott-Russell mechanism. Precis. Eng. 2022, 73, 284–295. [Google Scholar] [CrossRef]
- Gu, Y.; Duan, X.; Lin, J.; Yi, A.; Kang, M.; Jiang, J.; Zhou, W. Design, analysis, and testing of a novel 2-DOF vibration-assisted polishing device driven by the piezoelectric actuators. Int. J. Adv. Manuf. Technol. 2020, 111, 471–493. [Google Scholar] [CrossRef]
- Wu, Z.; Li, Y.; Hu, M. Design and optimization of full decoupled micro/nano-positioning stage based on mathematical calculation. Mech. Sci. 2018, 9, 417–429. [Google Scholar] [CrossRef]
- Zhang, Q.; Zhao, J.; Peng, Y.; Pu, H.; Yang, Y. A novel amplification ratio model of a decoupled XY precision positioning stage combined with elastic beam theory and Castigliano’s second theorem considering the exact loading force. Mech. Syst. Signal Process. 2020, 136, 106473. [Google Scholar] [CrossRef]
- Zhu, W.L.; Zhu, Z.; Guo, P.; Ju, B.F. A novel hybrid actuation mechanism based XY nanopositioning stage with totally decoupled kinematics. Mech. Syst. Signal Process. 2018, 99, 747–759. [Google Scholar] [CrossRef]
- Ding, B.; Li, Y.; Xiao, X.; Tang, Y.; Li, B. Design and analysis of a 3-DOF planar micromanipulation stage with large rotational displacement for micromanipulation system. Mech. Sci. 2017, 8, 117–126. [Google Scholar] [CrossRef]
- Dang, M.P.; Le, H.G.; Chau, N.L.; Dao, T.P. Optimization for a flexure hinge using an effective hybrid approach of fuzzy logic and moth-flame optimization algorithm. Math. Probl. Eng. 2021, 2021, 6622655. Available online: https://onlinelibrary.wiley.com/doi/epdf/10.1155/2021/6622655 (accessed on 12 June 2024). [CrossRef]
- Dao, T.P.; Huang, S.C.; Thang, P.T. Hybrid Taguchi-cuckoo search algorithm for optimization of a compliant focus positioning platform. Appl. Soft Comput. 2017, 57, 526–538. [Google Scholar] [CrossRef]
- Huang, S.C.; Dao, T.P. Multi-objective optimal design of a 2-DOF flexure-based mechanism using hybrid approach of grey-Taguchi coupled response surface methodology and entropy measurement. Arab. J. Sci. Eng. 2016, 41, 5215–5231. [Google Scholar] [CrossRef]
- Murugan, P.; Kannan, S.; Baskar, S. NSGA-II algorithm for multi-objective generation expansion planning problem. Electr. Power Syst. Res. 2009, 79, 622–628. [Google Scholar] [CrossRef]
- Martínez-Vargas, A.; Domínguez-Guerrero, J.; Andrade, Á.G.; Sepúlveda, R.; Montiel-Ross, O. Application of NSGA-II algorithm to the spectrum assignment problem in spectrum sharing networks. Appl. Soft Comput. 2016, 39, 188–198. [Google Scholar] [CrossRef]


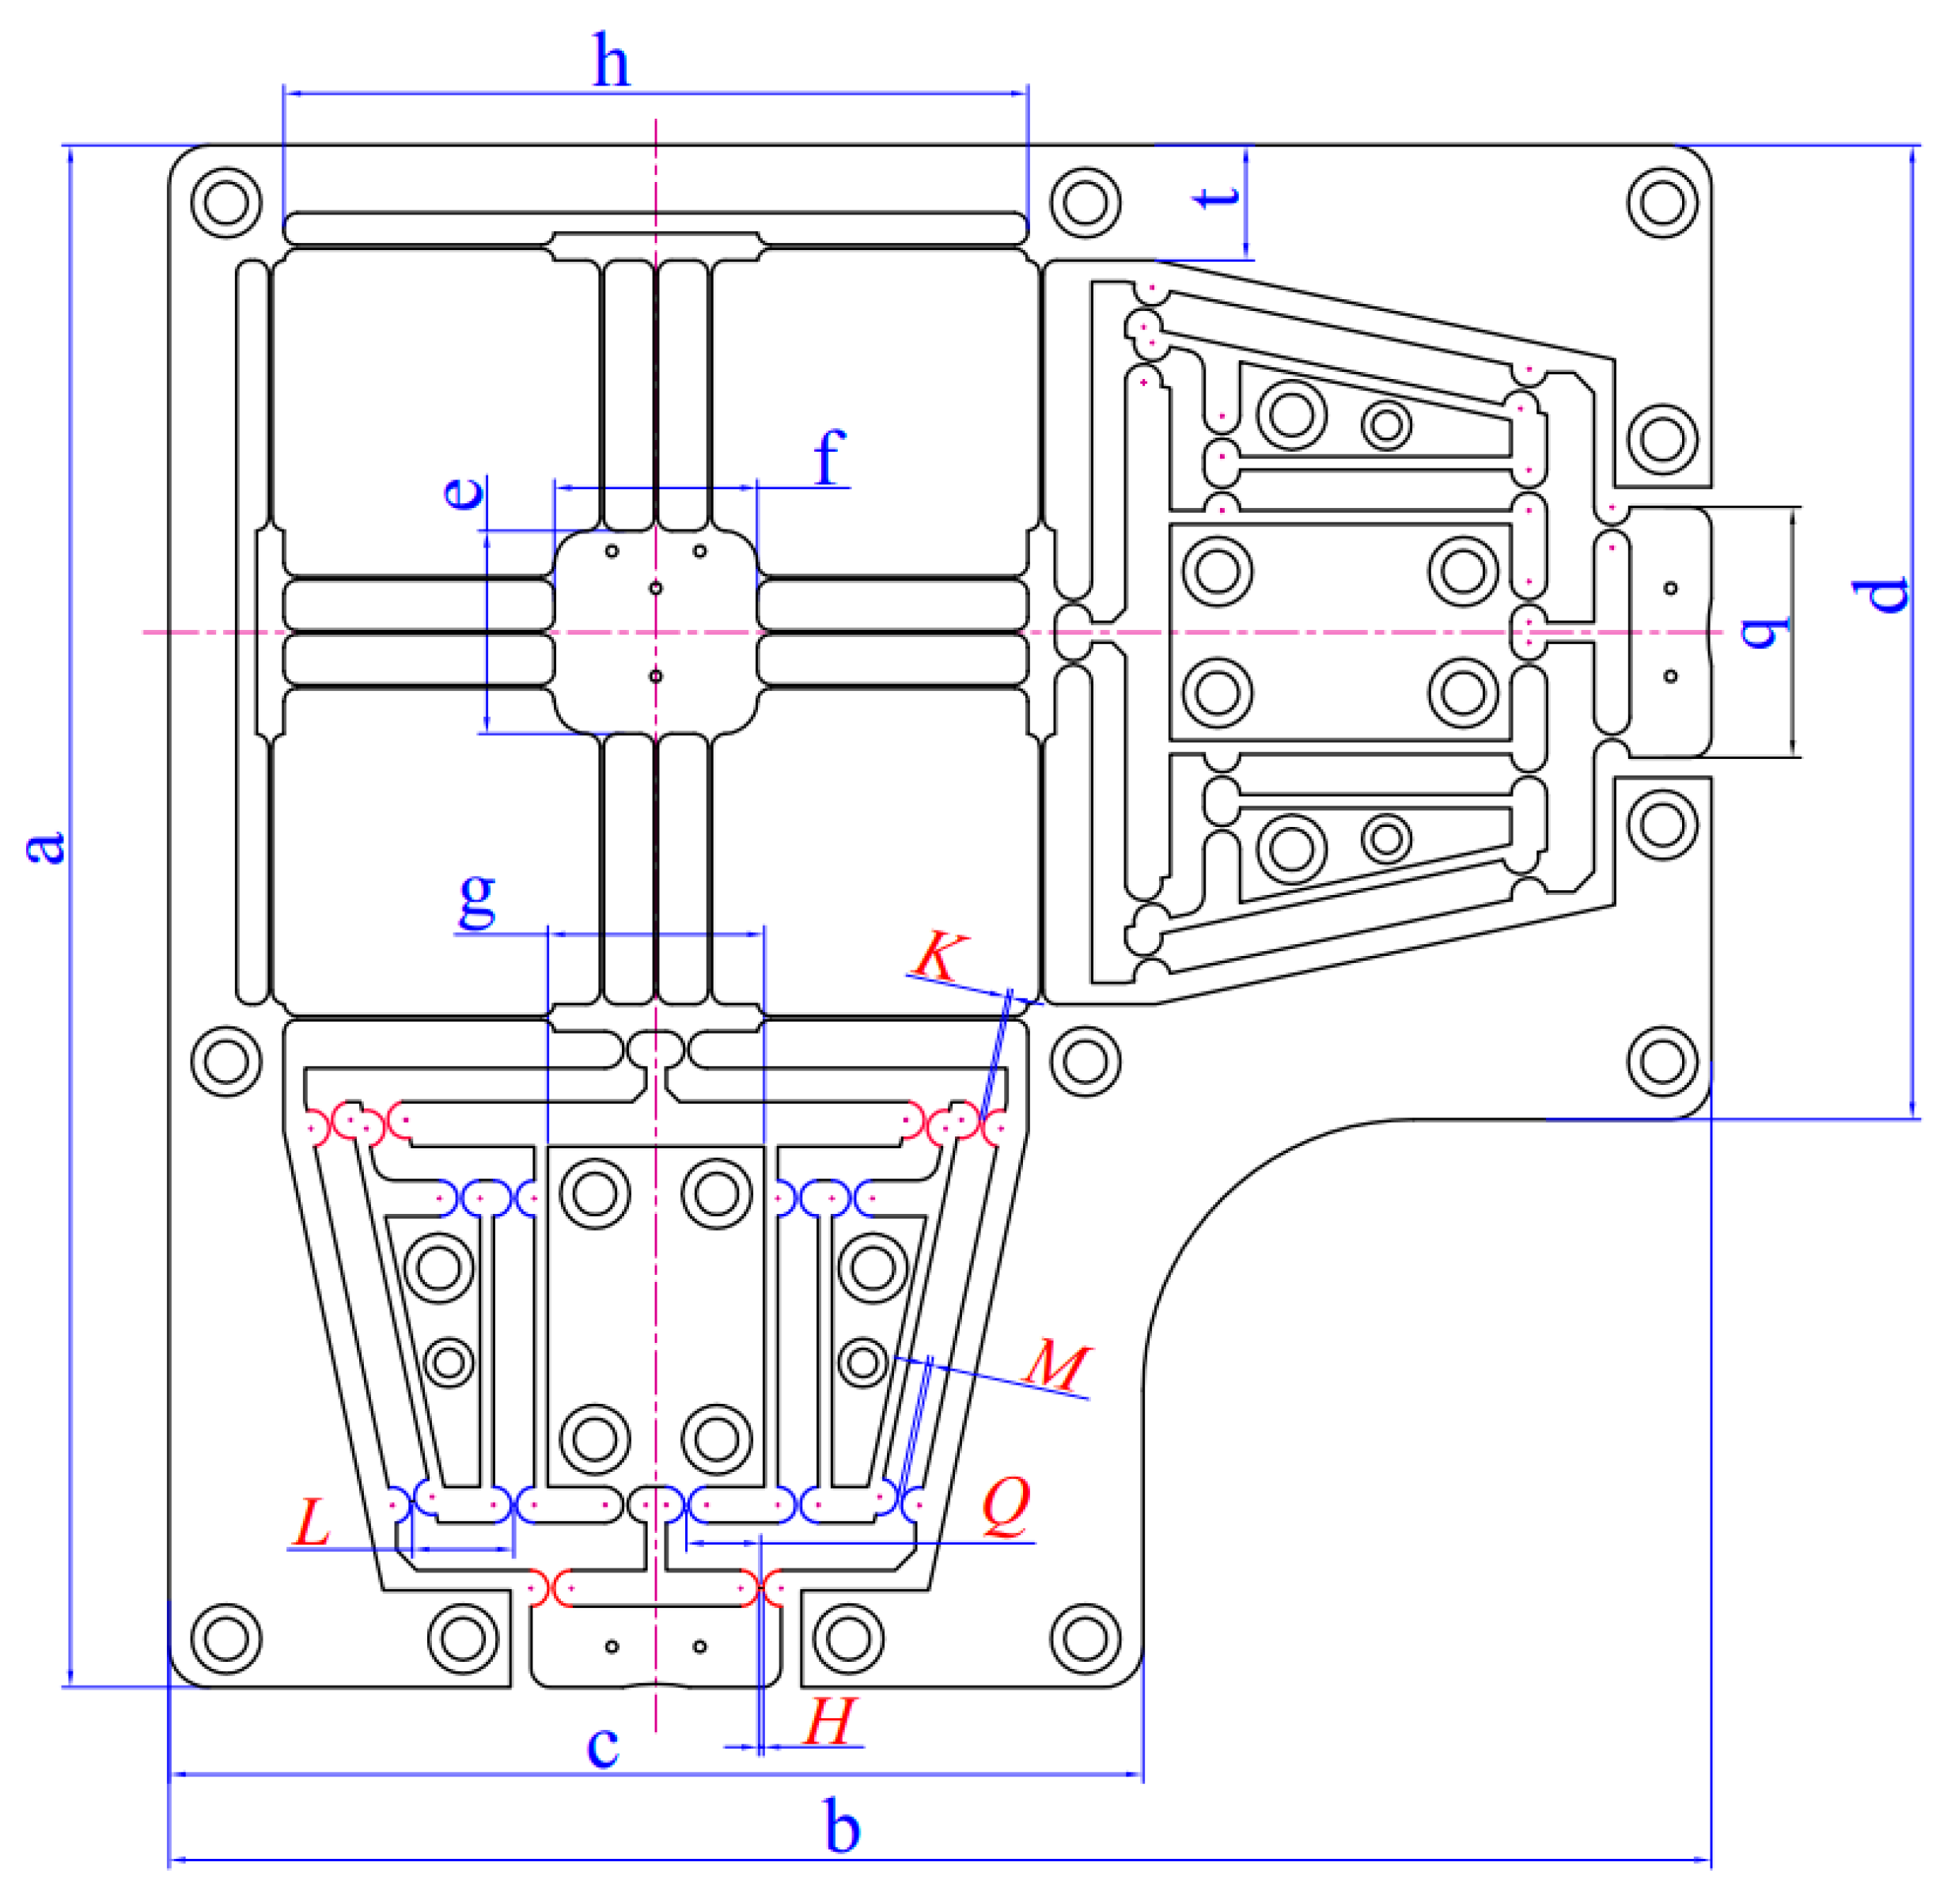
| Symbol | Value (mm) | Symbol | Value (mm) |
|---|---|---|---|
| a | 228 | h | 110 |
| b | 228 | q | 37 |
| c | 144 | ||
| d | 144 | K | 0.5 < K < 0.6 |
| e | 30 | M | 0.53 < M < 0.65 |
| f | 30 | H | 0.62 < H < 0.74 |
| g | 30 | Q | 7.2 < Q < 12 |
| t | 17 | L | 15 < L < 18 |
| Response | Analytical Analysis | FEA | Error (%) |
|---|---|---|---|
| f (Hz) | 391.91 | 386.78 | 1.3 |
| No. | Input Deformation (µm) | Output Deformation (Y-Direction) (µm) | Output Deformation (X-Direction) (µm) | Decoupling Mobility Error (%) |
|---|---|---|---|---|
| 1 | 2 | −12.585 | −2.73 × 10⁻⁴ | 0.002169805 |
| 2 | 4 | −25.17 | −5.46 × 10⁻⁴ | 0.002169766 |
| 3 | 6 | −37.756 | −8.19 × 10⁻⁴ | 0.002169695 |
| 4 | 8 | −50.341 | −1.09 × 10⁻³ | 0.002169802 |
| 5 | 10 | −62.926 | −1.37 × 10⁻³ | 0.002169691 |
| 6 | 12 | −75.511 | −1.64 × 10⁻³ | 0.00216975 |
| 7 | 14 | −88.096 | −1.91 × 10⁻³ | 0.002169792 |
| 8 | 16 | −100.68 | −2.18 × 10⁻³ | 0.002169746 |
| 9 | 18 | −113.27 | −2.46 × 10⁻³ | 0.002169683 |
| 10 | 20 | −125.85 | −2.73 × 10⁻³ | 0.002169805 |
| 11 | 22 | −138.44 | −3.00 × 10⁻³ | 0.002169749 |
| 12 | 24 | −151.02 | −3.28 × 10⁻³ | 0.002169779 |
| 13 | 26 | −163.61 | −3.55 × 10⁻³ | 0.002169733 |
| 14 | 28 | −176.19 | −3.82 × 10⁻³ | 0.002169817 |
| 15 | 30 | −188.78 | −4.10 × 10⁻³ | 0.002169721 |
| 16 | 32 | −201.36 | −4.37 × 10⁻³ | 0.002169746 |
| 17 | 34 | −213.95 | −4.64 × 10⁻³ | 0.002169713 |
| 18 | 36 | −226.53 | −4.92 × 10⁻³ | 0.002169779 |
| No. | K (mm) | M (mm) | H (mm) | Q (mm) | L (mm) | Safety Factor (F1) | Output Displacement (F2) (µm) |
|---|---|---|---|---|---|---|---|
| 1 | 0.59 | 0.55 | 0.68 | 9.6 | 16.5 | 2.470306 | −227.048 |
| 2 | 0.53 | 0.55 | 0.68 | 9.6 | 16.5 | 2.469848 | −229.74 |
| 3 | 0.65 | 0.55 | 0.68 | 9.6 | 16.5 | 2.422369 | −223.184 |
| 4 | 0.59 | 0.5 | 0.68 | 9.6 | 16.5 | 2.459544 | −232.922 |
| 5 | 0.59 | 0.6 | 0.68 | 9.6 | 16.5 | 2.332124 | −216.928 |
| 6 | 0.59 | 0.55 | 0.62 | 9.6 | 16.5 | 2.306505 | −226.276 |
| 7 | 0.59 | 0.55 | 0.74 | 9.6 | 16.5 | 2.409697 | −225.984 |
| 8 | 0.59 | 0.55 | 0.68 | 7.2 | 16.5 | 2.093905 | −223.396 |
| 9 | 0.59 | 0.55 | 0.68 | 12 | 16.5 | 2.800037 | −223.495 |
| 10 | 0.59 | 0.55 | 0.68 | 9.6 | 15 | 2.416056 | −232.89 |
| 11 | 0.59 | 0.55 | 0.68 | 9.6 | 18 | 2.435406 | −219.271 |
| 12 | 0.573 | 0.535833 | 0.663 | 8.919985 | 16.92501 | 2.302705 | −227.368 |
| 13 | 0.607 | 0.535833 | 0.663 | 8.919985 | 16.07499 | 2.332288 | −229.829 |
| 14 | 0.573 | 0.564167 | 0.663 | 8.919985 | 16.07499 | 2.250798 | −226.645 |
| 15 | 0.607 | 0.564167 | 0.663 | 8.919985 | 16.92501 | 2.288336 | −218.001 |
| 16 | 0.573 | 0.535833 | 0.697 | 8.919985 | 16.07499 | 2.33591 | −232.195 |
| 17 | 0.607 | 0.535833 | 0.697 | 8.919985 | 16.92501 | 2.29305 | −224.523 |
| 18 | 0.573 | 0.564167 | 0.697 | 8.919985 | 16.92501 | 2.294966 | −221.429 |
| 19 | 0.607 | 0.564167 | 0.697 | 8.919985 | 16.07499 | 2.344968 | −225.998 |
| 20 | 0.573 | 0.535833 | 0.663 | 10.28001 | 16.07499 | 2.577991 | −231.552 |
| 21 | 0.607 | 0.535833 | 0.663 | 10.28001 | 16.92501 | 2.625953 | −225.102 |
| 22 | 0.573 | 0.564167 | 0.663 | 10.28001 | 16.92501 | 2.59868 | −221.001 |
| 23 | 0.607 | 0.564167 | 0.663 | 10.28001 | 16.07499 | 2.574061 | −224.923 |
| 24 | 0.573 | 0.535833 | 0.697 | 10.28001 | 16.92501 | 2.654309 | −228.208 |
| 25 | 0.607 | 0.535833 | 0.697 | 10.28001 | 16.07499 | 2.575252 | −225.386 |
| 26 | 0.573 | 0.564167 | 0.697 | 10.28001 | 16.07499 | 2.569094 | −224.713 |
| 27 | 0.607 | 0.564167 | 0.697 | 10.28001 | 16.92501 | 2.611664 | −220.66 |
| Characteristics | Constraint Type | Lower | Upper | Unit |
|---|---|---|---|---|
| Maximize safety factor | Values ≥ Lower | 2 | ||
| Maximize output displacement | Values ≥ Lower | 240 | (µm) |
| Input Parameters and Output Responses | Candidate Point 1 | Candidate Point 2 | Candidate Point 3 |
|---|---|---|---|
| M (mm) | 0.53015 | 0.53059 | 0.53045 |
| K (mm) | 0.50012 | 0.50018 | 0.50048 |
| H (mm) | 0.6398 | 0.62673 | 0.63099 |
| Q (mm) | 11.932 | 10.407 | 10.293 |
| L (mm) | 17.859 | 16.045 | 15.492 |
| Safety Factor (F1) | 3.1448 | 2.4922 | 2.4025 |
| Output displacment F2 (µm) | 248.24 | 248.24 | 248.9 |
| Attribute | Optimized Consequence Based on RSM | FEA Consequence | Discrepancy (%) |
|---|---|---|---|
| F1 | 2.4025 | 2.4989 | 3.86 |
| F2 (µm) | 248.9 | 242.16 | 2.78 |
| Response | Simulation | Experiment | Error (%) |
|---|---|---|---|
| f (Hz) | 371.83 | 329.59 | 11.36 (%) |
Disclaimer/Publisher’s Note: The statements, opinions and data contained in all publications are solely those of the individual author(s) and contributor(s) and not of MDPI and/or the editor(s). MDPI and/or the editor(s) disclaim responsibility for any injury to people or property resulting from any ideas, methods, instructions or products referred to in the content. |
© 2024 by the authors. Licensee MDPI, Basel, Switzerland. This article is an open access article distributed under the terms and conditions of the Creative Commons Attribution (CC BY) license (https://creativecommons.org/licenses/by/4.0/).
Share and Cite
Dang, M.P.; Le, H.G.; Tran, C.T.; Nguyen, V.D.T.; Chau, N.L. Analysis and Optimization of a Novel Compact Compliant 2-DOF Positioner for Positioning to Assess Bio-Specimen Characteristics. Machines 2024, 12, 421. https://doi.org/10.3390/machines12060421
Dang MP, Le HG, Tran CT, Nguyen VDT, Chau NL. Analysis and Optimization of a Novel Compact Compliant 2-DOF Positioner for Positioning to Assess Bio-Specimen Characteristics. Machines. 2024; 12(6):421. https://doi.org/10.3390/machines12060421
Chicago/Turabian StyleDang, Minh Phung, Hieu Giang Le, Chi Thien Tran, Vo Duc Trieu Nguyen, and Ngoc Le Chau. 2024. "Analysis and Optimization of a Novel Compact Compliant 2-DOF Positioner for Positioning to Assess Bio-Specimen Characteristics" Machines 12, no. 6: 421. https://doi.org/10.3390/machines12060421
APA StyleDang, M. P., Le, H. G., Tran, C. T., Nguyen, V. D. T., & Chau, N. L. (2024). Analysis and Optimization of a Novel Compact Compliant 2-DOF Positioner for Positioning to Assess Bio-Specimen Characteristics. Machines, 12(6), 421. https://doi.org/10.3390/machines12060421