Abstract
To address the limitations in predictive capabilities of thermal error models built from single-source, single-structure data, this paper proposes a thermal error prediction model based on decision-level fusion of multi-source heterogeneous information to enhance prediction accuracy. First, an experimental platform for multi-source heterogeneous information acquisition was constructed to collect thermal error data from different signal sources (multi-source) and different structures (heterogeneous). Next, based on the characteristics of the multi-source and heterogeneous data, relevant features were extracted to construct the feature set. Then, using the feature information set of the multi-source and heterogeneous data, thermal error prediction sub-models were established using Nonlinear Autoregressive models with exogenous inputs (NARX) and Gated Recurrent Units (GRUs) for a vertical machining center spindle. Finally, the entropy weight method was employed to assign the weights for the linear-weighted fusion rule, achieving decision-level fusion of multi-source heterogeneous information to obtain the final prediction result. This result was then compared with experimental results and the prediction results of single-source models. The findings indicate that the proposed thermal error prediction model closely matches the actual results and outperforms the single-source and single-structure data models in terms of Root-Mean-Square Error (RMSE), Coefficient of Determination (R2), and Mean Absolute Error (MAE).
1. Introduction
As a critical indicator of the advancement of high-end equipment manufacturing in a country or region, CNC machine tools play a pivotal role in strategic industries such as aerospace, defense, and automotive manufacturing. With continuous technological advancements and industrial upgrades, the pursuit of higher machining accuracy has become increasingly stringent, making thermal error control a crucial breakthrough for enhancing overall manufacturing quality. According to related studies, thermal errors account for as much as 40% to 70% of the total machining error in machine tools [1,2,3]. Therefore, reducing thermal errors in CNC machine tools is essential for enhancing their market competitiveness.
Methods to reduce thermal errors in machine tools primarily include error compensation and error avoidance. Error compensation mainly involves establishing predictive models based on the relationship between temperature changes in the machine tool and thermal displacement to calculate thermal error compensation values. This approach is a current research emphasis [4,5,6,7,8]. For instance, Wei et al. [9] investigated the thermal accuracy characteristics of machine tool spindles from a data-driven perspective and proposed a spindle accuracy modeling method combining composite quantile regression with elastic net regularization. This method demonstrated higher predictive accuracy compared to existing modeling methods, improving accuracy by 93.3% compared to pre-compensation levels. Mareš et al. [10] applied a linear superposition transfer function to thermal error modeling of gantry-type five-axis milling centers and validated the industrial applicability of the model through actual machining experiments. Cheng et al. [11] utilized the global optimization and real-time capabilities of the dung beetle optimizer (DBO) to optimize the influencing factors of support vector machines, constructing a DBO-SVM-based thermal error prediction model for electric spindles, which improved the prediction model’s accuracy. Before thermal error modeling, the selection of key temperature points is also crucial. Tsai et al. [12] proposed a method for sorting and selecting two-phase temperature sensors, addressing the collinearity issue of sensors. The thermal error model established based on this method demonstrated high accuracy in practical compensation experiments. With the successful application of digital twin technology in the manufacturing industry, Liu et al. [13] embedded a thermal error control model and a thermal characteristic analysis model into a digital twin system, enabling real-time thermal characteristic analysis of the machine tool spindle and the prediction and compensation of spindle thermal errors under various working conditions.
Acquiring temperature field information is a crucial step in thermal error prediction, with temperature sensors and thermal imaging cameras becoming mainstream instruments for this purpose. For instance, Li et al. [14] utilized PT100 platinum resistance sensors to collect temperature information from the spindle of a gear grinding machine and established a thermal error model based on an Eagle Optimization Convolutional Neural Network, improving prediction accuracy by 15% compared to the non-optimized model. Abdulshahed et al. [15] used thermal imaging to record the temperature distribution of the machine tool spindle and developed a thermal error prediction model based on a fuzzy c-means clustering adaptive neuro-fuzzy inference system, significantly enhancing prediction accuracy compared to artificial neural network models. Luo et al. [16] utilized PT1000 temperature sensors to collect spindle temperature data of a CNC lathe. They addressed the delay issue between temperature and displacement data through resampling and established a three-axis predictive thermal displacement model. In practical compensation experiments, thermal errors in the x, y, and z axes were effectively reduced. However, most of these studies have used either temperature sensor data or thermal imaging data exclusively for thermal error prediction. These single-source, single-structure data cannot provide comprehensive information on the thermal deformation of the machine tool spindle, posing certain limitations. The technique of multi-source information fusion integrates and processes data from diverse sources (multi-source) and different structures (heterogeneous), thereby enhancing information utilization and enabling more accurate decision-making. It has been successfully applied in various fields including aerospace [17,18], medicine [19,20], agriculture [21], environmental protection [22], and fault diagnosis [23,24,25].
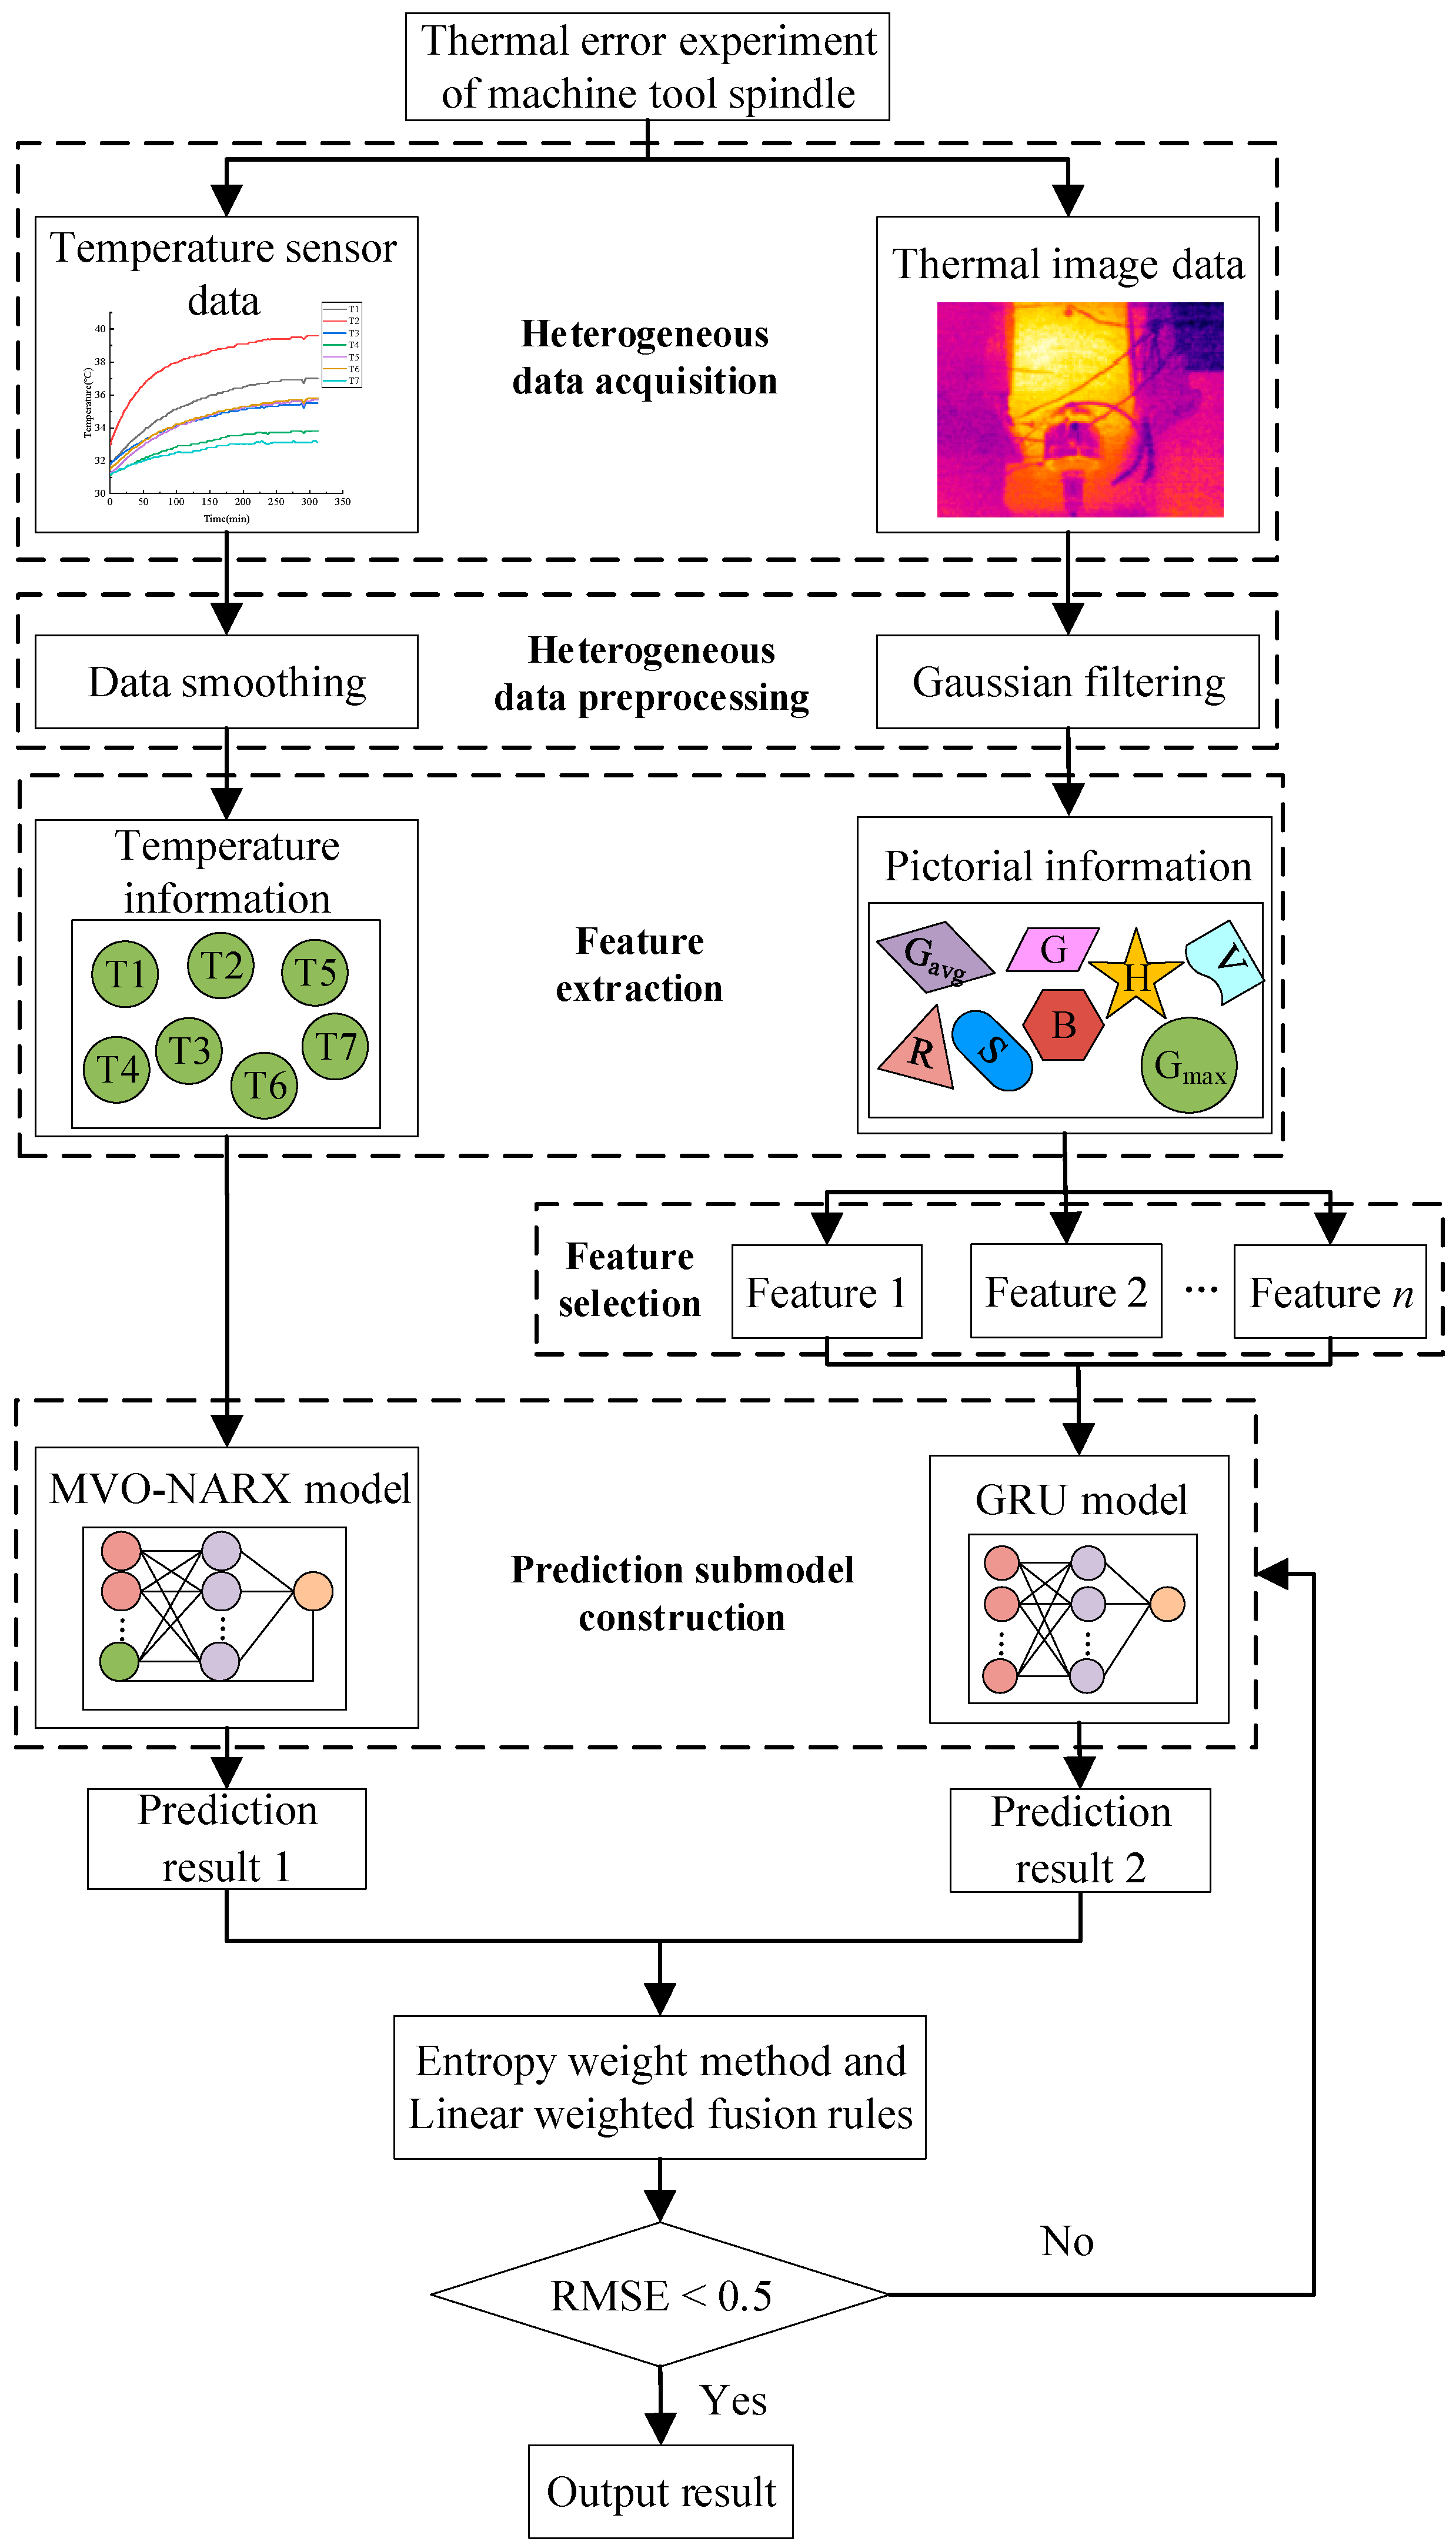
To mitigate the limitations of single-source, single-structure data in representing the temperature field information of machine tool spindles and to enhance the prediction accuracy of thermal error models, this paper combines temperature sensor data and thermal imaging data from different signal sources (multi-source) and various data structures (heterogeneous). A thermal error modeling approach utilizing multi-source heterogeneous information fusion is presented by fully leveraging the information content of diverse data, as illustrated in Figure 1. First, an experimental platform was set up to gather thermal error data from various signal sources (multi-source) and configurations (heterogeneous). Next, based on the characteristics of the multi-source and heterogeneous data, relevant feature information was extracted to construct the input sample set for the sub-models. Then, using the feature information sample set derived from the multi-source and heterogeneous data, thermal error prediction sub-models were developed using Nonlinear Autoregressive models with exogenous inputs (NARX) and Gated Recurrent Units (GRUs), focusing on the spindle of a vertical machining center. Finally, the entropy weight method was employed to assign the weights for the linear-weighted fusion rules, enabling decision-level fusion of multi-source heterogeneous information and generating the ultimate prediction results, which were subsequently compared with experimental outcomes. The experimental results illustrate that the presented thermal error prediction model based on decision-level fusion of multi-source heterogeneous information can accurately predict thermal errors in machine tools. Furthermore, compared to single-source, single-structure thermal error prediction models, the proposed model exhibits superior advantages.
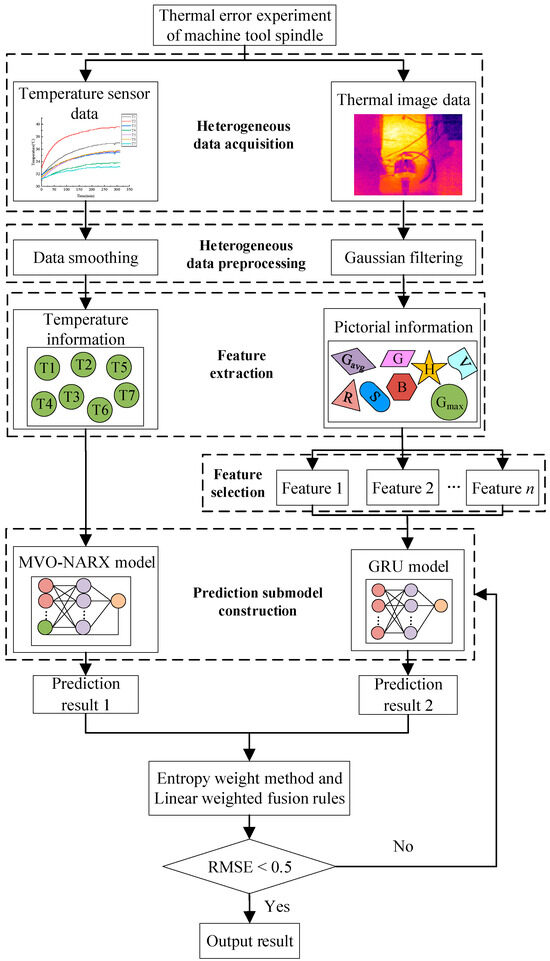
Figure 1.
The proposed method flowchart.
The rest of this paper is organized as follows: Section 2 outlines the acquisition and preprocessing of multi-source heterogeneous data through thermal error experiments. Section 3 introduces the theoretical framework for constructing the decision-level fusion model of multi-source heterogeneous information. Section 4 analyzes the performance of the presented prediction model. Section 5 presents the conclusions.
2. Data Acquisition
2.1. Experimental Platform Setup
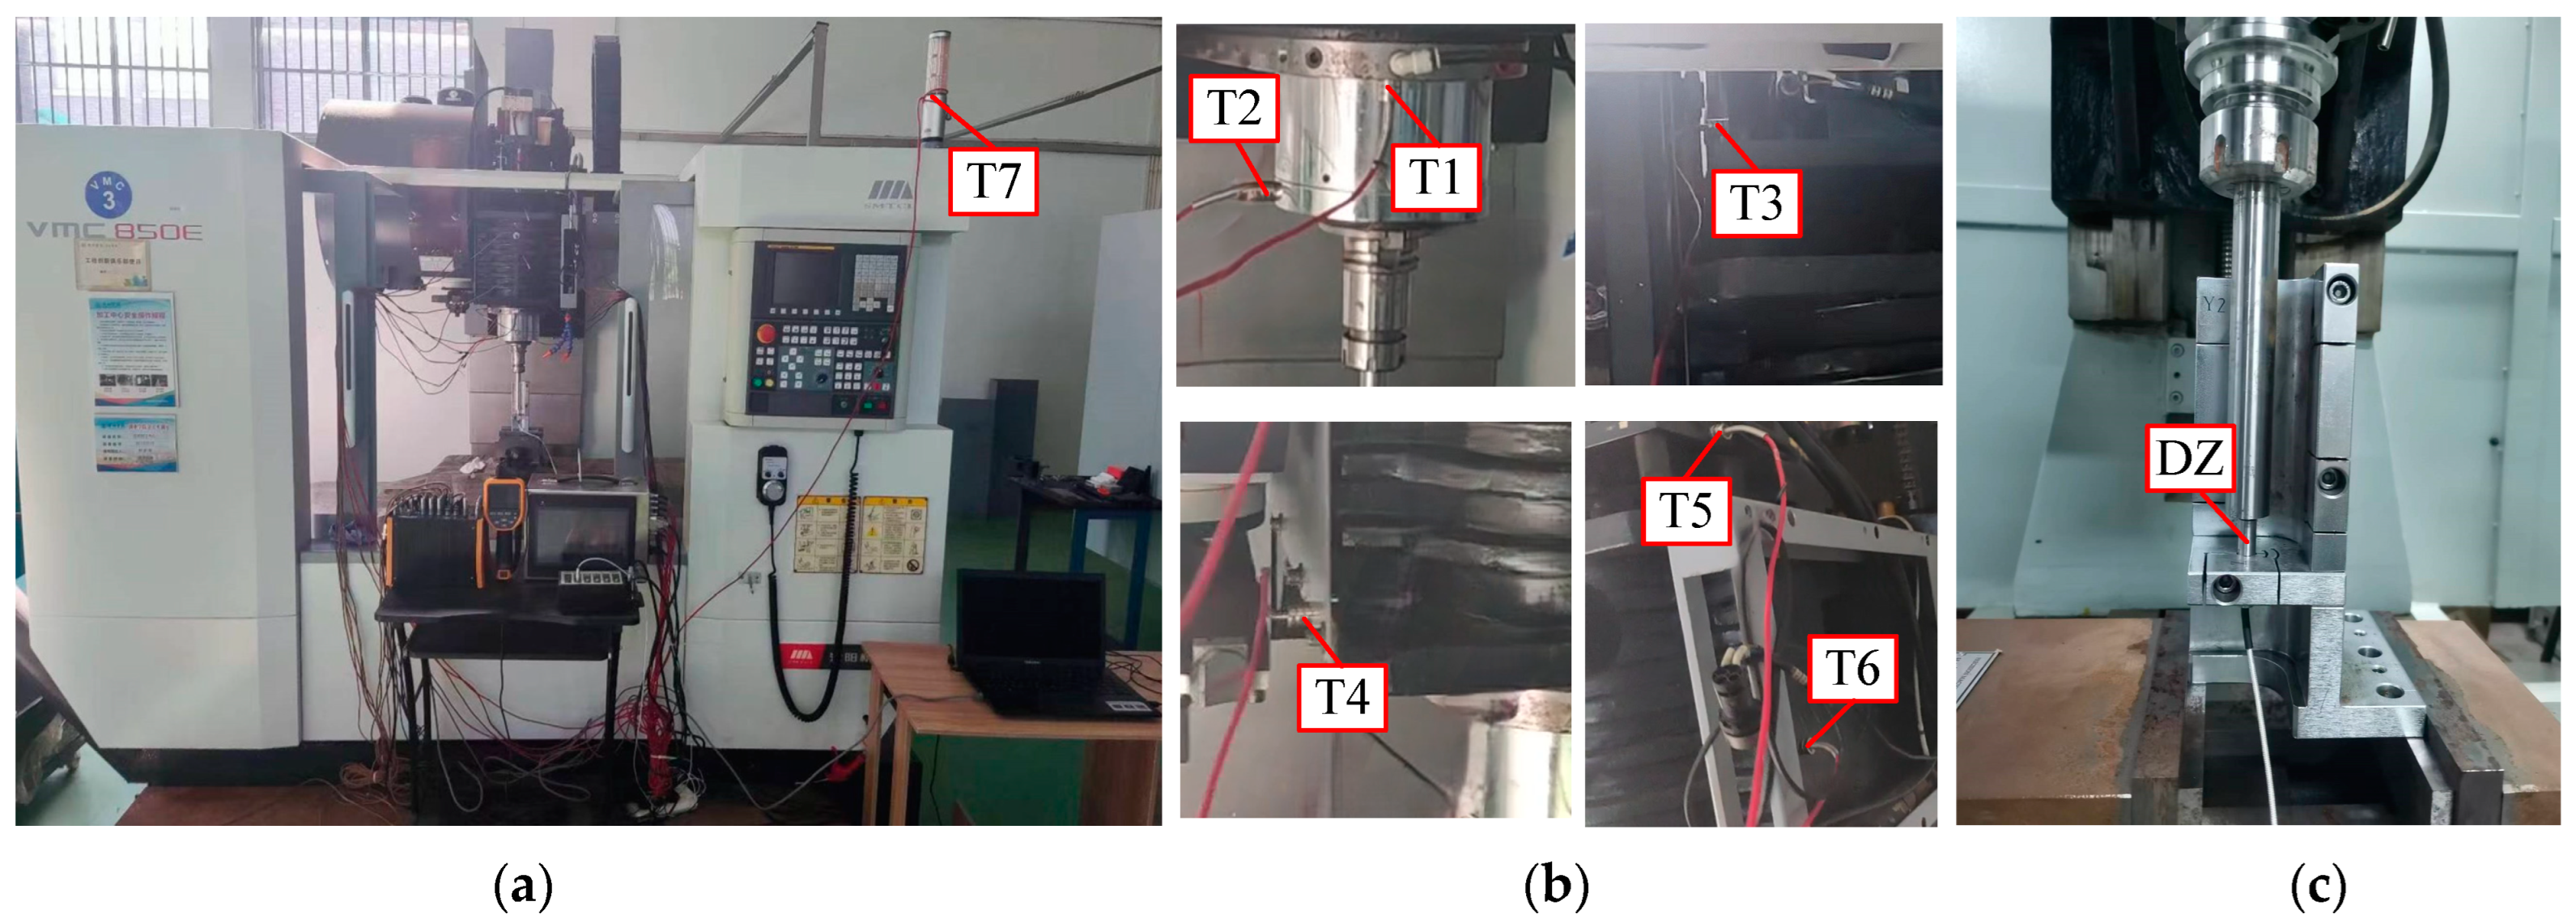
This research centers on the VMC-850E vertical machining center manufactured by a specific machine tool company, equipped with a mechanical spindle. It establishes a research setup for acquiring multi-source heterogeneous information from CNC machine tools, as depicted in Figure 2. The primary hardware components of the research setup for acquiring multi-source heterogeneous information from CNC machine tools comprise the machining center body, an intelligent instrument for testing and compensating the thermal characteristics of the CNC machine tool spindle system, a magnetic suction temperature sensor, a FLUKE thermal imager, a capacitive displacement sensor, a dedicated fixture for the five-point method, and an inspection rod. The magnetic suction temperature sensor is a PT100 model with a measurement precision of 0.4%, measuring temperature range from 0 to 300 °C, and temperature precision of 2%. The thermal imager is FLUKE TiS50(Evered, WA, USA), with specific technical parameters as shown in Table 1. The capacitive displacement sensor utilized is the CPL230 model manufactured by Lion Precision (Minneapolis, MN, USA), designed to operate within a temperature range of 4 to 50 °C. Although the spindle of the machine tool generates thermal displacement in the X, Y, and Z directions during operation, this study focuses solely on the thermal displacement in the Z direction of the spindle due to the insignificant thermal displacement changes in the X and Y directions.
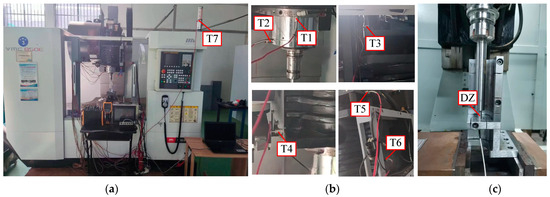
Figure 2.
Multi-source heterogeneous information acquisition experimental platform. (a) Experimental Platform, (b) Layout of Measurement Points, (c) Arrangement of Displacement Sensors.

Table 1.
Technical Specifications of the Thermal Imager.
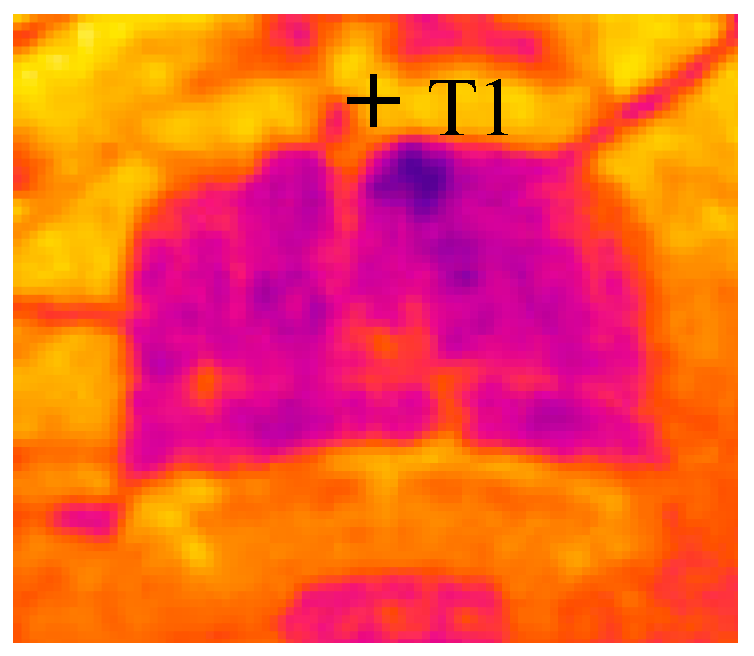
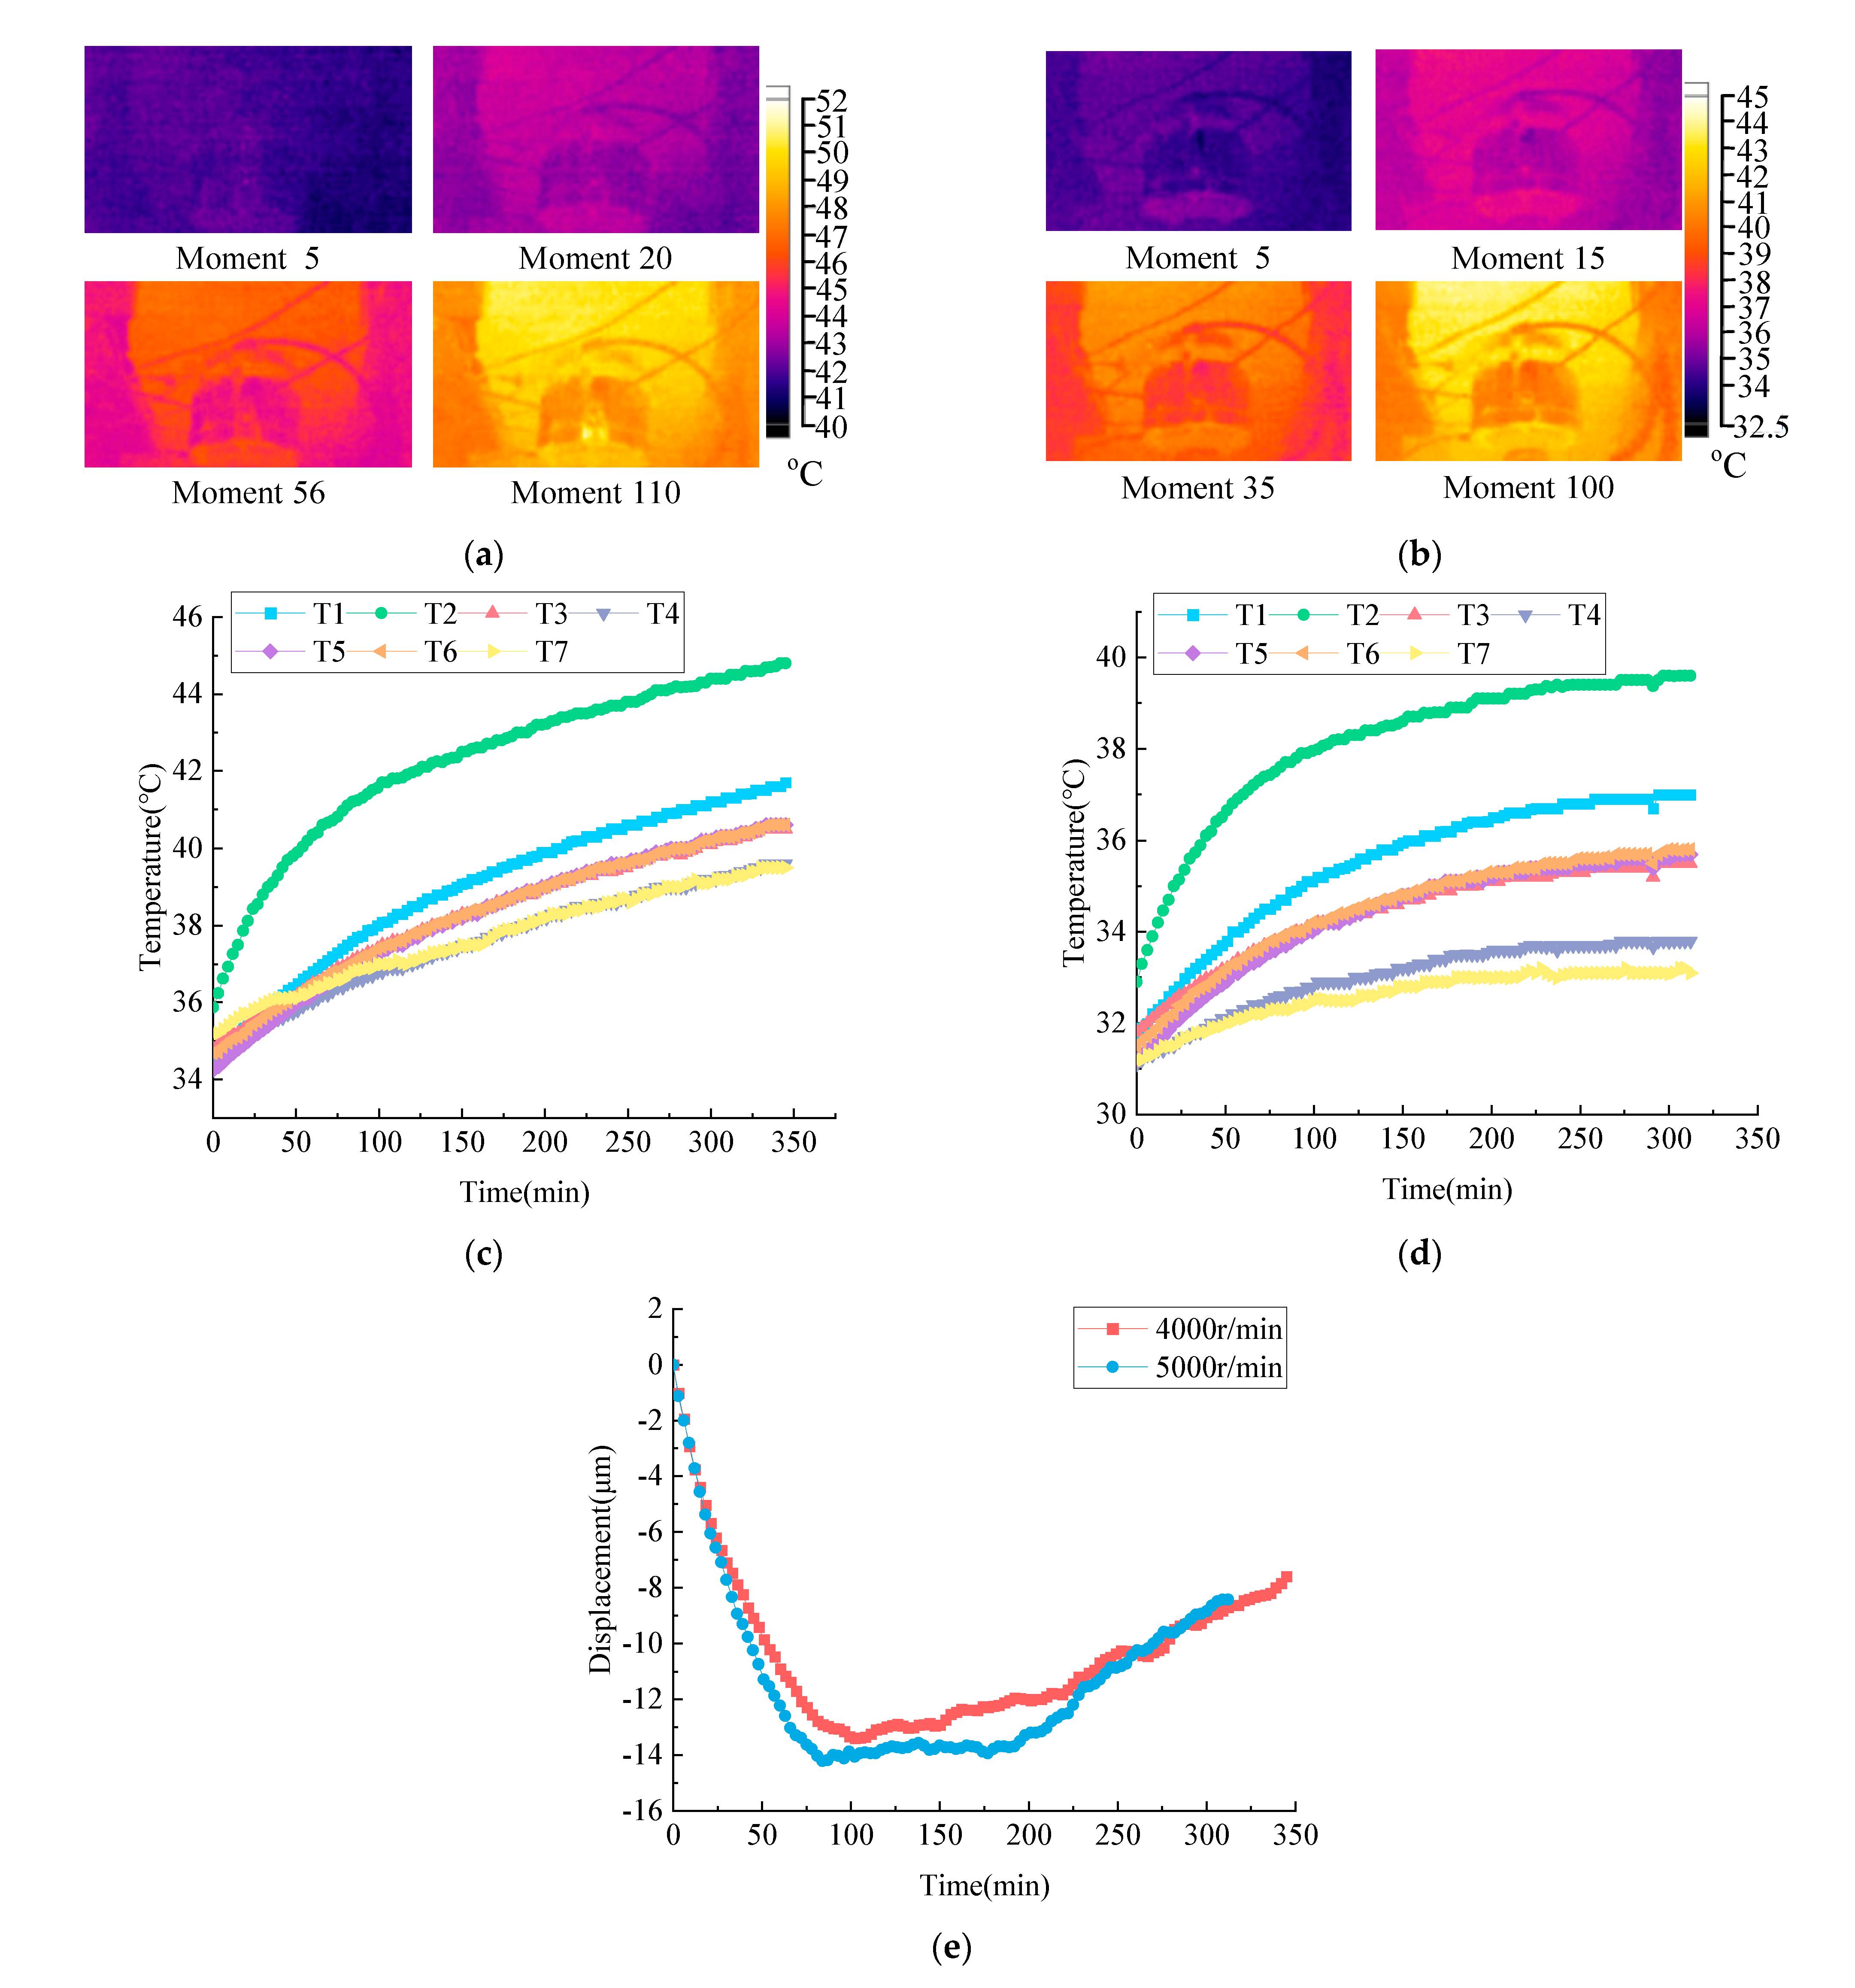
To ensure the effectiveness of collecting heterogeneous data from multiple sources, preliminary temperature measurements of the machine tool environment were conducted using an indoor thermometer. At 4000 r/min, considering the initial measurement of room temperature, the baseline temperature for the thermal imager was adjusted to 33 °C. Similarly, at 5000 r/min, the background temperature of the thermal imager was adjusted to 30.8 °C. The emissivity was set to 0.95, and the distance between the thermal imager and the machine tool spindle was maintained at 1.5 m. The automatic capture time for thermal imaging was set to 3 min. In the selection of temperature measuring points, this paper first finds the original measuring points according to the selection method of heat-sensitive points in the thermal mode theory, and then uses the Fluke TiS50 thermal imager to further determine the temperature-sensitive points of the machine tool, so as to determine the original measuring points. As shown in Figure 3, the location of T1 has a more obvious temperature peak compared with the surrounding area. At the same time, in the thermal image analysis software attached to the thermal imager, it is found that the temperature value at T1 is about 42 °C, and the temperature value in the surrounding area is about 41 °C, indicating the sensitivity of temperature change at this point. Based on this method, seven sampling points (T1 to T7) were selected as temperature data sampling points, as detailed in Table 2 and shown in Figure 2a,b. Additionally, as illustrated in Figure 2c, displacement sensors (DZ) were used to collect thermal displacement data in the Z-direction of the spindle system. During the experiment, the sampling rate for temperature and displacement data collection by the sensors was set to 0.2 Hz. Under idle conditions, temperature, imaging, and displacement data of the machining center spindle system reached thermal equilibrium. The experiment lasted approximately 5 h. The results of data collection from each sensor are depicted in Figure 4.
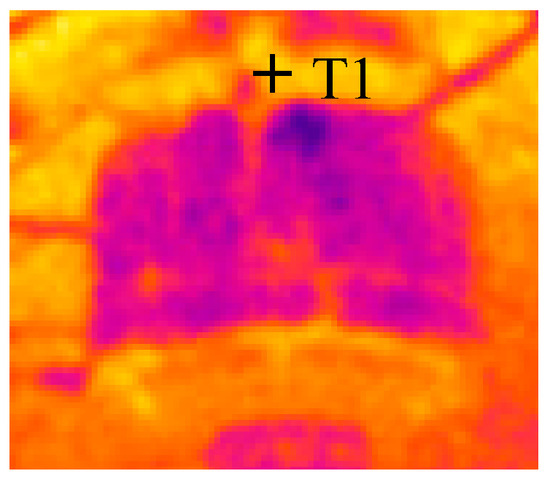
Figure 3.
Location of temperature-sensitive points.

Table 2.
Description of Measurement Point Locations.
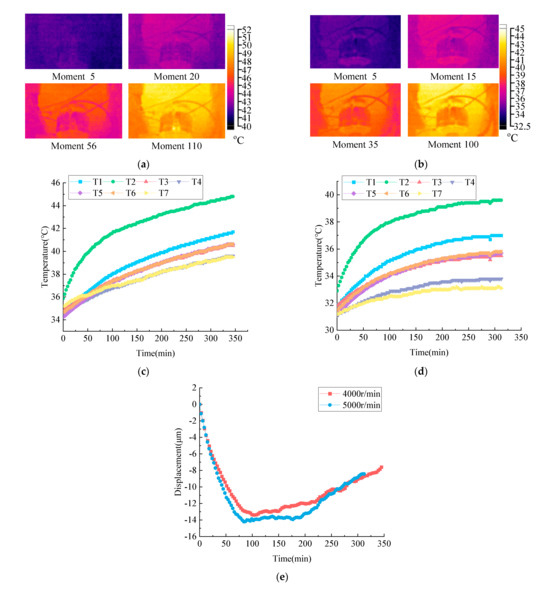
Figure 4.
Results of multi-source heterogeneous data collection. (a) Thermal image variations of spindle at 4000 r/min condition, (b) Thermal image variations of machine spindle at 5000 r/min condition, (c) Temperature variation trends of each measurement point at 4000 r/min condition, (d) Temperature variation trends of each measurement point at 5000 r/min condition, (e) Thermal displacement variation trend of spindle z-axis under different conditions.
From Figure 4, it can be observed that the absolute value of the Z-direction thermal displacement of the main axis becomes larger first and then smaller. According to the literature [26], this phenomenon occurs because during the operation of the spindle, the higher the temperature rise of the spindle unit, the more pronounced the axial thermal expansion and the greater the thermal displacement. At the same time, the spindle operation will transfer heat to the column, resulting in thermal bending deformation of the column, which leads to the Z-direction thermal error of the spindle including thermal bending deformation error and thermal expansion error. There is a nonlinear relationship between thermal bending deformation error and temperature rise, and the absolute value of Z-direction thermal displacement will become smaller under the action of the two errors.
2.2. Data Preprocessing
In practical thermal error experiments on machine tools, it was found that temperature and displacement states do not undergo significant changes over short periods. To ensure uniform sample sizes, this study aligned three types of data samples: temperature data, displacement data, and image data, temporally. The dataset for the 4000 rpm condition comprised 116 samples, while for the 5000 rpm condition, there were 105 samples. Temperature sensor data are susceptible to noise due to daily operational disturbances. Therefore, this study applied data smoothing techniques to temperature data to ensure accuracy and effectiveness, minimizing the impact of random errors. Given the limitations in the number of pixels in the infrared detectors used by thermal imaging cameras, coupled with the susceptibility of infrared radiation to diffusion effects and environmental factors during spatial propagation, this results in thermal images having low resolution and being accompanied by a certain degree of noise contamination. Gaussian filtering can effectively reduce random noise in images while preserving their basic structure and features; therefore, this paper employs Gaussian filtering for denoising of thermal images.
The Gaussian filtering process involves convolving the image with a filter kernel function based on specified filter parameters. The Gaussian filter kernel calculation formula is as follows [27,28]:
where is the grayscale value of the denoised image at pixel position (x, y), and are the local filtering center points, and represents the smoothing scale parameter.
The signal-to-noise ratio (SNR), widely used in the field of image denoising, was adopted as the metric to evaluate the denoising effect of thermal images [29]. Upon calculation, the SNR of the thermal images after Gaussian filtering reached 15.34, indicating an improvement of approximately 9% compared to before denoising.
3. Multi-Source Heterogeneous Information Decision-Level Fusion Model Construction
3.1. Feature Extraction
After the preprocessing of the experimentally collected multi-source heterogeneous data, it is essential to perform feature extraction. Due to the different structural types of data collected by the magnetic suction temperature sensor and the thermal imaging camera, independent extraction is required for both during the feature extraction process. Temperature data collected by the temperature sensor have clear physical meanings and can be directly extracted in the time domain for temperature information. On the other hand, thermal image data collected by the thermal imaging camera can directly display the temperature distribution of the measured object but lack quantified temperature values, making the data unsuitable for direct use in thermal error prediction [30]. Therefore, to ensure the accuracy of feature extraction from images, the FLUKE TiS50 thermal imaging camera (Evered, WA, USA) captures thermal images under different operating conditions. These images are first segmented into regions of interest (i.e., the spindle area), resulting in final image resolutions of 57 × 35 and 50 × 34, respectively. Next, color features of this region are extracted using relevant algorithms [31]. Finally, by converting between the RGB and HSV color models, eight color features of the spindle area thermal images are obtained: average grayscale (Gavg), maximum grayscale (Gmax), first-order moment of red component (R), first-order moment of green component (G), first-order moment of blue component (B), hue mean (H), saturation mean (S), and value mean (V).
3.2. Local Decision Model Algorithms
After preprocessing and feature extraction of the heterogeneous data obtained from experiments, meaningful temperature information and image feature information were obtained. The next step is to input these data into different base learning models for initial prediction. In this study, NARX neural network and GRU neural network are chosen as the base learners for initial prediction models. These learners are widely used in the field of regression prediction and have different advantages due to their respective mechanisms.
3.2.1. NARX Neural Network
The NARX (Nonlinear autoregressive models with exogenous inputs) neural network [32] is a type of recursive neural network used for time series modeling and prediction. The structure mainly comprises an input layer, a hidden layer, and an output layer. The NARX neural network integrates delay and feedback mechanisms, leveraging past time series data to improve prediction comprehensiveness and accuracy. Its mathematical expression is given by [32]:
where y(t − 1) indicates the output variable at time t − 1, u(t − 1) represents the input variable at time t − 1, is the output delay, and appears the input delay.
NARX Dynamic Neural Networks primarily operate in two modes: Series-Parallel (open-loop) and Parallel (closed-loop). In Series-Parallel mode, the desired output is known and directly fed back to the input, allowing the network to learn the functional relationship between known inputs and outputs. In contrast, Parallel mode extends Series-Parallel by adding a feedback loop where the output signal is fed back into the network as input, thereby influencing the prediction of output signals [33]. Open-loop mode efficiently learns the relationship between inputs and outputs, while closed-loop mode enhances the prediction by capturing dynamic relationships and historical information between signals. Therefore, this study employs the Series-Parallel mode for neural network training and utilizes the Parallel mode for prediction.
The input delay order , output delay order , and number of neurons in the hidden layer h are crucial parameters of the NARX neural network, and different combinations of these parameters significantly impact the network’s performance. To enhance model performance, this study utilizes the Multi-verse Optimization (MVO) algorithm [34] to optimize the network’s structural parameters. This approach constructs the MVO-NARX prediction sub-model for preliminary prediction of thermal errors.
3.2.2. Gated Recurrent Unit (GRU)
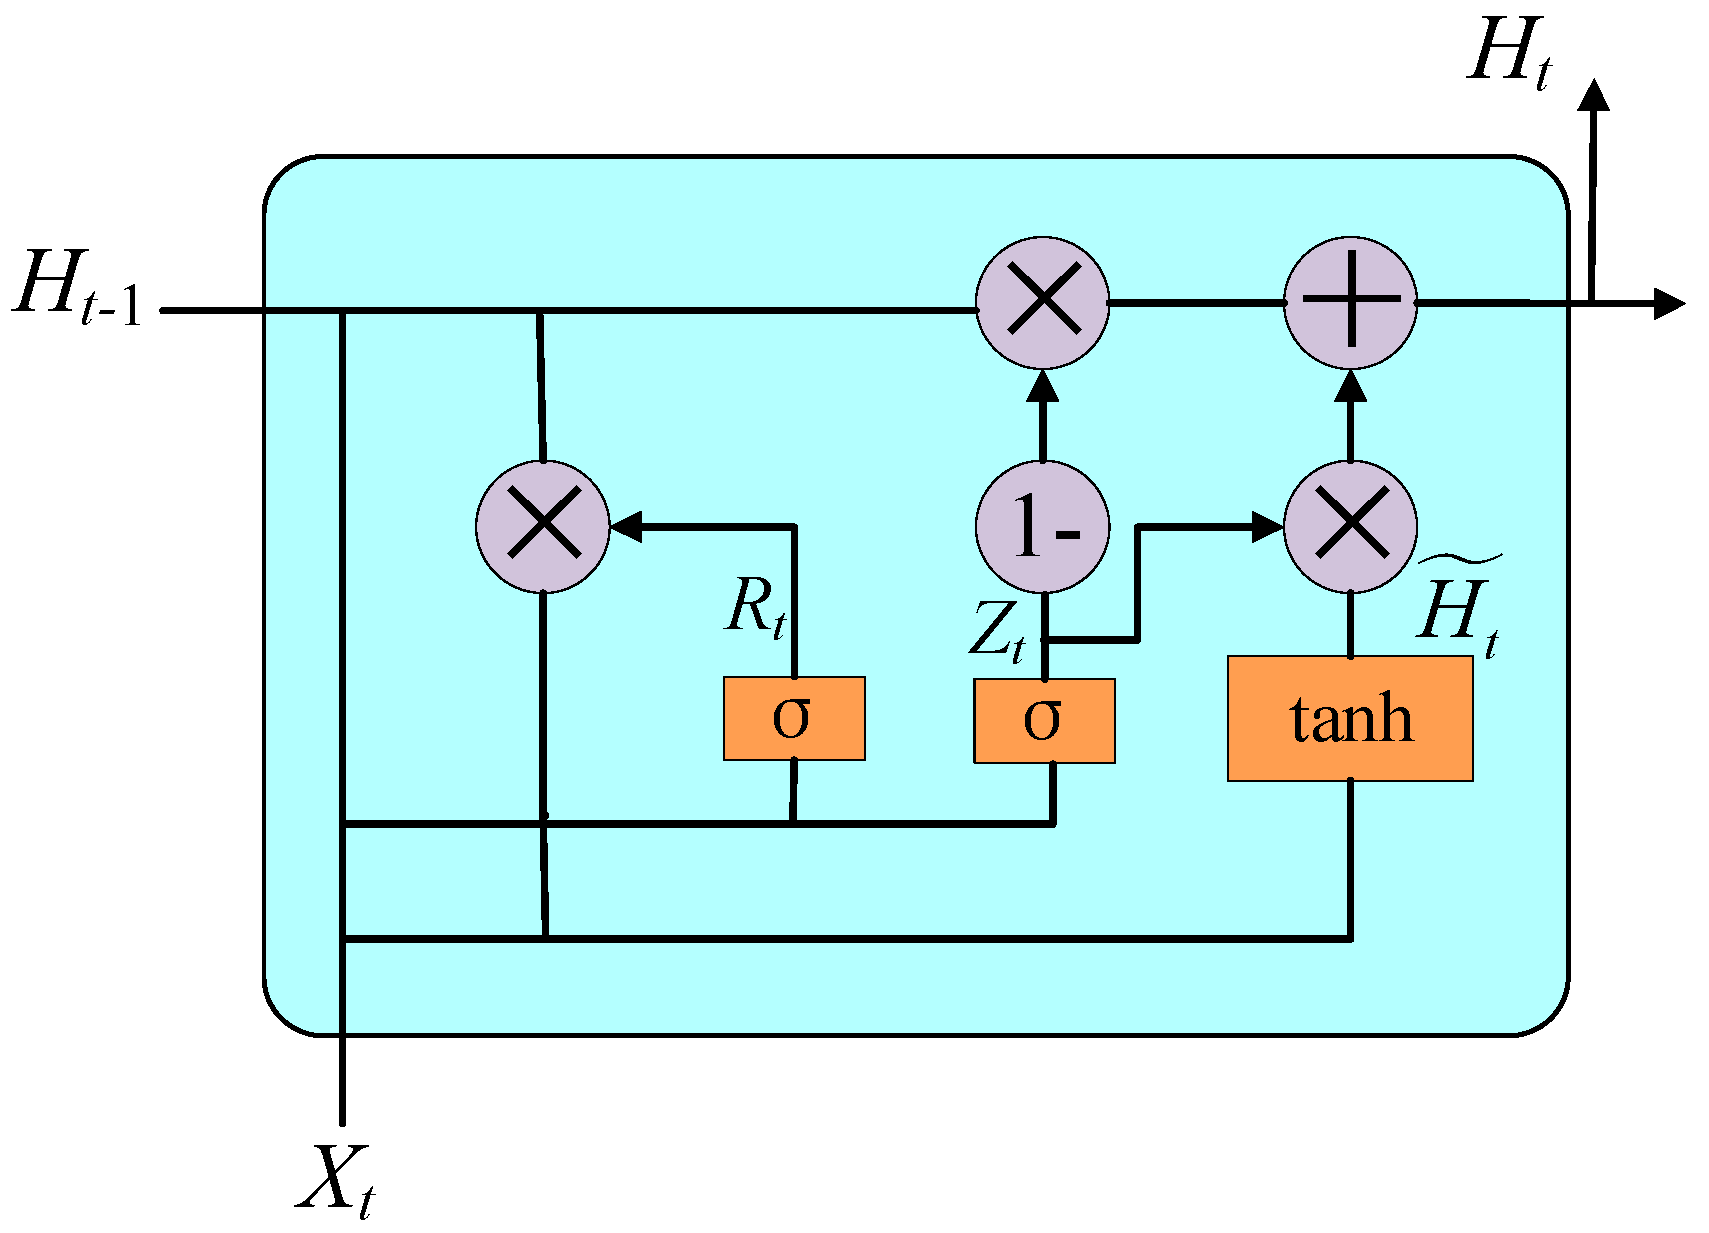
GRU [35], like Long Short-Term Memory (LSTM), is a type of Recurrent Neural Network (RNN). While LSTM addresses the issue of “short-term memory” in traditional RNNs, its network structure is complex with a large number of parameters, which can lead to slow convergence when handling large volumes of high-dimensional data, thereby affecting prediction accuracy. Gated Recurrent Units (GRU) improve upon LSTM by modifying the gating mechanism, reducing trainable parameters, and enhancing prediction efficiency. The structure of GRU is depicted in Figure 5.
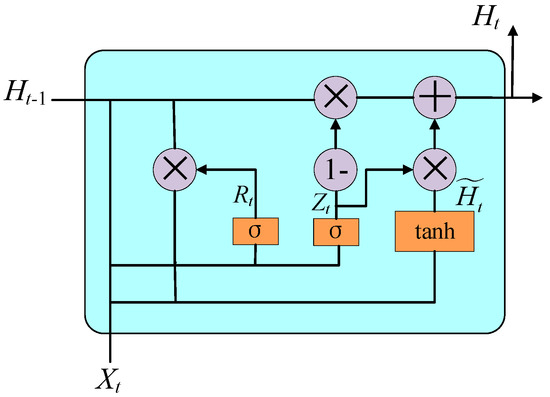
Figure 5.
Schematic diagram of GRU structure.
In the GRU architecture, the reset gate Rt and update gate Zt determine the influence of historical data Ht−1 and current data Xt on the prediction [35].
Simultaneously, using the current input data and partially the previous hidden state to update the candidate hidden state , where Rt determines the degree of forgetting historical information of the current data [35], we obtain:
Finally, the current time hidden state Ht, which contains prediction information, is updated using the update gate Zt. The update formula is as follows [35]:
where represents the sigmoid activation function; , , , , , and are learnable parameters; denotes element-wise multiplication operation.
3.3. Decision-Level Fusion Algorithm
To enhance the accuracy of thermal error prediction, after obtaining initial predictions from thermal error prediction sub-models, the predictions can be fused using decision-level fusion rules to leverage the complementary advantages of heterogeneous information and different models. This study employs two prediction sub-models: the MVO-NARX model and the GRU model. Given the simplicity of its mechanism and suitability for decision-level fusion with small sample sizes, this paper adopts a linear-weighted fusion rule for final integration. Additionally, the entropy weight method is introduced to determine the weights of each prediction sub-model, aiming to mitigate subjective bias in weight assignment and minimize its impact on prediction accuracy.
The entropy weight method [36] is a systematic approach for assigning weights objectively by utilizing information entropy calculations. Information entropy measures the amount of information contained in data, with higher values indicating lower information content and thus higher probability of occurrence. Taking the MVO-NARX prediction sub-model as an example, the calculation steps in this method are as follows [36]:
(1) Construct a performance evaluation matrix of N × 4 comprising the Mean Absolute Error (MAE), Mean-Square Error (MSE), Root-Mean-Square Error (RMSE), and Mean Absolute Percentage Error (MAPE) between the predicted values of the MVO-NARX model and the true values.
where represents the performance evaluation matrix of the predicted values obtained from the MVO-NARX prediction sub-model for thermal error prediction; denotes the MAE value of the first predicted value; denotes the MSE value of the first predicted value; denotes the RMSE value of the first predicted value; and denotes the MAPE value of the first predicted value.
(2) Calculate the probability of a single metric relative to the entire dataset for that metric.
where represents the probability of the ith predicted value’s MAE relative to the MAE of all predicted values.
(3) Calculate the entropy for each individual metric.
where represents the entropy of the MAE for the predicted values obtained by the MVO-NARX prediction sub-model; N is the size of the prediction sample.
(4) Calculate the overall entropy of the MVO-NARX prediction sub-model.
where represents the overall entropy of the predicted values obtained from the MVO-NARX prediction sub-model.
(5) Calculate the information utility value.
where represents the information utility value of the predicted values obtained from the MVO-NARX prediction sub-model.
(6) Calculate the weights.
where represents the weight of the predicted values obtained from the MVO-NARX prediction sub-model; denotes the utility value of the information derived from the predicted values of the MVO-NARX prediction sub-model, and indicates the information utility value derived from the predicted outcomes of the GRU prediction sub-model.
4. Experimental Results and Analysis
4.1. Construction of Sample Set
Following the feature extraction method in Section 3.1, feature parameters were extracted from the spindle region of the thermal images. After extracting the feature parameters, it is necessary to normalize the values of each feature parameter to eliminate differences in data magnitude, which positively impacts the predictive performance of the model. Let the value of a certain feature parameter be denoted as , where , u represents the number of features, and n is the number of samples. Normalize the parameters according to Equation (13).
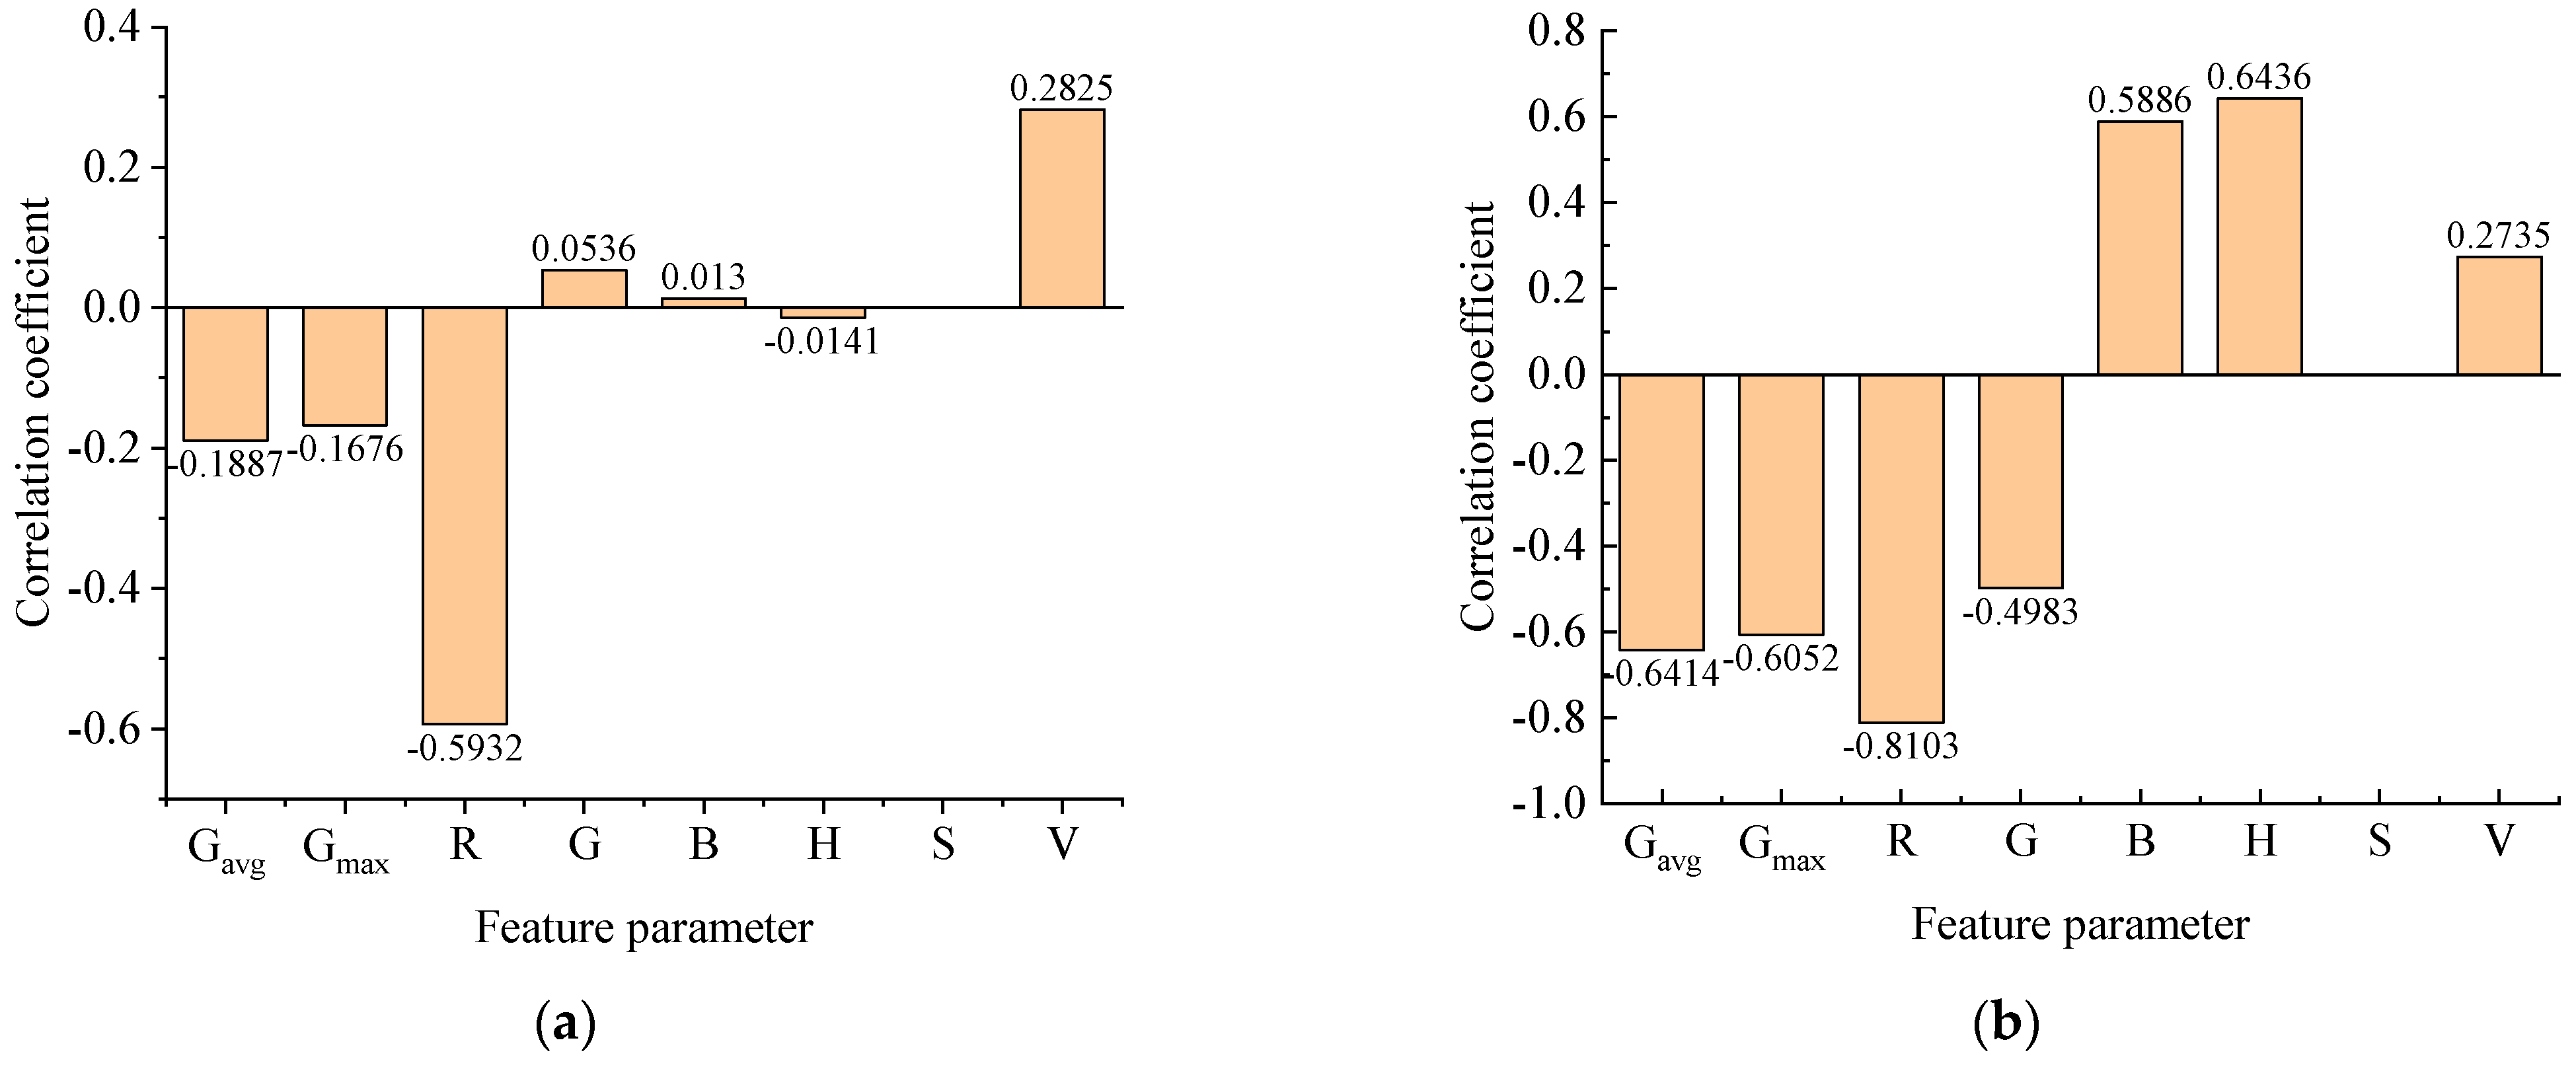
After processing, all feature parameters in the sample set were transformed into data ranging between [0, 1]. To obtain effective feature parameters and enhance the predictive accuracy of the model, this study employed Pearson correlation coefficient analysis [37] to optimize the extracted image feature parameters, retaining those with higher correlation to machine tool thermal displacement. The specific optimization results of various feature parameters under different operating conditions are shown in Figure 6. From Figure 6a, it can be observed that under the condition of 4000 r/min, the feature parameter R exhibits a correlation coefficient of −0.5932 with thermal displacement, exceeding the threshold of 0.5 (To prevent the loss of image features related to thermal displacement, this paper selects feature parameters with values greater than 0.5 as inputs for the thermal error prediction model.). Therefore, this study selected R as the input feature for the sub-model under this operating condition. From Figure 6b, Gavg, Gmax, R, B, and H show correlation coefficients of −0.6414, −0.6052, −0.8103, 0.5886, and 0.6436, respectively, all exceeding 0.5 in absolute value. Thus, these five feature parameters were chosen as input features for the sub-model under this operating condition. Since the experiments for the two operating conditions were not conducted on the same day, and the machine tool’s startup times differed, the position and intensity of external heat sources varied, affecting the distribution and accumulation of heat. Consequently, this influenced the feature parameters of the thermal images, leading to differences in their correlation with thermal displacement.
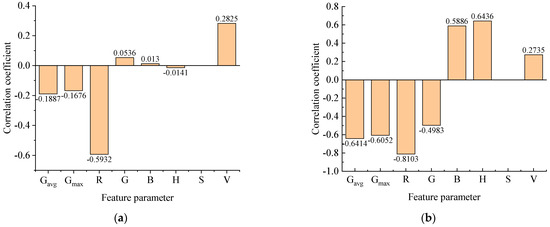
Figure 6.
Correlation plots of various feature parameters under different operating conditions. (a) Correlation plot of feature parameters at 4000 r/min condition, (b) Correlation plot of feature parameters at 5000 r/min condition.
Before inputting variables into the prediction models, it is necessary to divide the sample training set to train the models. For the 116 sets of samples containing three types of data at 4000 r/min condition, a 7:3 ratio is applied to extract 81 samples as training sets for each sub-model, to learn the mapping relationship between different structural input information and thermal displacement information. The remaining 35 samples serve as the test set to assess the model’s accuracy. Similarly, for the 105 sets of samples containing three types of data at 5000 r/min condition, a 7:3 ratio is applied to extract 75 samples as training sets for each sub-model, and the remaining 30 samples are utilized as the test set.
4.2. Model Performance Analysis
Temperature information and image feature information were separately used as inputs for the MVO-NARX and GRU models, while thermal displacement information served as the output for each sub-model. Machine spindle thermal error models were constructed and trained accordingly. The GRU model consists of four layers, namely input layer, GRU layer, fully connected layer, and regression output layer. Adam optimization algorithm and MSE loss function are used in network training for iterative optimization parameters and gradient update. The initial learning rate was 0.01, and the number of hidden layer neurons was 50. The search ranges for the input delay order and output delay order of the NARX neural network were set to [1, 5], the search range for the number of neurons in the hidden layer was set to [1, 10], the population size was 30, and the maximum number of iterations was 200. Using the mean-square error between predicted and actual values as the fitness function, the MVO algorithm iteratively searched for optimal parameters. Ultimately, the parameter combinations under the 4000 r/min condition were {2,1,8}, and under the 5000 r/min condition were {1,5,10}.
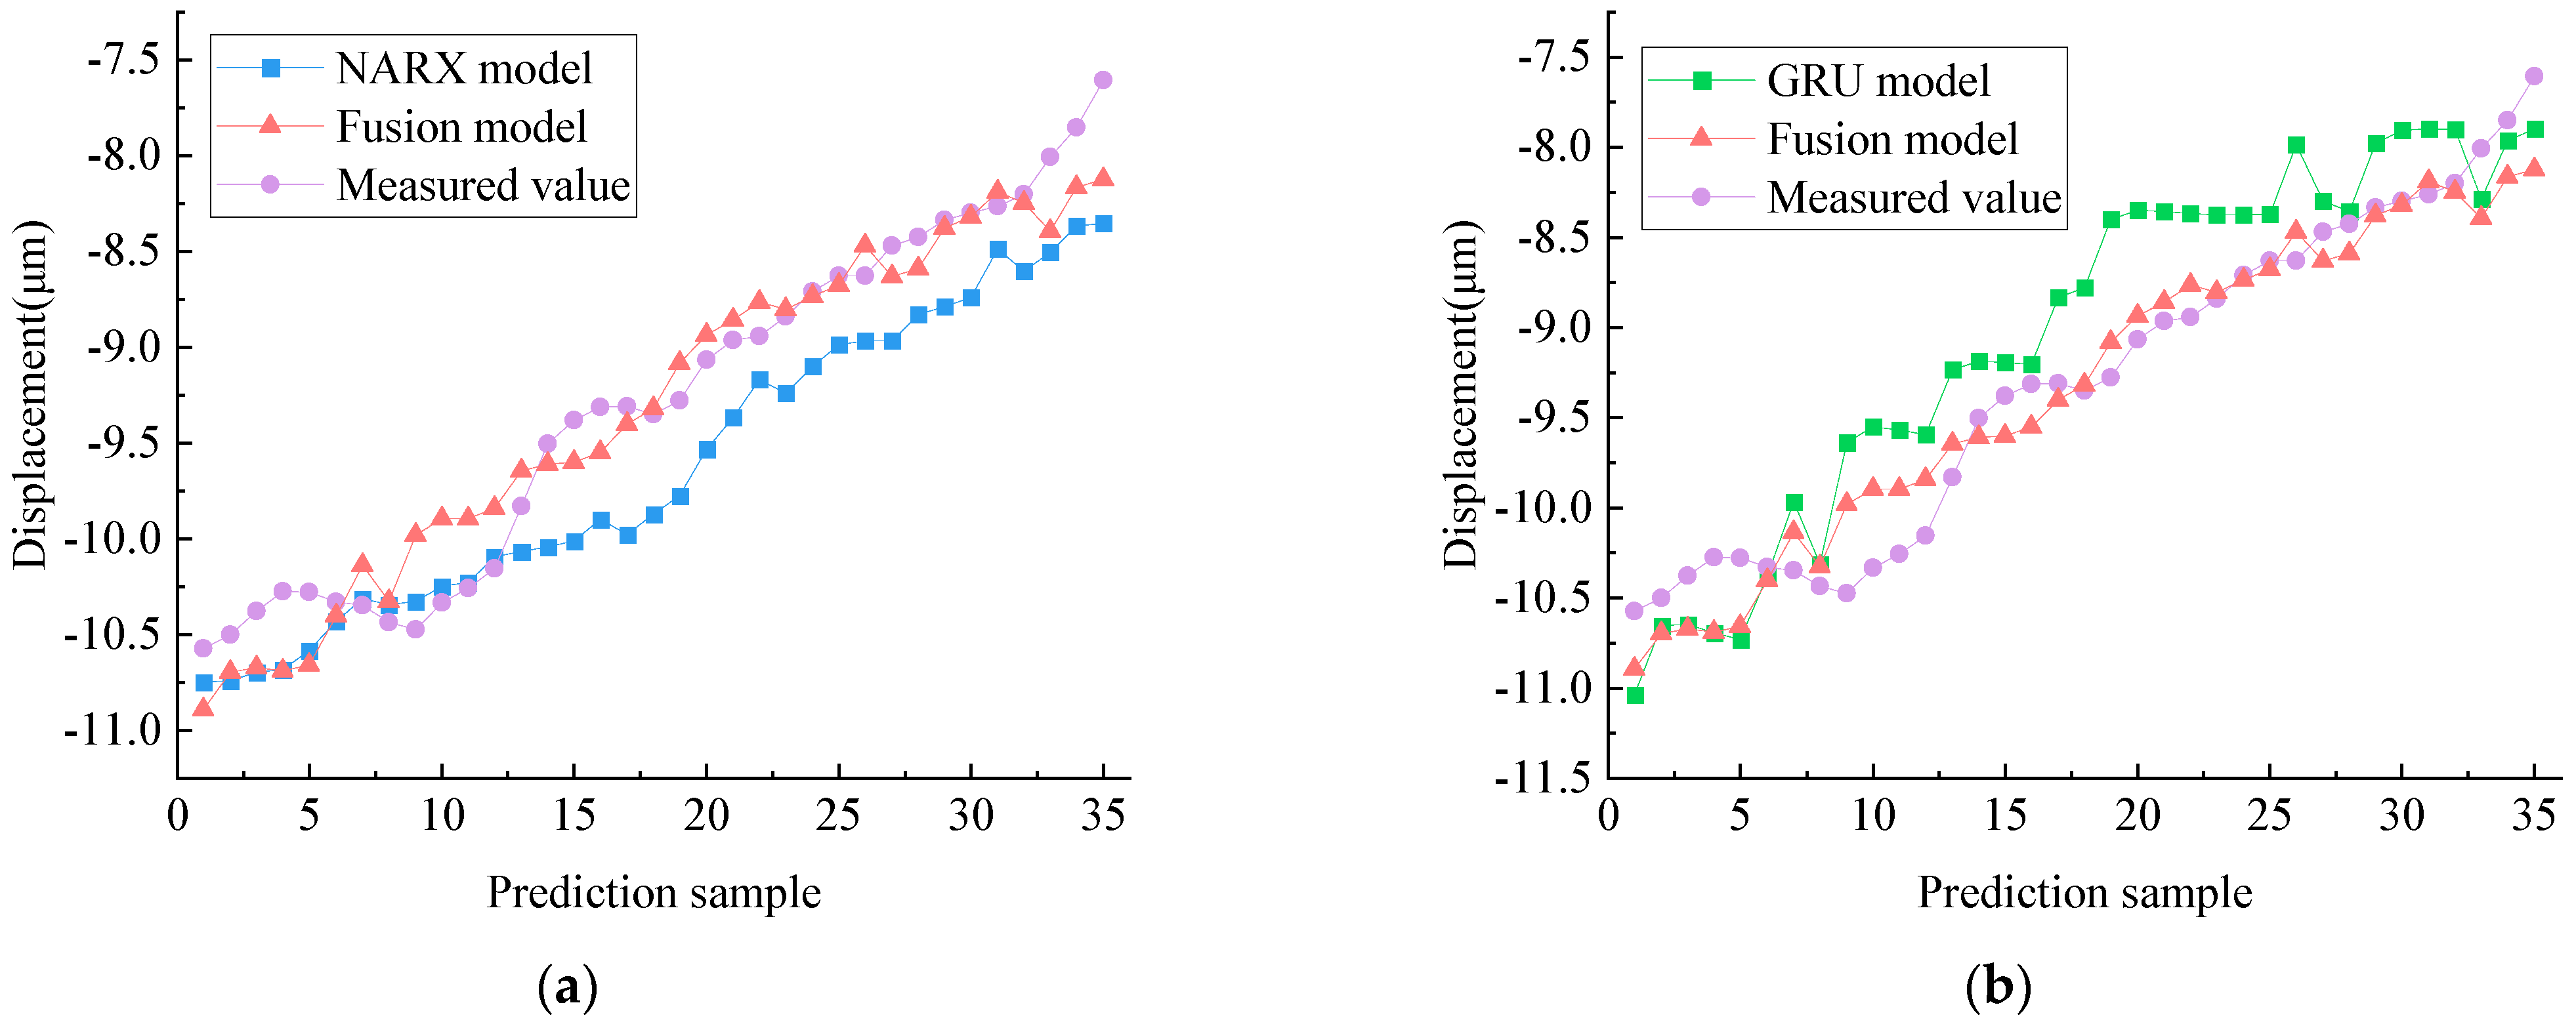
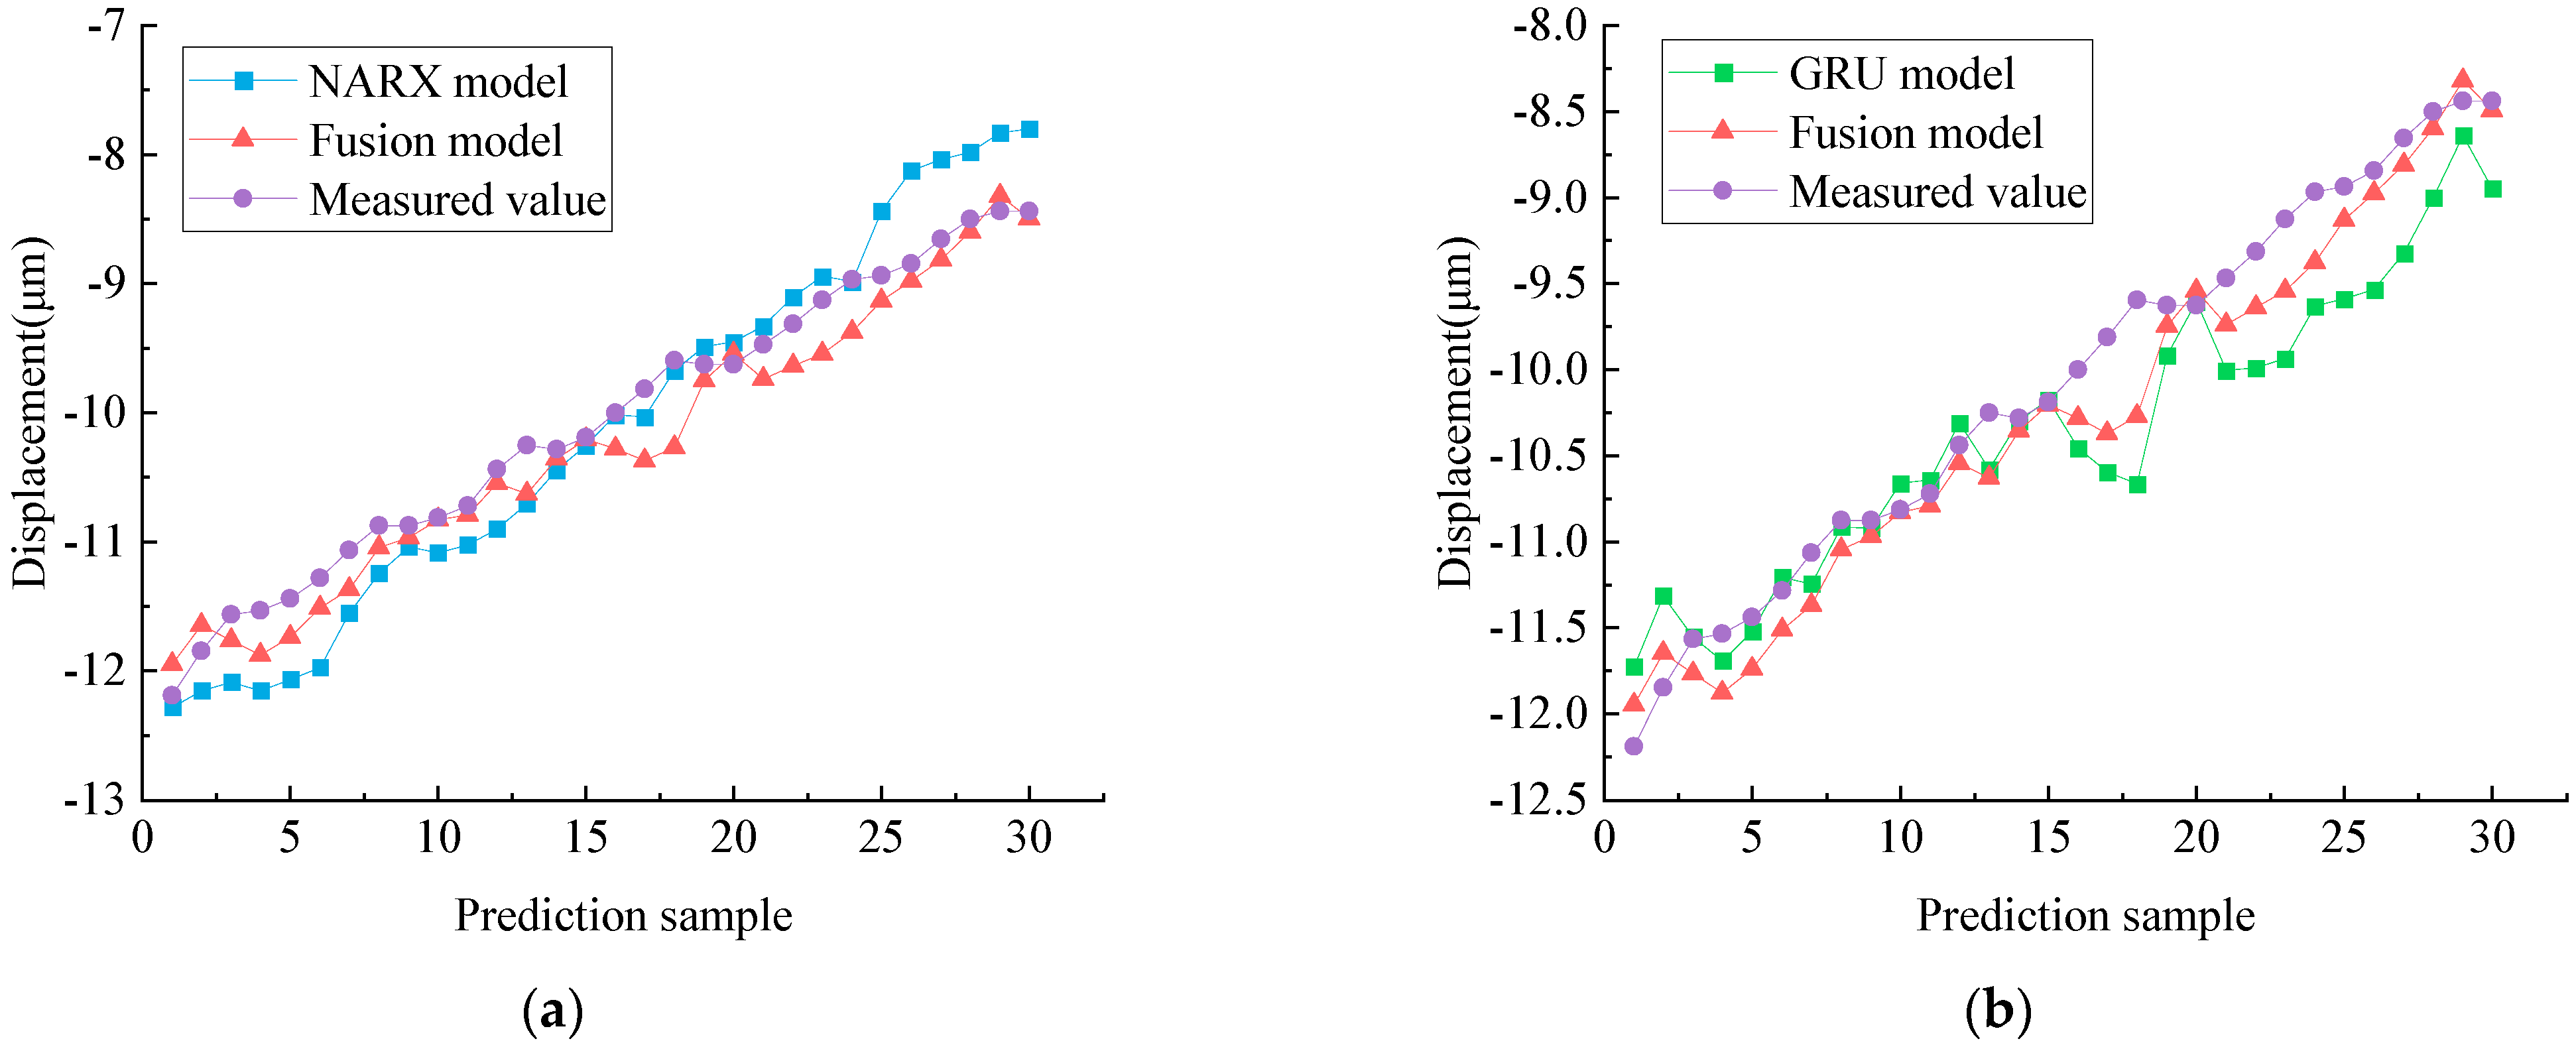
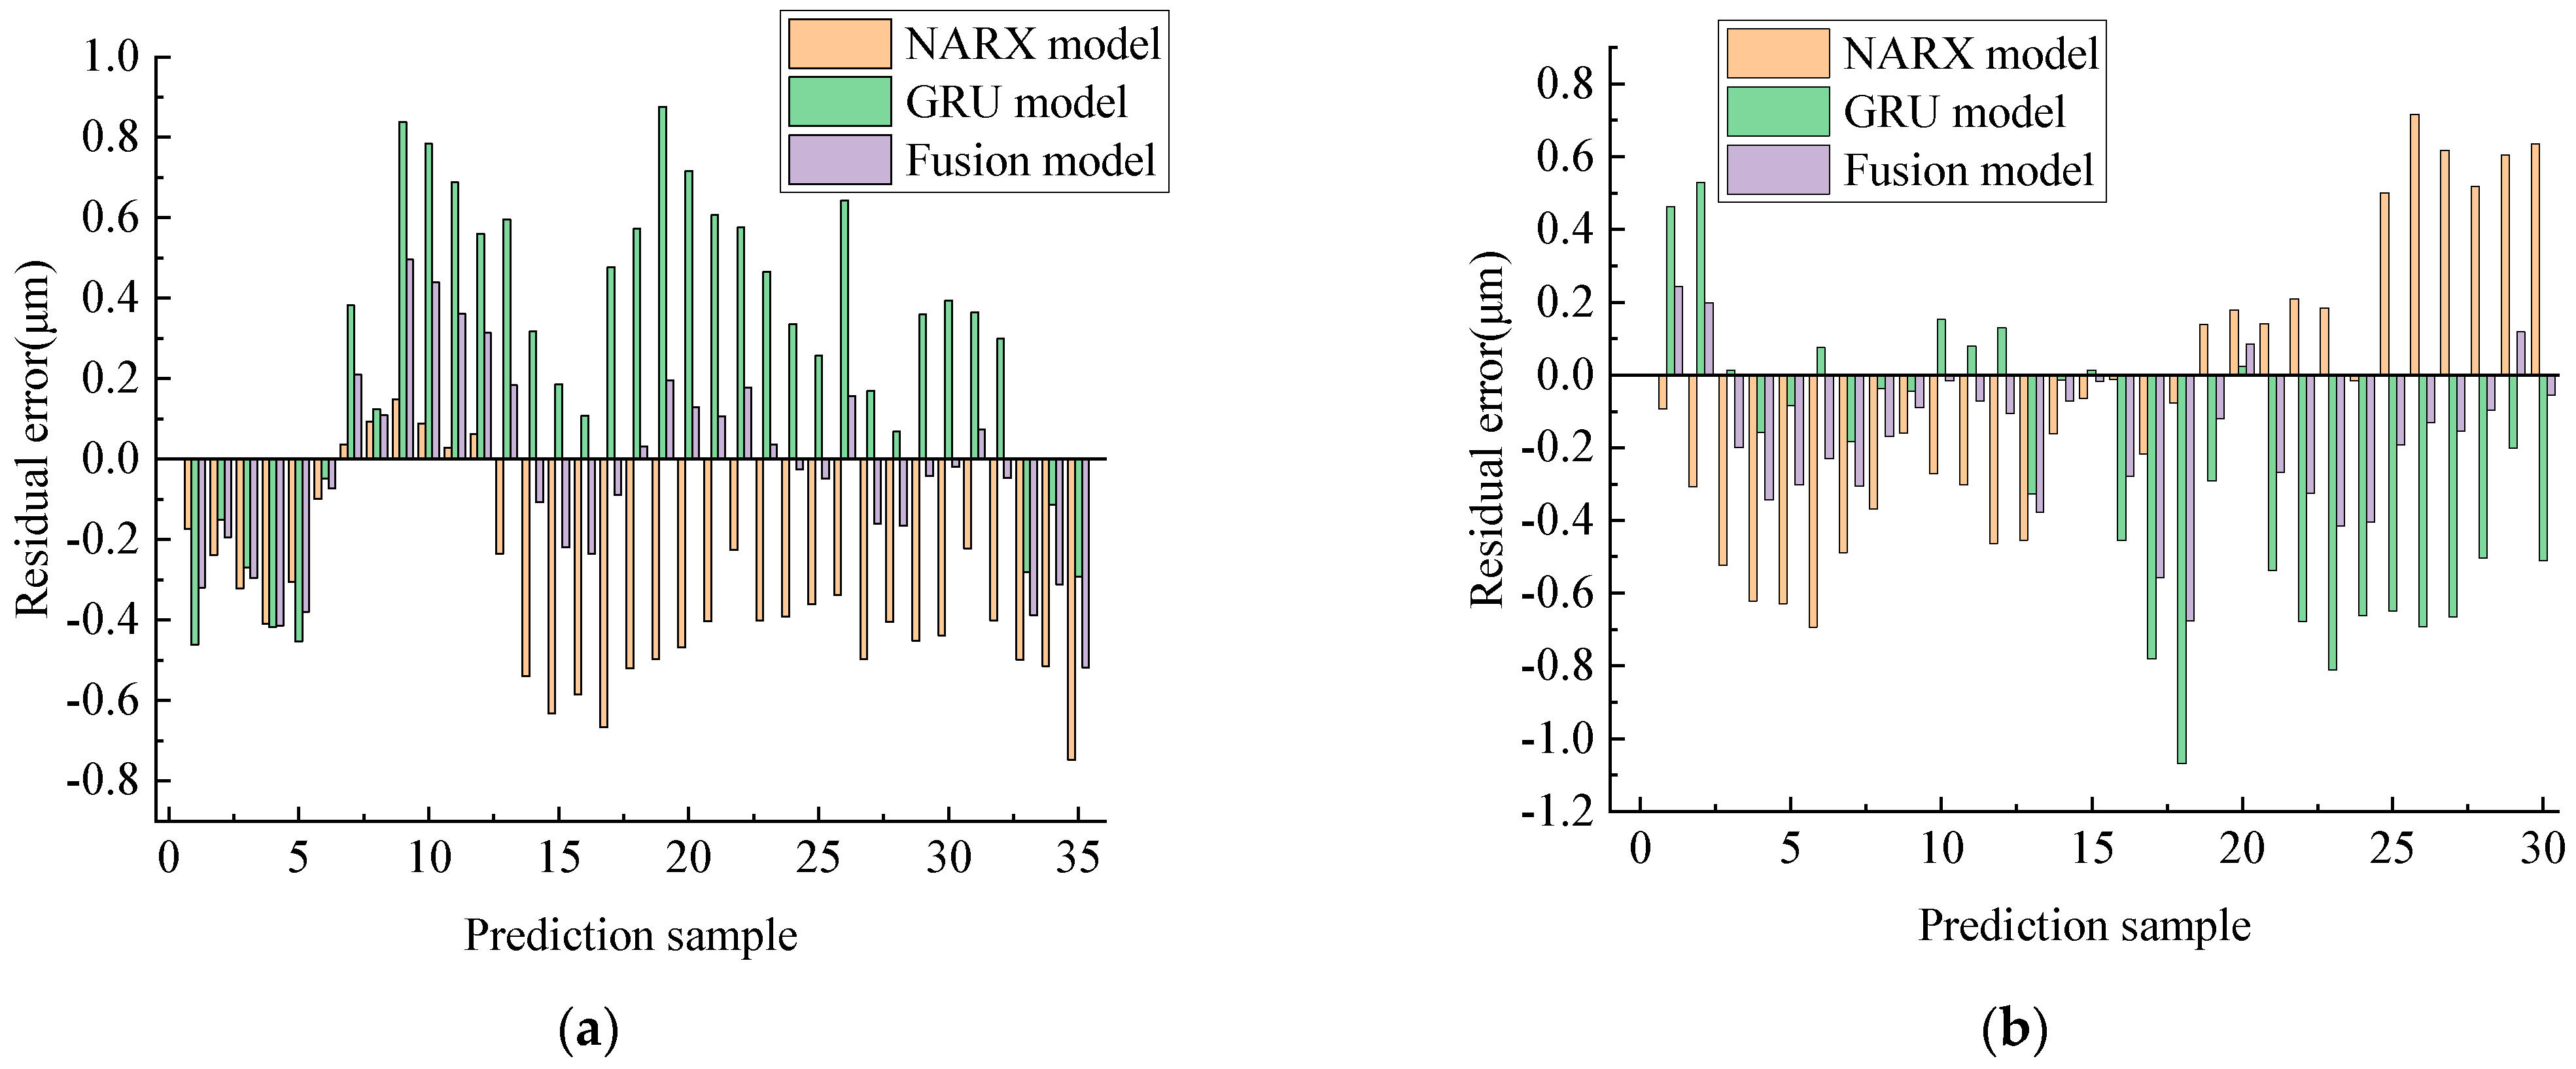
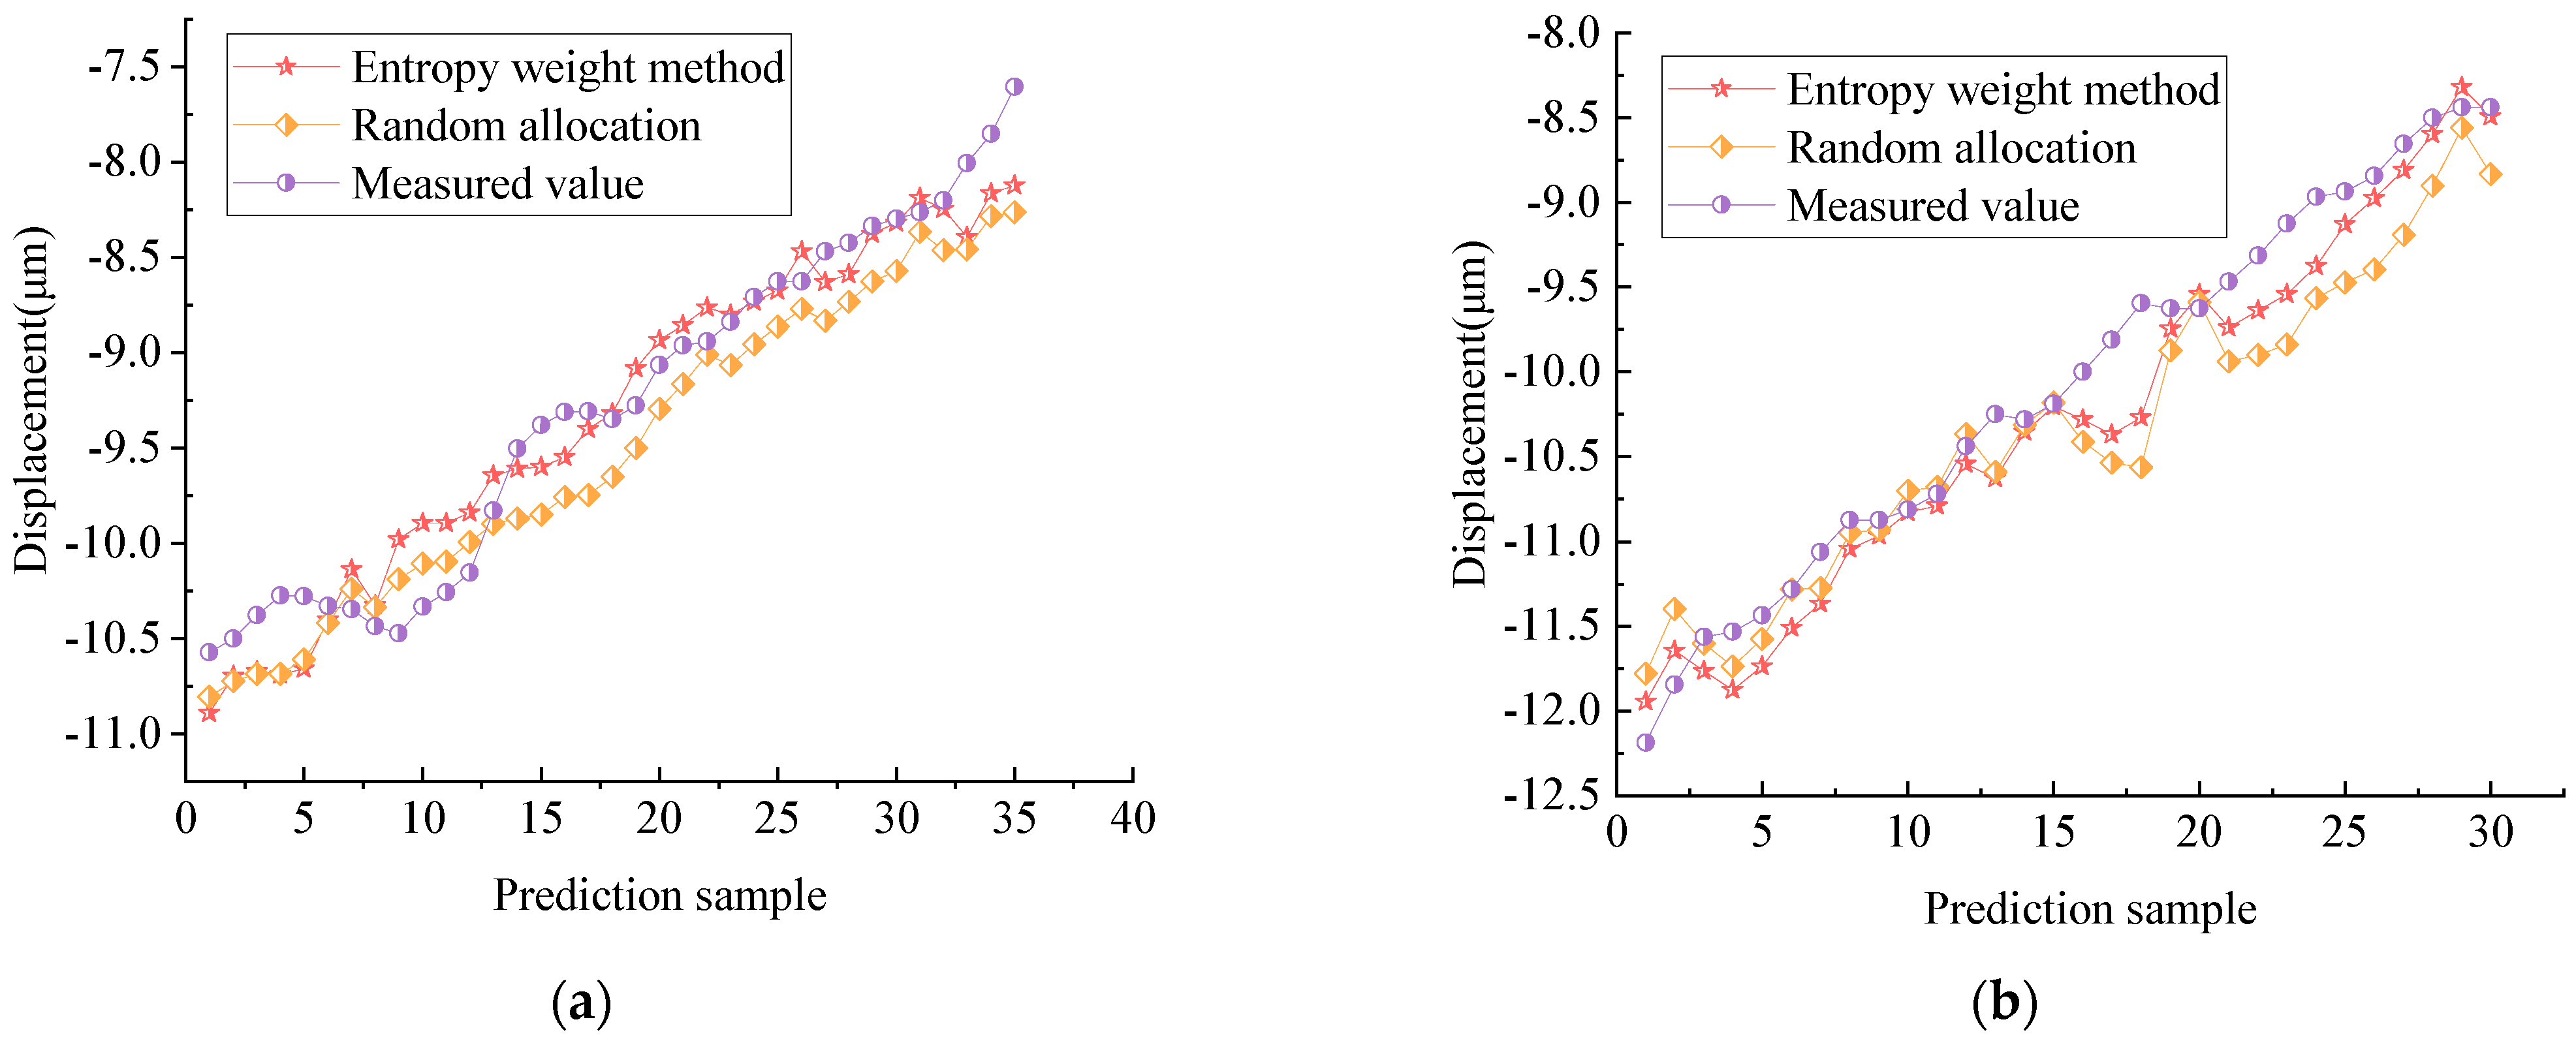
The test set was then input into the trained sub-models for preliminary prediction of spindle system thermal errors. The entropy weighting method described in Section 3.3 was used to obtain the weights of the two sub-models. The preliminary prediction results were integrated using a linear-weighted fusion rule to produce the final prediction results of the model. To assess the prediction accuracy and performance of the proposed decision-level fusion model utilizing multi-source heterogeneous information, the fused prediction results were compared and analyzed with the preliminary prediction outcomes of each sub-model. The specific prediction results of different models are shown in Figure 7 and Figure 8. The evaluation results of each model are presented in Table 3 and Table 4. The residual results of each model are depicted in Figure 9. Furthermore, to demonstrate the advantages of using the entropy weighting method to determine the weights of each sub-model, a comparative analysis was conducted between the entropy weighting method and a random weight selection method. The fused prediction results of different weight distribution methods are shown in Figure 10. A residual curve closer to the zero axis indicates better prediction performance of the corresponding thermal error model. RMSE and MAE values range from [0, ∞], with smaller values indicating better predictive model performance. The coefficient of determination (R2) indicates the fitting degree of the model to the actual values, with values ranging from [0, 1]; closer to 1 indicates a higher level of fit. This study employed RMSE, MAE, and R2 to assess the predictive performance of various models and methodologies.
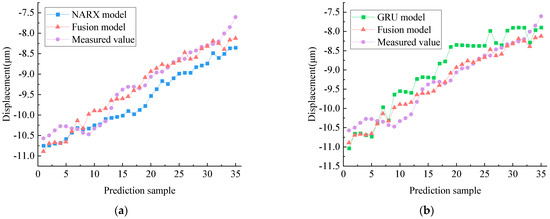
Figure 7.
Prediction Results of Different Models under 4000 r/min Operating Condition. (a) Comparison of Prediction Results between Fusion Model and NARX Model, (b) Comparison of Prediction Results between Fusion Model and GRU Model.
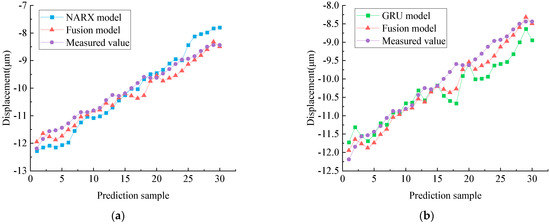
Figure 8.
Prediction Results of Different Models under 5000 r/min Operating Condition. (a) Comparison of Prediction Results between Fusion Model and NARX Model, (b) Comparison of Prediction Results between Fusion Model and GRU Model.

Table 3.
Evaluation results under the condition of 4000 r/min.

Table 4.
Evaluation results under the condition of 5000 r/min.
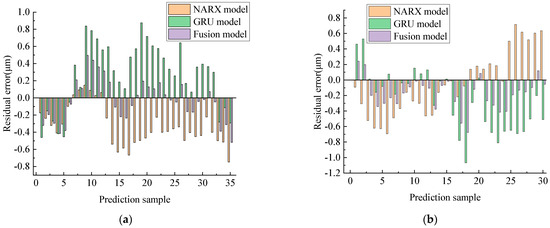
Figure 9.
Residual Results of Different Models under Different Operating Conditions. (a) Residual Results of Different Models under 4000 r/min Operating Condition, (b) Residual Results of Different Models under 5000 r/min Operating Condition.
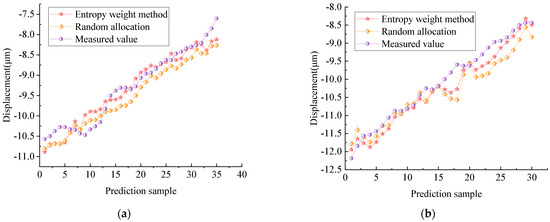
Figure 10.
Predictive Results of Fusion Models with Different Weight Allocation Methods under Different Operating Conditions. (a) Predictive Results of Fusion Models with Different Weight Allocation Methods under 4000 r/min Operating Condition, (b) Predictive Results of Fusion Models with Different Weight Allocation Methods under 5000 r/min Operating Condition.
Based on Figure 7 and Figure 8, it can be observed that the thermal error prediction sub-models established using multi-source heterogeneous information provide predictions close to the actual values, with RMSE and MAE both less than 0.5 μm. This indicates that the prediction sub-models developed for different structural data in this study possess certain predictive capabilities. However, compared to the thermal error prediction sub-models, the multi-source heterogeneous information decision-level fusion model proposed in this study produces predictions closer to the actual values. Combining with Figure 9, it can be seen that at 4000 r/min, the residual variation range of the fusion model is approximately −0.52 to 0.50 μm, while the NARX model shows a range of approximately −0.75 to 0.15 μm, and the GRU model ranges from −0.46 to 0.87 μm. At 5000 r/min, the residual variation range of the fusion model is approximately −0.68 to 0.24 μm, with the NARX model ranging from −0.69 to 0.72 μm, and the GRU model ranging from −1.07 to 0.53 μm. Comparatively, the fusion model exhibits a smaller residual variation range, indicating improved prediction accuracy of the model. Table 3 and Table 4 show that at 4000 r/min, compared to the NARX and GRU models, the fusion model has increased RMSE by approximately 38% and 47%, MAE by approximately 43% and 50%, and R2 by approximately 18% and 19%, respectively. At 5000 r/min, compared to the NARX and GRU models, the fusion model has increased RMSE by approximately 34% and 42%, MAE by approximately 36% and 39%, and R2 by approximately 10% and 37%, respectively.
Figure 10 illustrates that the fusion model with randomly assigned weights can integrate the advantages of multi-source heterogeneous information and heterogeneous models to achieve accurate prediction of spindle thermal error. However, the fusion model with weights determined by entropy weighting method produces prediction results closer to the actual values and demonstrates better prediction performance. Combining with Table 3 and Table 4, it can be observed that at 4000 r/min, compared to the fusion model with randomly assigned weights, the fusion model with weights determined by entropy weighting method has increased RMSE by 0.0536 μm, MAE by 0.0669 μm, and R2 by 0.0366. At 5000 r/min, compared to the fusion model with randomly assigned weights, the fusion model with weights determined by entropy weighting method has increased RMSE by 0.1366 μm, MAE by 0.1250 μm, and R2 by 0.0789. The comparison indicates that the fusion model with weights determined by entropy weighting method achieves lower RMSE and MAE, higher R2, and higher prediction accuracy compared to the prediction models established using single-structure data. This model is suitable for predicting spindle thermal errors in vertical machining centers.
5. Conclusions
In this study, a multi-source heterogeneous information acquisition platform was constructed to obtain temperature and image data of machine tool spindle systems. Based on feature extraction algorithms, distinctive features from heterogeneous data were extracted. Prediction sub-models were established using different base learners with input from diverse structural data features. Ultimately, a decision-level fusion model combining the entropy weighting method and linear-weighted fusion rules was developed. Comprehensive comparisons were conducted between the fusion model and prediction sub-models established using single-structure data, leading to the following conclusions:
(1) Addressing the limitations of monitoring spindle temperature field information solely from single-source, single-structure data, the proposed thermal error prediction model based on multi-source heterogeneous information fusion effectively utilizes the distinctive features of heterogeneous data, enhancing model robustness and prediction accuracy.
(2) Based on preliminary predictions from each prediction sub-model, a weight allocation method using entropy weighting was proposed, which objectively and reasonably calculates weights considering the prediction performance of each sub-model.
(3) Experimental results demonstrate that the fusion prediction model outperforms individual prediction sub-models across various evaluation metrics. At 4000 r/min, the R2 values improved by approximately 18% and 19%, while RMSE decreased by about 0.1541 μm and 0.2164 μm, and MAE decreased by nearly 0.1513 μm and 0.2050 μm, respectively, compared to single-structure data prediction sub-models. At 5000 r/min, R2 values improved by approximately 10% and 37%, while RMSE decreased by about 0.1407 μm and 0.1960 μm, and MAE decreased by roughly 0.1250 μm and 0.1401 μm, respectively. These findings indicate that the proposed thermal error prediction model based on multi-source heterogeneous information fusion effectively leverages the objective weighting capability of the entropy weighting method, synthesizing the characteristics of different structural data and the strengths of various prediction sub-models to achieve effective prediction of thermal errors in machine tool spindle systems.
(4) This paper innovatively introduces the multi-source heterogeneous information fusion method from other fields into the field of machine tools, hoping to mine the information of different structure data to achieve more accurate prediction of spindle thermal error. The prediction results of this paper verify the effectiveness of this method. In the future, we will delve into the model architecture to meet its real-time needs on low-cost computers without significantly sacrificing predictive accuracy.
Author Contributions
Conceptualization, X.D.; methodology, J.Z., Y.C. and X.L.; validation, Y.H.; formal analysis, Y.H.; investigation, X.W. and J.Z.; resources, X.D.; writing—original draft preparation, Y.H.; writing—review and editing, Y.H.; supervision, X.D. All authors have read and agreed to the published version of the manuscript.
Funding
This research was financially supported by the National Natural Science Foundation of China (52175472), the Zhejiang Provincial Natural Science Foundation of China (LD24E050011 and LGG22E050031), and the Natural Science Foundation of Zhejiang Province for Distinguished Young Scholars (LR22E050002).
Data Availability Statement
The data presented in this study are available upon request from the corresponding author due to privacy or ethical constraints.
Conflicts of Interest
The authors have no conflicts of interest to declare that are relevant to the content of this article.
References
- Liu, W.; Zhang, S.; Lin, J.; Xia, Y.; Wang, J.; Sun, Y. Advancements in accuracy decline mechanisms and accuracy retention approaches of CNC machine tools: A review. Int. J. Adv. Manuf. Technol. 2022, 121, 7087–7115. [Google Scholar] [CrossRef]
- Deng, X.L.; Lin, H.; Wang, J.C.; Xie, C.X.; Fu, J.Z. Review on thermal design of machine tool spindles. Opt. Precis. Eng. 2018, 26, 1415–1429. [Google Scholar] [CrossRef]
- Li, Y.; Zhao, W.; Lan, S.; Ni, J.; Wu, W.; Lu, B. A review on spindle thermal error compensation in machine tools. Int. J. Mach. Tools Manuf. 2015, 95, 20–38. [Google Scholar] [CrossRef]
- Zimmermann, N.; Büchi, T.; Mayr, J.; Wegener, K. Self-optimizing thermal error compensation models with adaptive inputs using Group-LASSO for ARX-models. J. Manuf. Syst. 2022, 64, 615–625. [Google Scholar] [CrossRef]
- Chen, C.; Dai, H.; Lee, C.; Hsieh, T.; Hung, W.; Jywe, W. The development of thermal error compensation on CNC machine tools by combining ridge parameter selection and backward elimination procedure. Int. J. Adv. Manuf. Technol. 2024, 130, 2423–2442. [Google Scholar] [CrossRef]
- Sun, J.; Liu, Z.; Qiu, C.; Jiang, Z.; Mao, H.; He, L.; Tan, J. An axial attention-BiLSTM-based method for predicting the migration of CNC machine tool spindle thermal error under varying working conditions. Int. J. Adv. Manuf. Technol. 2024, 130, 1405–1419. [Google Scholar] [CrossRef]
- Zimmermann, N.; Breu, M.; Mayr, J.; Wegener, K. Autonomously triggered model updates for self-learning thermal error compensation. CIRP Ann.-Manuf. Technol. 2021, 70, 431–434. [Google Scholar] [CrossRef]
- Sun, S.; Qiao, Y.; Gao, Z.; Wang, J.; Bian, Y. A thermal error prediction model of the motorized spindles based on ABHHO-LSSVM. Int. J. Adv. Manuf. Technol. 2023, 127, 2257–2271. [Google Scholar] [CrossRef]
- Wei, X.; Qian, Z.; Wu, Q.; Qian, M.; Zhou, J. Research on the thermal accuracy modeling method driven by data mechanism for machine tool spindle. Chin. J. Sci. Instrum. 2023, 44, 111–119. [Google Scholar]
- Mareš, M.; Horejš, O.; Havlík, L. Thermal error compensation of a 5-axis machine tool using indigenous temperature sensors and CNC integrated Python code validated with a machined test piece. Precis. Eng. 2020, 66, 21–30. [Google Scholar] [CrossRef]
- Cheng, Y.; Qiao, K.; Jin, S.; Zhou, S.; Xue, J. Research on electric spindle thermal error prediction model based on DBO-SVM. Int. J. Adv. Manuf. Technol. 2024, 132, 3333–3347. [Google Scholar]
- Tsai, P.-C.; Cheng, C.-C.; Chen, W.-J.; Su, S.-J. Sensor placement methodology for spindle thermal compensation of machine tools. Int. J. Adv. Manuf. Technol. 2020, 106, 5429–5440. [Google Scholar] [CrossRef]
- Liu, J.L.; Ma, C.; Yuan, Q. Spindle unit thermal error modeling and compensation based on digital twin. Int. J. Adv. Manuf. Technol. 2024, 132, 1525–1555. [Google Scholar] [CrossRef]
- Li, G.; Chen, X.; Li, Z.; Xu, K.; Tang, X.; Wang, Z. Thermal error modeling of spindle for precision CNC machine tool based on AO-CNN. J. Xi’an Jiaotong Univ. 2022, 56, 51–61. [Google Scholar]
- Abdulshahed, A.M.; Longstaff, A.P.; Fletcher, S.; Myers, A. Thermal error modelling of machine tools based on ANFIS with fuzzy c-means clustering using a thermal imaging camera. Appl. Math. Model. 2015, 39, 1837–1852. [Google Scholar] [CrossRef]
- Luo, J.Y.; Jian, B.L. Establishment of Low-Cost and Stable Prediction Models Applied for Thermal Displacements in Three Axes. IEEE Sens. J. 2022, 22, 17031–17042. [Google Scholar] [CrossRef]
- Gu, Y.; Gross, J.N.; Rhudy, M.B.; Lassak, K. A Fault-Tolerant Multiple Sensor Fusion Approach Applied to UAV Attitude Estimation. Int. J. Aerosp. Eng. 2016, 2016, 6217428. [Google Scholar] [CrossRef]
- Roheda, S.; Krim, H.; Luo, Z.-Q.; Wu, T. Event driven sensor fusion. Signal Process. 2021, 188, 108241. [Google Scholar] [CrossRef]
- Li, Y.; Zhang, J.Y.; Wang, Y.Z. FT-MIR and NIR spectral data fusion: A synergetic strategy for the geographical traceability of Panax notoginseng. Anal. Bioanal. Chem. 2018, 410, 91–103. [Google Scholar] [CrossRef] [PubMed]
- Simjanoska, M.; Kochev, S.; Tanevski, J.; Bogdanova, A.M.; Papa, G.; Eftimov, T. Multi-level information fusion for learning a blood pressure predictive model using sensor data. Inf. Fusion 2020, 58, 24–39. [Google Scholar] [CrossRef]
- Chi, Y.; Guo, Y.; Feng, H.; Li, H.; Zheng, Y. Environmental quality evaluation method for swine gestation barns based on multi-source information fusion. Trans. Chin. Soc. Agric. Eng. 2022, 38, 212–221. [Google Scholar]
- Strelet, E.; Peng, Y.; Castillo, I.; Rendall, R.; Wang, Z.; Joswiak, M.; Braun, B.; Chiang, L.; Reis, M.S. Multi-source and multimodal data fusion for improved management of a wastewater treatment plant. J. Environ. Chem. Eng. 2023, 11, 111530. [Google Scholar] [CrossRef]
- Han, D.; Zhang, Y.; Yu, Y.; Tian, J.; Shi, P. Multi-source heterogeneous information fusion fault diagnosis method based on deep neural networks under limited datasets. Appl. Soft Comput. 2024, 154, 111371. [Google Scholar] [CrossRef]
- Janssens, O.; Loccufier, M.; Hoecke, S.V. Thermal imaging and vibration based multi-sensor fault detection for rotating machinery. IEEE Trans. Ind. Inform. 2019, 15, 434–444. [Google Scholar] [CrossRef]
- Gao, T.Y.; Yang, J.L.; Tang, Q. A multi-source domain information fusion network for rotating machinery fault diagnosis under variable operating conditions. Inf. Fusion 2024, 106, 102278. [Google Scholar] [CrossRef]
- Peng, J.; Yin, M.; Cao, L.; Liao, Q.; Wang, L.; Yin, G. Study on the spindle axial thermal error of a five-axis machining center considering the thermal bending effect. Precis. Eng. 2022, 75, 210–226. [Google Scholar] [CrossRef]
- Ito, K.; Xiong, K.Q. Gaussian filters for nonlinear filtering problems. IEEE Trans. Autom. Control 2000, 45, 910–927. [Google Scholar] [CrossRef]
- Wu, Y.; Hu, D.; Wu, M.; Hu, X. A numerical-integration perspective on gaussian filters. IEEE Trans. Signal Process. 2006, 54, 2910–2921. [Google Scholar] [CrossRef]
- Wu, C.Y.; Xiang, S.T.; Xiang, W.S. Spindle thermal error prediction approach based on thermal infrared images: A deep learning method. J. Manuf. Syst. 2021, 59, 67–80. [Google Scholar]
- Fang, C.; Chen, Y.; Deng, X.; Lu, S.; Zhang, W.; Chen, Y. A Novel Temperature Rise Prediction Method of Multi-component Feed System for CNC Machine Tool Based on Multi-source Fusion of Heterogeneous Correlation Information. Int. J. Precis. Eng. Manuf. 2024, 25, 1571–1586. [Google Scholar] [CrossRef]
- Dong, C.W.; Liu, Z.Y.; Yang, M.; Wang, M.; Zhang, R.T.; Lin, Z. Intelligent sensing method for detecting moisture content in fixed tea leaves for green tea based on multi-Source information fusion. Food Sci. 2022, 43, 242–251. [Google Scholar]
- Benftima, S.; Gharab, S.; Rivas-Pérez, R.; Feliu-Batlle, V. Modeling of an Irrigation Main Canal Pool based on a NARX-ANN System Identification. Commun. Nonlinear Sci. Numer. Simul. 2024, 132, 107929. [Google Scholar] [CrossRef]
- Boussaada, Z.; Curea, O.; Remaci, A.; Camblong, H.; Mrabet Bellaaj, N. A Nonlinear Autoregressive Exogenous (NARX) Neural Network Model for the Prediction of the Daily Direct Solar Radiation. Energies 2018, 11, 620. [Google Scholar] [CrossRef]
- Mirjalili, S.; Mirjalili, S.M.; Hatamlou, A. Multi-Verse Optimizer: A nature-inspired algorithm for global optimization. Neural Comput. Appl. 2016, 27, 495–513. [Google Scholar] [CrossRef]
- Kisvari, A.; Lin, Z.; Liu, X.L. Wind power forecasting-A data-driven method along with Gated Recurrent Neural Network. Renew. Energy 2021, 163, 1895–1909. [Google Scholar] [CrossRef]
- Liu, L.; Wan, X.; Li, J.; Wang, W.; Gao, Z. An improved entropy-weighted topsis method for decision-level fusion evaluation system of multi-source data. Sensors 2022, 22, 6391. [Google Scholar] [CrossRef]
- Ma, Y.; Shan, C.; Gao, J.; Chen, H. A novel method for state of health estimation of lithium-ion batteries based on improved LSTM and health indicators extraction. Energy 2022, 251, 123973. [Google Scholar] [CrossRef]
Disclaimer/Publisher’s Note: The statements, opinions and data contained in all publications are solely those of the individual author(s) and contributor(s) and not of MDPI and/or the editor(s). MDPI and/or the editor(s) disclaim responsibility for any injury to people or property resulting from any ideas, methods, instructions or products referred to in the content. |
© 2024 by the authors. Licensee MDPI, Basel, Switzerland. This article is an open access article distributed under the terms and conditions of the Creative Commons Attribution (CC BY) license (https://creativecommons.org/licenses/by/4.0/).

