Article

The Optimization and Control of the Engagement Pressure for a Helicopter Dry Clutch

1
School of Mechanical and Electrical Engineering, Central South University, Changsha 410012, China
2
State Key Laboratory of Precision Manufacturing for Extreme Service Performance, Central South University, Changsha 410012, China
*
Author to whom correspondence should be addressed.
Machines 2024, 12(8), 533; https://doi.org/10.3390/machines12080533
Submission received: 14 June 2024 / Revised: 28 July 2024 / Accepted: 1 August 2024 / Published: 6 August 2024
(This article belongs to the Section Machine Design and Theory)

Abstract

:
The engagement quality of a helicopter dry clutch has a significant impact on the service life and overall flight performance of the helicopter. The engagement oil pressure is an important factor affecting the clutch engagement quality. Firstly, a nonlinear input–output dynamic model for the dry clutch is developed to investigate the optimization and control of dry clutch engagement pressure in this paper. Secondly, to efficiently obtain the optimal pressure curve, an optimal method combining the developed dynamic model with the state feedback gain of a linear quadratic optimization regulator (LQR) solver is proposed. Thirdly, considering that hydraulic actuators may struggle with tracking certain pressure curves, a hydraulic actuator for accurately tracking pressure curves based on fuzzy PID is proposed. The simulation results indicate that the developed hydraulic actuator exhibits an excellent tracking performance. Moreover, compared with linear and segmented pressure curves, the optimal pressure curve derived from the proposed method significantly reduces jerk, friction work, and engagement duration, resulting in improved helicopter dry clutch engagement quality.

1. Introduction

The high-speed helicopter represents a new development direction in the helicopter field. Dry friction clutch active control technology has been developed for the tail rotor variable speed transmission system. When the helicopter is hovering or flying at a low speed, the power consumption can be reduced and the transmission efficiency can be improved while disconnecting the power transmission using the dry clutch [1]. The automatic engagement and disengagement of the dry friction clutch are achieved through electromechanical–hydraulic integration technology. However, in the event of high-speed differences between the input shaft and output shaft of the clutch, there are significant jerk and friction heat in the dry friction clutch engagement, which can adversely affect the service life of the clutch and driving experience. Therefore, it is crucial to track the load pressure, thus ensuring the engagement quality of the dry clutch [2,3,4].
Heijden et al. [5] established a control model for dual-clutch automotive power systems to minimize jerk, engagement duration, and friction loss. Controllers using piecewise linear quadratic optimal control technology were constructed. The simulation results showed that the dual-clutch controller method achieved a faster engagement duration and smoother engagement process compared with PWLQ controllers. Taotao Jin et al. [6] studied automatic–manual transmission vehicles and proposed an optimal decoupling control method. This method balanced shift duration and smoothness through decoupling controllers for optimal reference speed tracking, and smooth shifting performance was achieved in dry clutches. Van Berkel et al. [7] focused their work on vehicle dynamics and clutch slip dynamics. Through calibrating data with standard speed sensors, they balanced the requirements for speed and smoothness of the engagement, and a rapid and stable clutch engagement process was achieved. Li et al. [8] studied control strategies that correctly reflected driver intent during the startup process for AMT vehicles. They designed an intent perception machine based on artificial neural networks and derived optimal engagement strategies under different launch intents through linear quadratic regulators. Additionally, they designed a sliding mode controller for clutch engagement. Simulations and experiments demonstrated that AMT vehicles could accurately reflect the driver launch intent, and the launch performance was excellent. Zhu et al. [9] focused on high-speed differential dry friction clutches and proposed a variable slope engagement pressure control method that used SVR-PSO optimization algorithms to obtain optimal parameters for variable slope clamping force. The simulation results demonstrated that this method could simultaneously reduce the engagement duration, temperature rise, and torque jerk. Qiang Gao et al. [3] proposed a digital hydraulic tracking system. This system used a dual high-speed switch control valve array to improve the control accuracy and reliability of traditional hydraulic systems. The test results showed a good tracking performance at low frequencies. Park et al. [10] proposed a real-time estimation method that synchronized with clutch contact points for the friction coefficient of the dry clutch. They validated their dry clutch slip engagement control method on mass-produced vehicles. Felix Mesmer et al. [11] proposed two feedforward control strategies for the hydraulic clutch drive path. Compared with previous static mapping control, the data-driven neural network feedforward control exhibited great tracking results, with a smaller average pressure error and faster response.
Currently, optimization control for clutch engagement is mainly applied in the automotive field. There is limited research on the optimization pressure loading of the high-speed helicopter dry clutch and theoretical modeling, and practical engineering optimization analysis also lacks in terms of the load pressure for the helicopter dry clutch. To quickly and accurately obtain the optimal pressure curve, this paper proposes an optimal pressure-solving method by embedding linear quadratic optimal control methods with nonlinear input–output models of helicopter dry clutches. To fully consider the friction characteristics during the engagement process for helicopter dry clutches, a dynamic friction coefficient model in the engagement sliding phase is introduced. The LQR model is interactively embedded into the input–output model, where the state feedback gains obtained from the LQR solver are introduced into the input–output model of the clutch. The dynamic parameters in the input–output model are fed back to the LQR solver to achieve closed-loop solving for optimal pressure curves. The feasibility of loading the optimal pressure curve is validated through a designed hydraulic actuator with a fuzzy PID controller.

2. Dynamic Model and Optimized Control Method

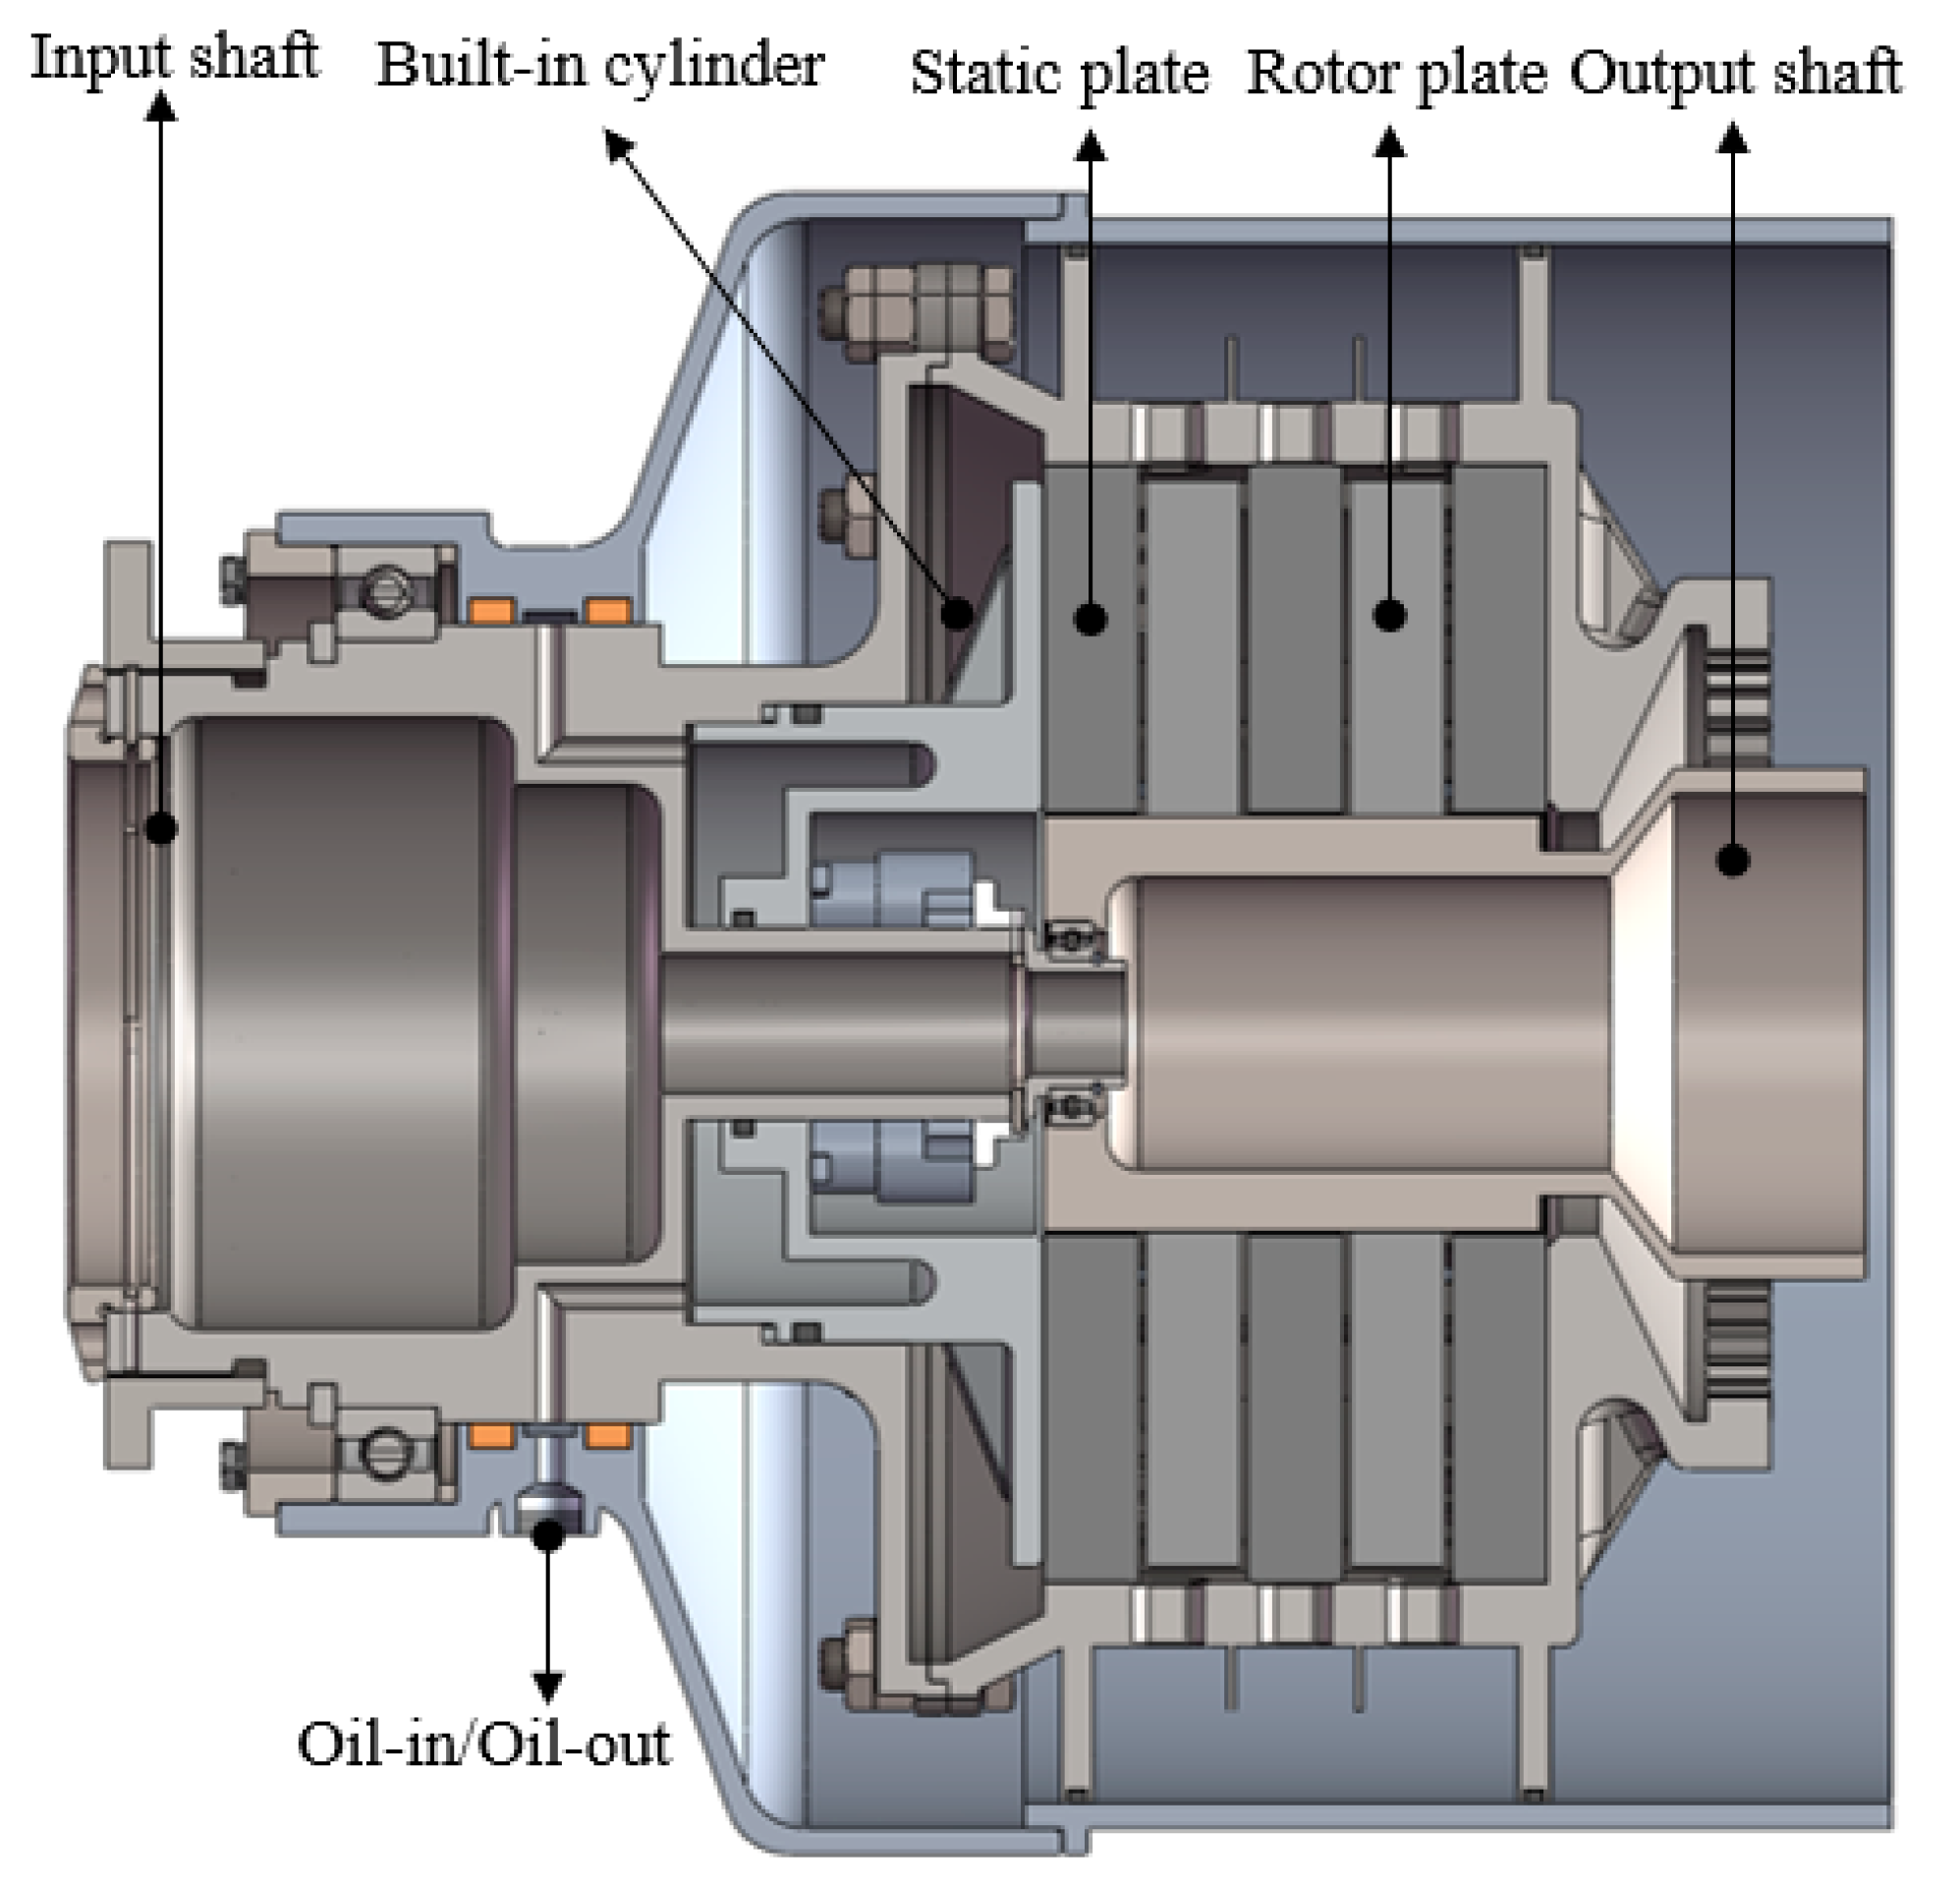
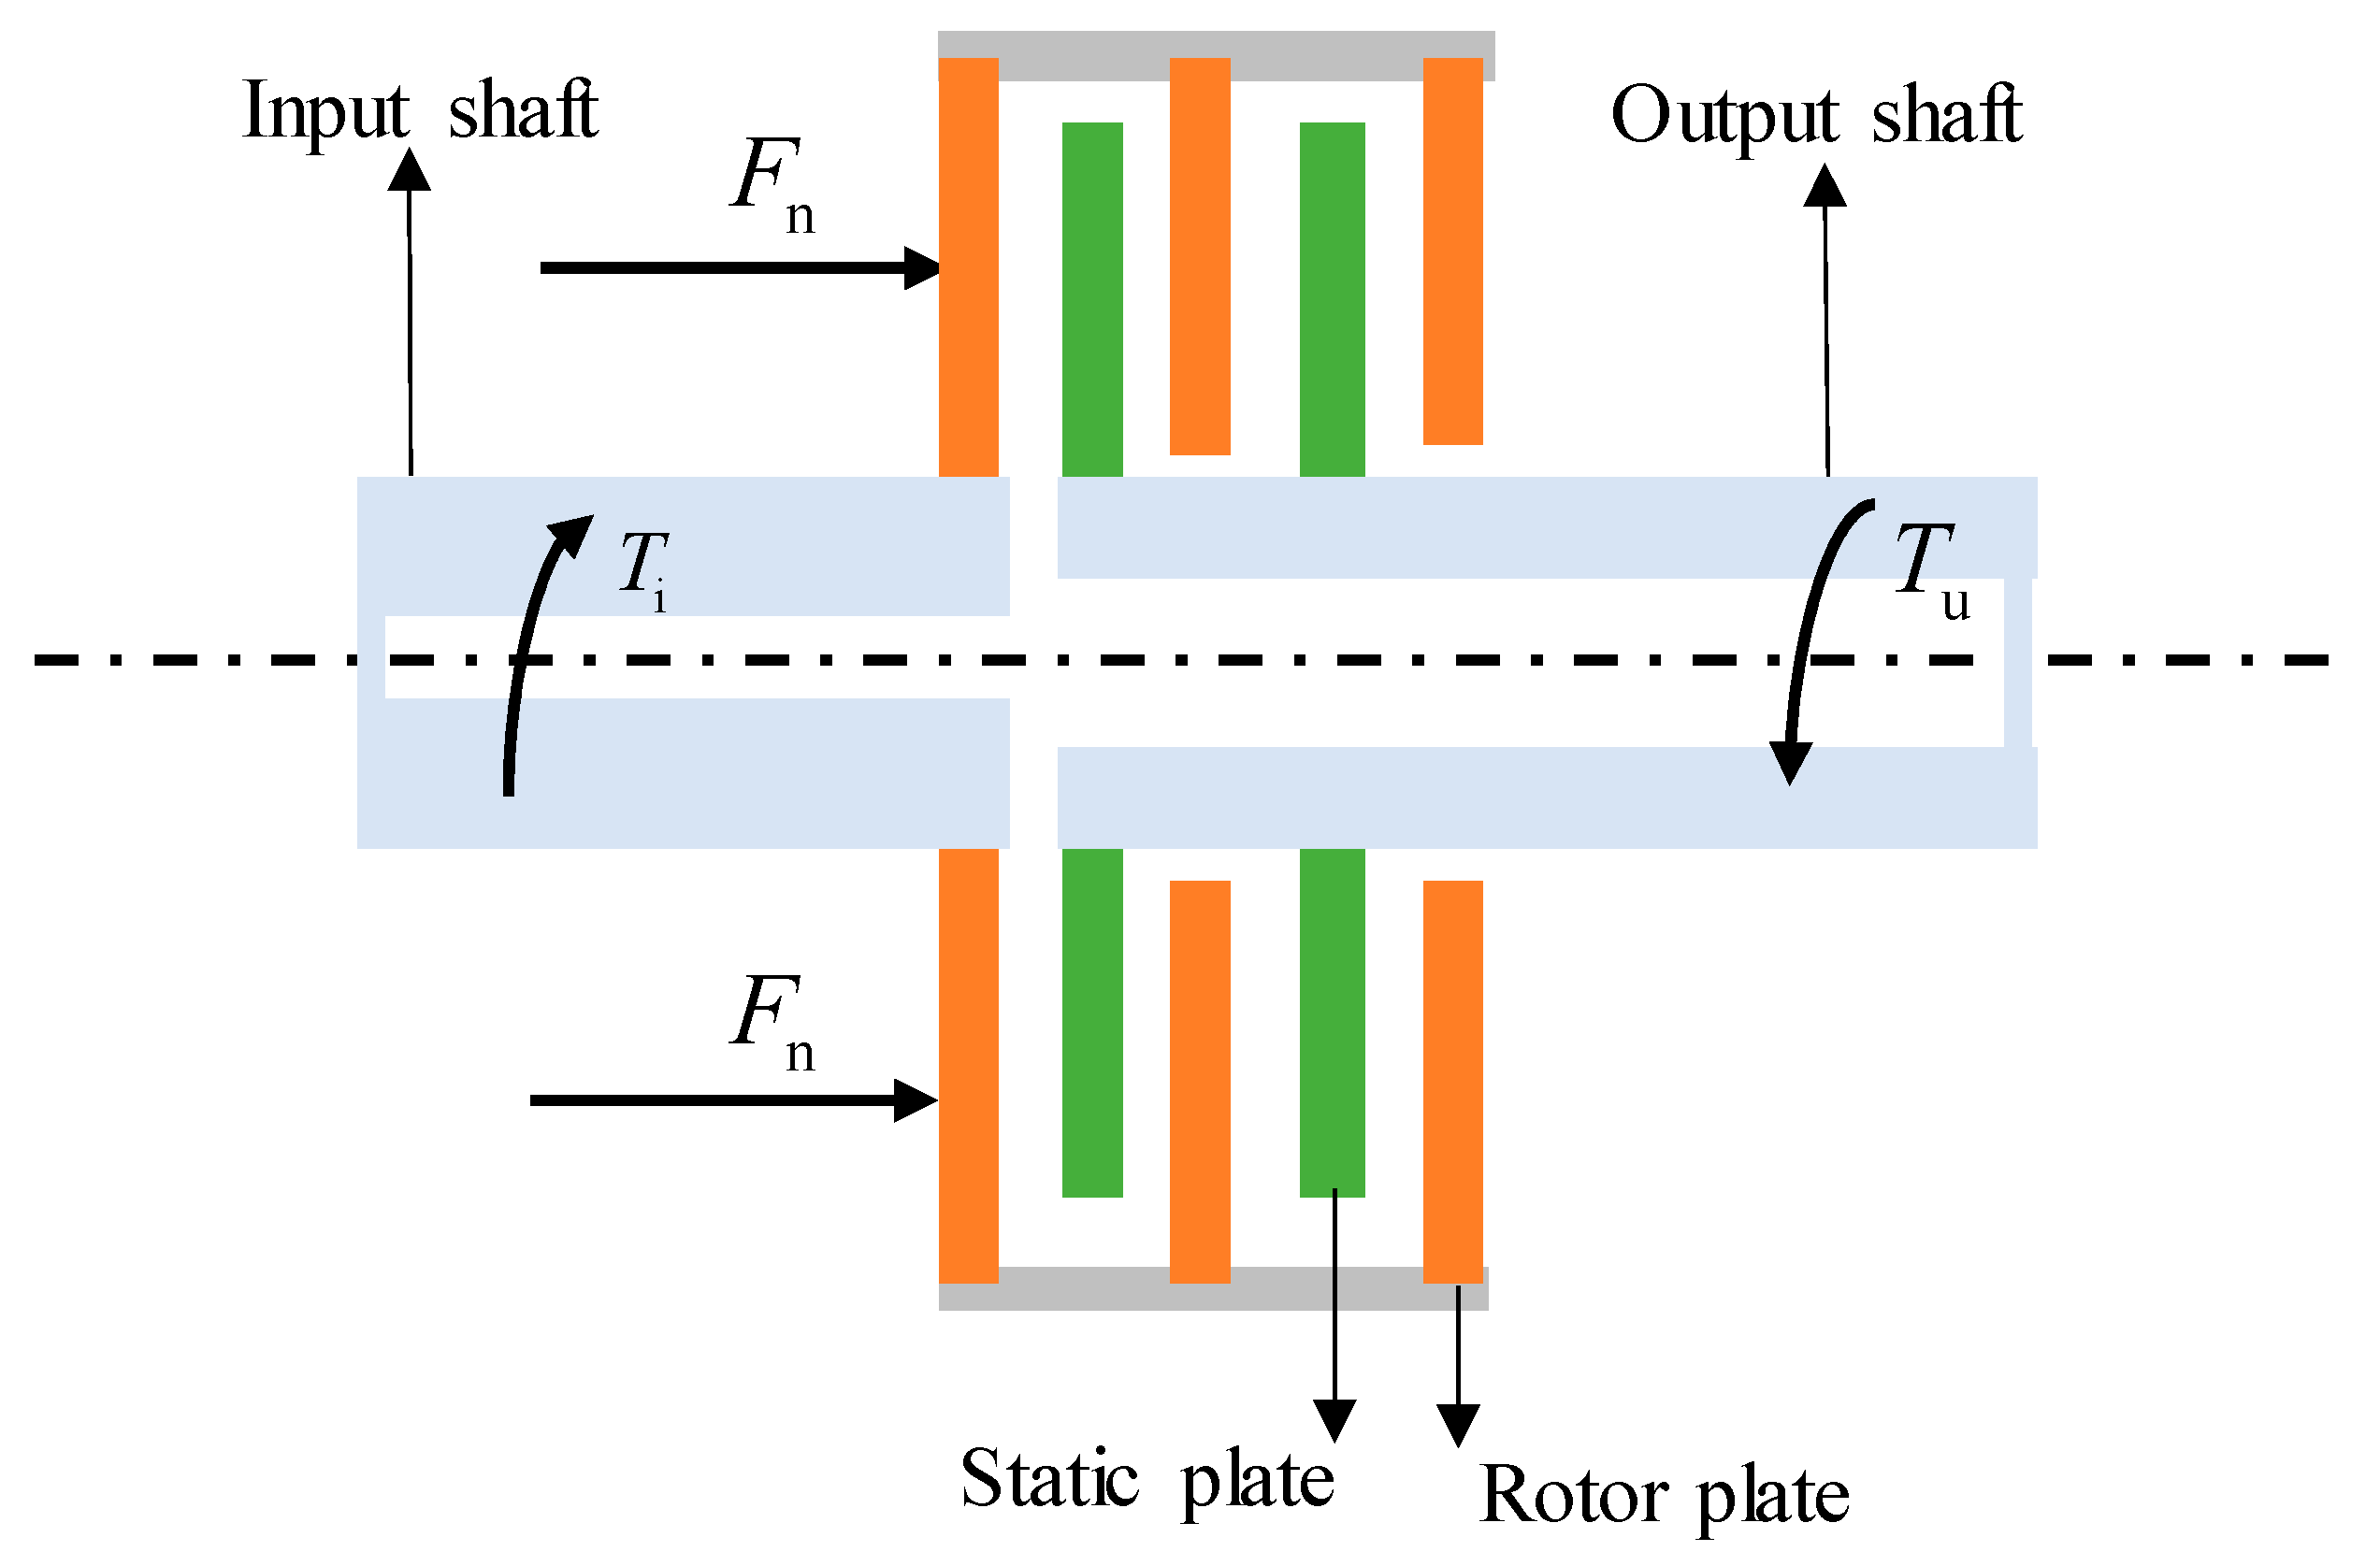
2.1. Nonlinear Input–Output Dynamic Modeling for a Helicopter Dry Clutch

The structural schematic diagram of the dry clutch studied in this paper is shown in Figure 1. The dry clutch mainly consists of rotor plates, static plates, an input shaft, an output shaft, etc. The rotor plates and static plates are, respectively, installed on the input shaft and output shaft through splines. Under the pressure of the built-in cylinder oil, the pressure overcomes the spring resistance and pushes the rotor plates and static plates to press together. Under the action of friction torque between the rotor plates and static plates, the input shaft dynamics is transmitted to the output shaft, thus achieving the synchronization of the input and output shafts. After the hydraulic pressure is removed, under the action of the return spring pressure, the rotor plates and static plates separate, achieving dynamic disconnection.
During the engagement process, the dry clutch successively undergoes the eliminating-slack-travel phase, the slipping phase, and the synchronization phase. However, the engagement quality is mainly influenced by the slipping phase. The slipping phase is mainly investigated in this paper.
The simplified model of dry clutch input–output dynamics is illustrated in Figure 2. Before the clutch is engaged, the input shaft rotates at high speed and the output shaft speed is 0. Under the action of pressure Fn, the rotor plates and the static plates are pressed together to generate friction torque Tf, thereby overcoming the output load torque Tu and transferring the input shaft torque Ti to the output shaft. Finally, the input shaft and the output shaft are synchronized.
While the rotation of the rotor and static plates consumes some of the input dynamics for their rotation, their mass is much smaller than that of the input and output shafts. So, the rotation of the rotor and static plates has minimal influence on dynamic transmission. To simplify the model of dynamic transmission between the input and output shafts, this paper only considers the sliding friction torque between the rotor and static plates, neglecting the rotational inertia of these plates [12]. The simplified mathematical model of the clutch input–output dynamics can be expressed as follows:
I i ω ˙ i + b i ω i = T i T f I u ω ˙ u + b u ω u = T f T u
where ω i   and ω u are the input shaft angular velocity and the output shaft angular velocity, respectively, Ii and Iu are the input equivalent moment of inertia and the output equivalent moment of inertia, respectively, and bi and bv are the input equivalent damping coefficient and the output equivalent damping coefficient, respectively.
During the engagement process, the sliding friction factor between static plates and rotor plates is associated with the friction factor, temperature, input–output shaft speed difference, etc. The influence of main factors on the sliding friction factor is considered in this paper, such as the surface roughness and speed difference between rotor plates and static plates. The sliding friction factor f can be calculated by Equation (2) [13,14].
f = μ 1 + μ 2 μ 1 exp Δ ω v s σ
where μ 1 is the Coulomb friction coefficient, μ 2 is the static friction coefficient, ∆ω is the input–output shaft speed difference, and v s and σ are empirical constants of the Stribeck friction model.
Therefore, the mathematical model for the sliding friction torque of the dry friction clutch can be calculated as follows:
T f = sgn ( Δ ω ) N η f 0 2 π r 1 r 2 r 2 P i d r d θ
where r 1   and r 2 are the inner and outer diameter of the rotor plates, respectively, P i is the pressure on the rotor plates, η is the torque transmission efficiency, and N is the number of contact surfaces of the clutch.
Solving pressure curve P i is the focus of this paper; Equation (3) can be expressed as Equation (4).
T f = sgn ( Δ ω ) K f ( Δ ω ) P i K f ( Δ ω ) = N η f 0 2 π r 1 r 2 r 2 d r d θ
In summary, the input–output dynamic model of the clutch during the sliding engagement stage is constructed as Equation (5).
I i ω ˙ i + b i ω i = T i T f I u ω ˙ u + b u ω u = T f T u T f = sgn ( Δ ω ) K f ( Δ ω ) P i
The relevant parameters of the input–output dynamic model are listed in Table 1.

2.2. Performance Evaluation Indicators of Clutch Engagement

2.2.1. Friction Work

In the clutch engagement process, there is a significant speed difference between the rotor plates and the static plates, which results in a large amount of friction heat. Consequently, the temperature of the rotor plates and static plates rises sharply, affecting the service life of the clutch. The heat generated during clutch engagement can be characterized by the friction work between the static plates and the rotor plates. Therefore, friction work can be selected as a performance evaluation indicator in the clutch engagement process. Friction work can be calculated by Equation (6).
W f = 0 T f ( ω i ω u ) d t
where Wf is the friction work generated during the engagement process between the static plates and the rotor plates, and t0 and tf are the starting and ending moments of clutch engagement, respectively.

2.2.2. Jerk

During the dry clutch engagement process, dynamics and torque are transferred unstably from the input to the output, resulting in rapid torque fluctuation and noticeable lurching, which affect the service life of the dry clutch. Therefore, the smoothness of the clutch engagement process can be evaluated by the rate of change of acceleration, i.e., jerk. Jerk can be calculated by Equation (7).
j = d 2 v d t 2 = r u d 2 ω u d t 2 = r u d T f I u d t
where j is the jerk of the engagement process.

2.3. Optimal Pressure Curve Solving for Nonlinear System Based on LQR

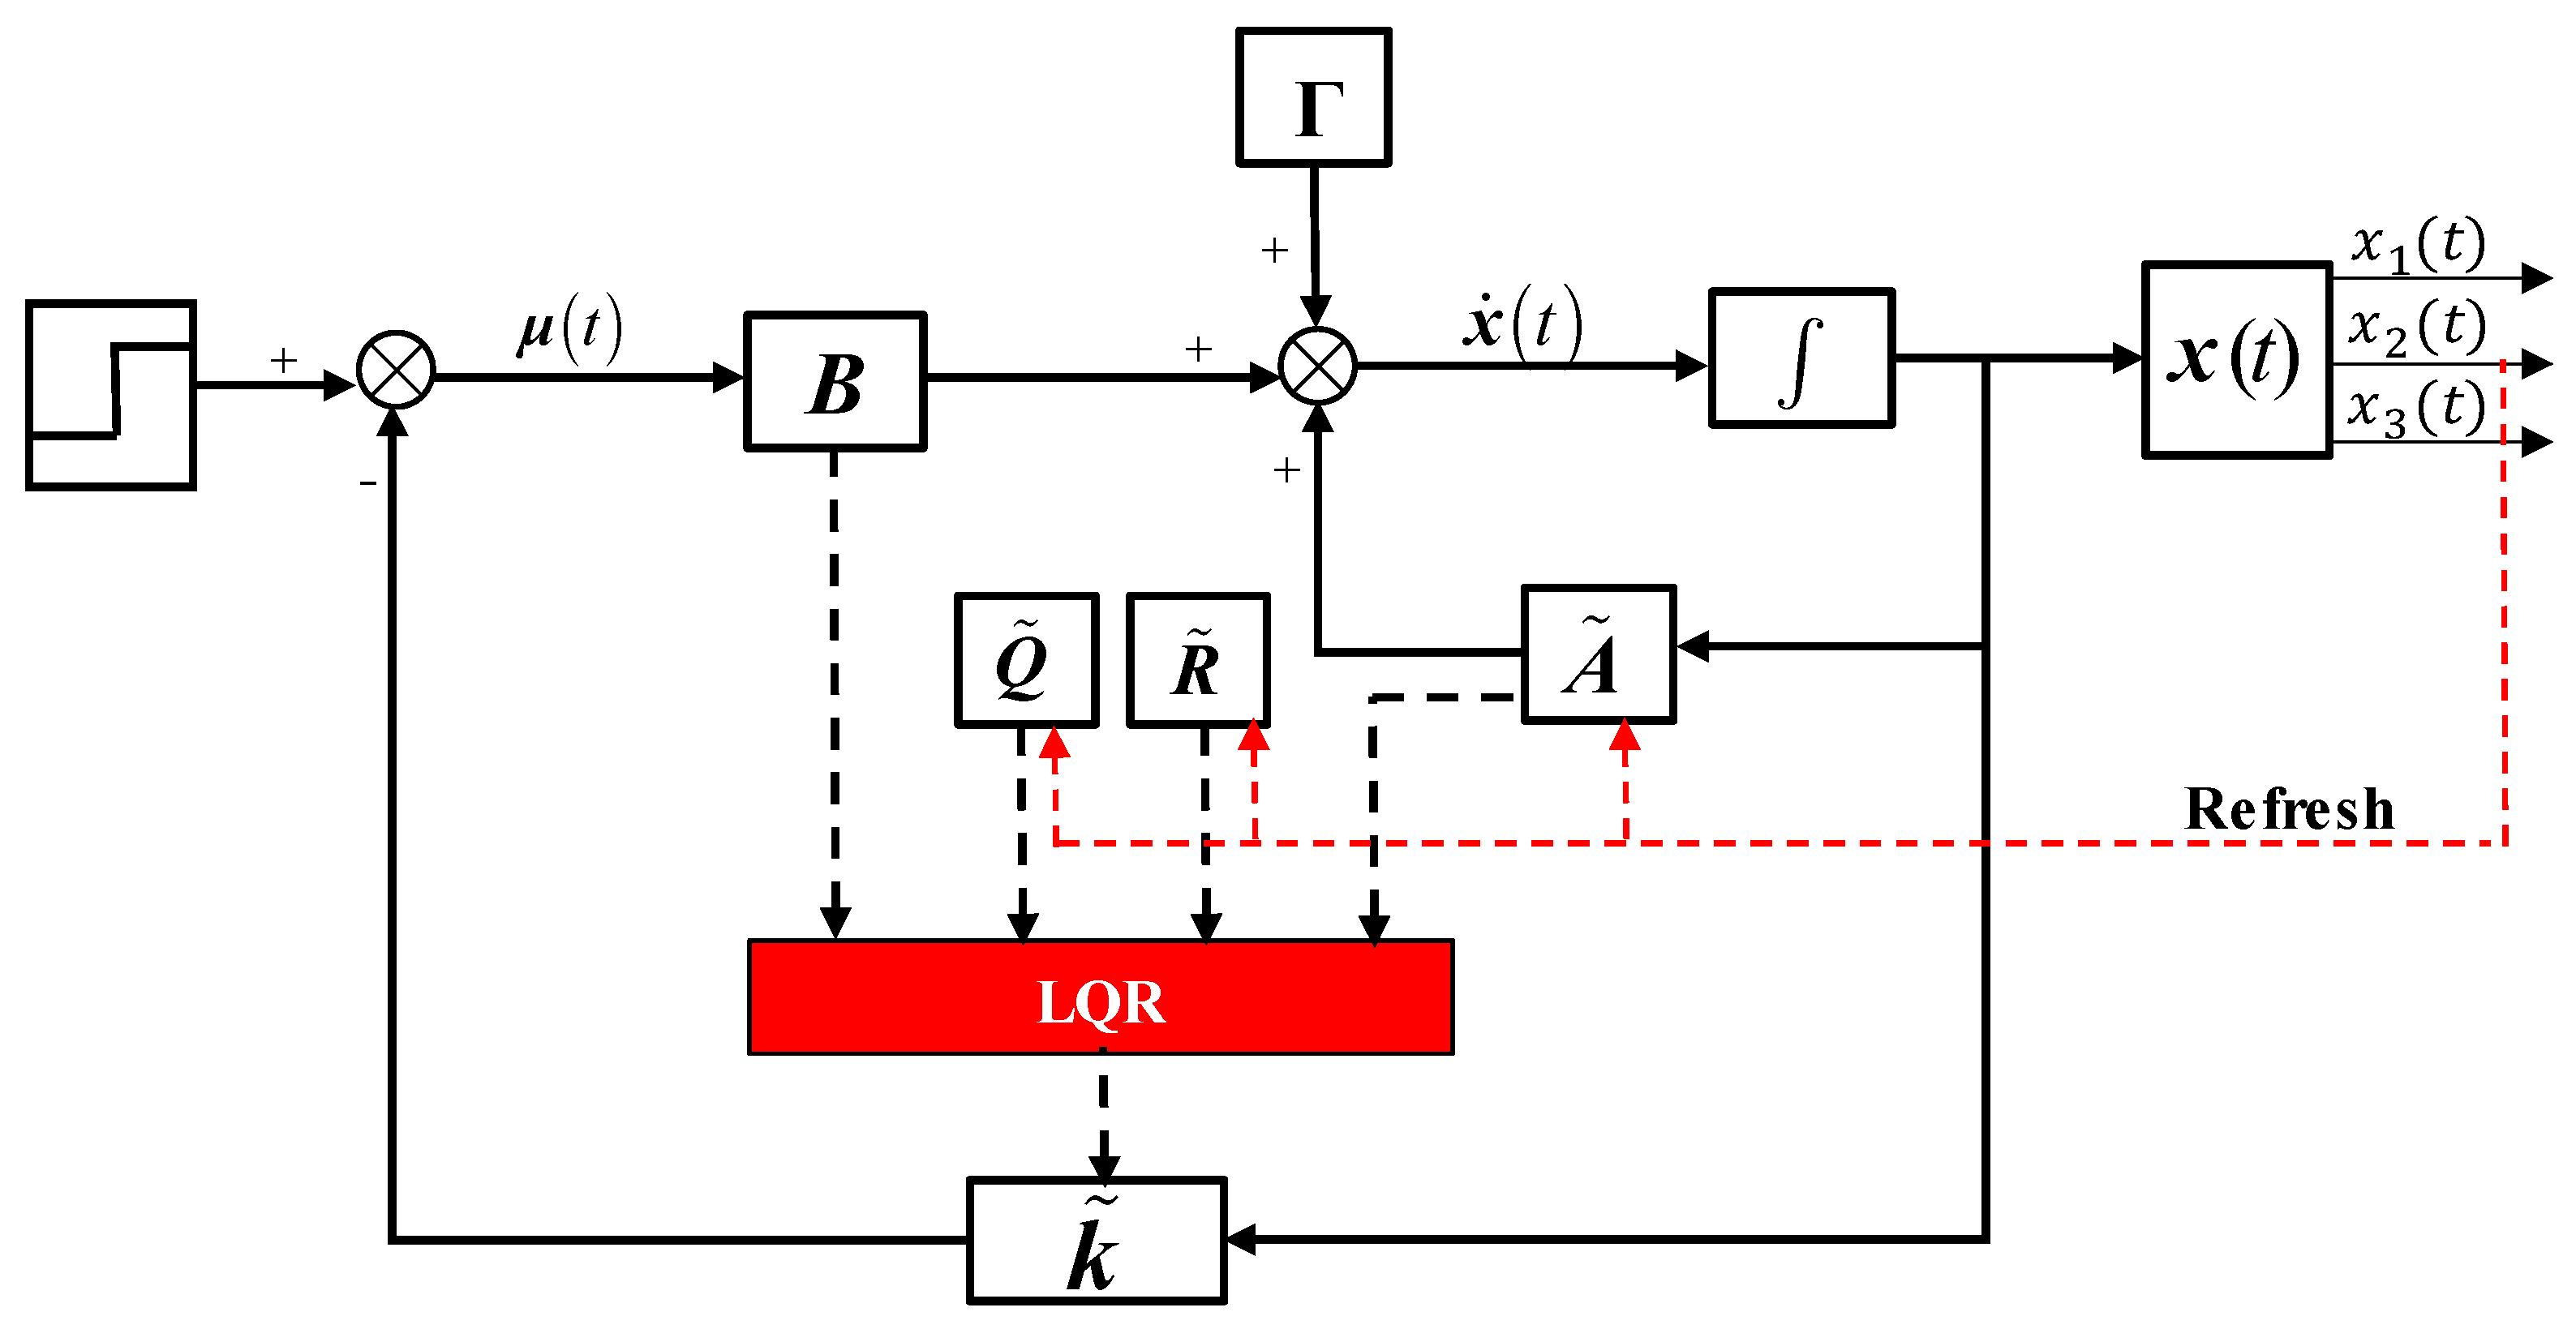
2.3.1. Constructing an LQR Solver Based on a Nonlinear Dynamic Model

The input speed ω i , input–output speed difference ω , and rotor plate pressure Pi are selected as state variables. The rate of change of pressure dP i d t is selected as the control variable [15]. The state equation for the input–output dynamic model during the sliding friction stage is as follows:
x ˙ = A x + B u + Γ
where the state variable x and the control variable u are described as follows:
x = x 1 x 2 x 3 = ω i Δ ω P i u = d P i d t
According to Equation (5), the matrices A and B and the disturbance matrix Γ are expressed in Equation (10), Equation (11), and Equation (12), respectively.
A = b i I i 0 sgn Δ ω K f ( Δ ω ) I i b u I u b u I i b u I u ( 1 I i + 1 I u ) sgn Δ ω K f ( Δ ω ) 0 0 0
B = 0 0 1 T
Γ = T i I i T i I i + T u I u 0 T
Based on Equations (6), (7) and (9), the friction work and jerk are converted into expressions related to the state variables, and then the friction work can be calculated by Equation (13) and the jerk can be obtained from Equation (14).
W f = 0 sgn ( Δ ω ) K f ( Δ ω ) Δ ω P i d t
j = sgn Δ ω K f ( Δ ω ) r 1 I u d P i d t
According to the theory of linear quadratic optimal control, the standard form of performance function is described as follows:
J = 1 2 0 x T ( t ) Q ( t ) x ( t ) + u ( t ) T R ( t ) u ( t ) d t
In the clutch engagement process, the optimal pressure loading during clutch engagement not only helps to minimize jerk, but also reduces the friction work. However, the slower the optimal pressure loading, the longer the engagement duration, resulting in lower jerk but more friction work. It is impossible to simultaneously minimize both jerk and friction work, so the two evaluation indicators can be weighted based on actual requirements. According to Equations (9) and (13)–(15), the performance indicators are combined with the state variables and control variables, and the weight performance function is as follows:
J = 1 2 0 ( Q 1 sgn x 2 K f ( x 2 ) x 2 x 3 d t + Q 2 K f ( x 2 ) 2 r 1 2 I u 2 u 2 ) d t
where Q1 and Q2 are the weight coefficients for friction work and jerk, respectively.
After converting Equation (16) into standform of performance function, the weight matrix for friction work is derived as follows:
Q ( t ) = Q 1 1 0 0 0 1 sgn x 2 K f ( x 2 ) 0 0 1
And the weight matrix for jerk is derived as follows:
R ( t ) = Q 2 K f ( x 2 ) 2 r 1 2 I i 2
Due to the mechanical characteristics of the input and output shafts, the constraints for x1 and x2 are presented as follows:
0 x 1 ω max 0 x 2 Δ ω max
where ω max is the maximum speed of the input shaft; Δ ω max is the maximum speed difference from the input shaft to the output shaft.
According to the performance function Equation (16), the optimal pressure curve solution is an infinite time regulator problem. Under the condition that the state Equation (8) is satisfied, the optimal control solution u*(t) ensures that the combined performance indicators of jerk and friction work are always minimized from the initial to the terminal state. Then, the optimal pressure curve can be obtained by integrating the control variable, i.e., u*(t) [16,17].
According to the theory of LQR, the optimal control rate u*(t) can be obtained by Equation (20).
u * ( t ) = R 1 ( t ) B T ( t ) λ ( t )
where λ ( t ) is the covariate.
Since there is a disturbance term Γ in Equation (8), λ ( t ) is expressed as follows:
λ t = P t x t + h ( t )
The derivation of Equation (21) can be calculated as follows:
λ ˙ ( t ) = P ˙ ( t ) x ( t ) + P ( t ) x ˙ ( t ) + h ˙ ( t )
where P(t) is the matrix Riccati differential equation.
P(t) and h(t) can be obtained by Equation (22).
P ˙ ( t ) P ˙ ( t ) B R 1 B T P ( t ) + P ( t ) A + A T P ( t ) + Q = 0 h ˙ ( t ) + P ( t ) B R 1 B T h + P ( t ) Γ + A T h ( t ) = 0
Substituting Equation (21) into Equation (20) yields the following:
u * ( t ) = R 1 ( t ) B T ( t ) [ P ( t ) x ( t ) + h ( t ) ] = k ( t ) x ( t ) + z ( t )
where k(t) is the linear state feedback gain matrix to achieve optimal control.
k(t) can be calculated by Equation (25).
k ( t ) = R 1 ( t ) B T ( t ) P ( t )

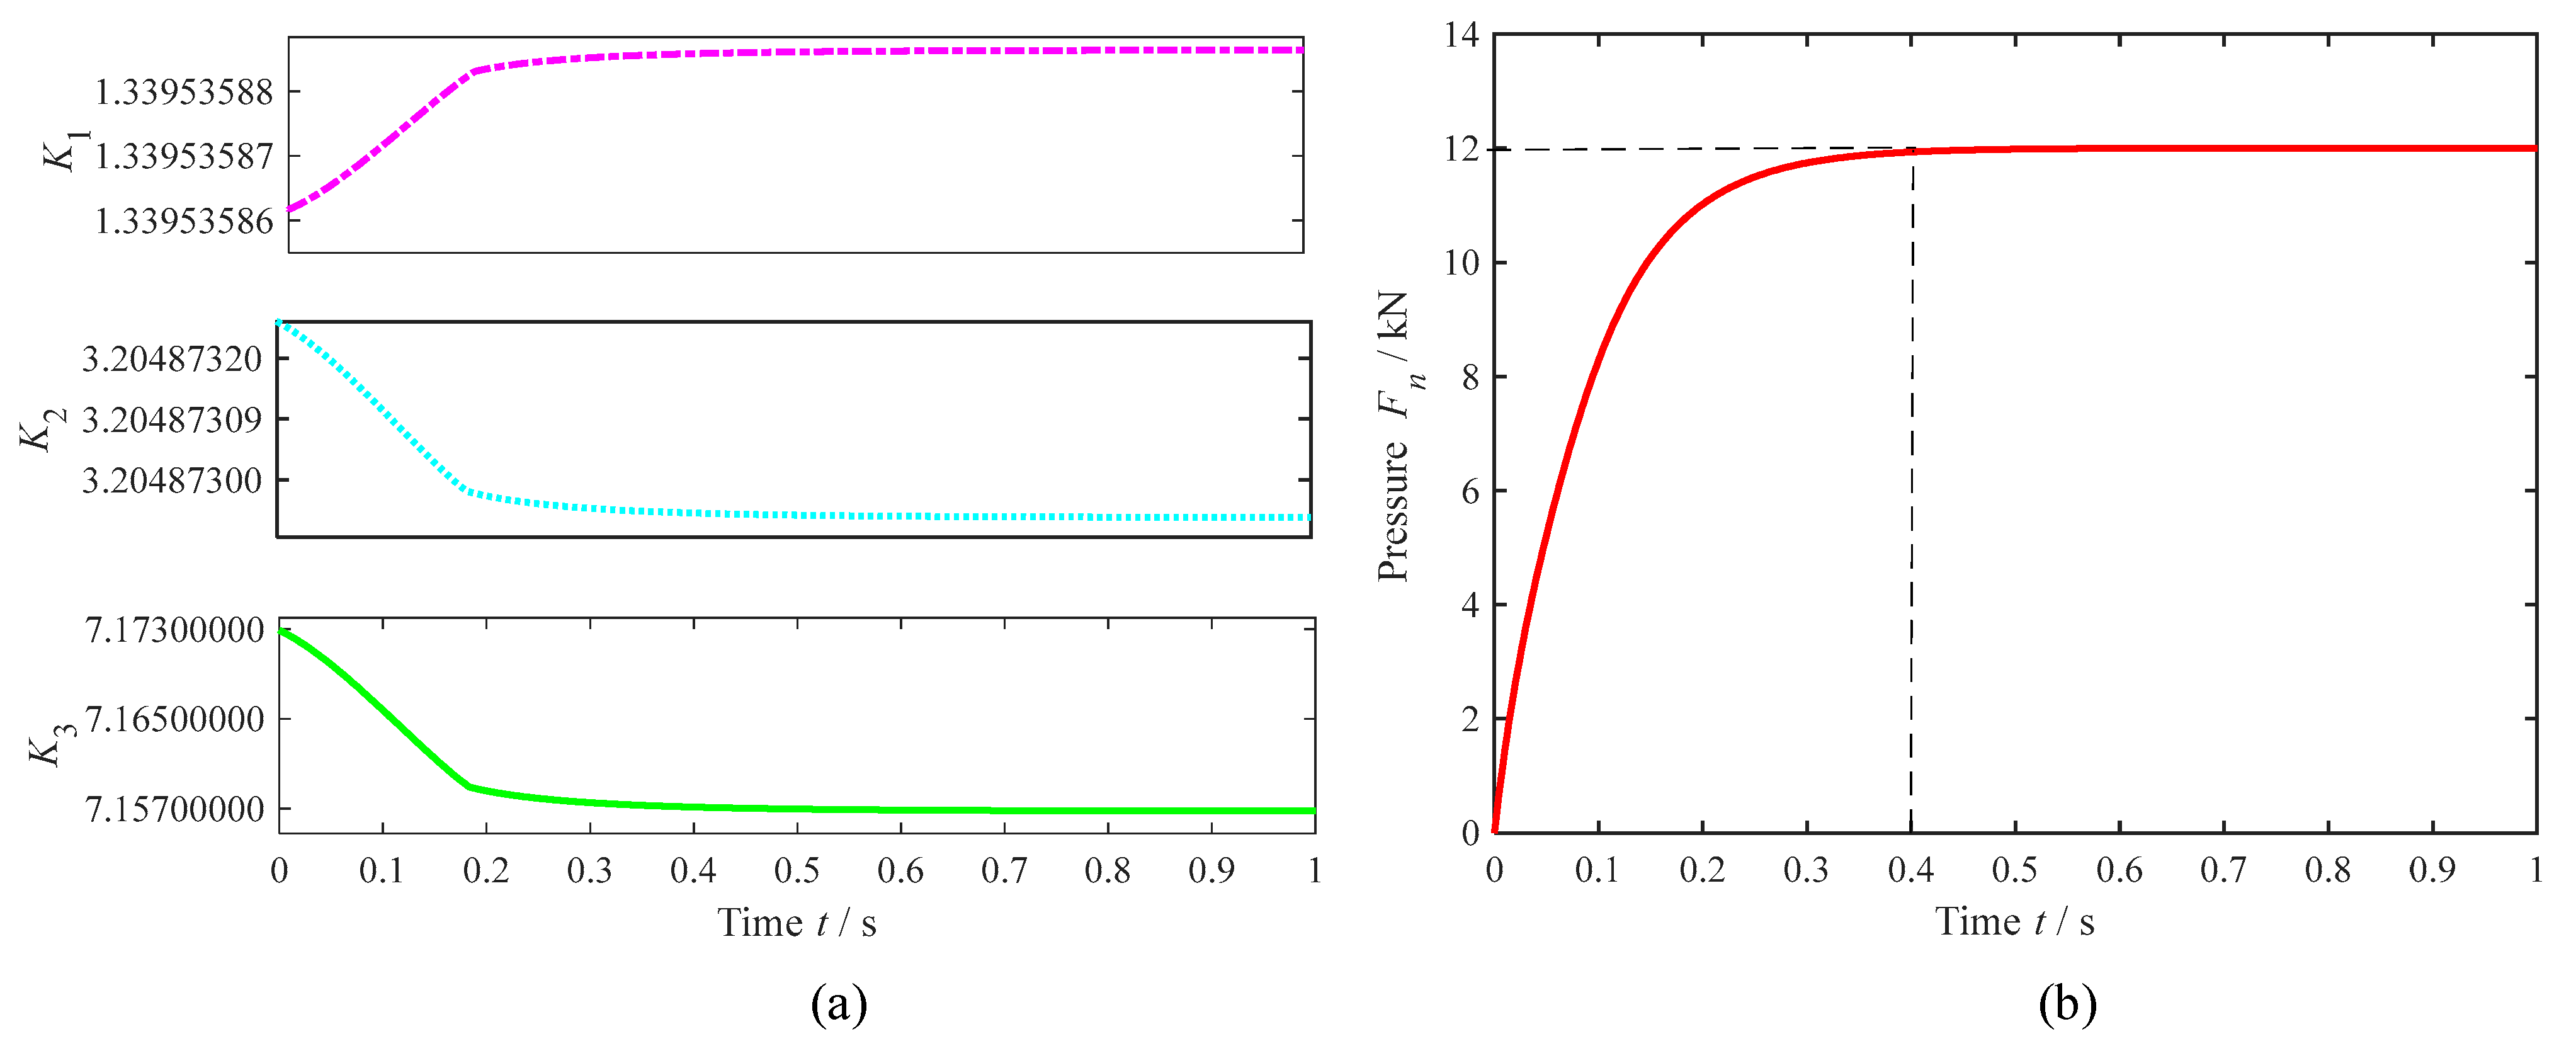
2.3.2. Optimal Pressure Curve Solution

According to Equation (10), the matrix A varies with the state variable x2(t), so it is necessary to adjust the matrix A in real time according to the state variables x2(t). From Equations (23) and (25), it can be seen that state feedback gain matrix k(t) changes with the matrix A, the weight matrix Q for friction work, and the weight matrix R for jerk. Therefore, the feedback gain matrix k(t) needs to be adjusted in real time, as well, in order to ensure the optimal feedback gain solution for the state variables. The process of solving the optimal pressure curve is the process of constantly updating the LQR solver. The optimization pressure curve solution diagram is illustrated in Figure 3.
By adjusting the weight parameters Q1 and Q2, different optimal curves can be obtained. Since Q1 is the weight parameter for friction work and Q2 is the weight parameter for jerk, the longer the engagement duration of the dry clutch, the higher the friction work and the lower the jerk. Therefore, when Q1/Q2 is larger, the evaluation indicator for friction work is more concerned, and the time for the system to reach the steady state is shorter. Since the controlled variable u*(t) is unrestricted, the maximum pressure will also be smaller. As shown in Figure 4, the pressure curves under different Q1/Q2 are solved. The results indicate that the larger Q1/Q2, the shorter the time to reach a steady state and the lower the maximum pressure. Therefore, the solution results demonstrate the correctness of the designed control model.
In this paper, a dry clutch is required to complete the engagement process in approximately 500 ms. Q1 and Q2 are valued according to the effect of Q1/Q2 on the time to reach a steady state, and the resultant pressure curve is assigned a scaling factor to achieve a maximum pressure of 12,000 N. Then, the resultant pressure curve is obtained and a maximum pressure of 12,000 N is achieved. Shown in Figure 5a are the feedback gain curves obtained from linear quadratic optimal control in the model. The gain feedback values change in real time due to dynamic parament feedback. Figure 5b depicts the ideal optimal pressure curve for this paper.

3. Simulation Results and Analysis

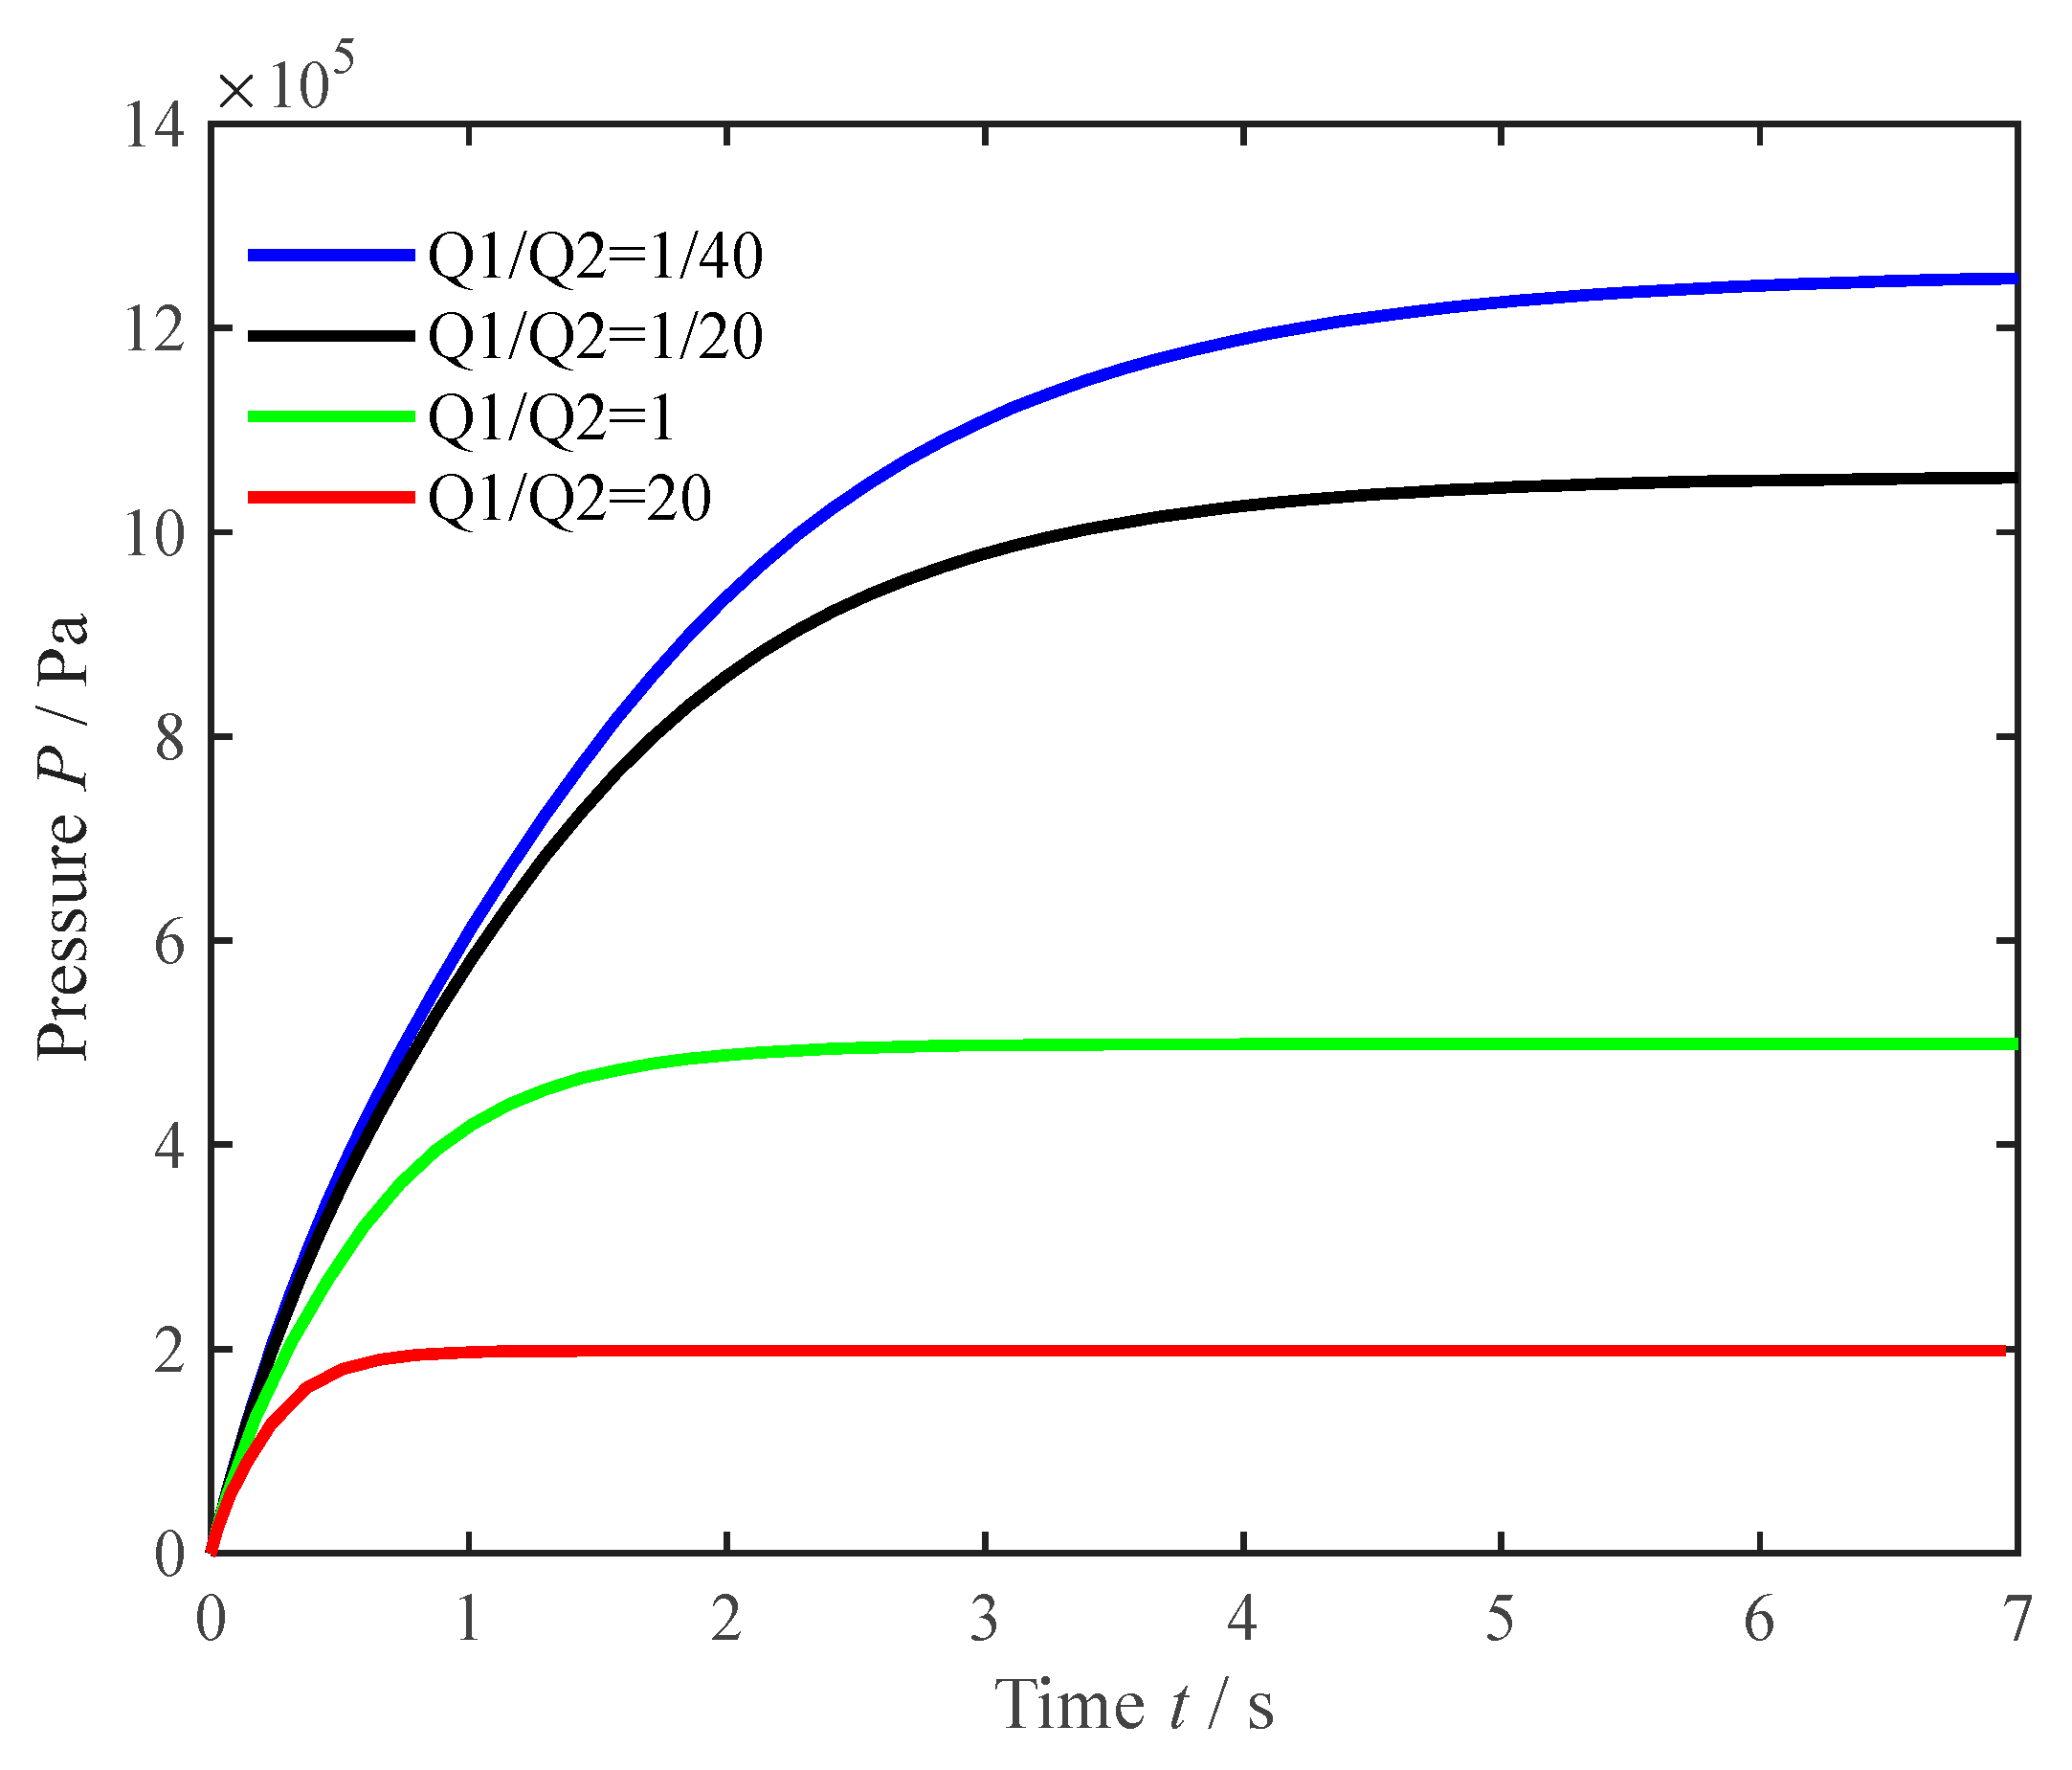
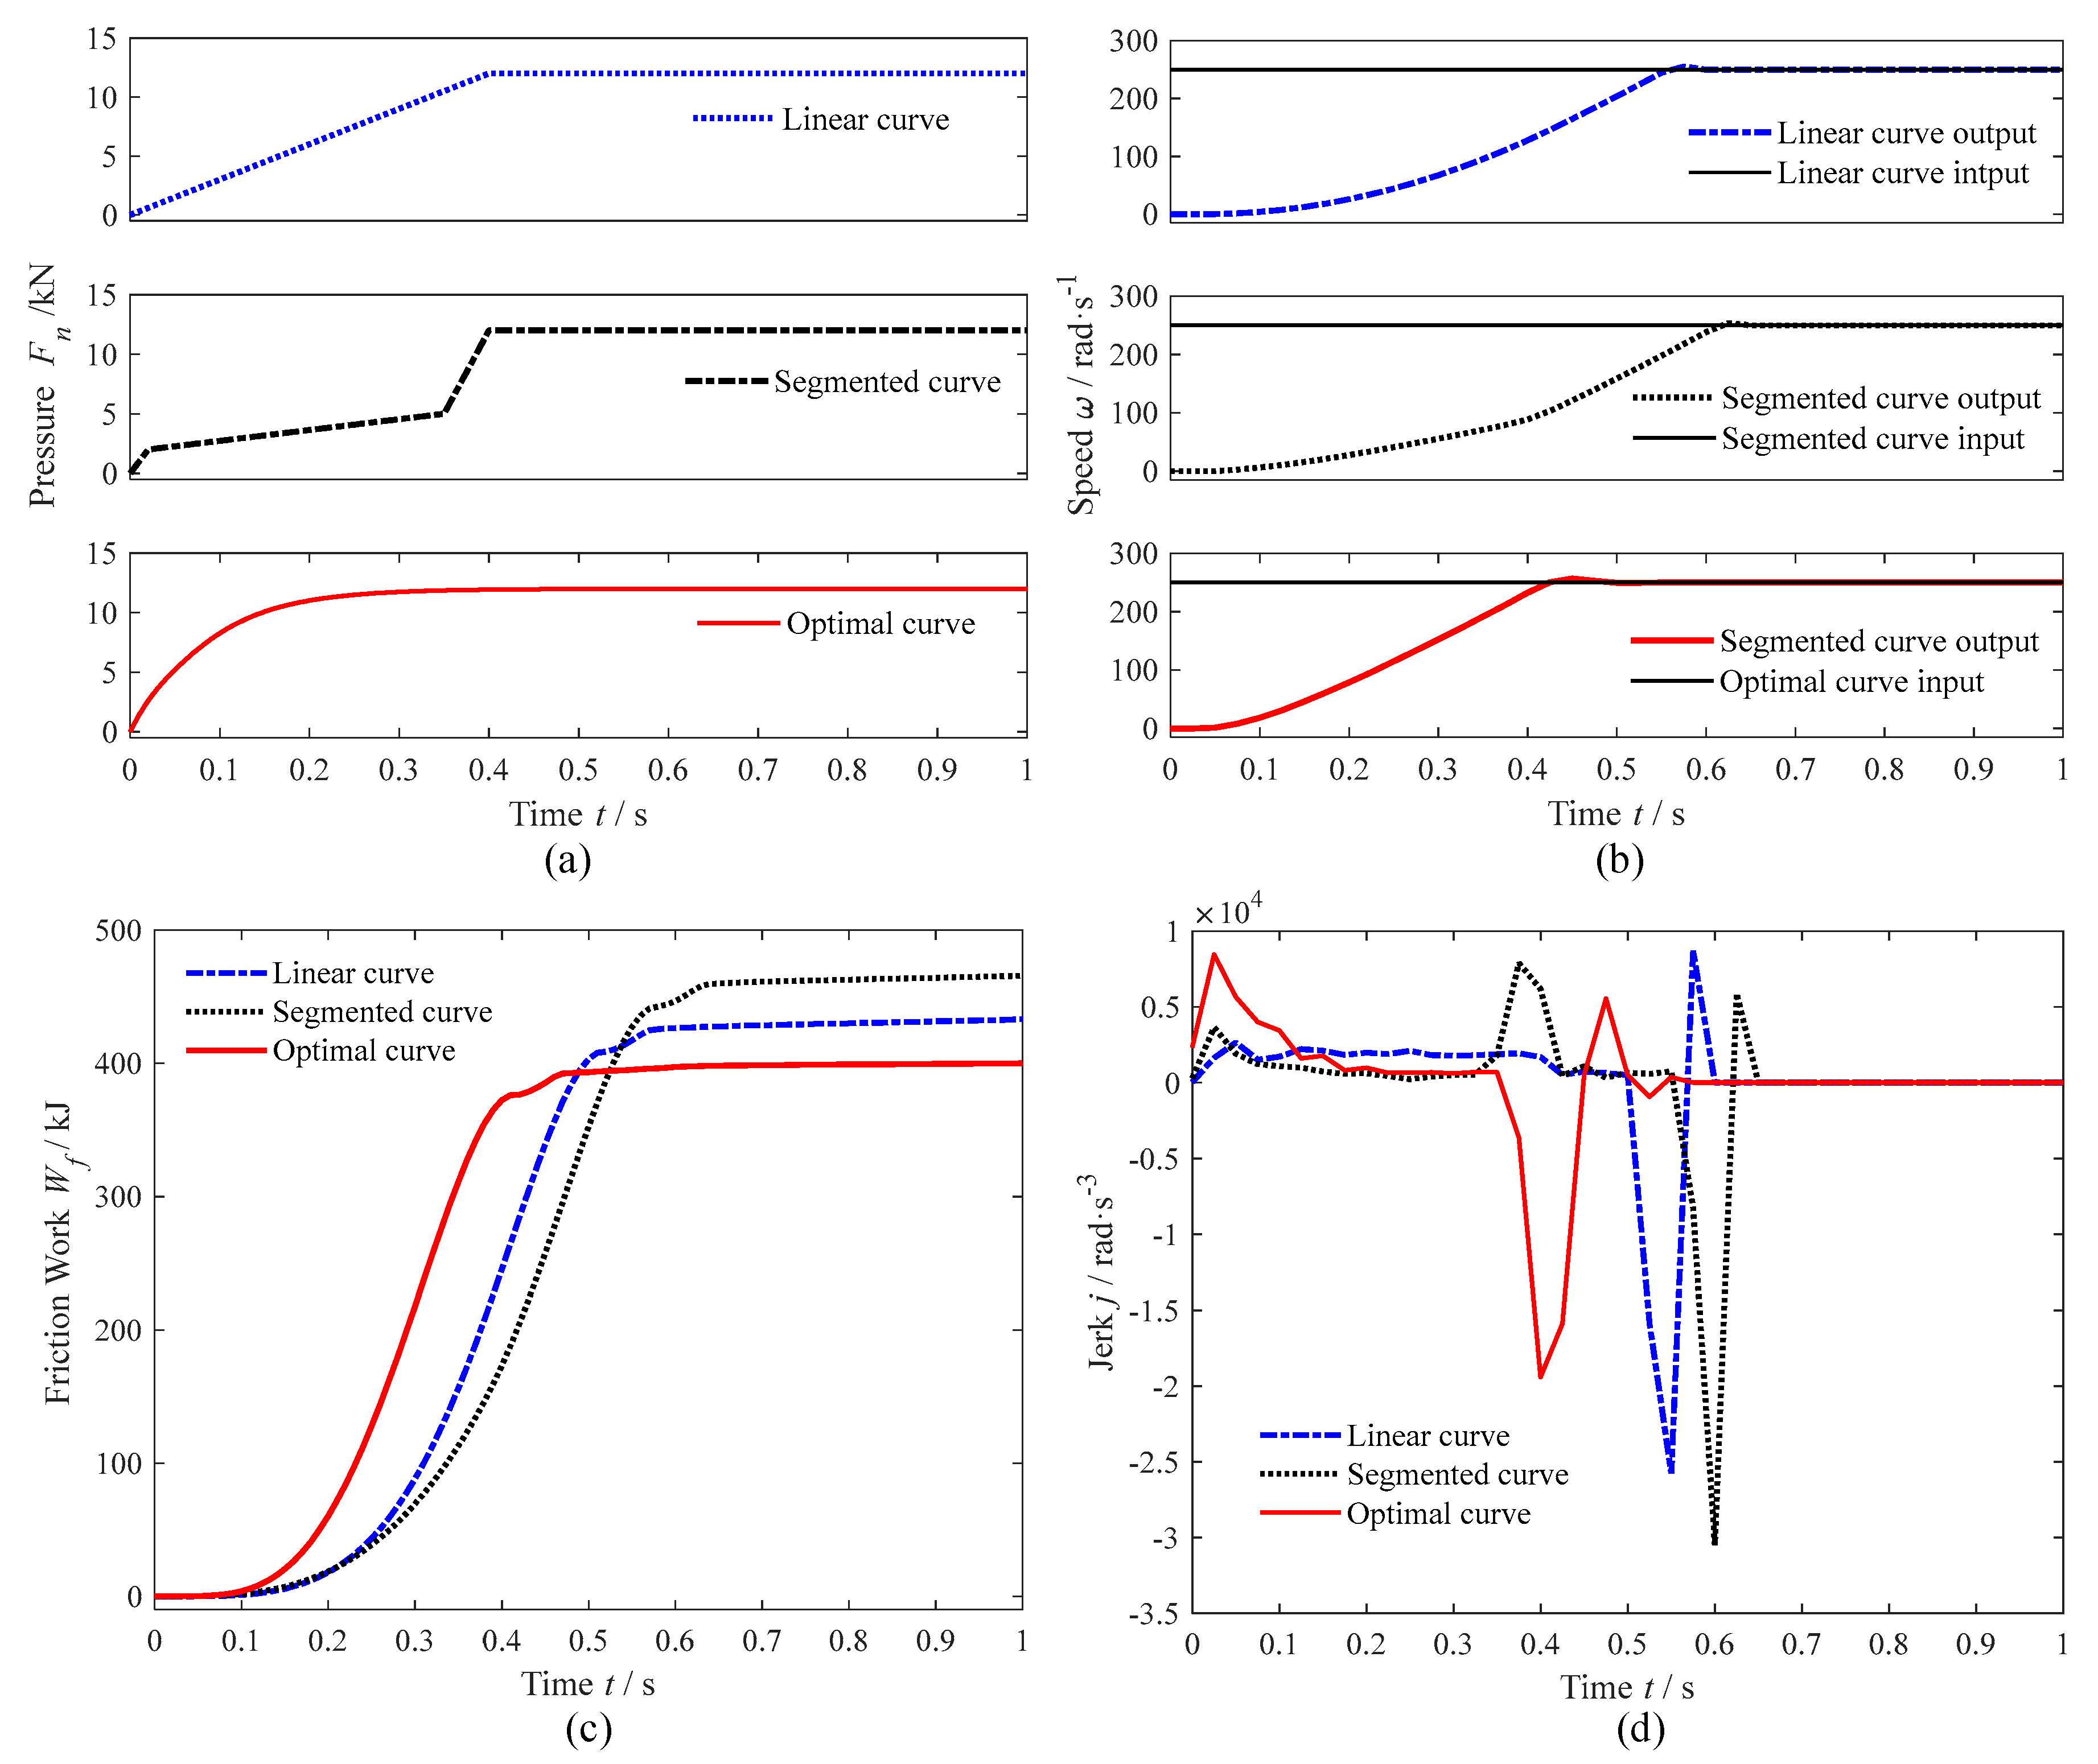
3.1. Comparative Analysis for the Optimal Pressure Curve

According to existing studies, the pressure curves are usually linearly loaded or loaded in segments [9]. The results of the optimal pressure curve with linear and segmented loading curves are compared and analyzed in this paper. Linear and segmented loading curves are set to reach maximum pressure after 400 ms, as shown in Figure 6a.
Under pressure curve loading, the input and output speed curves of the helicopter dry clutch are shown in Figure 6b. Under optimal pressure curve loading, the clutch engagement duration is 24% faster than that of the linear pressure curve and 30.9% faster than that of the segmented loading curve. Compared with conventional pressure curve loading methods, the optimal curve loading method results in a shorter engagement duration.
The friction work generated during the engagement process is shown in Figure 6c. Under optimal-pressure curve loading, the friction work generated during the clutch engagement process is 7.9% less than that of the linear loading method and 14.5% less than that of the segmented loading method. The jerk generated during the engagement process is shown in Figure 6d. Under the optimal curve, the maximum jerk generated by the dry clutch is 24.7% lower than that of the linear loading method and 36.4% lower than that of the segmented loading method. Therefore, compared with conventional pressure loading methods, the optimal pressure curve loading results in a shorter engagement duration, less friction work, and less jerk. Thus, the optimal curve solving method designed in this paper has an optimization effect when comprehensively evaluated in terms of engagement duration, friction work, and jerk.

3.2. Simulation Result Analysis

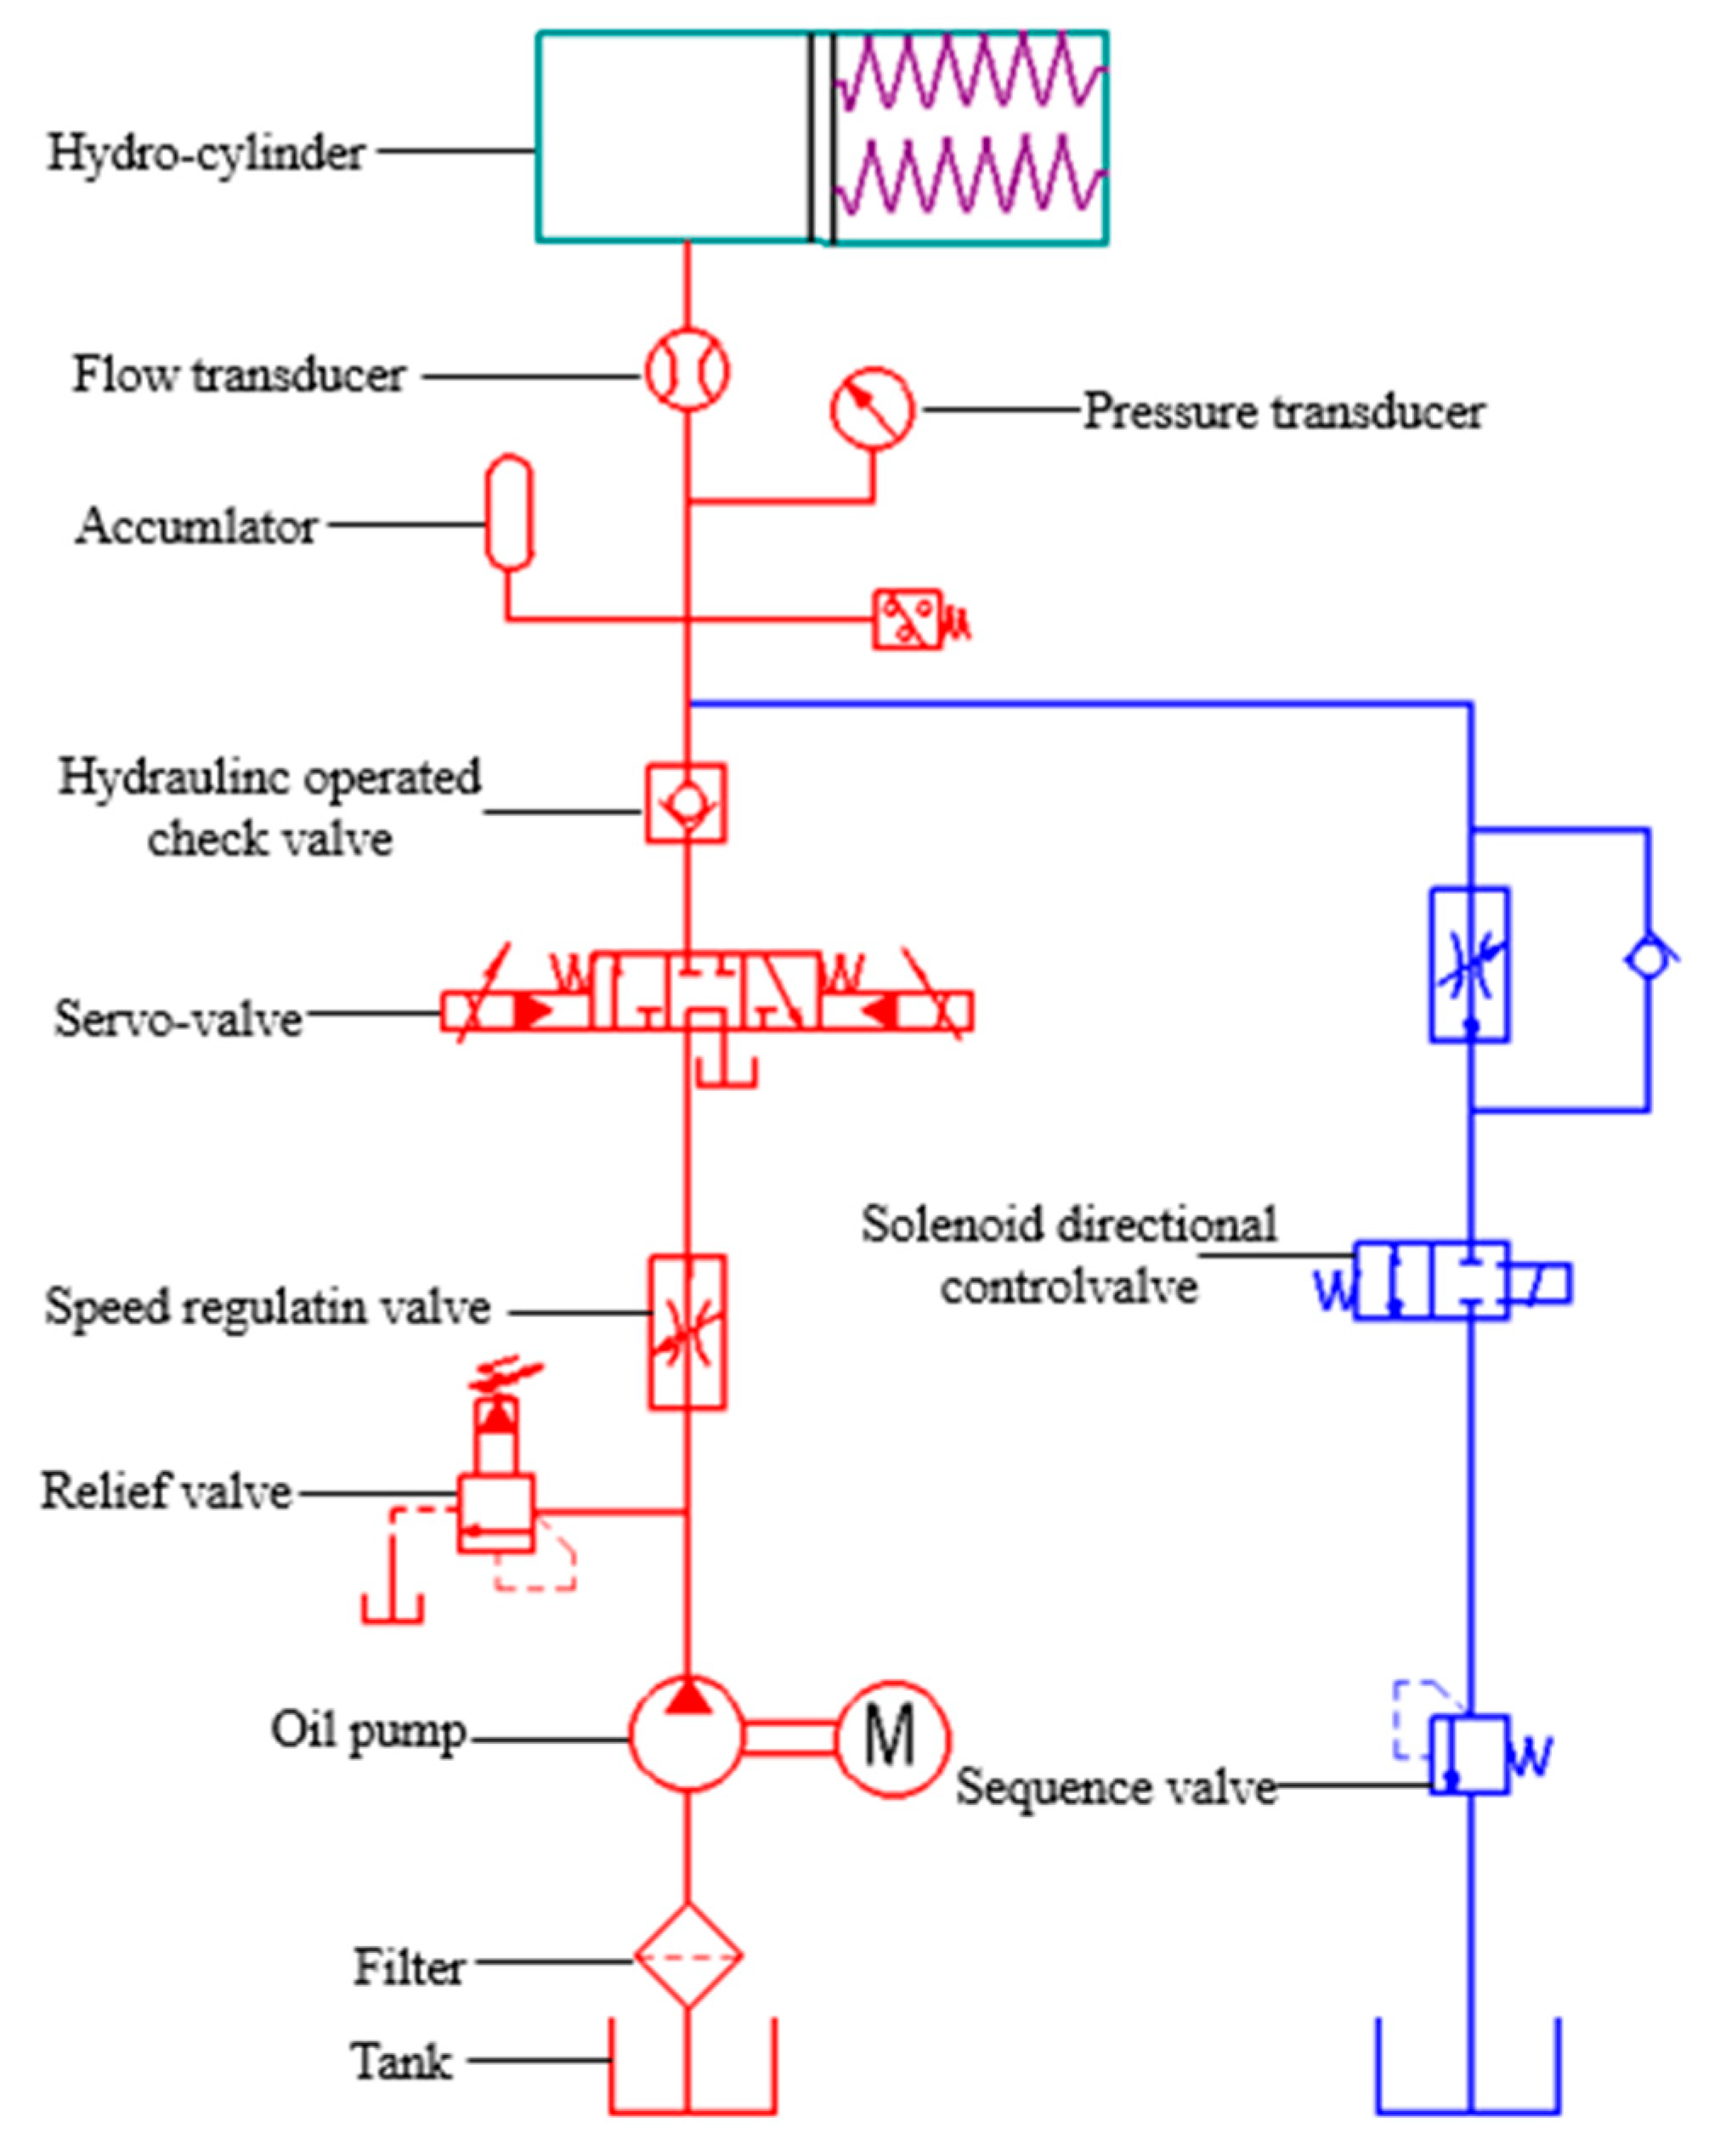
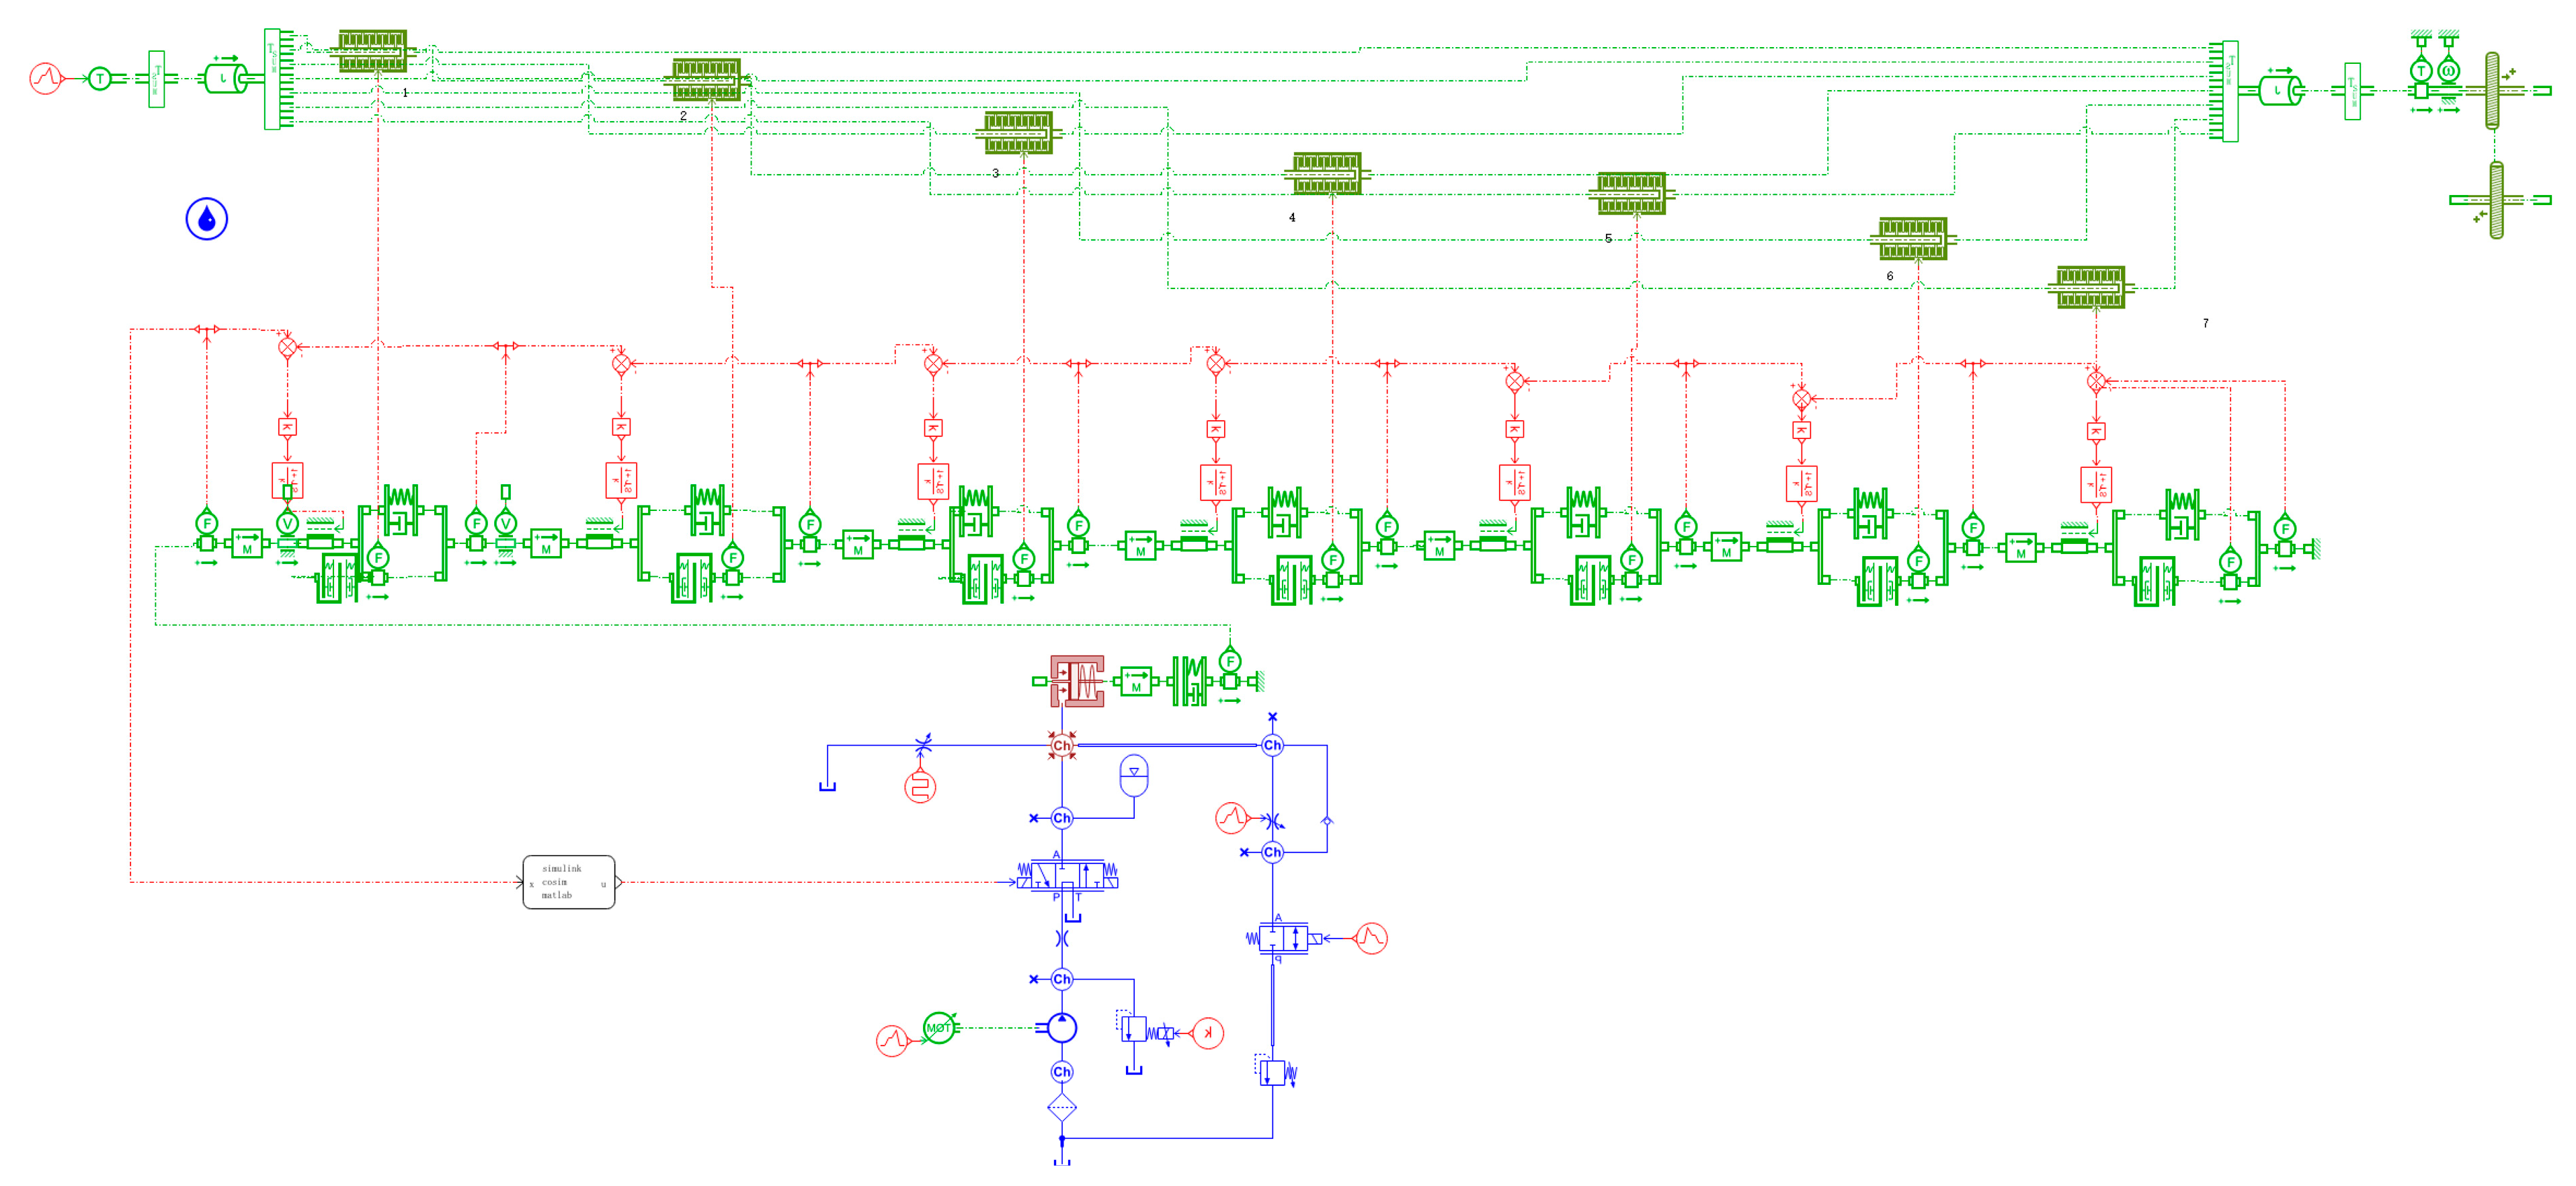
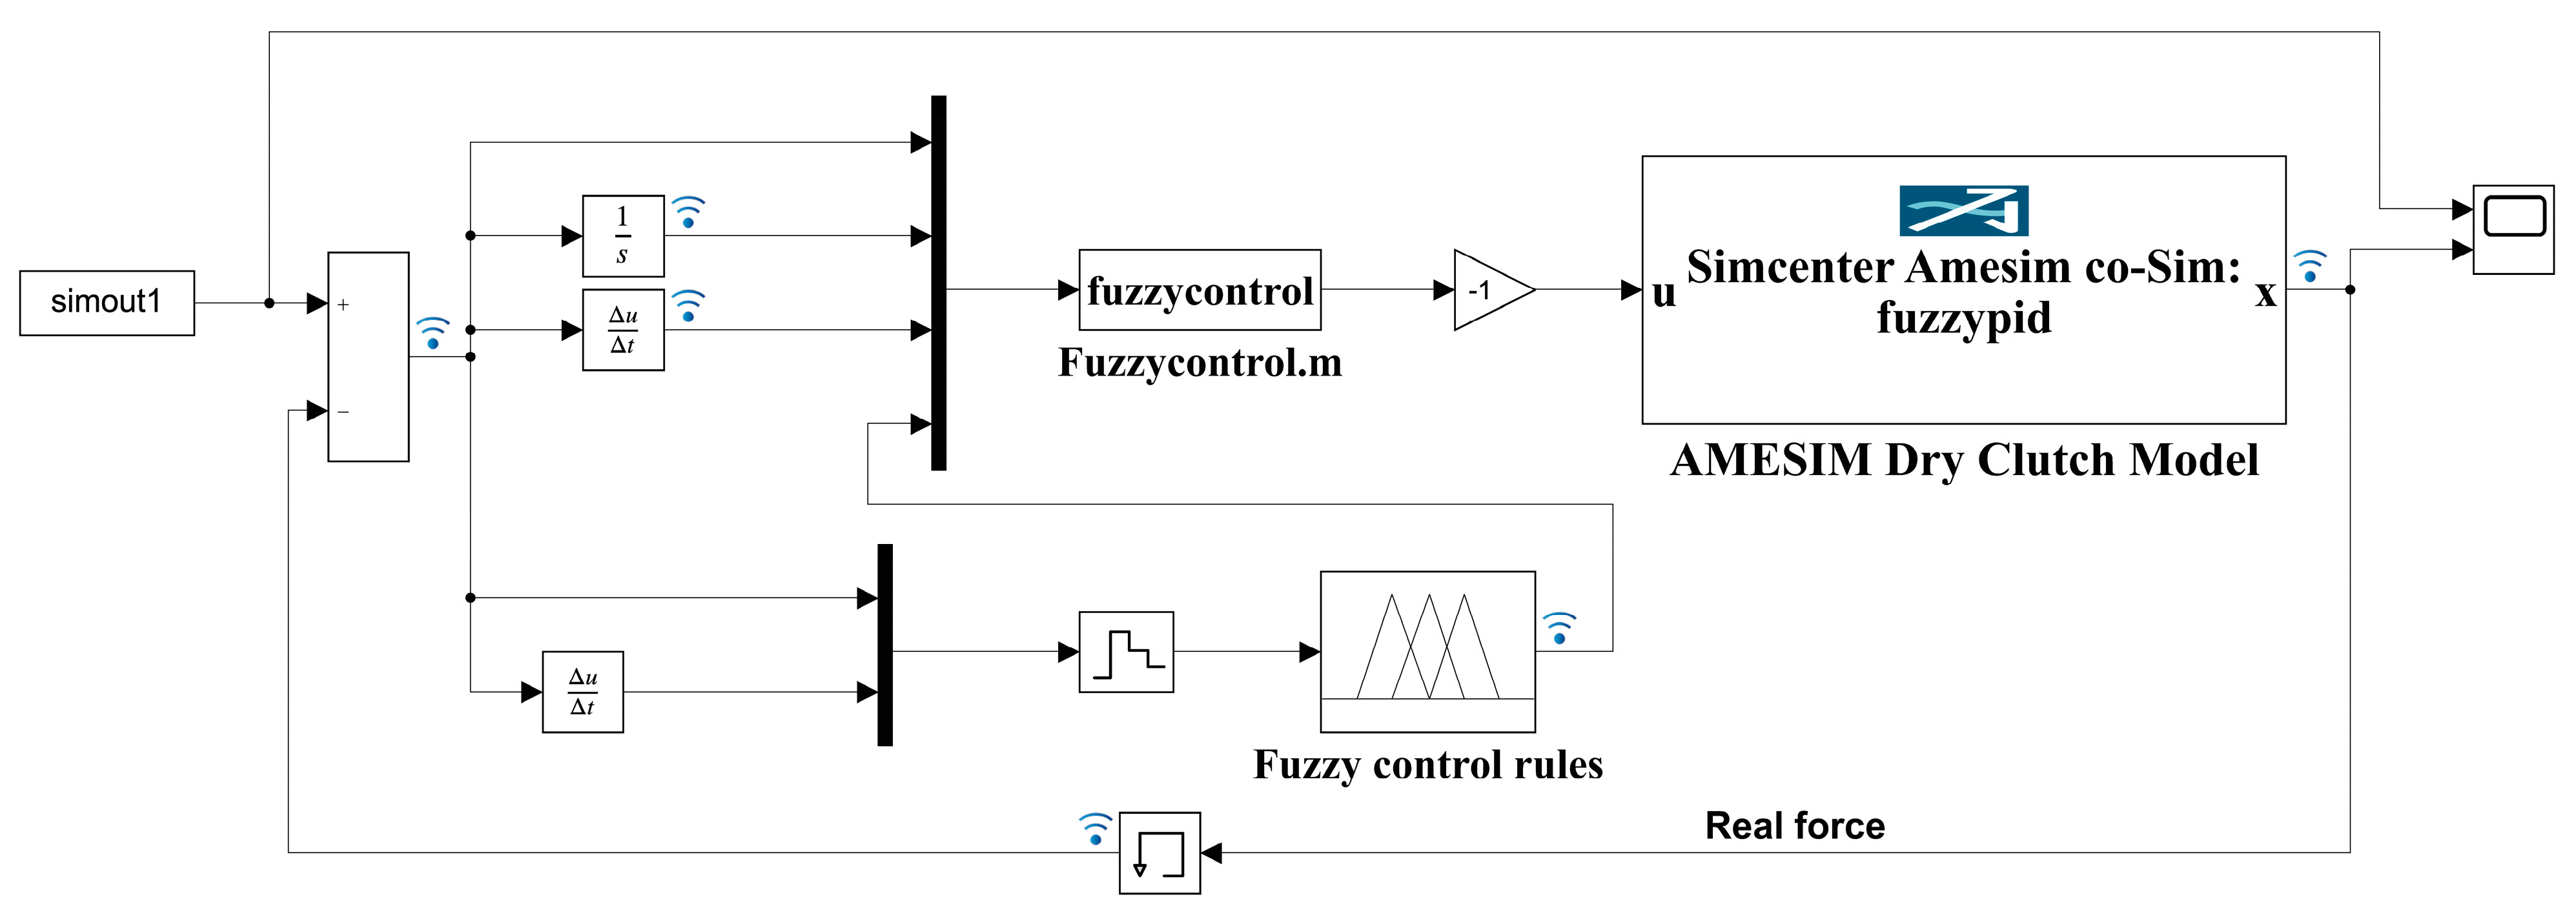
3.2.1. Simulation Model

A hydraulic actuator to achieve target pressure curve tracking is designed in this paper. Through the hydraulic actuator, the pressure curve is loaded for the dry clutch to achieve engagement and locking. At the same time, it is necessary to ensure closed-loop control of the engagement pressure curve during the engagement processes, with pressure errors controlled within the range of ±1000 N. The designed hydraulic actuator structure is shown in Figure 7. The main parameters of the hydraulic actuator are shown in Table 2.
In this paper, the hydraulic control system of the dry clutch is built using the hydraulic module, mechanical module, and signal module in the AMEsim simulation platform. According to the hydraulic schematic diagram of the dry clutch in Figure 7 and simulation parameters in Table 2, a hydraulic control system for the dry clutch is built based on the hydraulic module and signal module. As shown in Figure 8, the input–output transmission system simulation model of the dry clutch is built based on the mechanical module in AMEsim [18,19].
This paper first manually tunes the PID parameters; P, I, and D are assigned values of 0.001, 0.0025, and 0.00001, respectively. The pressure deviation E and its rate of change EC are determined as inputs. Kp, Ki, and Kd are determined as outputs. A fuzzy PID controller structure with two inputs and three outputs is constructed 19. The fuzzy controller input fuzzy sets are defined as five fuzzy subsets: {NB, NS, Z, PS, PB}. The domain for pressure deviation E is defined as [0, 5000], and the rate of change of pressure deviation EC is defined as [ 1 × 10 5 , 4 × 10 5 ]. The domains for adjusting P, I and D, Kp, Ki, and Kd are defined as [−0.0003, 0.0005], [−0.0005, 0.001], and [ 2 × 10 7 , 3 × 10 6 ]. Fuzzy control rules are inputted into the fuzzy controller in Matlab 2020a, which results in fuzzy rule cloud diagrams for the two-input, three-output configuration, as shown in Figure 9 [20].
As shown in Figure 10, a fuzzy PID controller is constructed using Matlab/Simulink to achieve closed-loop control of the output force of the hydraulic cylinder 20. By comparing the actual force measured from the force sensor with the target force curve, the fuzzy PID controller corrects and adjusts the output current signal of the electromagnetic directional valve to adjust the actual force of the hydraulic cylinder, thereby achieving the goal of force curve tracking.

3.2.2. Analysis of Optimizing Curve Tracking Effect

The simulation model of the hydraulic system control of the dry clutch designed in this paper is used to control and track the optimal pressure curve, linear pressure curve, and segmented pressure curve. The tracking results are shown in Figure 11a. The tracking errors of the three pressure curves are shown in Figure 12b. Due to the hydraulic system’s requirement of nearly 0.1 s for the response time and the lag in system response, the actual curves cannot follow the target curve within 0 to 0.1 s. After the system responds, the tracking errors of the linear pressure curve, the optimal pressure curve, and the segmented pressure curve are controlled within the range of ±1000 N, exhibiting an excellent tracking performance. Compared with the linear and optimal pressure curves, the segmented pressure curve experiences a sudden change in pressure rate at 0.35 s, leading to a short-term pressure overshoot due to the system’s inability to respond quickly, resulting in a weaker tracking capability. In conclusion, the optimal pressure curve designed in this paper demonstrates an excellent tracking performance and is both trackable and implementable.

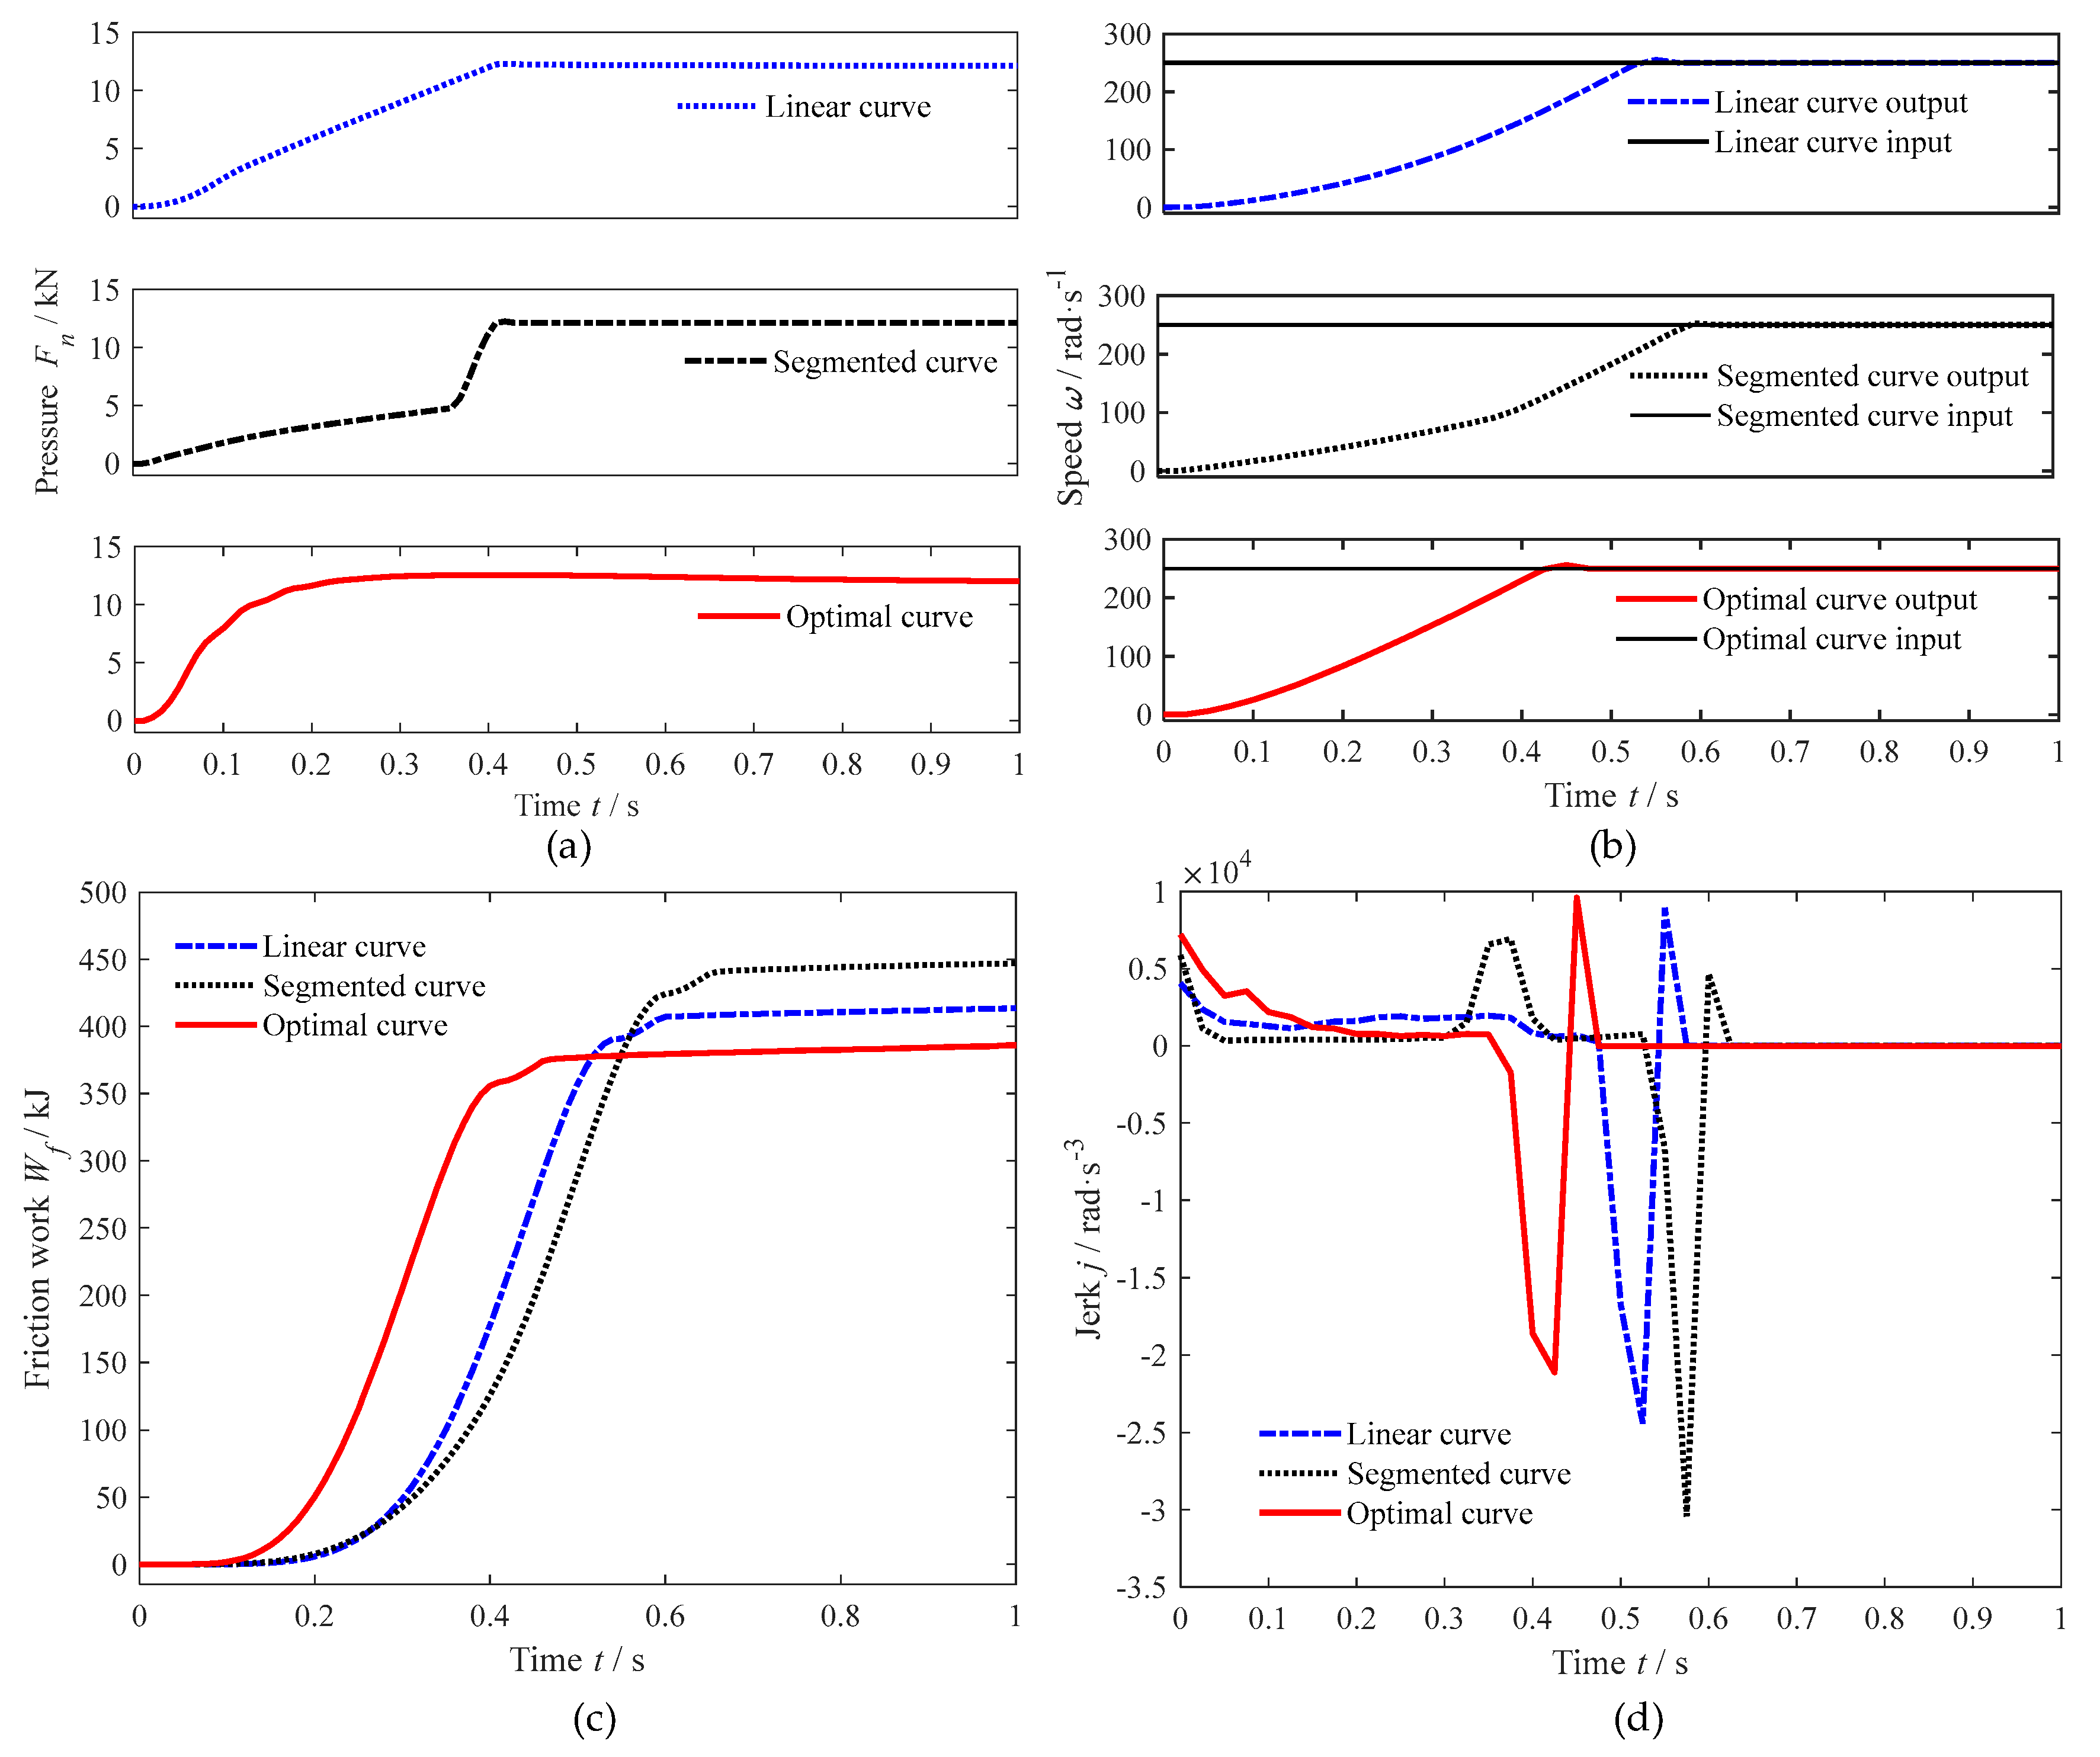
3.2.3. Comparative Analysis for Simulation Optimal Curve

The actual pressure curves obtained from the hydraulic actuator simulation model are depicted in Figure 12a. Under the three actual pressure curves loading, the simulation results of the output speed of the dry clutch are shown in Figure 12b. Under actual optimal curve loading, the dry clutch engagement duration is 19.6% faster than that of the linear loading method and 27.7% faster than that of the segmented loading method. Thus, under the optimal pressure curve loading method, the engagement duration of the dry clutch is shorter.
The friction work generated during the dry clutch engagement is shown in Figure 12c. Under the actual optimal curve, the friction work generated by the friction sliding is 7.68% lower than that of the linear loading method and 14.7% lower than that of the segmented loading method. Thus, under the optimal pressure curve loading method, the friction work generated by the friction sliding is lower. The jerk generated during the engagement process of the dry clutch is shown in Figure 12d. Under the actual optimal curve, the maximum jerk in the dry clutch engagement is 13.4% lower than that of the linear loading method and 30.5% lower than that of the segmented loading method.
After the designed hydraulic actuator loads the three curves, the optimal pressure curve still results in excellent engagement quality. The engagement duration of the dry clutch is still shorter, the friction heat generation is still smaller, and the engagement process is still smoother. Therefore, the designed optimal pressure curve has excellent tracking performance.

4. Conclusions

The helicopter dry clutch engagement pressure loading strategy is investigated in this paper, and the main conclusions are drawn as follows:
(1) In this paper, a strategy is proposed for solving the high-speed helicopter clutch loading pressure problem based on the interaction feedback between the nonlinear input–output dynamic model of the helicopter dry clutch and the LQR solver, while ensuring the engagement quality of the clutch in helicopter dry clutches. This method achieves the mathematical modeling and solving of the engagement pressure while ensuring helicopter dry clutch engagement quality. This method not only reduces the trial-and-error times in pressure loading but also improves the efficiency of pressure curve solving.
(2) In this paper, a hydraulic actuation system for helicopter dry clutch loading pressure is designed, employing a closed-loop control method based on fuzzy PID. The simulation results demonstrate that the optimal pressure curve exhibits excellent tracking performance and practical applicability.
(3) The engagement quality is compared and analyzed for the optimal pressure curve, conventional linear pressure curve, and segmented pressure curve. The results indicate that under optimal pressure curve loading, the engagement duration is 19.6% faster than that of linear loading and 27.7% faster than that of segmented loading. The friction work is 7.68% lower than linear loading and 14.7% lower than segmented loading. The maximum jerk is 13.4% lower than linear loading and 30.5% lower than segmented loading.
In conclusion, compared with conventional pressure loading methods, the method proposed in this paper can effectively reduce the engagement duration, friction work, and jerk generated during the engagement process and improve the engagement quality of the helicopter dry clutch.

Author Contributions

Conceptualization, Y.X.; methodology, Y.X. and Q.L.; software, Y.X.; validation, Y.X. and Q.L.; formal analysis, Y.X.; investigation, Y.X.; resources, Q.L.; data curation, Y.X.; writing—original draft preparation, Y.X. and Q.L.; writing—review and editing, Y.X., Q.L. and H.L.; visualization, Y.X. and H.L.; supervision, Q.L.; project administration, Q.L. All authors have read and agreed to the published version of the manuscript.

Funding

This research received no external funding.

Data Availability Statement

The original contributions presented in the study are included in the article.

Conflicts of Interest

The authors declare no conflict of interest.

References

  1. Qiu, Y.Q.; Li, Y.; Lang, J.X.; Wang, Z. Dynamics analysis and control of coaxial high-speed helicopter in transition flight. Aerosp. Sci. Technol. 2023, 137, 108278. [Google Scholar] [CrossRef]
  2. Vu, T.M.; Moezzi, R.; Cyrus, J.; Hlava, J.; Petru, M. Automatic clutch engagement control for parallel hybrid electric vehicle. Energies 2021, 14, 7256. [Google Scholar] [CrossRef]
  3. Gao, Q.; Liu, H.Y.; Niu, M.Y. Characteristics analysis and nonlinear control of a digital hydraulic pressure tracking system for high-speed helicopter wet friction clutch. Trans. Can. Soc. Mech. Eng. 2024, e-First. [Google Scholar] [CrossRef]
  4. Tan, W.Z.; Chen, Z.; Li, Z.Z.; Yan, H.Z. Thermal-Fluid-Solid Coupling Simulation and Oil Groove Structure Optimization of Wet Friction Clutch for High-Speed Helicopter. Machines 2023, 11, 296. [Google Scholar] [CrossRef]
  5. Van Der Heijden, A.C.; Serrarens, A.F.A.; Camlibel, M.K.; Nijmeijer, H. Hybrid optimal control of dry clutch engagement. Int. J. Control 2007, 80, 1717–1728. [Google Scholar] [CrossRef]
  6. Jin, T.T.; Li, P.K.; Zhu, G.Z. Optimal decoupled control for dry clutch engagement. In Proceedings of the 2013 American Control Conference, Washington, DC, USA, 17–19 June 2013. [Google Scholar]
  7. Van Berkel, K.; Hofman, T.; Serrarens, A.; Steinbuch, M. Fast and smooth clutch engagement control for dual-clutch transmissions. Control Eng. Pract. 2014, 22, 57–68. [Google Scholar] [CrossRef]
  8. Li, L.; Zhu, Z.B.; Chen, Y.; He, K.; Li, X.; Wang, X.Y. Engagement control of automated clutch for vehicle launching considering the instantaneous changes of driver’s intention. J. Dyn. Syst. Meas. Control 2017, 139, 021011. [Google Scholar] [CrossRef]
  9. Zhu, C.; Chen, Z.; Shi, Z.C.; Zhang, Y.D. Study on the Engagement Characteristics and Control Strategy of High Speed Difference Dry Friction Clutch. Machines 2023, 11, 407. [Google Scholar] [CrossRef]
  10. Park, J.; Choi, S.; Oh, J.; Eo, J. Adaptive torque tracking control during slip engagement of a dry clutch in vehicle powertrain. Mech. Mach. Theory 2019, 134, 249–266. [Google Scholar] [CrossRef]
  11. Mesmer, F.; Szabo, T.; Graichen, K. Feedforward control of a hydraulic clutch actuation path. In Proceedings of the 2019 18th European Control Conference (ECC), Naples, Italy, 25–28 June 2019. [Google Scholar]
  12. Bao, H.Y.; Xu, T.J.; Jin, G.H.; Huang, W. Analysis of dynamic engaged characteristics of wet clutch in variable speed transmission of a helicopter. Processes 2020, 11, 1474. [Google Scholar] [CrossRef]
  13. Ompusunggu, A.P.; Sas, P.; Van Brussel, H. Modeling and simulation of the engagement dynamics of a wet friction clutch system subjected to degradation. An application to condition monitoring and prognostics. Mechatronics 2013, 23, 700–712. [Google Scholar] [CrossRef]
  14. Li, A.; Qin, D. Adaptive model predictive control of dual clutch transmission shift based on dynamic friction coefficient estimation. Mech. Mach. Theory 2022, 173, 104804. [Google Scholar] [CrossRef]
  15. Zhao, Z.G.; Lei, D.; Chen, J.Y.; Li, H.Y. Optimal control of mode transition for four-wheel-drive hybrid electric vehicle with dry dual-clutch transmission. Mech. Syst. Signal Process 2018, 105, 68–89. [Google Scholar] [CrossRef]
  16. Mohsen Khosravi, H.; Azarinfar, K.S. Design of infinite horizon LQR controller for discrete delay systems in satellite orbit control: A predictive controller and reduction method approach. Heliyon 2024, 10, 24265. [Google Scholar] [CrossRef] [PubMed]
  17. Zhou, S.; Wu, J.; Zhang, Y. Optimal Shift Control of Dual Clutch Transmission in Electric Vehicles Based on Linear Quadratic Regulator. SAE Int. J. Adv. Curr. Pract. Mobil. 2023, 6, 418–428. [Google Scholar]
  18. Wang, Y.; Shi, H.; Rong, X.; Jiang, D. Adaptive Pressure Control of the Clutch Hydraulic Actuator in Wet Dual Clutch Transmission based on TS Fuzzy Model and Extended State Observer. IEEE Access 2023, 1, 129090–129099. [Google Scholar] [CrossRef]
  19. Mallette, G.; Gauthier, C.E.; Hemmatian, M.; Denis, J.; Plante, J.-S. Design and Experimental Assessment of a Vibration Control System Driven by Low Inertia Hydrostatic Magnetorheological Actuators for Heavy Equipment. Actuators 2023, 12, 407. [Google Scholar] [CrossRef]
  20. Jin, X.; Chen, K.K.; Zhao, Y.; Ji, J.T.; Jing, P. Simulation of hydraulic transplanting robot control system based on fuzzy PID controller. Measurement 2020, 164, 108023. [Google Scholar] [CrossRef]
Figure 1. Schematic diagram of dry clutch structure.
Machines 12 00533 g001
Figure 2. Simplified model of input–output dynamics of dry clutch.
Machines 12 00533 g002
Figure 3. Block diagram of optimal pressure curve controller design.
Machines 12 00533 g003
Figure 4. Pressure curve results from different Q1/Q2.
Machines 12 00533 g004
Figure 5. Results related to the solution of the optimal pressure curve: (a) state feedback gain curves for K1, K2, and K3 variations; (b) the optimal pressure curve.
Machines 12 00533 g005
Figure 6. Comparison simulation results between the ideal optimal pressure curve and conventional pressure curves: (a) pressure curves; (b) input and output speed; (c) friction work; (d) jerk.
Machines 12 00533 g006
Figure 7. Schematic diagram of hydraulic actuation system for dry clutch.
Machines 12 00533 g007
Figure 8. Simulation model of the hydraulic system for dry clutch.
Machines 12 00533 g008
Figure 9. Fuzzy rule cloud diagrams for the two-input, three-output configuration.
Machines 12 00533 g009
Figure 10. Fuzzy PID controller constructed on Matlab/Simulink.
Machines 12 00533 g010
Figure 11. Tracking results for three different pressure curves: (a) tracking curves; (b) error.
Machines 12 00533 g011
Figure 12. Comparison simulation results for the actual optimal pressure curve and conventional pressure curves: (a) pressure curves; (b) input and output speed; (c) friction work; (d) jerk.
Machines 12 00533 g012
Table 1. Parameters of the input–output dynamic model of a helicopter dry clutch.
DescriptionSymbolValue
Input torque / N · m Ti955
Load torque / N · m Tu100
Input equivalent moment of inertia / k g m 2 Ii2
Output equivalent moment of inertia / k g m 2 Iu1
Input equivalent damping coefficient / N m · s r a d 1 bi 1.2 × 10 4
Output equivalent damping coefficient / N m · s r a d 1 bv 1 × 10 4
Coulomb friction coefficient μ 1 0.08
Static friction coefficient μ 2 0.12
Empirical constants of the friction model v s 7.64065
Empirical exponential constant of the friction model σ 5.7048 × 10 4
Rotor plate outer diameter/mr10.1
Rotor plate inner diameter/mr20.05
Torque transmission efficiency η 0.85
Number of clutch contact surfaces N 4
Table 2. Main parameters of the hydraulic system for the dry clutch.
ParameterValueParameterValue
Hydraulic cylinder outer diameter/mm200Maximum system pressure/MPa3
Hydraulic cylinder inner diameter/mm30Maximum system flow rate / L · m i n 1 2.5
Disclaimer/Publisher’s Note: The statements, opinions and data contained in all publications are solely those of the individual author(s) and contributor(s) and not of MDPI and/or the editor(s). MDPI and/or the editor(s) disclaim responsibility for any injury to people or property resulting from any ideas, methods, instructions or products referred to in the content.

