Article

Numerical Study of Solid–Gas Two-Phase Flow and Erosion Distribution in Glass Fiber-Reinforced Polymer Ball Valves

1
School of Mechanical and Electrical Engineering, Wuhan Institute of Technology, Wuhan 430205, China
2
Hubei Provincial Engineering Technology Research Center of Green Chemical Equipment, Wuhan Institute of Technology, Wuhan 430205, China
*
Author to whom correspondence should be addressed.
Machines 2024, 12(8), 541; https://doi.org/10.3390/machines12080541
Submission received: 24 June 2024 / Revised: 31 July 2024 / Accepted: 31 July 2024 / Published: 7 August 2024
(This article belongs to the Section Machine Design and Theory)

Abstract

:
The use of glass fiber-reinforced polymer (GFRP) composites in fluid transport systems can effectively reduce corrosion damage caused by corrosive media. However, collisions between solid particles and the surfaces of ball valve flow passages can cause erosion damage and lead to safety issues. The two-phase flow and erosion characteristics of ball valves manufactured from resin-based fiber-reinforced composite materials were studied under different openings and particle sizes using the CFD-DPM method. The results indicate that both smaller and larger relative openings are prone to erosion damage at the thin edges of the valve ball. As the relative opening increases, the average erosion amount in the flow passage first increases and then decreases. The maximum average erosion amount is 0.0051 kg/m2·s when the relative opening is Cv = 40. At Cv = 40, erosion damage in the flow channel mainly occurs at the bottom of the inlet flow channel and the valve seat position. With increasing particle size, both the average and maximum erosion amounts in the flow channel increase. Larger particle sizes in the inlet flow channel significantly raise the erosion rate nearby, while at other locations, larger particle sizes mainly increase the erosion rate in the same area. During the use of GFRP valves, it is important to avoid introducing large-sized particles into the medium. Keeping the valve’s relative opening greater than 40 and using more erosion-resistant materials for the valve seat can effectively reduce the erosion of the composite ball valve and extend its service life.

1. Introduction

In the realm of energy and chemicals, pipeline transport has emerged as the most efficient, reliable, and economical method, thereby becoming the most widely utilized means of transportation. The ball valve serves as a critical component in pipelines, tasked with functions including fluid cutoff, distribution, and alteration. It offers numerous advantages, including low fluid resistance, swift and convenient switching, prolonged service life, and outstanding reliability [1,2,3]. When transporting certain specialized fluid media, there is a risk of issues such as sealing failure, leakage, and safety hazards. These concerns stem from both the corrosive properties of the medium and the impact and friction generated by solid particles present within the conveyed fluid. The two primary causes of concern in the hydrotransport of solids through pipelines are frictional pressure drop and wall degradation due to erosion [4]. Higher friction can lead to turbulence in the fluid. This turbulence can intensify the erosive effects of suspended particles or fluids carrying abrasive materials, leading to increased erosion of the passage walls [5].These challenges can significantly compromise the stability and reliability of the pipeline system [6,7,8,9]. Erosion and corrosion pose significant threats to the integrity of pipes and valves, leading to substantial damage to their inner walls [9,10]. Moreover, the synergistic effects of erosion–corrosion interactions can exacerbate this damage, resulting in even more severe consequences [11,12].
A variety of engineering methods have been employed to mitigate damage to ball valves and reduce losses. Numerous techniques have been utilized to safeguard structures against corrosion, including the use of corrosion inhibitors [13], cathodic and anodic protection [14], and protective coatings [15], as well as, notably, the selection of materials with higher corrosion resistance.
Material selection is important in the mechanical design of industrial components such as piping and valves [16]. The application of low-alloy steel [17], Teflon [18], epoxy [15], and other corrosion-resistant materials can effectively reduce corrosion damage.
Resin matrix fiber-reinforced composites represent a category of high-performance materials comprising resin as the matrix and fiber as the reinforcing material, processed through various molding techniques [19,20,21]. Compared to traditional metallic materials, fiber-reinforced polymer composites (FRP) demonstrate superior characteristics, including higher specific strength and specific stiffness. Additionally, they exhibit increased resistance to acid–base corrosion while being significantly lighter in mass at the same volume [22,23,24,25,26]. The use of FRP materials to manufacture pipes and related components can effectively reduce the loss caused by corrosion.
Many scholars have carried out theoretical and experimental analyses to study the law of erosion wear in valve and pipeline systems. Suitable material selection can effectively reduce erosion damage [27]. Solid particle diameter [28], particle density [29], inlet pressure [30], flow passage structure [31], velocity distribution, and other factors also have significant effects on the wall erosion of the flow passage.
A variety of simulation algorithms are also applied to the wear analysis of ball valves. The CFD-DEM simulation method has been used to study the gas–solid two-phase flow characteristics and erosion characteristics of the gate valve, and the results indicate that the number of particles plays an important role in erosion [28]. A coupling computational fluid dynamics model combining multiphase, cavitation, and discrete phase models was built to simulate the cavitation erosion and particle erosion [30]. The results indicate that an increase in inlet pressure, maximum velocity, mass flow rate, wall shear stress, turbulence intensity, and particle erosion occurs. Conversely, a decrease in the valve opening angle leads to reductions in mass flow rate, wall shear stress, turbulence intensity, and particle erosion.
Based on user-defined function (UDF) and moving mesh technology, an unsteady numerical simulation was performed during the ball valve opening and closing process [32]. The variations in the flow rate, outlet pressure, pressure drop, and flow resistance coefficient of a ball valve with a relative opening have obvious differences across the opening and closing process. As the opening and closing process progresses, the delay in the change of the flow rate response to the relative opening diminishes. Cao [33] used the Euler–Lagrange model to numerically simulate the gas–solid flow in the governing valve. As the valve opening decreases, the erosion rate density increases. The main factor affecting solid particle erosion is different over the course of the valve opening process.
Liu [34] used a discrete phase model (DPM) to analyze erosion failure. The migration route of the severe erosion region of a hydraulic spool valve without notches was obtained and the mechanism of local erosion was revealed. Zheng [6] used the Euler-Euler method combined with the Oka erosion model to simulate a compressible gas flow laden with particles. The erosion rate presents a decreasing trend with increasing operation pressure due to the gas compressibility.
As is evident from the aforementioned study, the erosion conditions within valves have emerged as a critical aspect of valve research. Studying the erosion mechanisms and phenomena occurring in valves and pipelines can offer valuable insights for optimizing structural design. This is crucial for prolonging the service life of ball valves and ensuring the stability and reliability of pipeline transmission systems.
The valve, made of resin-based fiber-reinforced composite, can effectively reduce the corrosion damage to the valve caused by the medium, but the resistance to erosion is weak. In this study, a particle erosion calculation model was established to simulate the solid–gas flow inside a GFRP ball valve under varying conditions of relative openings and particle diameters. The erosion distribution in ball valve flow passages under different conditions was analyzed, providing valuable insights for the optimization of structures and the design of erosion-resistant ball valves.

2. Physical Model and Numerical Simulation Method

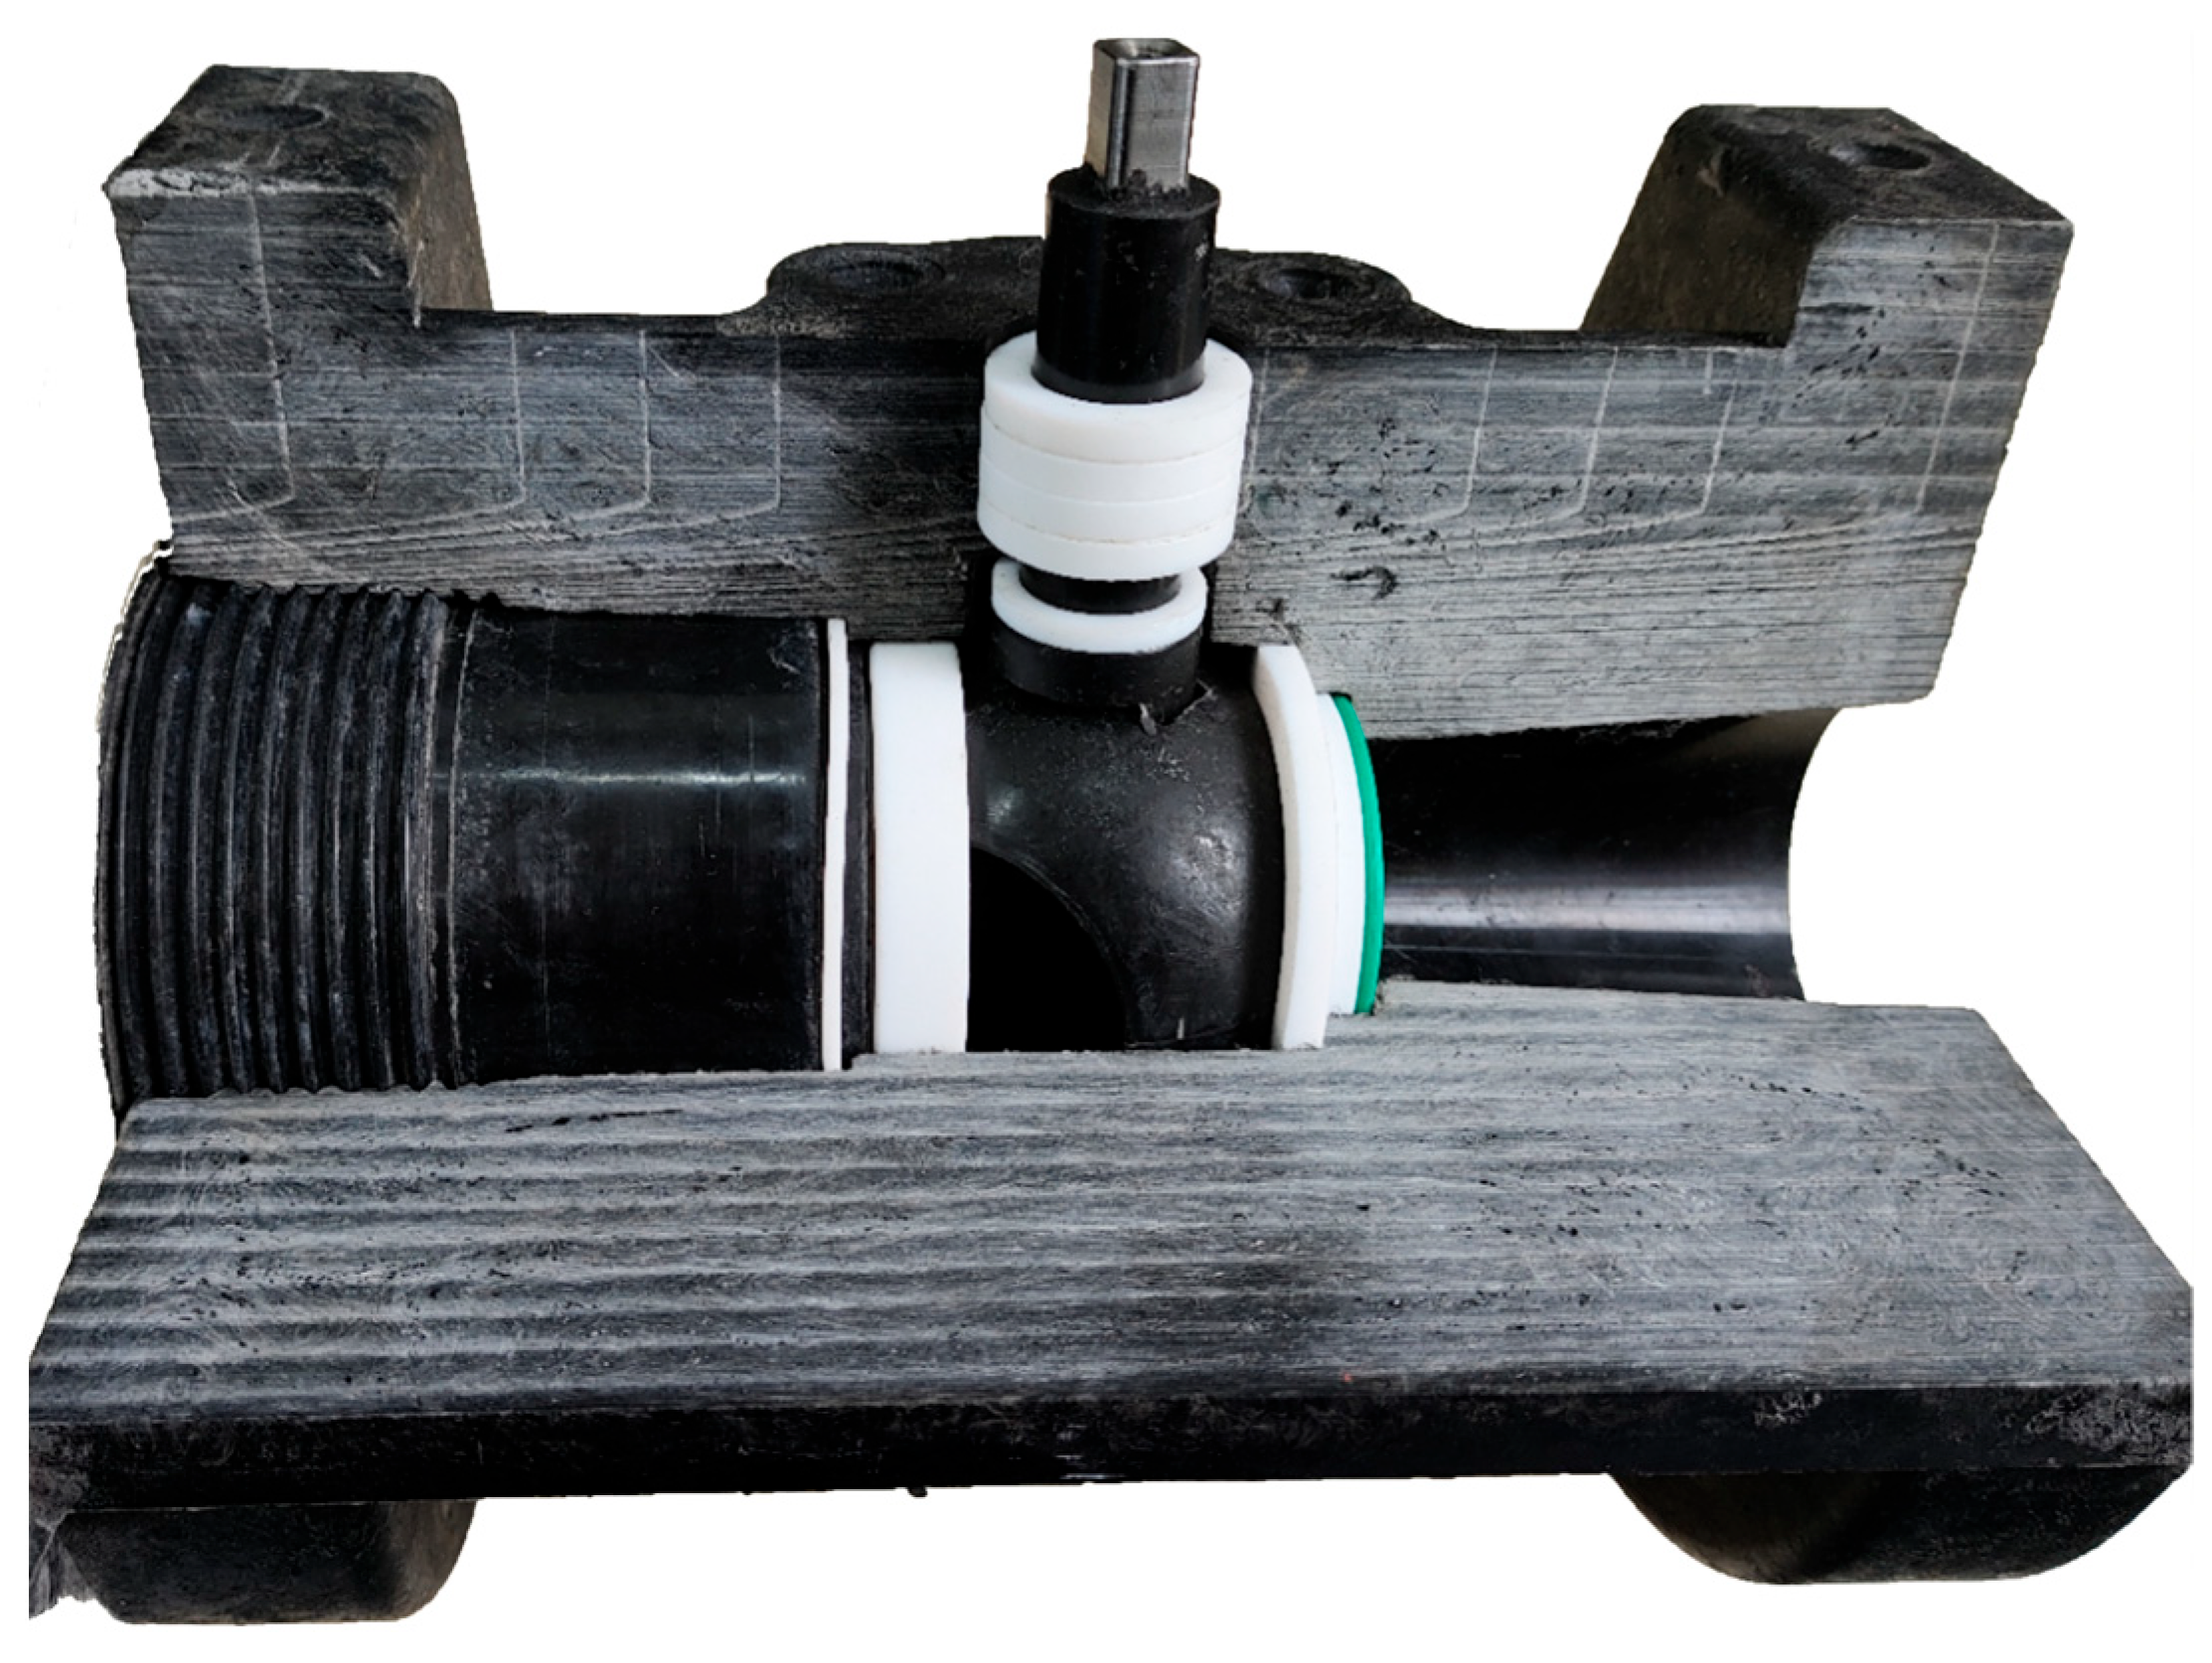
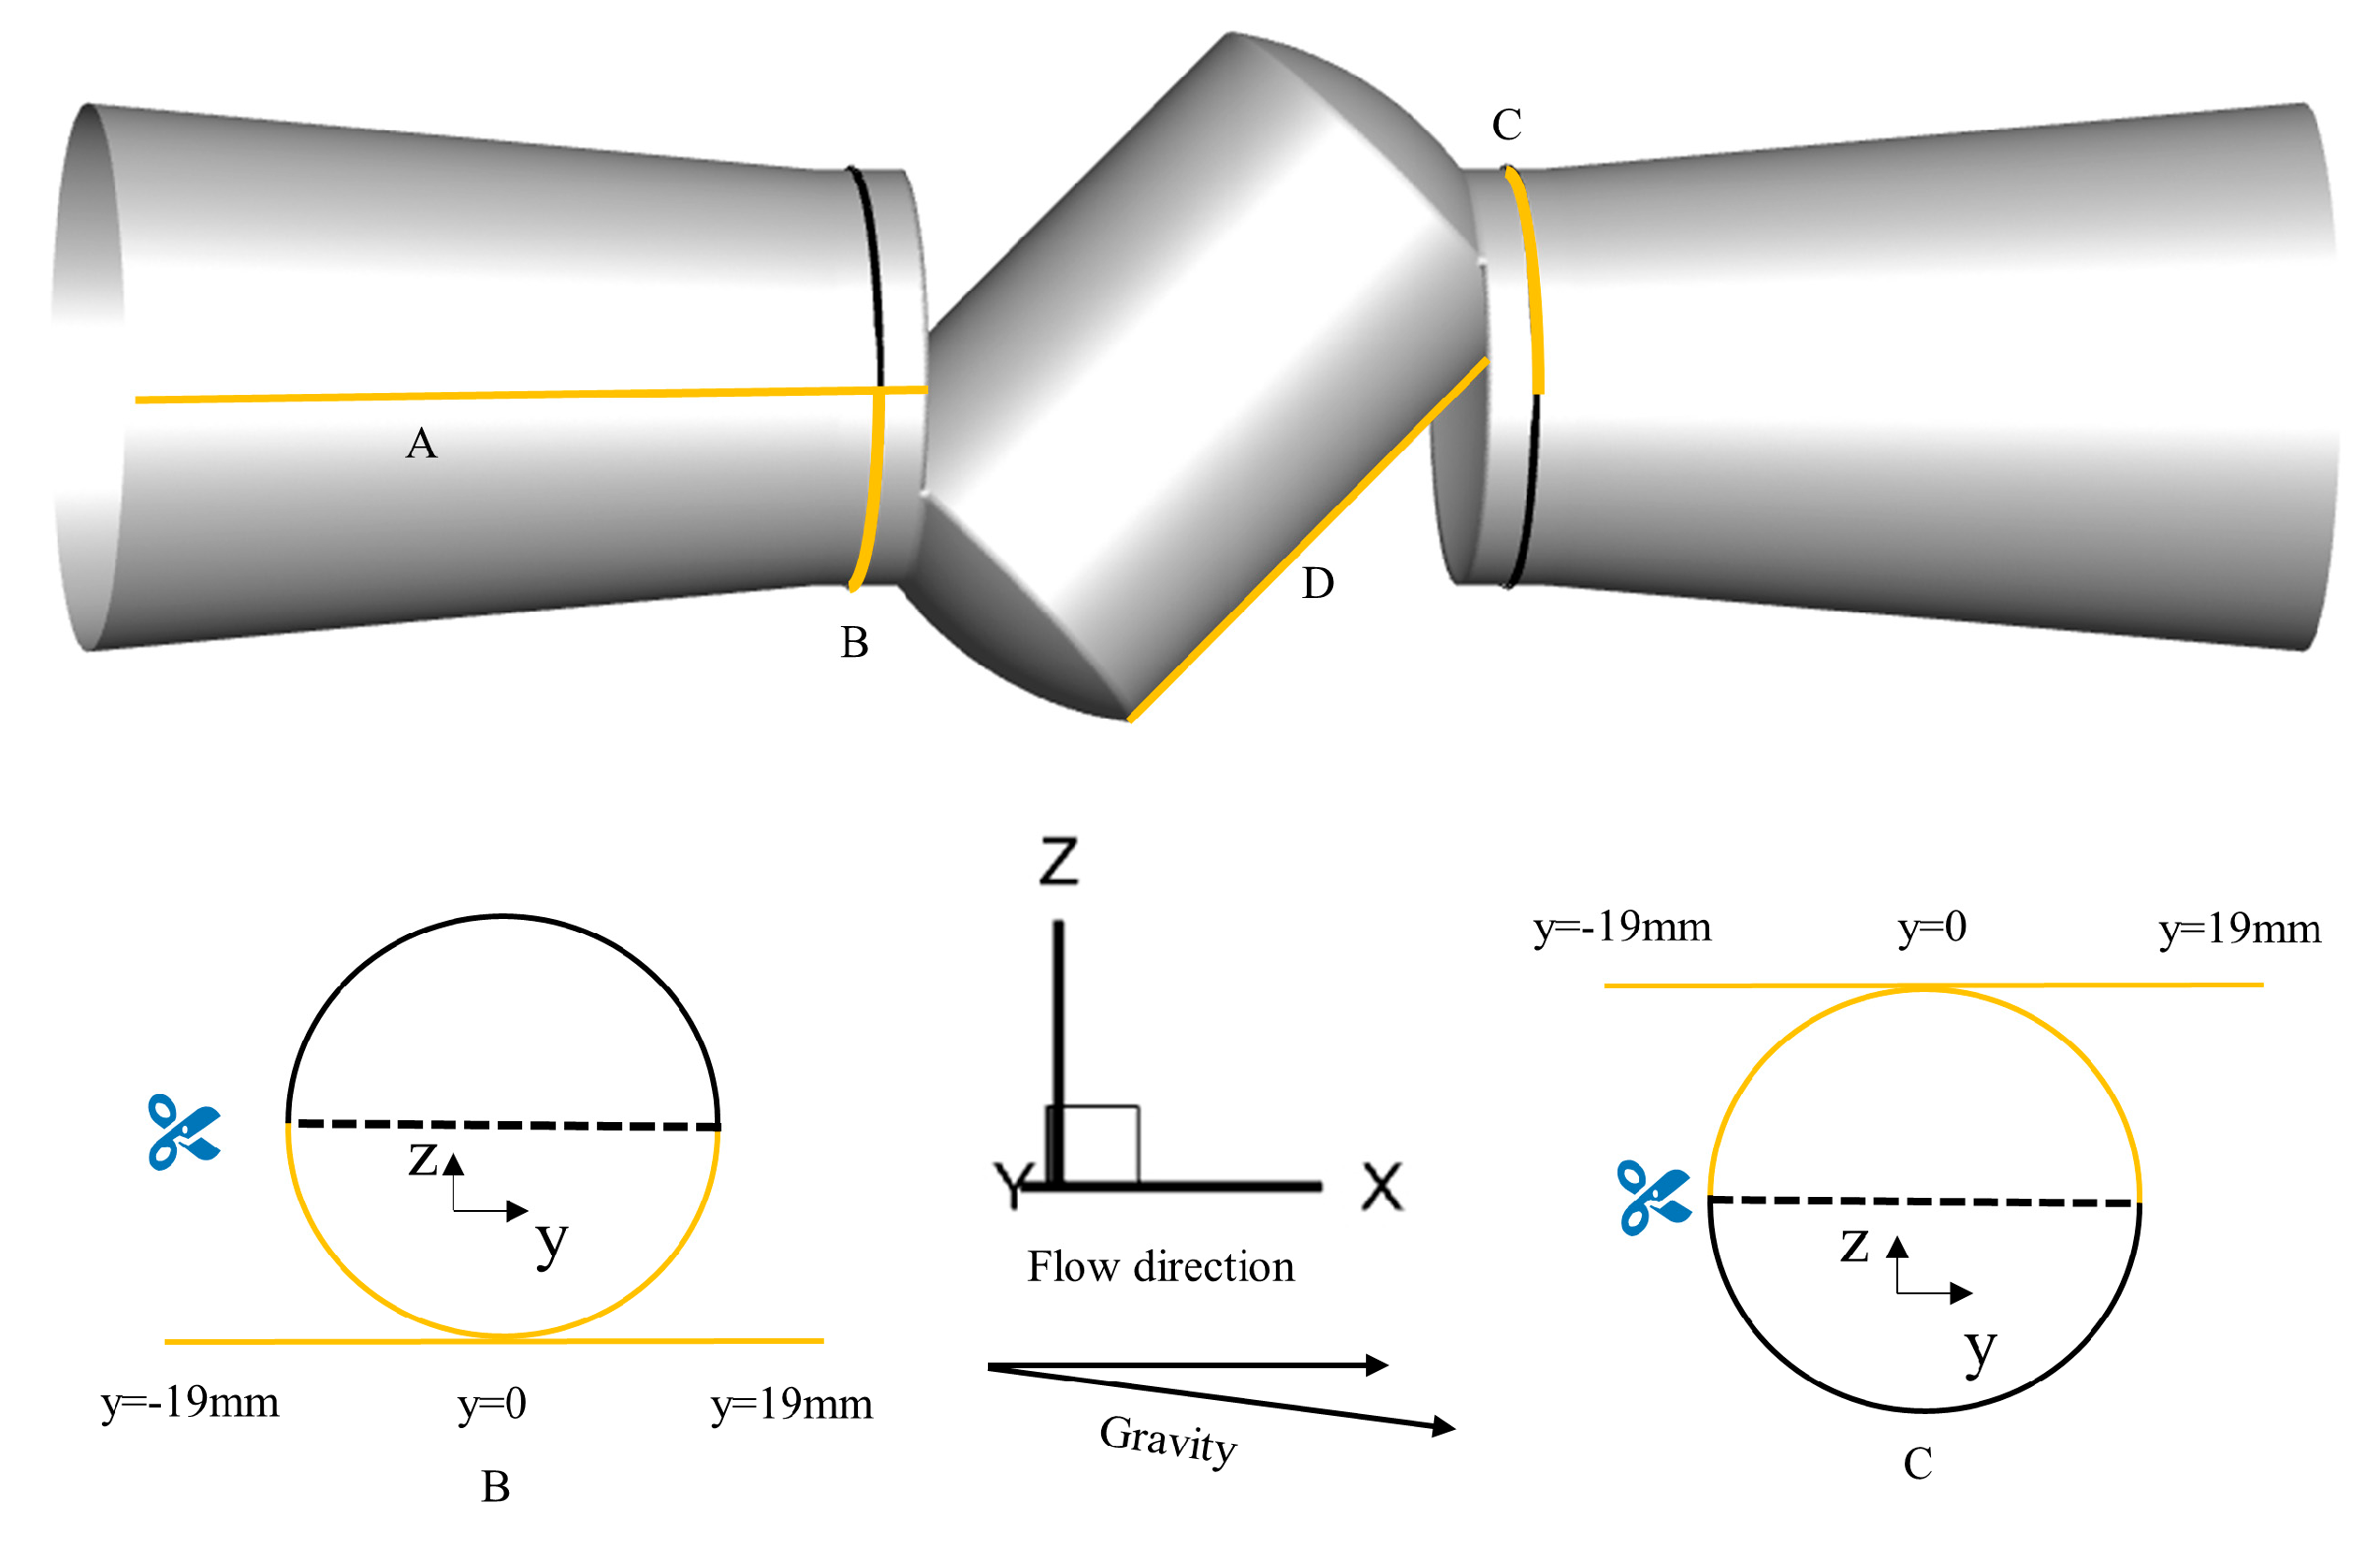
2.1. Problem Statement

The internal structure of the ball valve used in this study is shown in Figure 1. The flow passage structure is shown in Figure 2. The entire flow passage can be segmented into three sections: the inlet flow passage, the spool flow passage, and the outlet flow passage. This design features a tapered flow passage, with both the inlet and outlet flow passages tapering at a 5° angle. The inlet and outlet diameters are designed as D = 50 mm, and the valve seat and ball flow passage diameters are both designed as d = 38 mm. At a valve ball rotation angle of β = 16°, the valve operates at the critical point between closed and open. When β reaches 90°, the valve flow passage is in a fully open state. Consequently, the relative opening Cv = 0 when the valve ball rotation angle β is 16°, and the relative opening Cv = 100 when the rotation angle β is 90°.
The study examined the influence of four different opening states of the ball valve (Cv = 20, Cv = 40, Cv = 60, and Cv = 80) and four particle diameters (180 μm, 42 μm, 600 μm, and 850 μm). The solid particles had a density of 2650 kg/m3. The fluid medium was CH4 in the gas phase, and the inlet velocity was set at 5 m/s. The mass flow rate of particles was 6.5 × 10⁻⁵ kg/s, approximately 1% of the fluid mass flow rate. The particle inlet velocity is set to the same as the fluid inlet velocity.

2.2. Simulation Modeling

2.2.1. Gas Phase Model

The friction between gas and the surface of its flow path leads to changes in gas temperature and causes changes in gas viscosity. To simplify the calculation, it does not account for phase transition or heat transfer of the fluid. The continuity equation and momentum equation are as follows:
ρ v ¯ = 0
𝜕 𝜕 t ρ v ¯ + ρ v v ¯ = p + ρ μ l + μ t 2 v ¯ + ρ g ¯
where v ¯ refers to the fluid velocity; ρ refers to the fluid density; μl and μt refer to molecular diffusivity (kinematic viscosity) and turbulent diffusivity, respectively; p refers to the fluid pressure; and g refers to gravitational acceleration.
The modeled transport equations for turbulence kinetic energy k and turbulence dissipation rate ε in the realizable k-ε model for the unsteady condition could be written as follows:
𝜕 ρ k 𝜕 t + 𝜕 ρ k v i 𝜕 x i = 𝜕 𝜕 t μ + μ t α k 𝜕 k 𝜕 x j + G k ρ ε
𝜕 ρ ε 𝜕 t + 𝜕 ρ ε v i 𝜕 x i = 𝜕 𝜕 x j μ + μ t α ε 𝜕 ε 𝜕 x j + ρ C 1 ε E ε ρ C 2 ε ε 2 k + v ε
C 1 ε = max 0.43 , η η + 5 , η = S k ε , S = 2 S i j S i j ,
S i j = 1 2 𝜕 u i 𝜕 x j + 𝜕 u j 𝜕 x i , C 2 ε = 1.9
where Gk refers to the turbulence kinetic energy from the average velocity gradient, and αk and αε refer to the turbulent Prandtl numbers for k and ε, respectively.

2.2.2. Disperse Phase Model

The motion of the particles is solved using Newton’s second law in a Lagrange coordinate system. The change in the momentum of a particle per unit of time is equal to the resultant force acting on it. The momentum equation for the particle is given as:
d V p d t = F + g
where Vp is the vector velocity of the solid particle, and ∑F is the resultant force on the particle.
In gas–solid two-phase flow, the forces acting on solid particles can be divided into the fluid drag force on the particles; the acceleration of particles during variable-speed motion; instability-induced fluid dynamic forces; gravity acting on the particles; and inter-particle interaction forces. For non-dense flows, the pressure gradient induced by the flow field is minimal and can be neglected. For small particles, the influence of added mass is negligible. Therefore, these forces are disregarded. In the numerical simulations conducted in this study, only the effects of gravity and drag force on the particles are considered.
Due to the uneven distribution of surface pressure on solid particles and the viscosity of the fluid, the particles experience shear forces from the fluid. The drag force is composed of both the differential pressure and shear force components. The expressions are as follows:
F D = 3 μ 4 ρ p d p 2 C D R e p V V p
C D = b 1 + b 2 R e p + b 3 R e p 2
R e p = ρ d p V p V μ
where Rep is the Reynolds number of the particles; μ is the dynamic viscosity of the fluid; ρ is the density of the fluid; V is the velocity of the fluid; Vp is the velocity of the particles; ρp is the density of the solid particles; and CD is the drag resistance coefficient. In addition, b1, b2, and b3 are constant and they depend on the Reynolds number of the particles.
The rheological properties of fluids are fundamental in determining their drag force characteristics [35]. In this study, the temperature and viscosity of the gas are assumed to be constant, and the effect of the gas’s density change on the drag coefficient is the most important factor. Density influences the magnitude of the drag force indirectly through its contribution to the fluid’s inertia. It also directly affects the Reynolds number of the gas.

2.2.3. Erosion Model

The general erosion model [36] is adopted to calculate the wear rate by defining the particle wear model. The calculation formula is as follows:
R e r o s i o n = p = 1 N p a r t i l e s m ˙ p C d p f α V p n A f a c e
f ( α ) = i = 1 5 R i θ i
C ( d p ) = k d l
where Rerosion refers to the wear rate, kg/(m2·s); Aface refers to the wall unit area, m2; Npartiles refers to the number of Aface colliding particles in the unit area; mp refers to the mass flow rate of particles, kg/s; C(dp) refers to the particle size function; α refers to the particle collision angle, rad; f(α) refers to the particle impact angle function; vp refers to the particle impact velocity, m/s; and b(vp) refers to a function of relative particle velocity.
The parameters in the model need to be determined by specific experiments. In this study, the experimental data produced by Zhao [37] is adopted, and is shown in Table 1. Different materials have different behaviors in terms of particle collision and surface erosion damage. To obtain the best evaluation of the model, the simulation parameters have been set in line with the experimental data. Where εN refers to the normal rebound coefficient; and εT refers to the tangential elastic coefficient.
The particles bounce off the wall and are expelled from the outlet. To establish wall reflection conditions, rebound coefficients must be defined. The normal rebound coefficient and tangential elastic coefficient are as follows [38]:
ε N = 0.178 1.241 α + 2.352 α 2 1.589 α 3
ε T = 1.403 2.691 α + 2.408 α 2 0.673 α 3
where εN refers to the normal rebound coefficient; and εT refers to the tangential elastic coefficient.

2.3. Simulation Modeling

2.3.1. Erosion Model

In this study, parameters from Liu [39] were used for simulation calculation, and the accuracy of the model was verified by comparing the experimental results with the simulation results. It is observed that the erosion rate of GFRP demonstrates a consistent trend with changes in impact angle across varying particle diameters. Specifically, particles with a diameter of 425 μm were selected for testing. Figure 3 shows the overall trend of the erosion rate of the glass fiber composite with the changing impact angle in the experimental results and the simulation results, where θ is the impact angle. The accuracy and reliability of the model are proved by the consistency of the change trends between the two.

2.3.2. Grid Independence Test

Grid independence verification is essential for ensuring both accuracy and computational efficiency in simulations. The geometric model of the internal flow passage with a relative opening Cv = 40 of the valve is depicted in Figure 4a. Figure 4b shows the velocity distribution along the analysis line AB at the valve outlet, serving as the reference index. The number of grids significantly impacts the outlet end and the opening side of the ball valve. Upon reaching 2,348,315 cells, the fluid velocity on the opening side of the valve ball at the outlet end remains essentially unaffected. Consequently, to expedite calculations and conserve computational resources, the optimal grid number for the numerical simulation model of ball valve erosion in this study is determined to be 2,348,315.

3. Results and Discussion

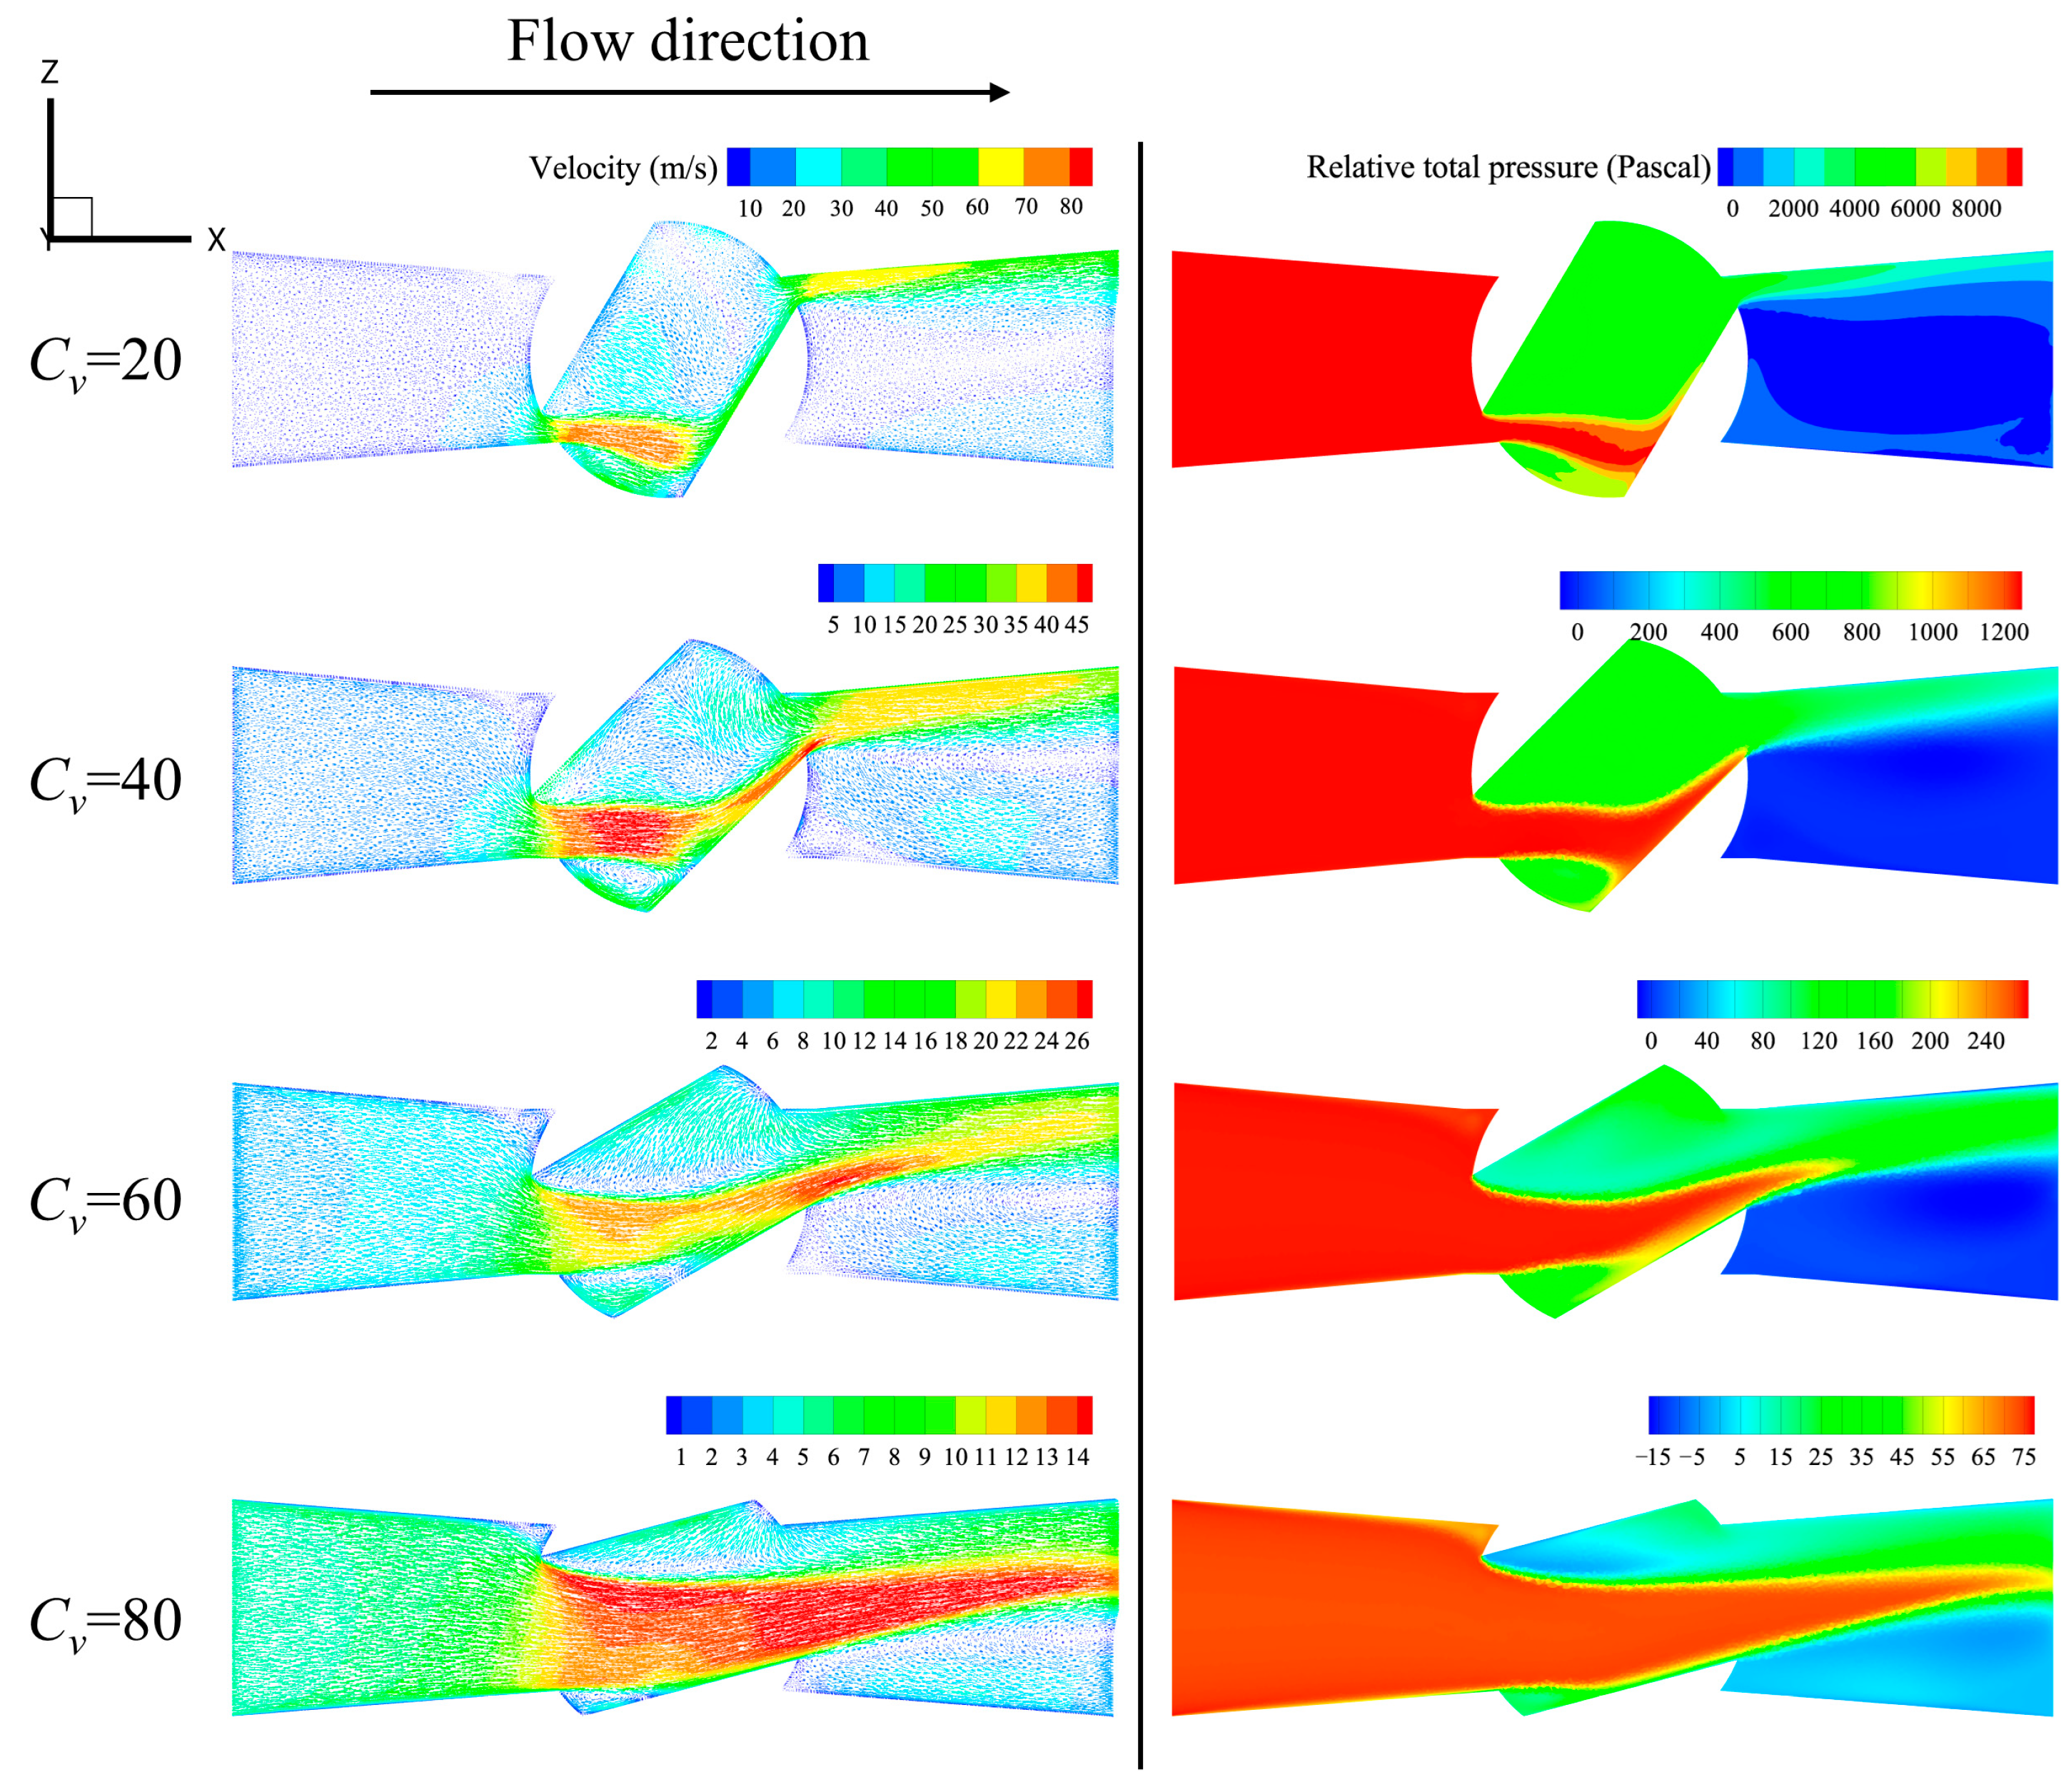
3.1. Effect of Relative Openness on Flow Field

Variations in the relative opening of the ball valve induce alterations in the entire flow passage structure, consequently affecting the flow field within the passage. Figure 5 illustrates the velocity distribution across the central slice (Y = 0) of the flow passage of the ball valve at various relative openings.
When the ball valve is partially open (Cv = 20), the restricted flow area at the inlet of the spool flow passage results in the formation of a high-speed jet. The high-speed jet enters the spool flow passage and impacts its inner wall, then proceeds to flow along the inner wall within the spool flow passage before finally flowing out at the outlet of the spool flow passage. Inside the spool flow passage, the jet generates intense turbulence by impacting the wall surface. At the outlet of the spool flow passage, a high-speed jet also forms in the outlet flow passage, and a recirculation zone exists in the lower part of the outlet flow passage, generating a clockwise-rotating recirculation vortex. With the increase in relative opening (Cv = 60), the flow velocity within the flow passage gradually decreases, and the sizes of multiple recirculation zones also gradually diminish. The distribution of relative total pressure under different opening conditions closely resembles the velocity distribution. An incomplete opening of the ball valve results in the formation of a high-pressure zone across both the inlet flow passage and the spool flow passage. As the opening increases, the pressure value of the high-pressure zone decreases, and the overall flow velocity inside the passage significantly diminishes. A low-pressure zone emerges beneath the high-speed jet in the outlet flow passage, and its extent decreases as the opening increases.
At the inlet and outlet of the spool, there is an obvious vorticity gradient distribution. The cyclic nature of vortical flows can repeatedly impact the same areas, intensifying erosion processes over time. Turbulent flows with high vorticity can enhance erosion dynamics by increasing the frequency and intensity of particle impacts on surfaces, leading to abrasion and wear. In this study, the erosion damage of the spool inlet and outlet was given particular attention.

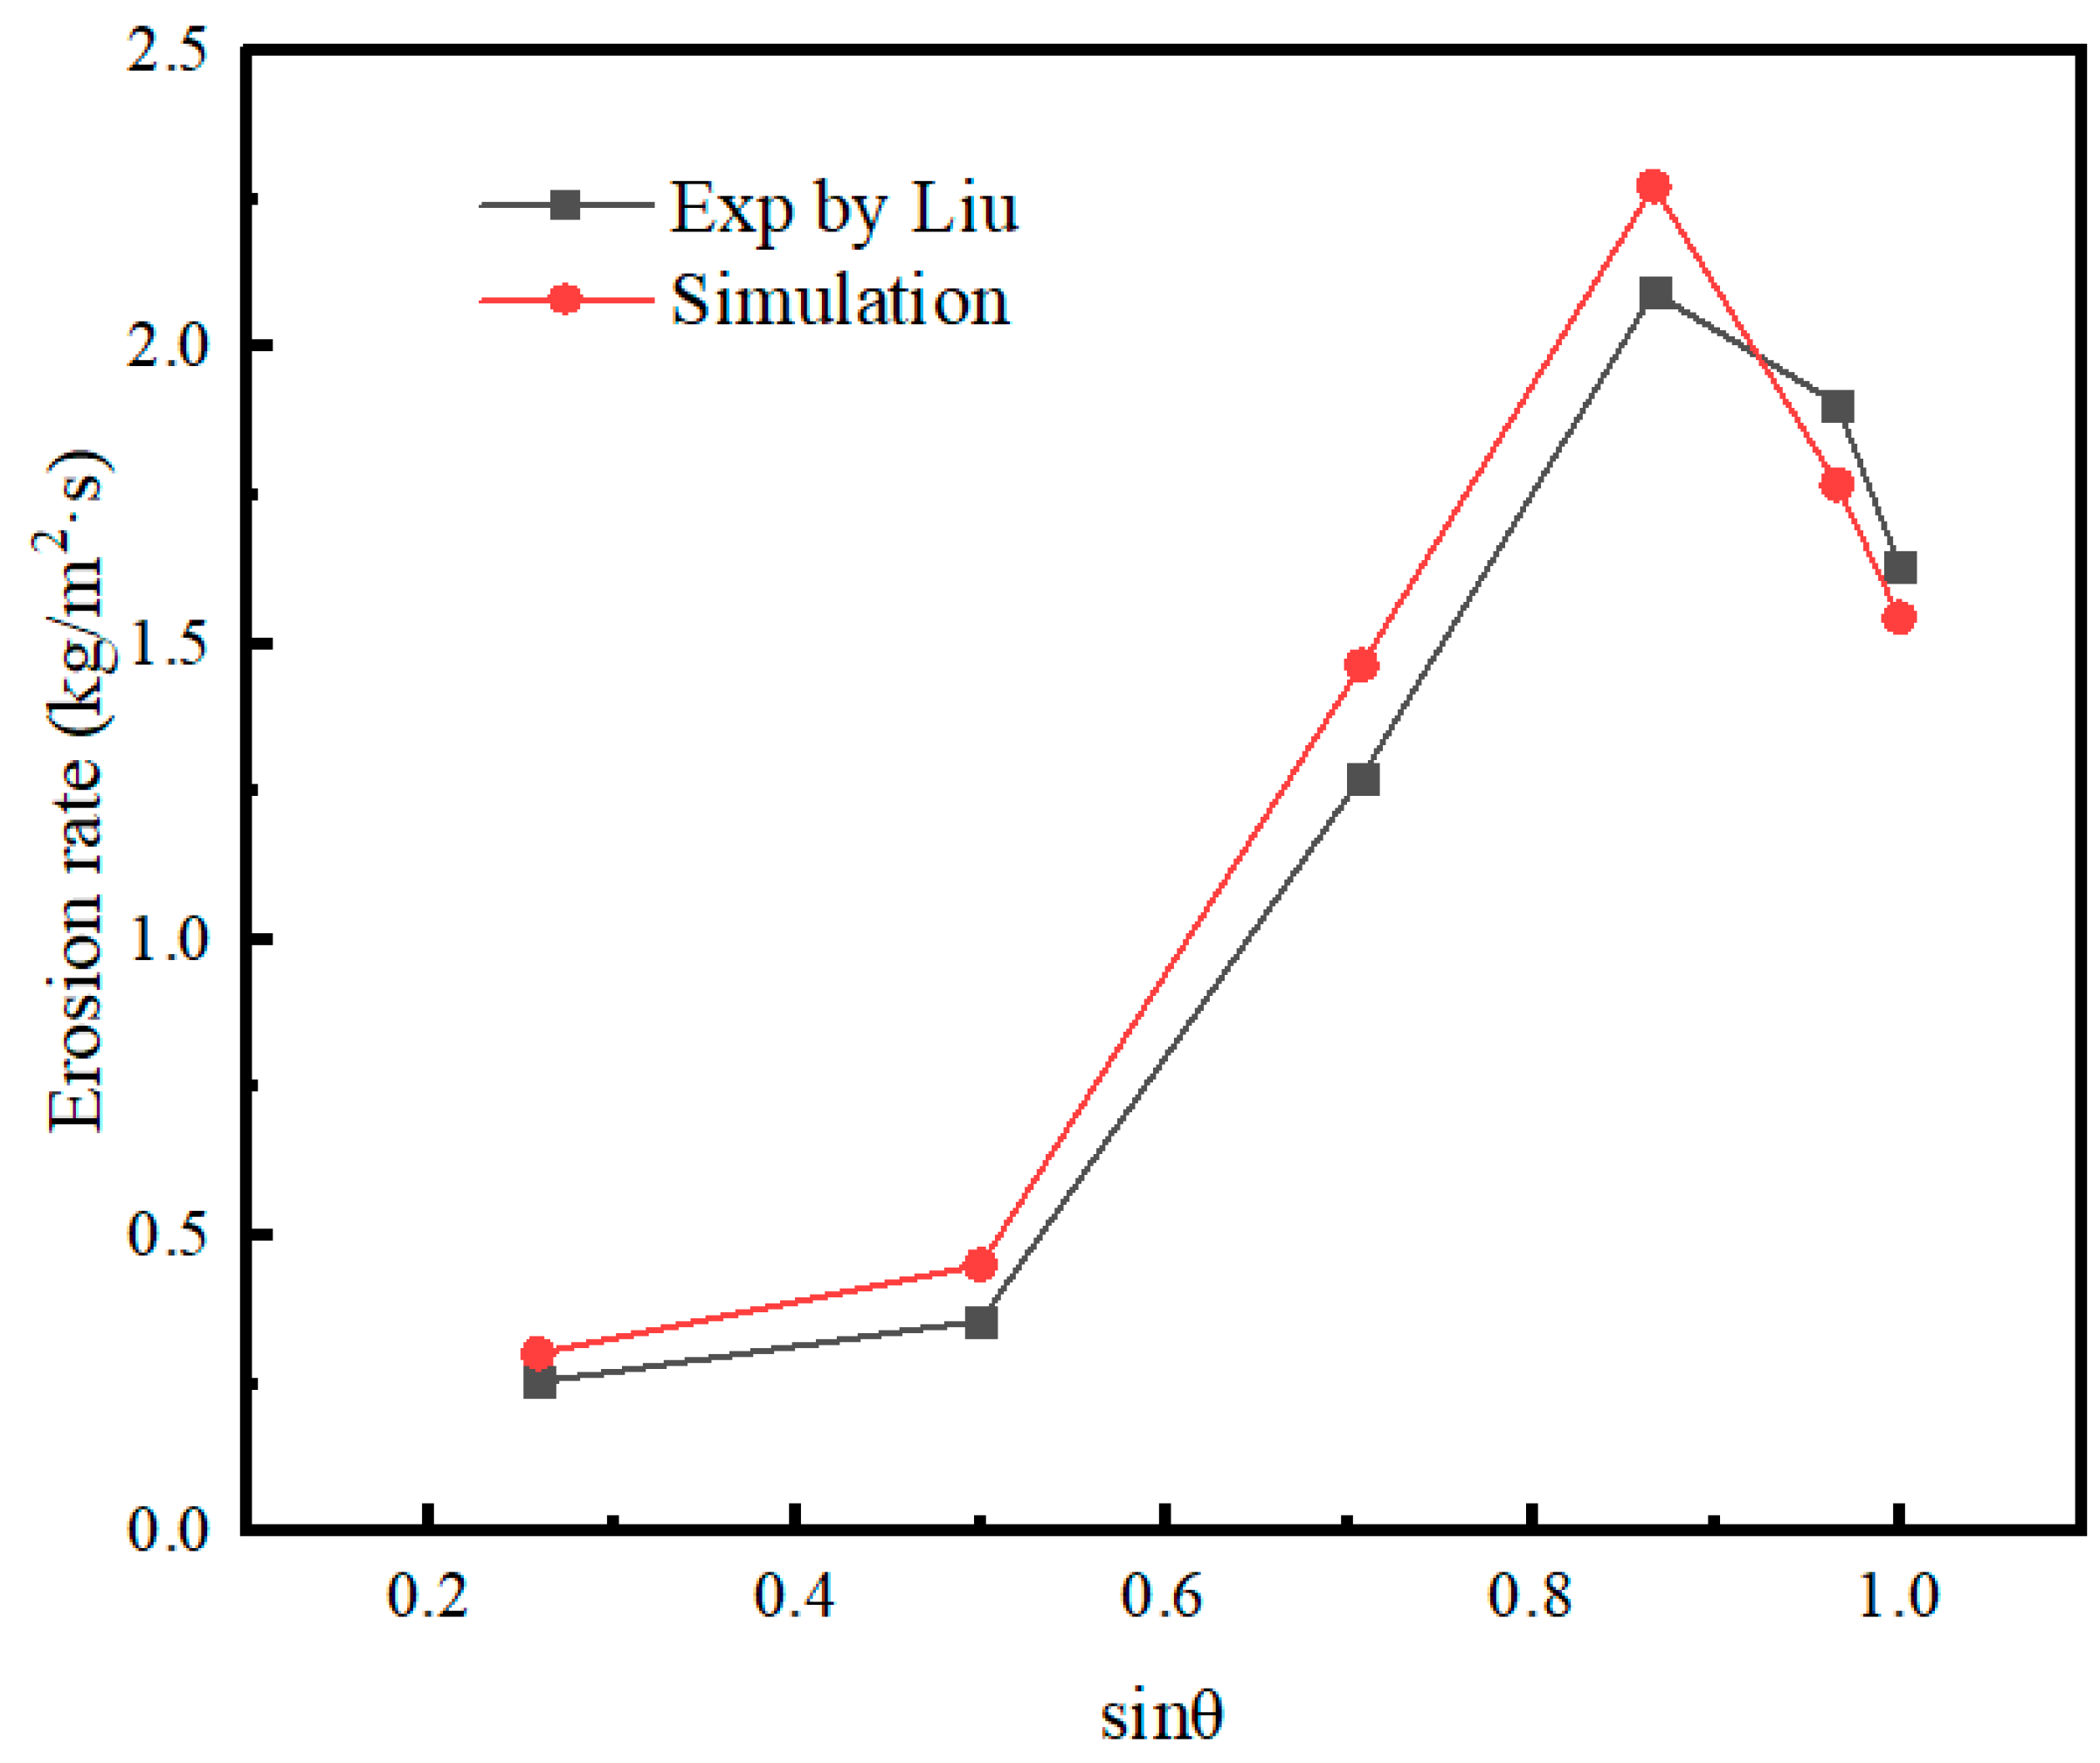
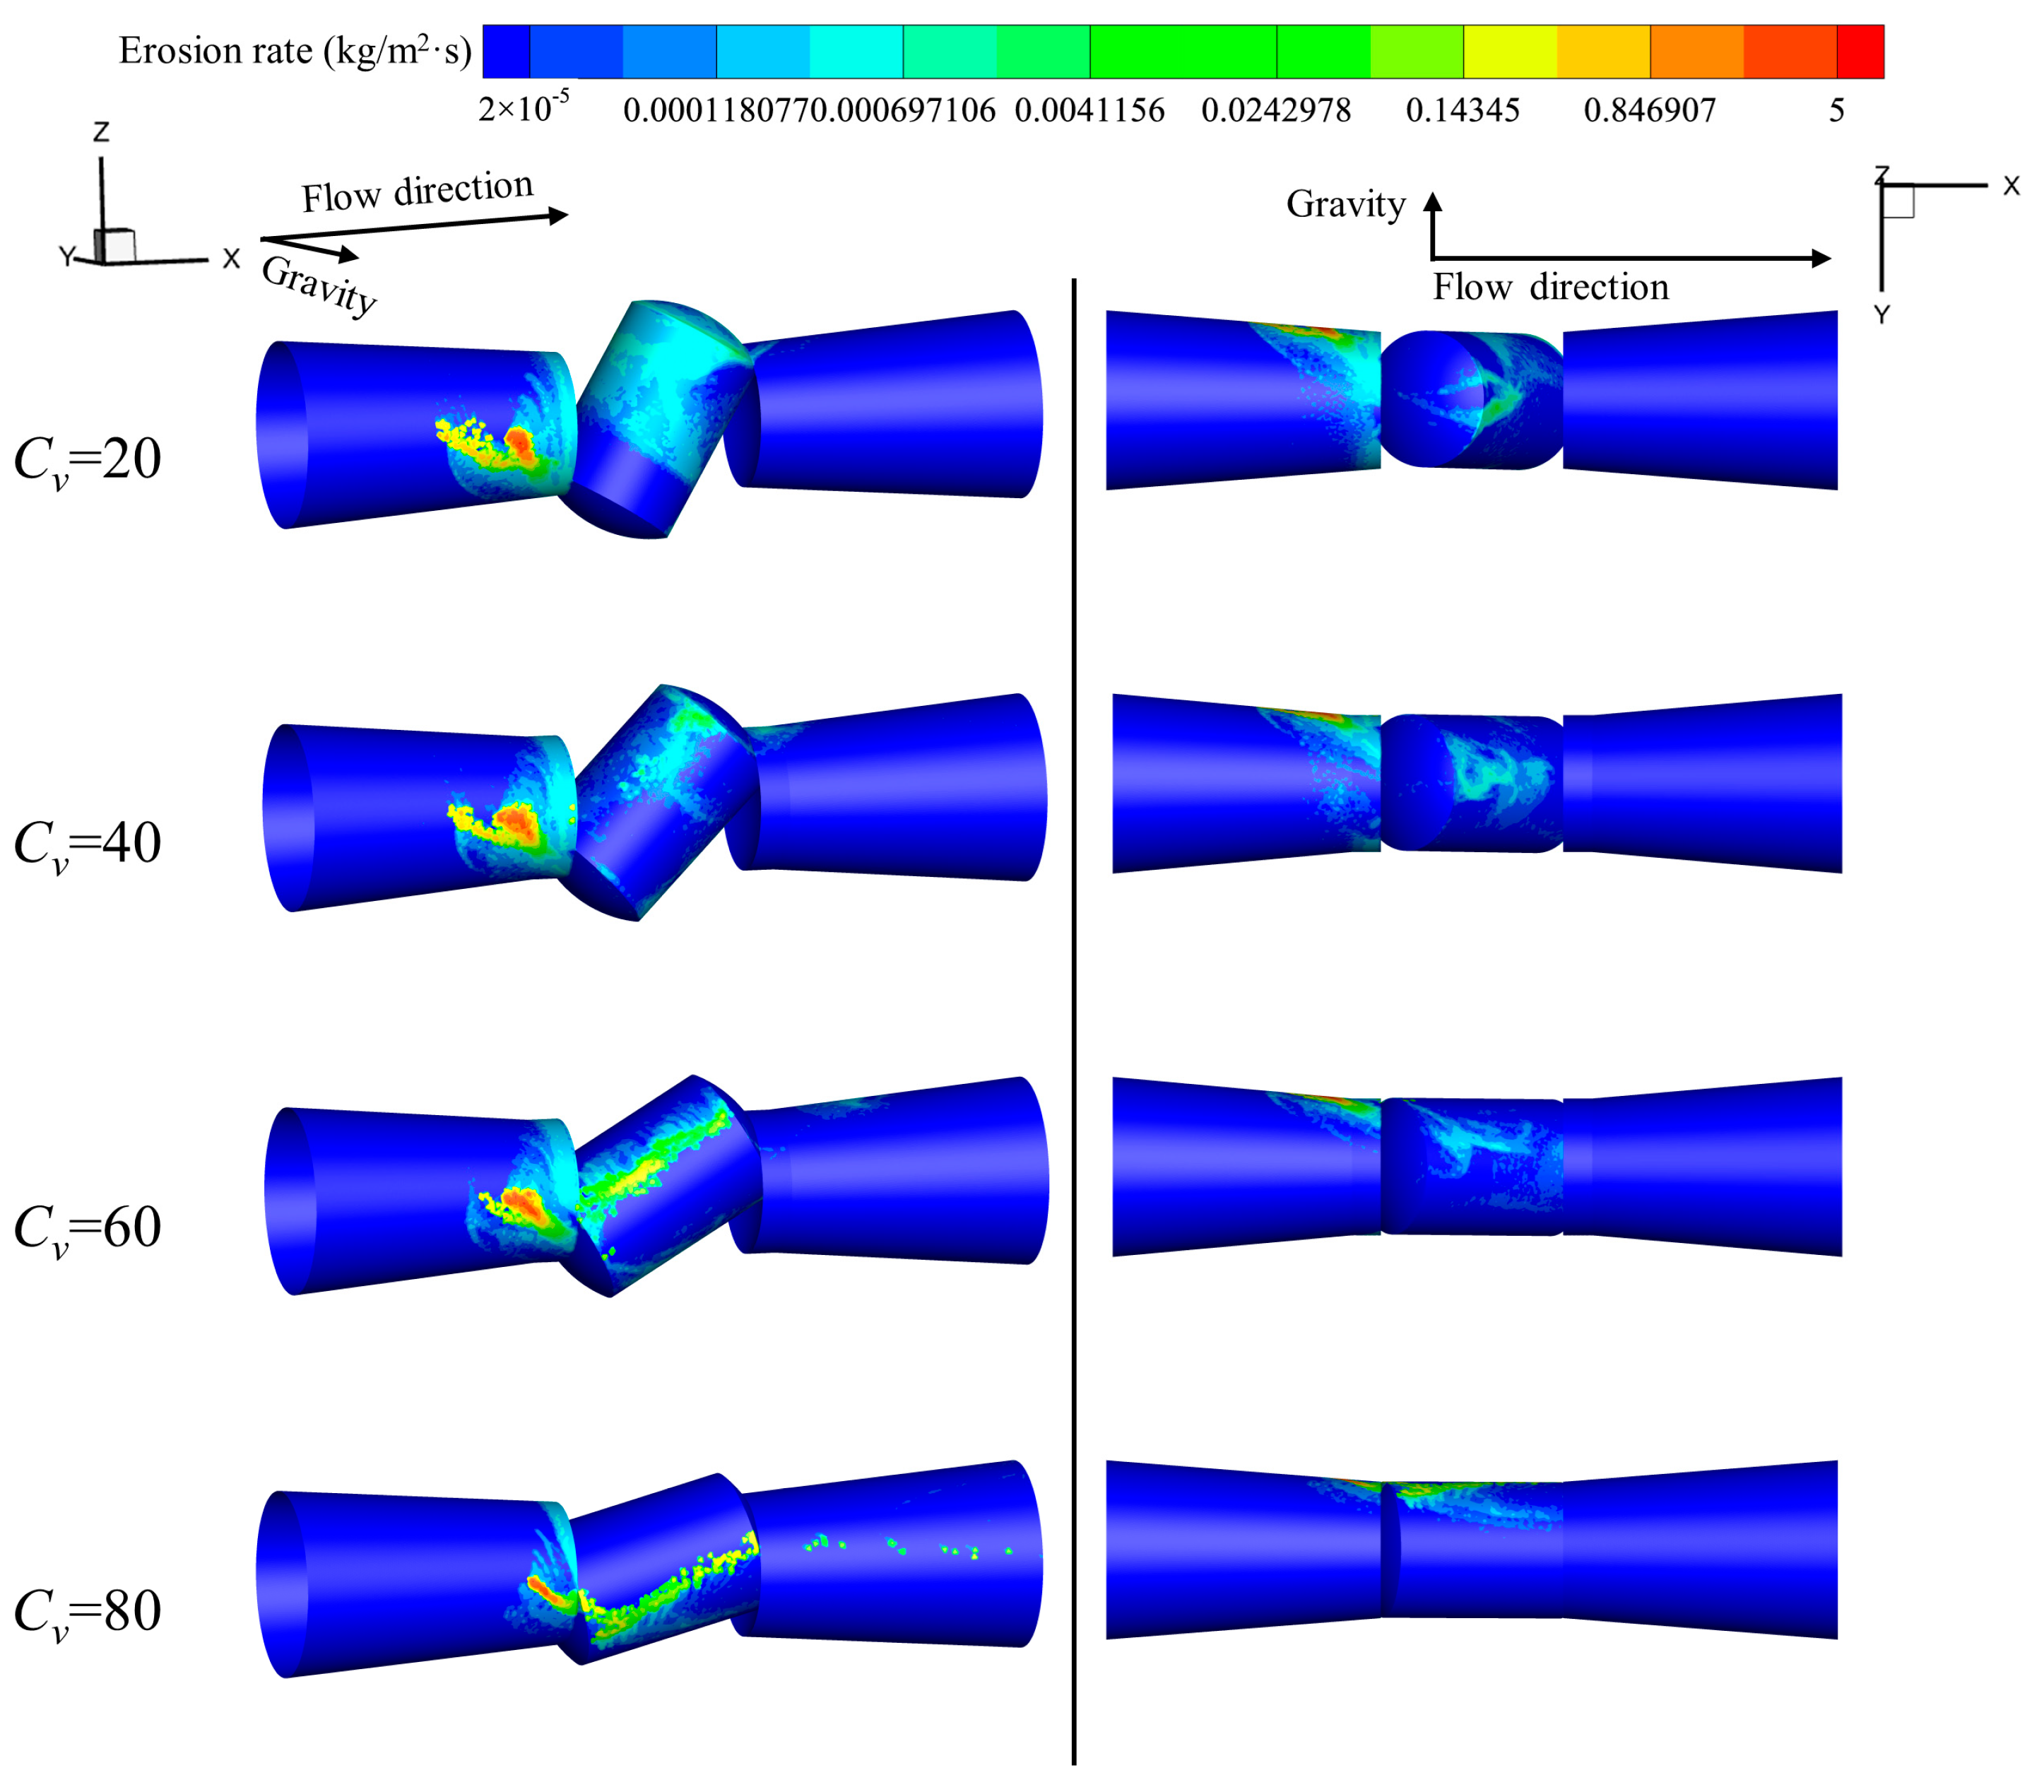
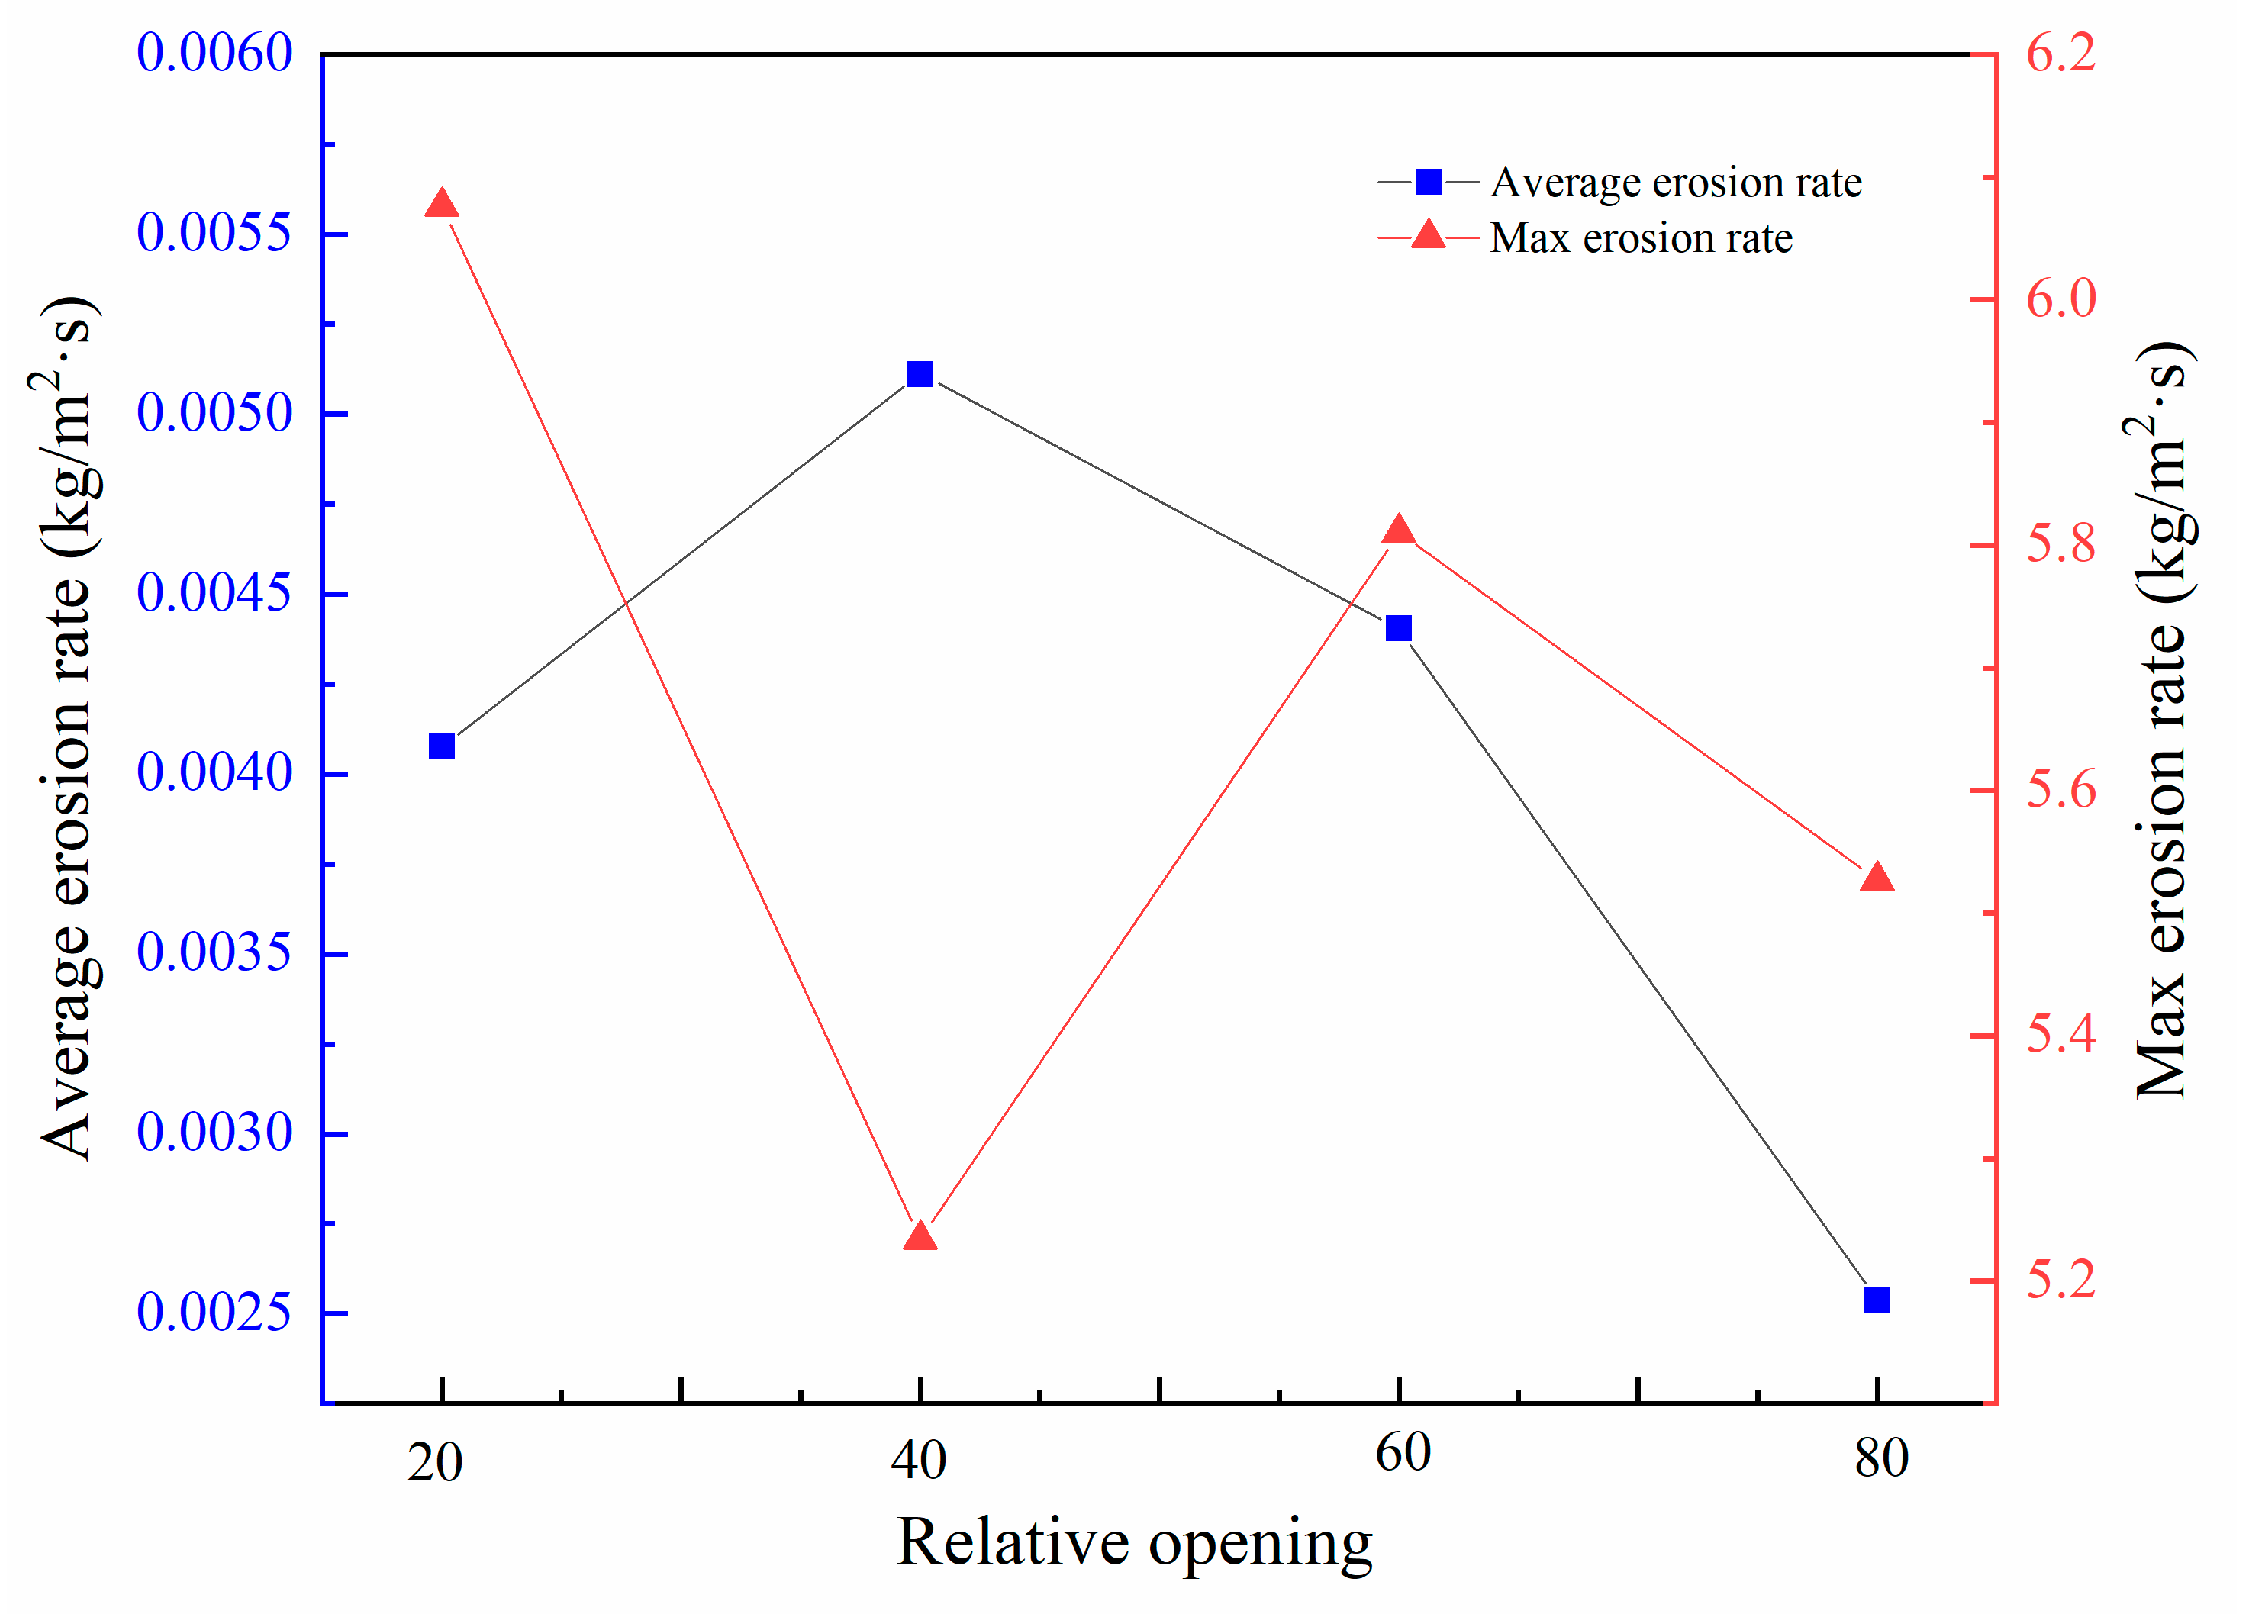
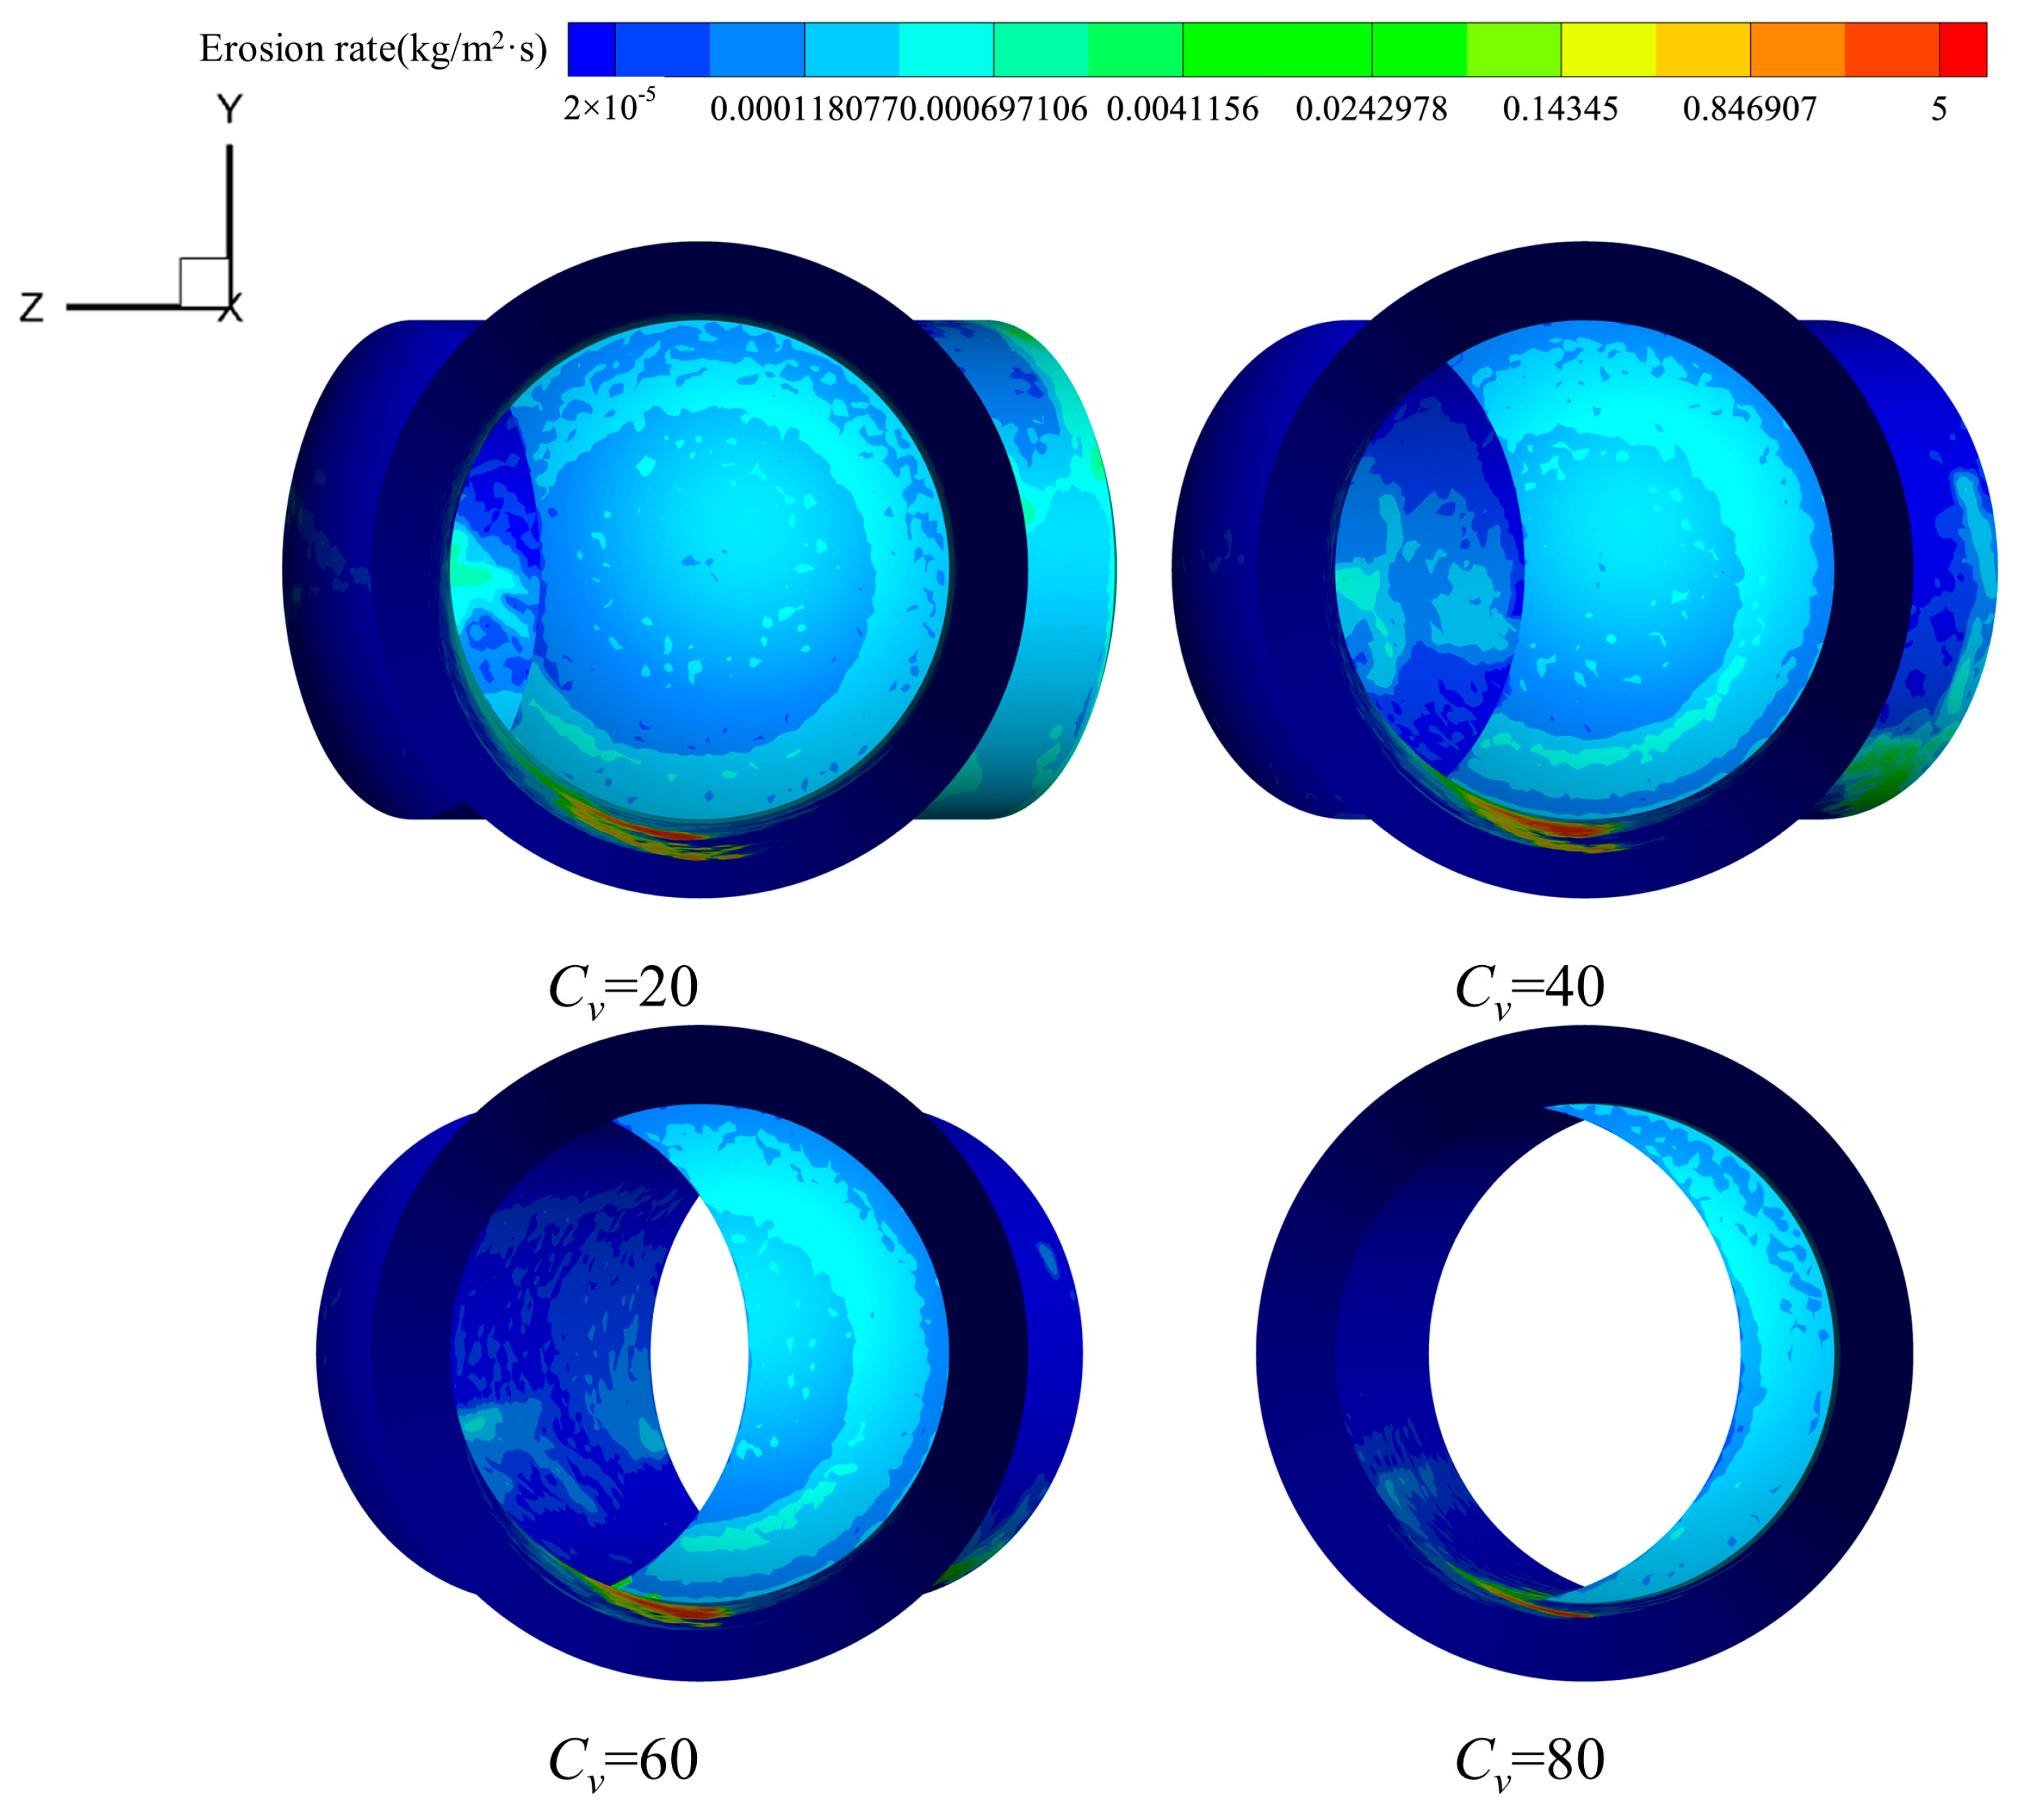
3.2. Effect of Relative Openness on Erosion Rate Distribution

In the case of resin-based fiber-reinforced composites, the resin layer on the surface is responsible for erosion resistance. However, under different fiber distribution conditions, the collision response at various locations can vary. In this study, these variations were not considered, and the surface resin layer was idealized as an isotropic material for the analysis.
The inlet flow velocity of gas is set at V = 5 m/s, and solid particles with a diameter of dp = 425 μm are introduced into the fluid medium. The injection velocity of the particles is consistent with the inlet velocity of the fluid, Vp = 5 m/s. The particles are configured as spherical sand grains with a density of 2650 kg/m3. The erosion conditions within the flow passage of the valve under different relative opening conditions are illustrated in the below diagram, with the negative direction of the Y-axis representing the direction of gravity, and the positive direction of the X-axis indicating the flow direction.
Throughout the entire flow passage in Figure 6, the bottom of the inlet flow passage experiences the most severe erosion. In the spool flow passage, the relatively severe erosion on the left side of the spool flow passage outlet is caused by high-speed jet impact on the wall surface and the small flow area at the spool flow passage outlet, resulting in particle rebound. In the outlet flow passage, due to the small opening of the valve ball, the probability of particles reaching the downstream flow passage is minimal, resulting in low erosion in the outlet flow passage.
In the inlet flow passage, at a relative opening of Cv = 20, the small flow area at the entrance of the spool flow passage leads to particle rebound after collision with the valve ball surface, coupled with significant erosion at the bottom of the passage under the influence of gravity. As the relative opening increases, the larger entrance of the spool flow passage reduces the probability of solid particles rebounding from the valve ball, resulting in a significant reduction in the erosion rate in the inlet flow passage.
In the spool flow passage, an increase in relative opening leads to a significant decrease in flow velocity within the spool flow passage, amplifying the influence of gravity on solid particles and concentrating erosion at the bottom of the spool flow passage. Erosion on the side walls of the spool flow passage decreases significantly due to the impact of the high-speed jet.
At a relative opening of Cv = 80, a scattered erosion distribution is observed at the bottom of the outlet flow passage, which is attributed to the increased relative opening allowing solid particles to more easily reach the outlet flow passage. Moreover, the overall decrease in flow velocity within the passage intensifies the influence of gravity on solid particles, resulting in increased erosion at the bottom of the outlet flow passage.
The average erosion rate and maximum erosion rate in the flow channel can directly represent the erosion conditions in the flow passage. The maximum erosion rate is the erosion rate in the most heavily eroded location. The average erosion rate is the average erosion rate across the entire flow passage surface. Figure 7 shows the average and maximum erosion rates within the flow passage across various relative openings. The average erosion rate shows an increasing trend followed by a subsequent decrease with the relative opening. At Cv = 40, the average erosion rate peaks at 0.005112 kg/m2·s. From Cv = 20 to Cv = 40, the maximum erosion rate diminishes while the average erosion rate increases. As the relative opening increases, changes in the flow channel structure cause some particles to directly enter the spool flow passage, resulting in a reduction in the maximum erosion rate in the inlet flow channel. As shown in Figure 5, at Cv = 40, the area exposed to high-speed jets in the valve core flow channel increases, allowing more particles to enter this channel. This leads to a significant increase in the erosion rate within the valve core, thereby raising the average erosion rate. At Cv = 60, the overall flow velocity within the flow passage significantly decreases, reducing the average fill rate. Gravity influences some particles to erode the bottom of the inlet flow passage before entering the spool flow passage, thereby increasing the maximum erosion rate at the bottom of the inlet flow passage. At Cv = 80, the flow velocity within the flow passage decreases again, resulting in reduced erosion intensity at the bottom of the inlet flow passage and a subsequent decrease in the maximum erosion rate.
The thin edge of the spool is easily damaged by erosion [40]. Figure 8 shows the erosion distribution on the valve ball surface across various relative openings. A relatively severe erosion band forms on the outer surface of the valve ball, and its relative position remains consistent regardless of changes in the relative opening. In the inlet flow passage, minimal differences in velocity distribution are observed among different relative openings, and the erosion rate on the erosion band shows no significant variation. Due to gravitational influence, the erosion rate in the lower part of the outer surface of the valve ball is notably higher than that in the upper part.
The thin edge of the valve ball is particularly susceptible to erosion damage. At Cv = 20, the erosion band is located very closely to the thin edge. Due to the combined effects of erosion at this junction, the thin edge structure of the valve ball is more susceptible to damage. At a relative opening of Cv = 80, the edge of the erosion band nearly aligns with the thin edge of the valve ball, resulting in a longer junction length and, consequently, a higher likelihood of erosion damage to the thin edge.
As the relative opening increases, the erosion rate on the inner wall of the spool flow passage initially rises and then declines. The increase in relative opening heightens the likelihood of solid particles from the upstream passage entering the spool flow passage. However, the substantial decrease in flow velocity within the passage notably diminishes the erosion level on the inner wall of the spool. At Cv = 80, owing to the reduction in fluid velocity and the gravitational influence on solid particles, the erosion area within the spool flow passage shifts downward, leading to a higher erosion rate in the lower part of the passage.

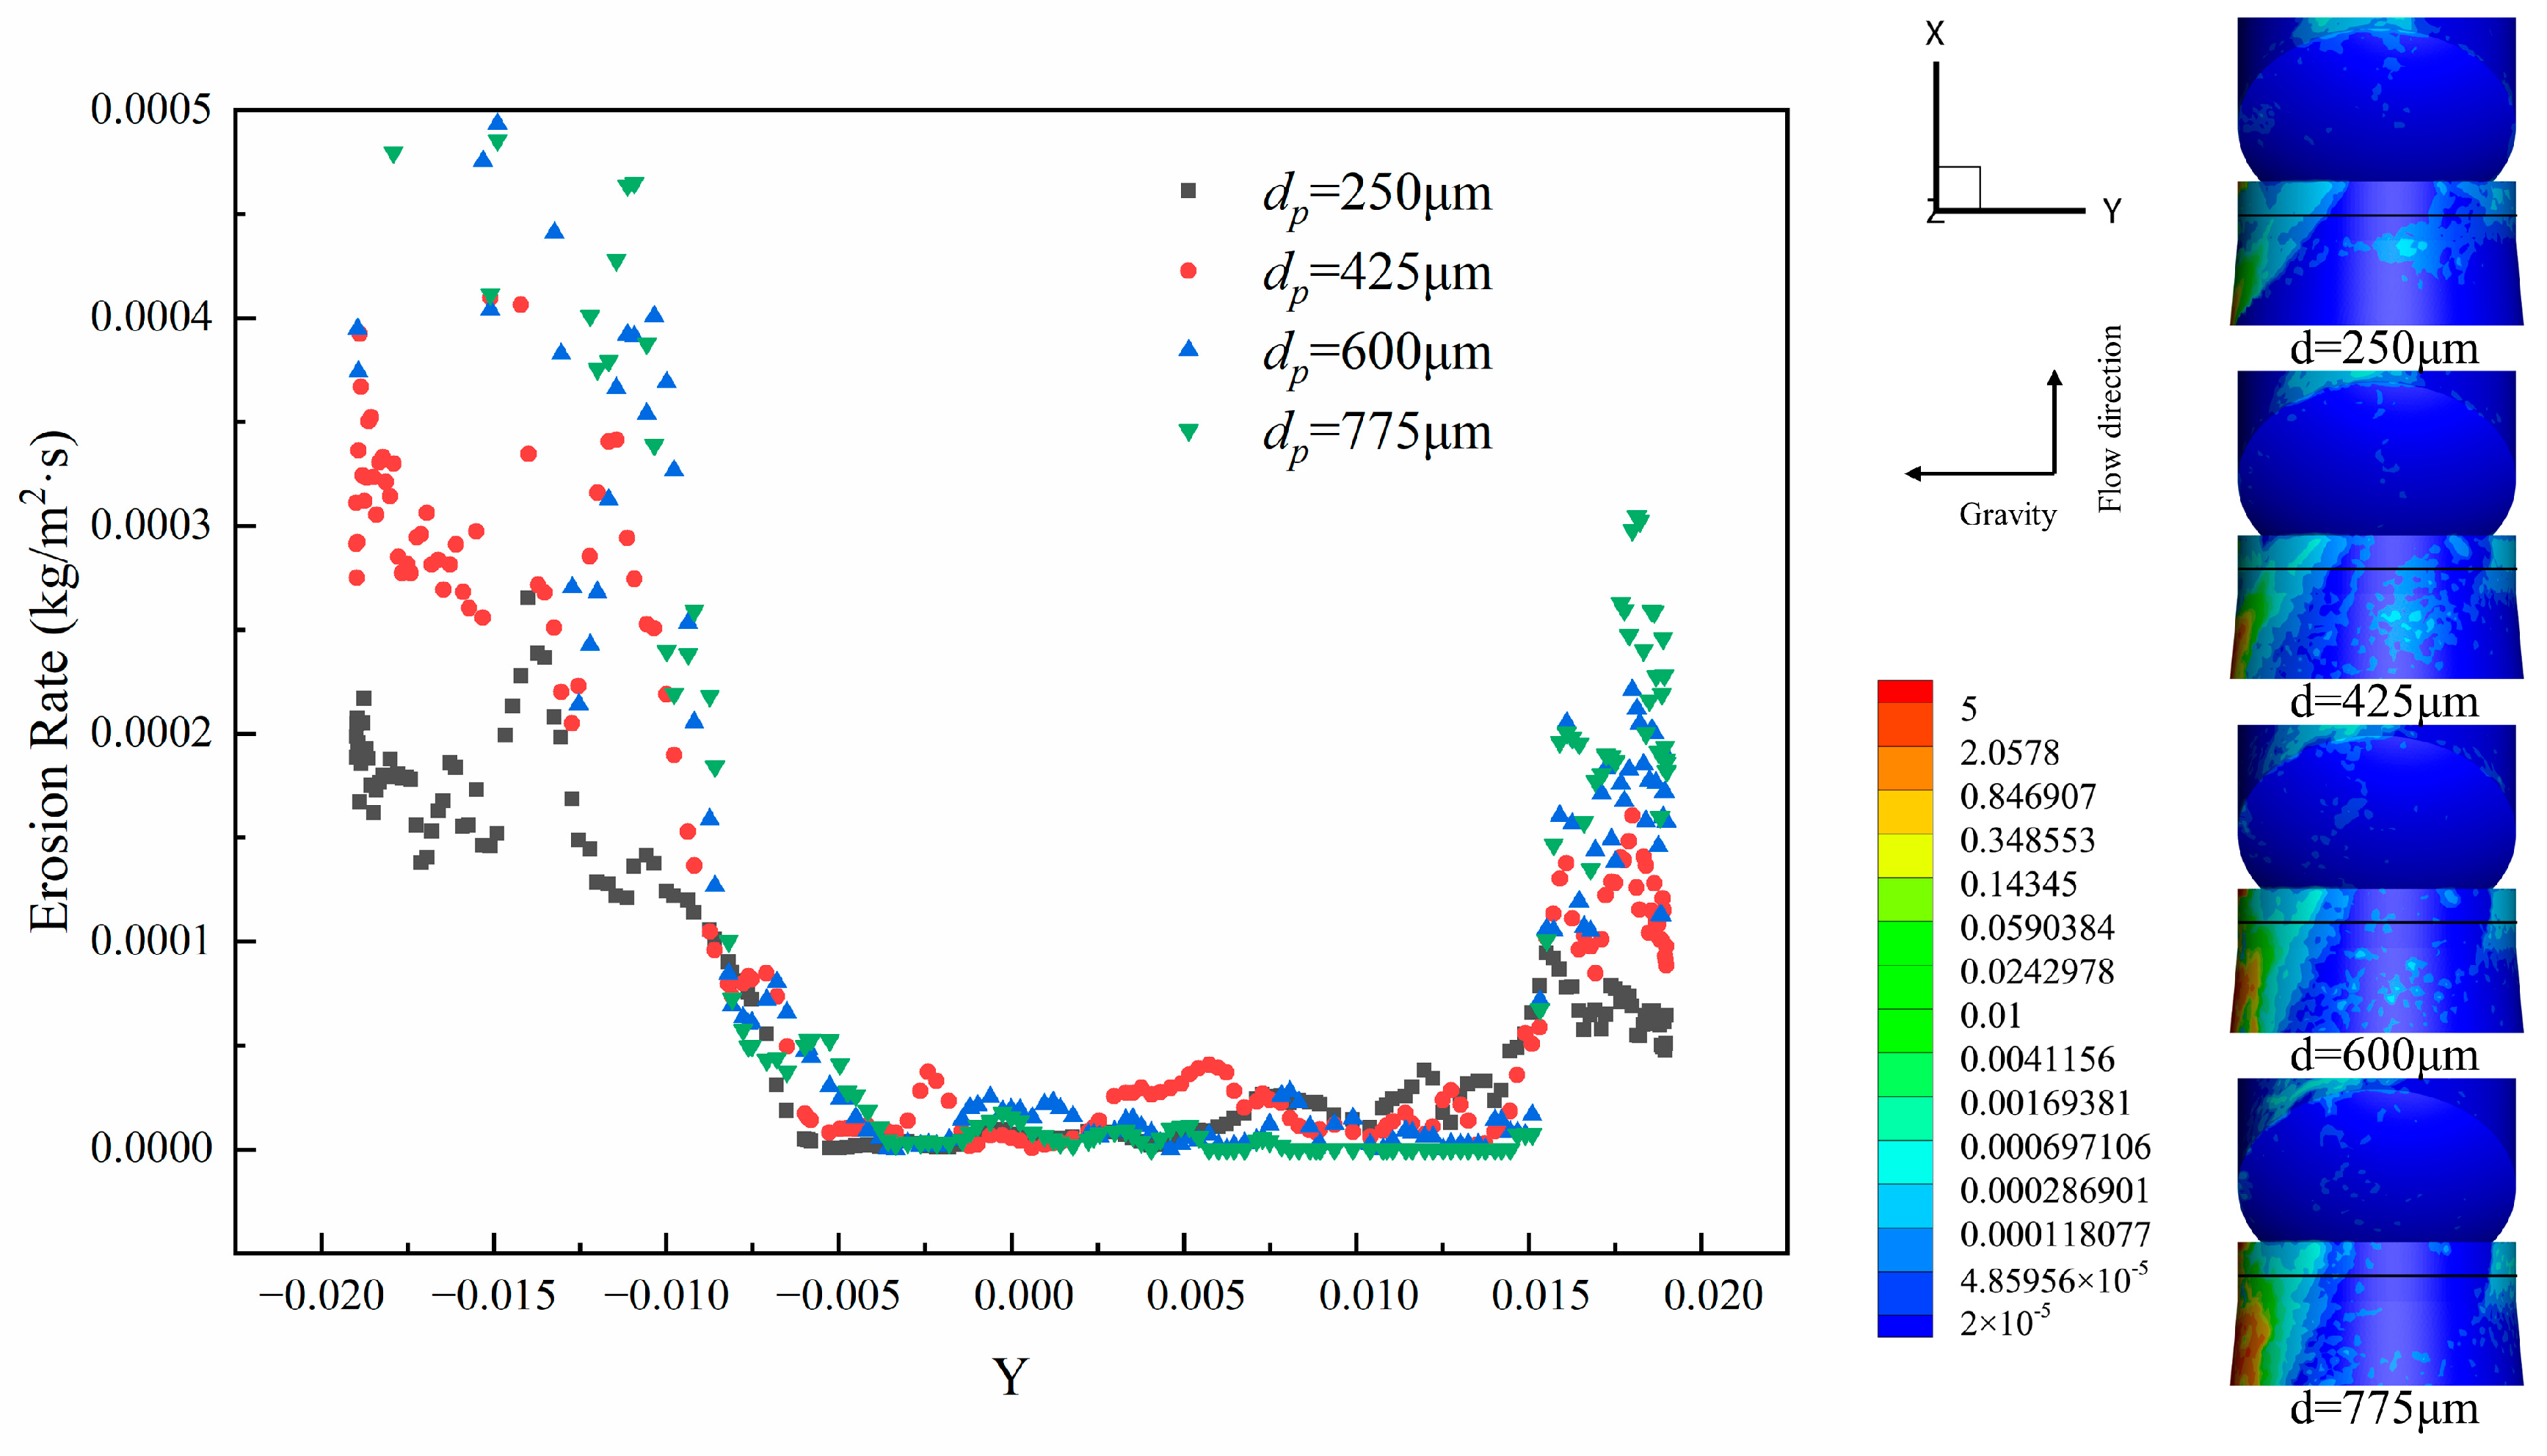
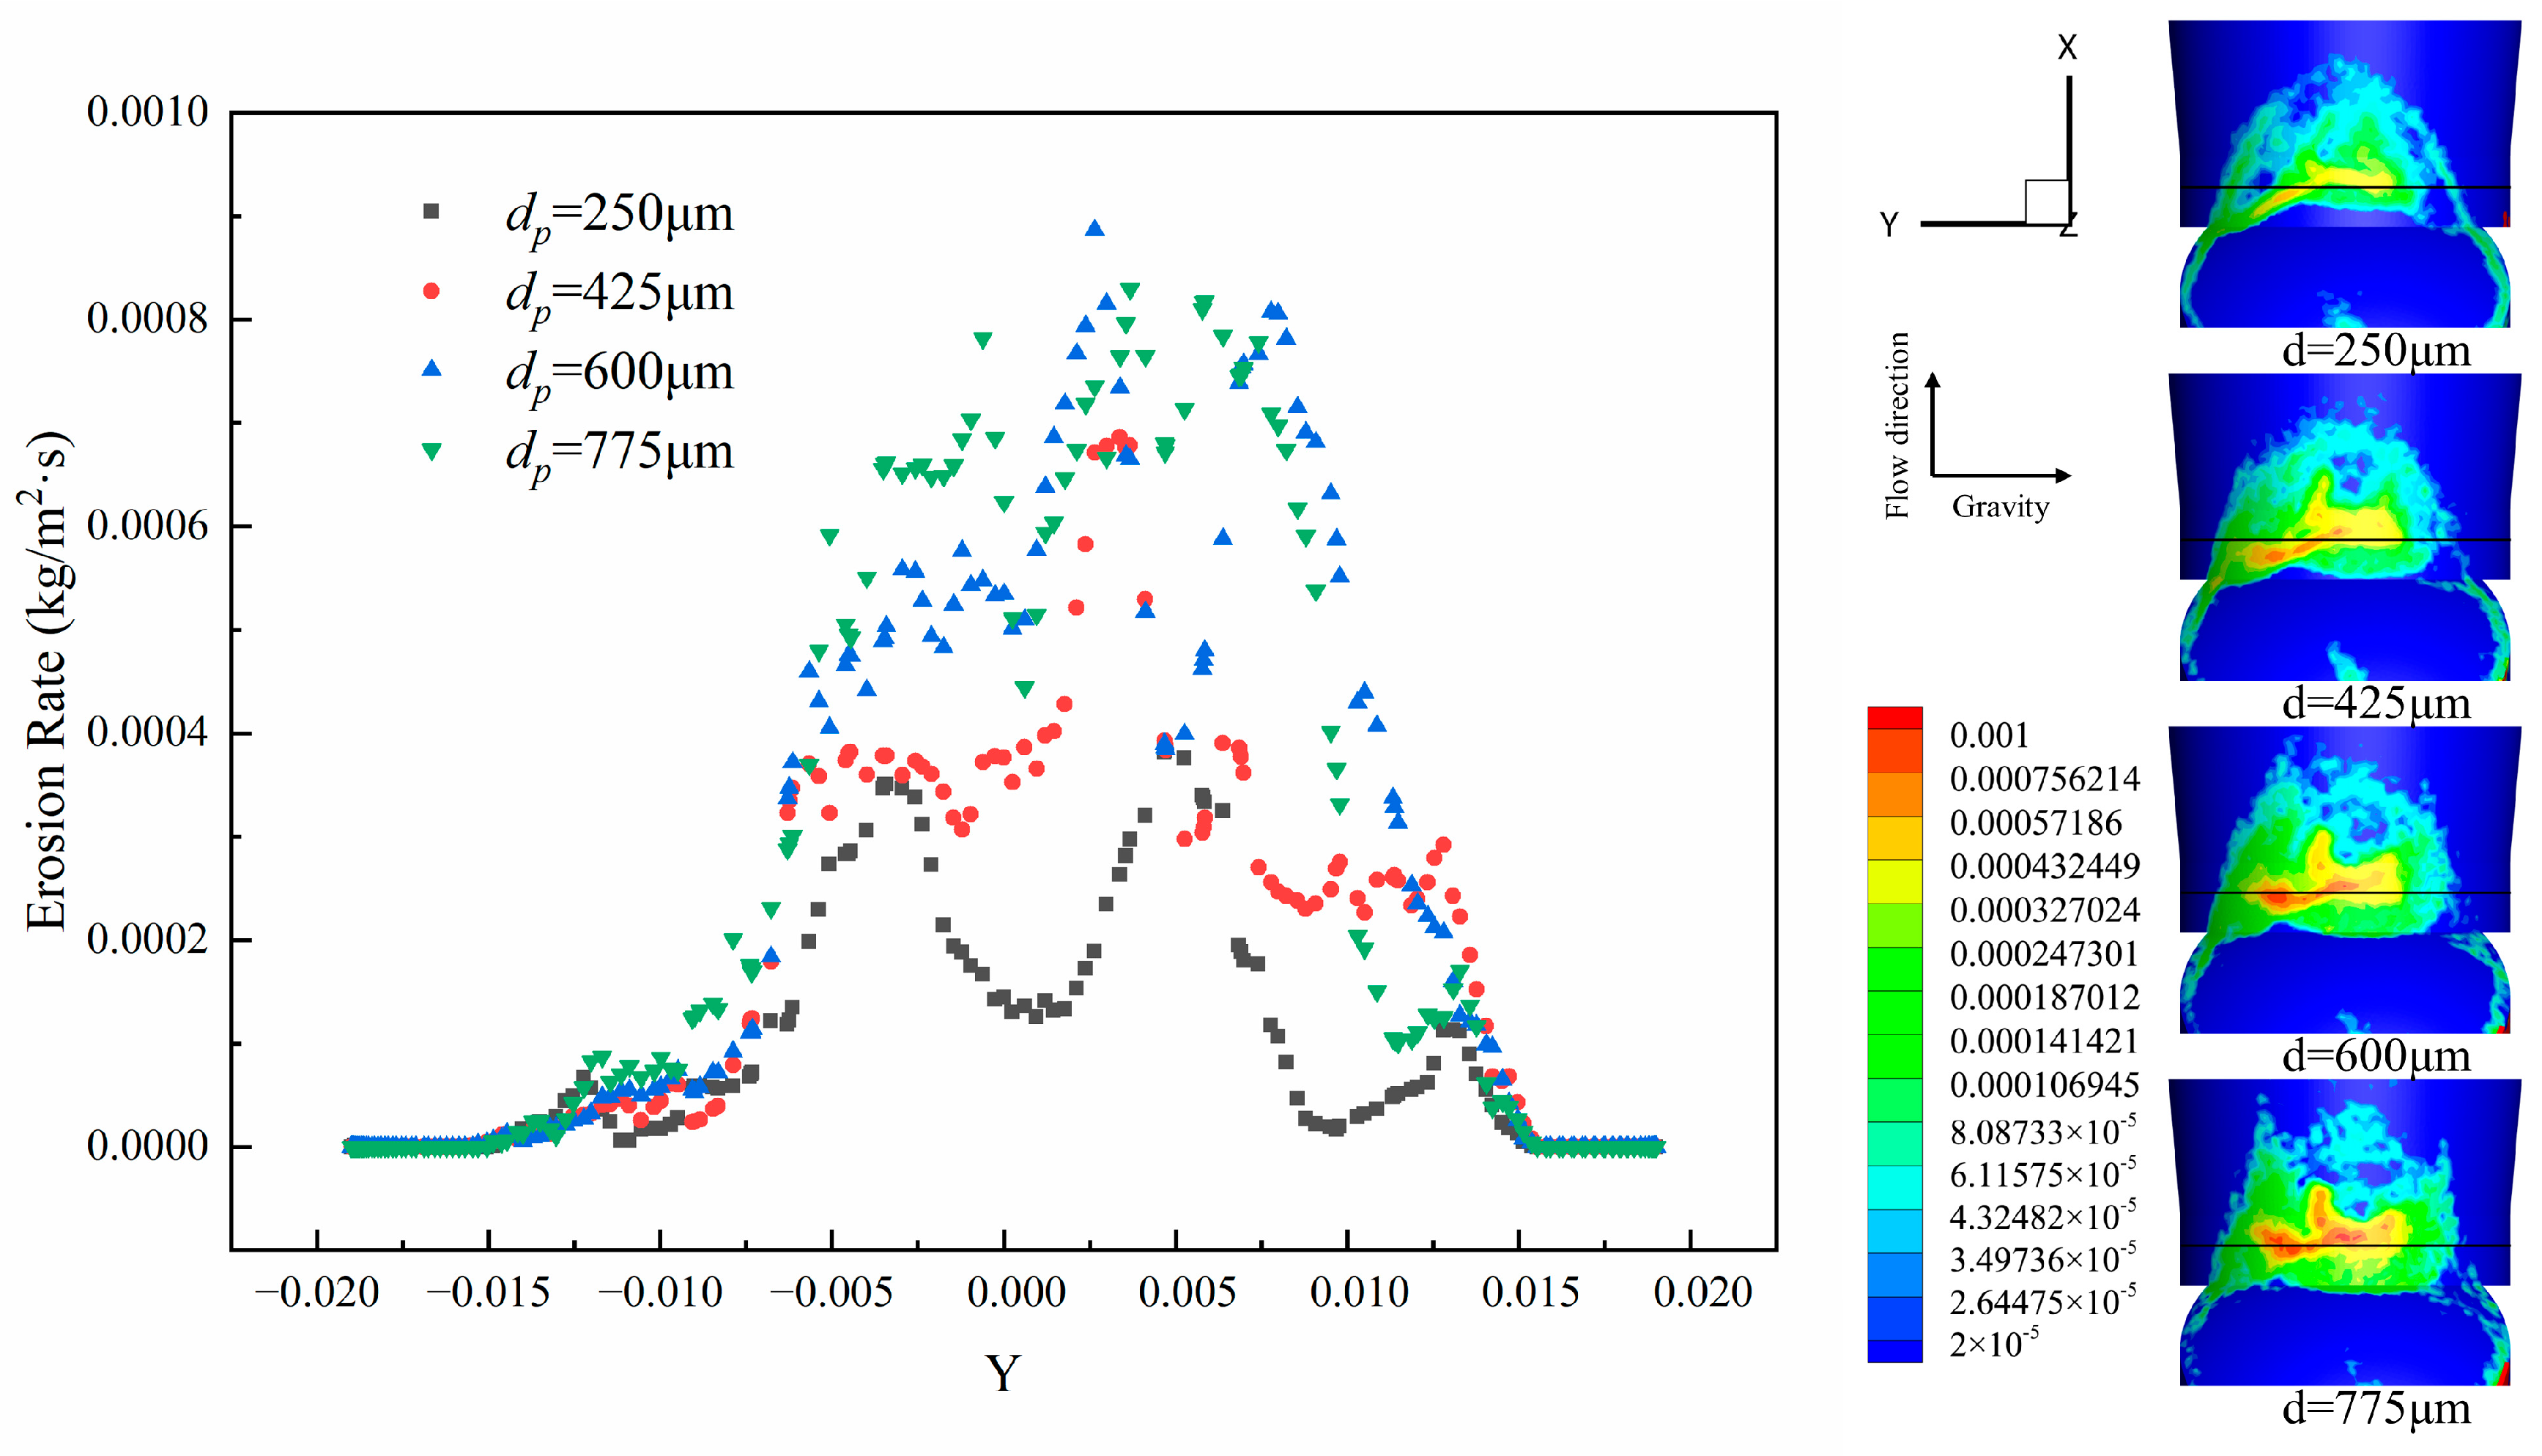
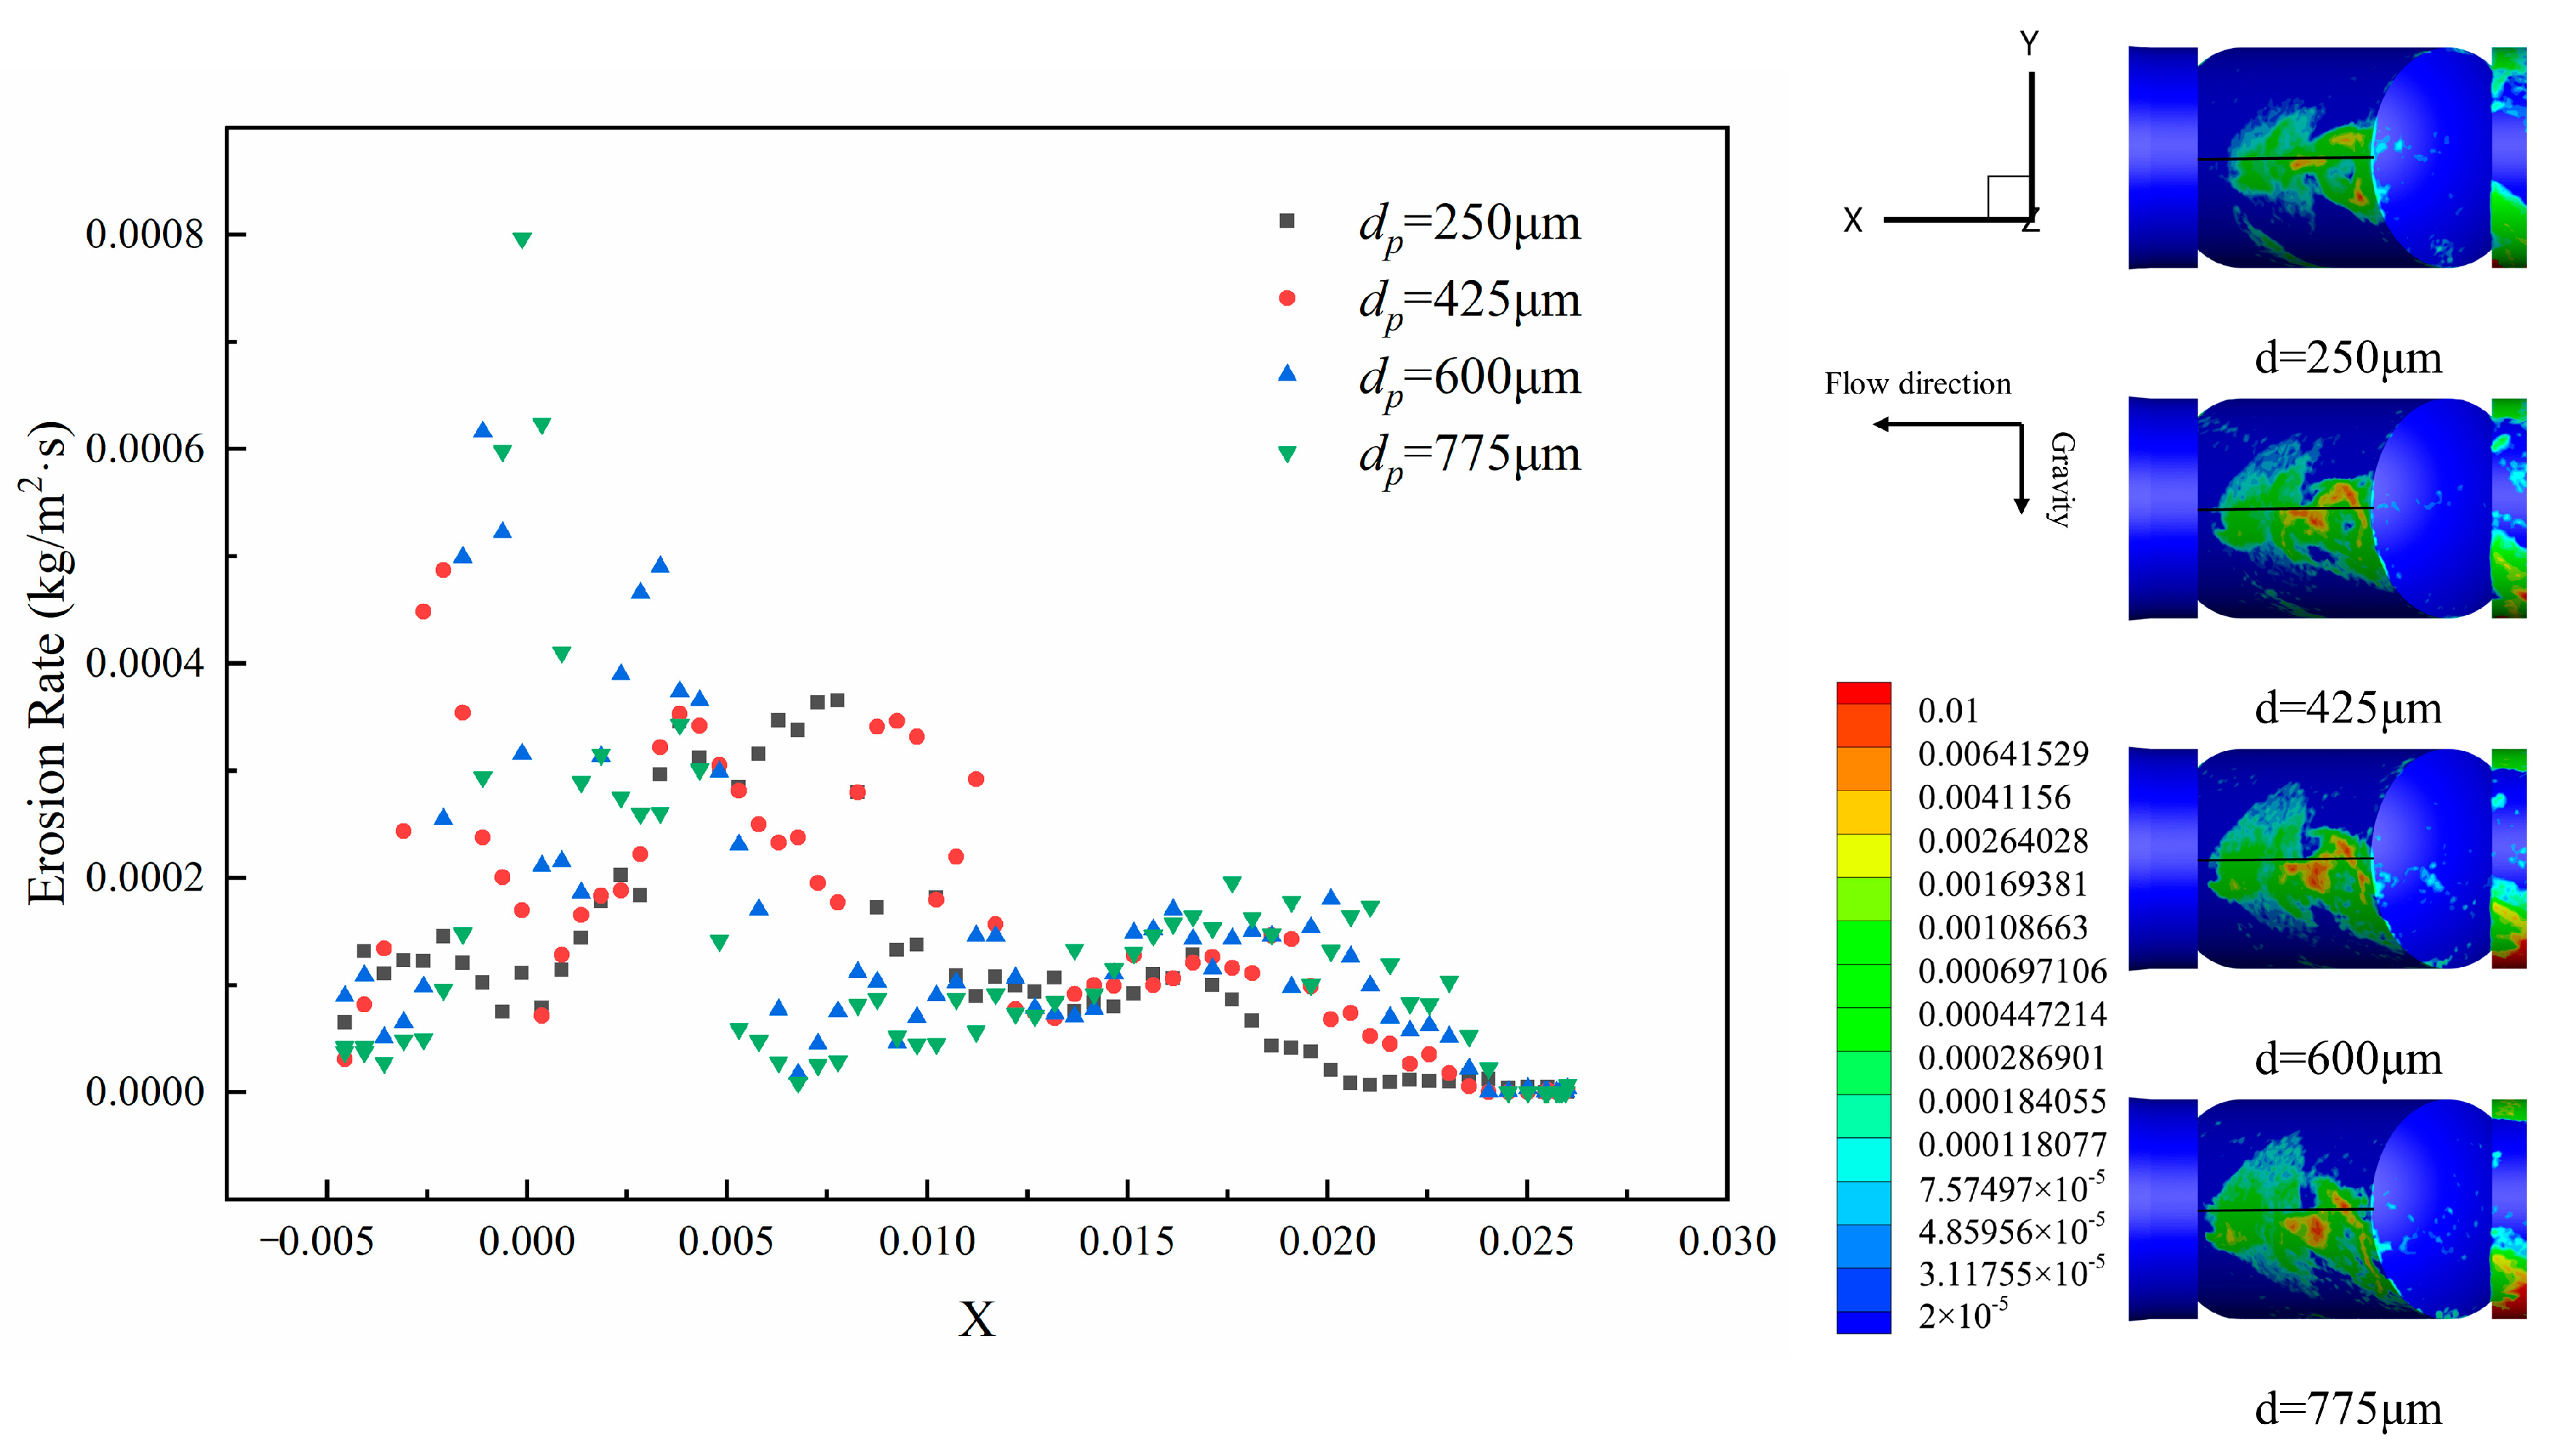
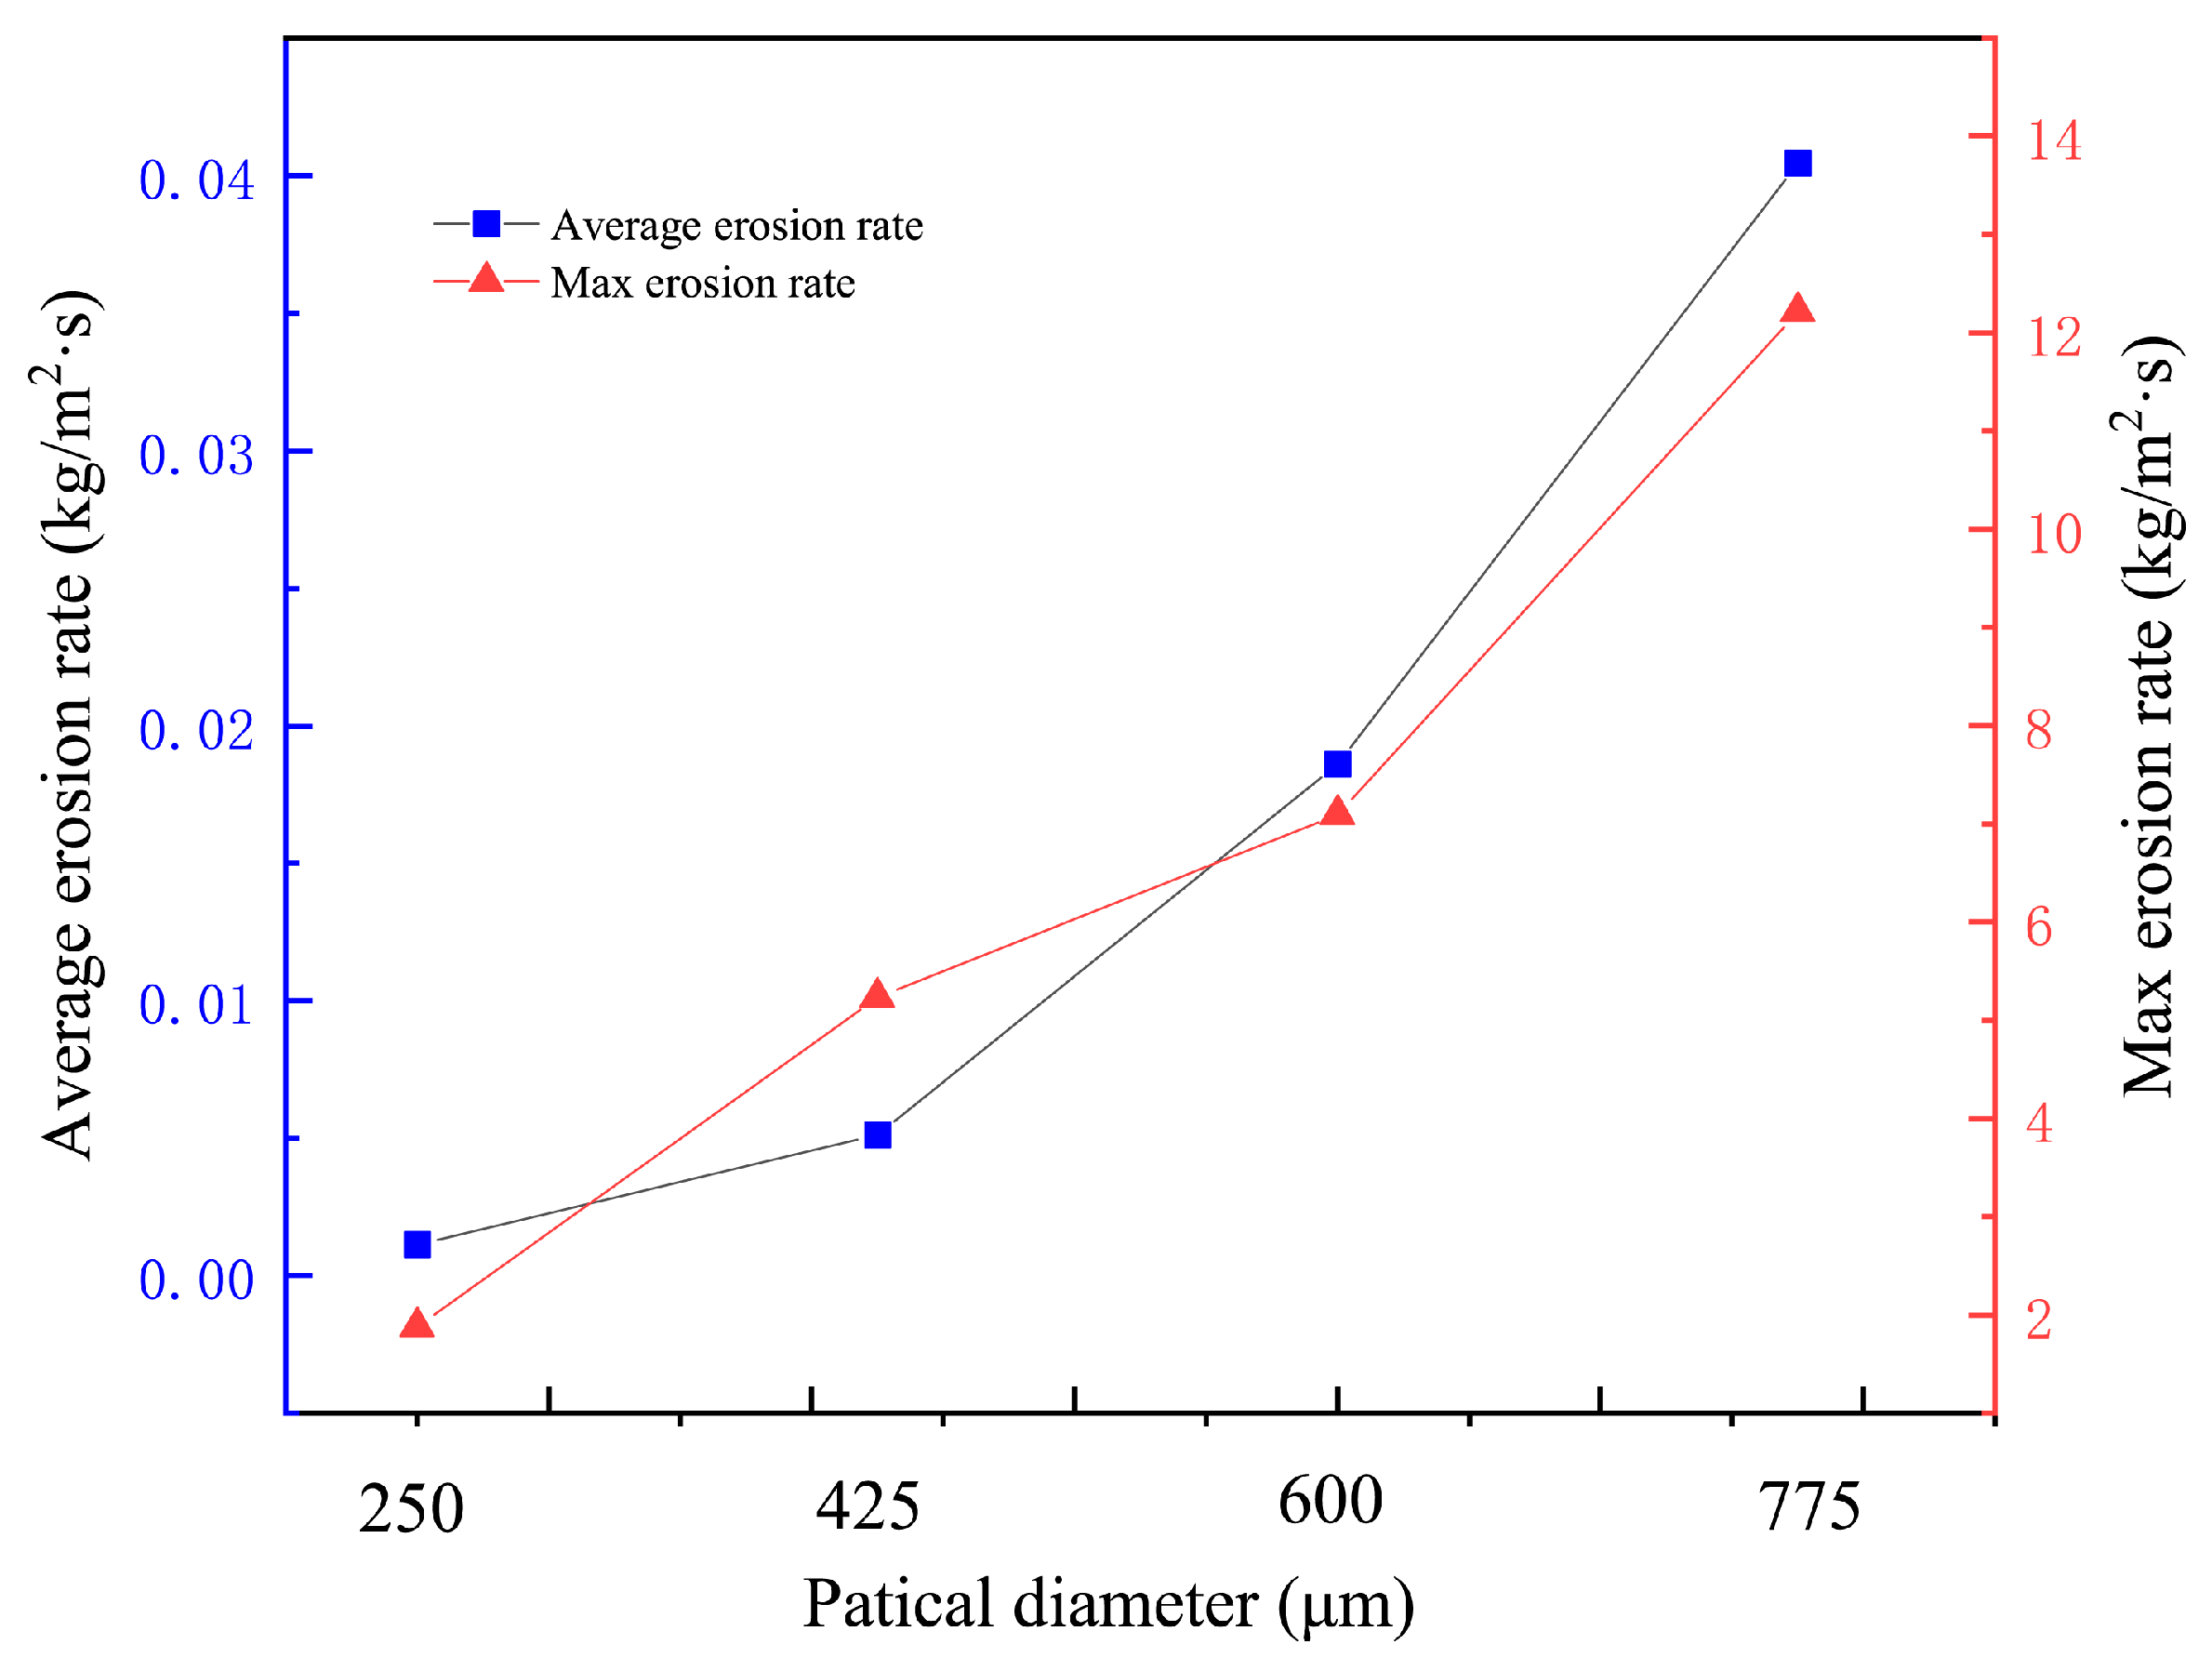
3.3. Effect of Particle Diameter on Erosion Rate Distribution

At an inlet flow velocity of V = 5 m/s and a relative opening of Cv = 40, the erosion distribution on the outer surface of the valve ball varies with different particle diameters in Figure 9. The mass fraction of particles is 0.25% of the fluid mass. Under different particle diameters, there is little variation in the distribution of erosion on the inner wall of the passage. Keeping other conditions constant, larger particle diameters correspond to greater masses and fewer particles. At the same location, the erosion rate increases with increasing particle diameter. Within a certain range of particle diameters, the influence of particle diameter variation on erosion is greater than that of particle quantity.
To further analyze the influence of particle diameter on erosion distribution in various regions of the ball valve flow passage, we selected conditions with an inlet flow velocity of V = 5 m/s and a relative opening of Cv = 40. Under these conditions, we introduced solid particles of different diameters into the fluid and extracted erosion data from four locations, shown in Figure 10, with relatively severe erosion for analysis. By comparing and analyzing the changes in erosion distribution, we studied the impact of particle diameter on wall erosion in the flow passage. Figure 10 illustrates the locations from which erosion data were extracted. In Figure 10, line A represents the midpoint of the bottom of the inlet passage; line B and line C represent the curves along half of the circumference of the valve seat on the inlet and outlet sides of the valve ball, respectively; and line D represents the midpoint of the wall surface inside the spool flow passage subjected to high-speed jet impact.
The distribution of erosion along the bottom midpoint of the inlet passage caused by particles of different diameters is depicted in Figure 11. Increasing the diameter of solid particles significantly augments the erosion rate at the same location. The region around X = −0.05 to X = −0.035 m exhibits the most severe erosion. When the particle diameter is dp = 250 μm, the maximum erosion rate is 0.036 kg/m2·s; however, when the particle diameter increases to dp = 775 μm, the maximum erosion rate reaches 9.3117 kg/m2·s. Additionally, an increase in particle diameter significantly expands the area of the passage subjected to erosion. As the particle diameter increases, the erosion area extends towards the front end of the inlet passage. At around X = −0.025 m, near the end of the inlet passage in the valve seat area, the probability of particle erosion increases due to factors such as particle rebound caused by obstruction from the outer surface of the valve ball. Influenced by the opening of the valve, the erosion distribution at the bottom of the inlet flow passage shifts towards the direction of the valve ball opening.
The erosion distribution for the valve seat on the inlet side is depicted in Figure 12. Erosion primarily occurs on both sides of the inlet, with erosion on the left side primarily caused by the migration of erosion from the bottom of the inlet passage towards the opening. The erosion rate in other areas is generally low, with the maximum erosion rate observed at dp = 775 um being only 0.0003 kg/m2·s. For the erosion distribution, solid particles mainly enter the spool flow passage from both sides of the inlet along with the fluid flow, with gravity primarily causing entry from the lower side of the valve ball opening. There is a region with a relatively high erosion rate near Y = 0.01, and the overall erosion distribution shows an increase in the erosion rate around the valve seat on the inlet side as the particle diameter increases.
The erosion distribution at the spool flow passage outlet is illustrated in Figure 13. In the outlet passage, erosion distribution forms a triangle shape, with the highest erosion rate occurring around the valve seat. Increasing the particle diameter enhances the erosion rate at the same location, but the size of the erosion area remains relatively unchanged. The erosion distribution on the valve seat follows a symmetric pattern along the X-axis, where increasing the particle diameter can increase the erosion rate at the same location. The difference in erosion distribution between particle diameters of dp = 600 μm and dp = 775 μm is minimal.
At the valve seat on the outlet side, once the particle diameter increases to a certain extent, further increases in diameter do not significantly increase the erosion rate. Based on Figure 12 and Figure 13, it is evident that the valve seat positions at the inlet and outlet of the spool flow passage are prone to particle erosion, resulting in significant erosion damage. To mitigate this damage, it is advisable to use more erosion-resistant materials for manufacturing the valve seat, which will help extend the overall lifespan of the ball valve.
In the spool flow passage, erosion in the depicted positions is caused by the collision of solid particles carried by high-speed jets with the wall surface, as shown in Figure 14. The erosion distribution is influenced by gravity, causing it to shift towards the direction of gravity. Along the midpoint, erosion at the front end is primarily caused by the direct impact of solid particles carried by high-speed jets, resulting in a higher erosion rate, while the erosion rate decreases towards the rear end. The increase in particle diameter has a minor impact on the erosion rate at the front end, and there is minimal difference in erosion distribution at the front end among particles of different diameters.
At the valve seat on the outlet side, once the particle diameter increases to a certain extent, further increases in diameter do not significantly augment the erosion rate.
Figure 15 illustrates the average erosion rate and maximum erosion rate within the flow passage of the ball valve under conditions of an inlet flow velocity of V= 5 m/s and a relative opening of Cv = 40. Both the average erosion rate and maximum erosion rate within the flow passage increase with increases in particle diameter. As the particle diameter increases from 250 μm to 775 μm, the average erosion rate within the flow passage rises from 0.001 kg/m2·s to 0.04 kg/m2·s. This increase in particle diameter significantly exacerbates the erosion damage within the flow passage.
In conjunction with the earlier conclusions, it is observed that the locations of maximum erosion rate are primarily in the upstream passage. This is attributed to the incomplete opening of the valve, resulting in some particles being unable to enter the rear portion of the passage along with the fluid flow. Increases in particle diameter significantly enhance the erosion rate at the same location and increase the area of the flow passage subjected to erosion.

4. Conclusions

Resin-based fiber-reinforced composite ball valves encounter erosion and safety issues due to the collision of solid particles in the fluid medium with the channel walls during operation. This study utilized the CFD-DPM method to investigate the two-phase flow characteristics and erosion properties of ball valves under different opening and particle size conditions. Smaller valve ball openings resulted in high-speed jets within the channel, leading to severe erosion in the side walls of the spool and outlet flow passage. As the relative opening increased, the average erosion amount in the flow passage first increased and then decreased. The maximum average erosion amount was 0.0051 kg/m2·s when the relative opening was Cv = 40. The thin edges on the outer surface of the valve ball were susceptible to erosion damage, with erosion concentrated at the junction between the erosion zone and the thin edge when the opening was small, making the thin edge more vulnerable to damage. When the relative opening was Cv = 40, increasing the particle diameter resulted in higher average erosion rates and maximum erosion rates within the flow passage. As the particle diameter increased from 250 μm to 775 μm, the average erosion rate within the flow channel rose from 0.001 kg/m2·s to 0.04 kg/m2·s. Larger particles notably increased the erosion area at the bottom of the inlet flow passage. In the spool flow passage and its inlet and outlet, increasing the particle diameter increased the erosion rate in the same location, while the erosion area did not show significant changes. During the use of GFRP valves, it is important to avoid introducing large-sized particles into the medium. Keeping the valve’s relative opening greater than Cv = 40 and using more erosion-resistant materials for the valve seat can effectively reduce erosion on the composite ball valve and extend its service life. On the basis of this study, the mechanism of fluid rheology affecting erosion damage in the flow passage at different temperatures can be further studied and analyzed.

Author Contributions

Conceptualization, Q.C. and J.Y.; methodology, Q.C. and K.P.; software, Q.C.; validation, K.P.; formal analysis, Q.C.; investigation, Y.X.; resources, J.Y.; data curation, T.Z. and B.L.; writing—original draft preparation, Q.C. and Y.X.; writing—review and editing, Q.C.; visualization, Q.C.; supervision, J.Y.; project administration, J.Y.; funding acquisition, J.Y. and Y.D. All authors have read and agreed to the published version of the manuscript.

Funding

This research was funded by the Natural Science Foundation of Hubei Province, China, grant number 2023AFC010. The funder had the following involvement with the study: conceptualization, facilities, experiments.

Data Availability Statement

The raw data supporting the conclusions of this article will be made available by the authors upon request.

Conflicts of Interest

The authors declare no conflicts of interest.

References

  1. Sotoodeh, K. Optimized Valve Stem Design in Oil and Gas Industry to Minimize Major Failures. J. Fail. Anal. Prev. 2020, 20, 634–640. [Google Scholar] [CrossRef]
  2. Lin, Z.-H.; Li, J.-Y.; Jin, Z.-J.; Qian, J.-Y. Fluid dynamic analysis of liquefied natural gas flow through a cryogenic ball valve in liquefied natural gas receiving stations. Energy 2021, 226, 120376. [Google Scholar] [CrossRef]
  3. Han, Y.; Zhou, L.; Bai, L.; Xue, P.; Lv, W.; Shi, W.; Huang, G. Transient simulation and experiment validation on the opening and closing process of a ball valve. Nucl. Eng. Technol. 2022, 54, 1674–1685. [Google Scholar] [CrossRef]
  4. Gupta, P.K.; Kumar, N.; Krishna, R. Near-wall flow characteristics in pipe bend dense slurries: Optimizing the maximum sliding frictional power. Int. J. Sediment Res. 2024, 39, 435–463. [Google Scholar]
  5. Nikeghbali, P.; Benjankar, R.; Kheirkhahan, M. Erosion under drawdown flushing with the SPH method. Ocean. Eng. 2024, 310, 118743. [Google Scholar] [CrossRef]
  6. Zheng, S.; Luo, M.; Xu, K.; Li, X.; Bie, Q.; Liu, Y.; Yang, H.; Liu, Z. Case study: Erosion of an axial flow regulating valve in a solid-gas pipe flow. Wear 2019, 434–435, 202952. [Google Scholar] [CrossRef]
  7. Moses, D.; Haider, G.; Henshaw, J. An investigation of the failure of a 1/4 ball valve. Eng. Fail. Anal. 2019, 100, 393–405. [Google Scholar] [CrossRef]
  8. Ríos-Mercado, R.Z.; Borraz-Sánchez, C. Optimization problems in natural gas transportation systems: A state-of-the-art review. Appl. Energy 2015, 147, 536–555. [Google Scholar] [CrossRef]
  9. Shan, Y.; Jing, J.; Zhang, Z.; Sun, J.; Wang, N.; Zhuang, L.; Guo, Y. Investigation of erosion behavior of particle-fluid flow in offshore platform T-pipes. Int. J. Press. Vessel. Pip. 2024, 209, 105174. [Google Scholar] [CrossRef]
  10. Rajkumar, Y.; Shirazi, S.A.; Karimi, S. Effect of pipe size on erosion measurements and predictions in liquid-dominated multiphase flows for the elbows. Wear 2023, 523, 204797. [Google Scholar] [CrossRef]
  11. Wood, R.J.K. Erosion–corrosion interactions and their effect on marine and offshore materials. Wear 2006, 261, 1012–1023. [Google Scholar] [CrossRef]
  12. Rajahram, S.S.; Harvey, T.J.; Wood, R.J.K. Erosion–corrosion resistance of engineering materials in various test conditions. Wear 2009, 267, 244–254. [Google Scholar] [CrossRef]
  13. Al-Ghezi, M.K.; Al-Amiery, A.; Kadhum, A.; Al-Azawi, R.J.; Abass, R.H. Corrosion inhibitors. A review. Int. J. Corros. Scale Inhib. 2021, 10, 54–67. [Google Scholar] [CrossRef]
  14. Sotoodeh, K. A Review and Analysis of Industrial Valve Material Failures Due to Corrosion and Proposals for Prevention Measures Based on Industrial Experiences in the Offshore Sector of the Oil and Gas Industry. J. Fail. Anal. Prev. 2020, 21, 261–267. [Google Scholar] [CrossRef]
  15. Sotoodeh, K. Choosing the Right Coating System for Offshore Valves to Prevent External Corrosion. J. Bio- Tribo-Corros. 2023, 9, 55. [Google Scholar] [CrossRef]
  16. Sotoodeh, K. Optimized material selection for subsea valves to prevent failure and improve reliability. Life Cycle Reliab. Saf. Eng. 2020, 10, 173–182. [Google Scholar] [CrossRef]
  17. Sotoodeh, K. Case study of low-alloy steel material selection for the bodies of subsea valves: Failure prevention approaches. Prog. Addit. Manuf. 2022, 8, 77–85. [Google Scholar] [CrossRef]
  18. Sotoodeh, K. A Review of Valve Stem Sealing to Prevent Leakage from the Valve and Its Effect on Valve Operation. J. Fail. Anal. Prev. 2020, 21, 9–16. [Google Scholar] [CrossRef]
  19. Rajak, D.K.; Pagar, D.D.; Menezes, P.L.; Linul, E. Fiber-Reinforced Polymer Composites: Manufacturing, Properties, and Applications. Polymers 2019, 11, 1667. [Google Scholar] [CrossRef]
  20. Raja, T.; Mohanavel, V.; Ravichandran, M.; Kumar, S.S.; Albaqami, M.D.; Alotabi, R.G.; Murugesan, M.; Lu, W. Dynamic Mechanical Analysis of Banyan/Ramie Fibers Reinforced with Nanoparticle Hybrid Polymer Composite. Adv. Polym. Technol. 2022, 2022, 1560330. [Google Scholar] [CrossRef]
  21. Raja, T.; Devarajan, Y. Visco-elastic properties and thermal analysis of corchorus/elastane yarn–reinforced biocomposites. Biomass Convers. Biorefinery 2024, 14, 15363–15372. [Google Scholar] [CrossRef]
  22. Duo, Y.; Liu, X.; Liu, Y.; Tafsirojjaman, T.; Sabbrojjaman, M. Environmental impact on the durability of FRP reinforcing bars. J. Build. Eng. 2021, 43, 102909. [Google Scholar] [CrossRef]
  23. Tafsirojjaman, T.; Fawzia, S.; Thambiratnam, D.P.; Wirth, N. Performance of FRP strengthened full-scale simply-supported circular hollow steel members under monotonic and large-displacement cyclic loading. Eng. Struct. 2021, 242, 112522. [Google Scholar] [CrossRef]
  24. Tafsirojjaman, T.; Fawzia, S.; Thambiratnam, D.P.; Zhao, X.L. FRP strengthened SHS beam-column connection under monotonic and large-deformation cyclic loading. Thin-Walled Struct. 2021, 161, 161. [Google Scholar] [CrossRef]
  25. Liu, Y.; Zhang, H.-T.; Tafsirojjaman, T.; Ur Rahman Dogar, A.; AlAjarmeh, O.; Yue, Q.-R.; Manalo, A. A novel technique to improve the compressive strength and ductility of glass fiber reinforced polymer (GFRP) composite bars. Constr. Build. Mater. 2022, 326, 126782. [Google Scholar] [CrossRef]
  26. Tafsirojjaman, T.; Fawzia, S.; Thambiratnam, D.P.; Zhao, X.-L. Study on the cyclic bending behaviour of CFRP strengthened full-scale CHS members. Structures 2020, 28, 741–756. [Google Scholar] [CrossRef]
  27. Mlela, M.K.; Xu, H.; Sun, F.; Wang, H.; Madenge, G.D. Material Analysis and Molecular Dynamics Simulation for Cavitation Erosion and Corrosion Suppression in Water Hydraulic Valves. Materials 2020, 13, 453. [Google Scholar] [CrossRef]
  28. Lin, Z.; Sun, X.; Yu, T.; Zhang, Y.; Li, Y.; Zhu, Z. Gas–solid two-phase flow and erosion calculation of gate valve based on the CFD-DEM model. Powder Technol. 2020, 366, 395–407. [Google Scholar] [CrossRef]
  29. Hu, G.; Zhang, P.; Wang, G.; Zhu, H.; Li, Q.; Zhao, S.; Qiao, K.; Wang, T. Performance study of erosion resistance on throttle valve of managed pressure drilling. J. Pet. Sci. Eng. 2017, 156, 29–40. [Google Scholar] [CrossRef]
  30. Liu, B.; Zhao, J.; Qian, J. Numerical analysis of cavitation erosion and particle erosion in butterfly valve. Eng. Fail. Anal. 2017, 80, 312–324. [Google Scholar] [CrossRef]
  31. Xu, B.; Lin, Z.; Zhu, Z.; Yu, T. Experimental and simulation study of the effect of gravity on the solid-liquid two-phase flow and erosion of ball valve. Adv. Powder Technol. 2022, 33, 103416. [Google Scholar] [CrossRef]
  32. Cui, B.; Lin, Z.; Zhu, Z.; Wang, H.; Ma, G. Influence of opening and closing process of ball valve on external performance and internal flow characteristics. Exp. Therm. Fluid Sci. 2017, 80, 193–202. [Google Scholar] [CrossRef]
  33. Cao, L.; Liu, S.; Hu, P.; Si, H. The influence of governing valve opening on the erosion characteristics of solid particle in steam turbine. Eng. Fail. Anal. 2020, 118, 104929. [Google Scholar] [CrossRef]
  34. Liu, X.; Ji, H.; Min, W.; Zheng, Z.; Wang, J. Erosion behavior and influence of solid particles in hydraulic spool valve without notches. Eng. Fail. Anal. 2020, 108, 104262. [Google Scholar] [CrossRef]
  35. Mao, Y.; Kong, Y.; Guan, M. GPU-accelerated SPH modeling of flow-driven sediment erosion with different rheological models and yield criteria. Powder Technol. 2022, 412, 118015. [Google Scholar] [CrossRef]
  36. Zhang, Y.; Reuterfors, E.P.; McLaury, B.S.; Shirazi, S.A.; Rybicki, E.F. Comparison of computed and measured particle velocities and erosion in water and air flows. Wear 2007, 263, 330–338. [Google Scholar] [CrossRef]
  37. Zhao, H. Improved Erosion Wear Model for Wind Turbine Blade Coatings. Master’s Thesis, Lanzhou University of Technology, Lanzhou, China, 2024. [Google Scholar]
  38. Niu, J.; Wang, S.; Li, J.; Tan, H. Experiment of particle rebound characteristics for impingement on resin coated /Al/alloysteel plate. J. Aerosp. Power 2018, 33, 928–935. [Google Scholar] [CrossRef]
  39. Liu, G. Study on the Erosion Wear of the GFRP Impacted by Air Flow Containing Sand. Master’s Thesis, Hefei Polytechnic University, Hefei, China, 2013. [Google Scholar]
  40. Liu, X.q.; Liu, F.; Ji, H.; Li, N.; Wang, C.; Lin, G. Particle erosion transient process visualization and influencing factors of the hydraulic servo spool valve orifice. Flow Meas. Instrum. 2023, 89, 102273. [Google Scholar] [CrossRef]
Figure 1. Internal structure of GFRP ball valve.
Machines 12 00541 g001
Figure 2. Flow passage structure.
Machines 12 00541 g002
Figure 3. Simulation and experimental comparison of erosion rates.
Machines 12 00541 g003
Figure 4. Grid unrelated validation. (a) Grid and outlet path; (b) comparison of velocity on line AB for different grid numbers.
Machines 12 00541 g004
Figure 5. Velocity and relative total pressure distributions under different relative openings.
Machines 12 00541 g005
Figure 6. Erosion rate distribution under different relative openings.
Machines 12 00541 g006
Figure 7. Erosion rates under different relative openings.
Machines 12 00541 g007
Figure 8. Erosion distribution on inlet side spool surface.
Machines 12 00541 g008
Figure 9. Erosion rate distributions under different particle diameters.
Machines 12 00541 g009
Figure 10. Schematic of extraction locations of erosion rate data.
Machines 12 00541 g010
Figure 11. Erosion rate distribution of extraction location A.
Machines 12 00541 g011
Figure 12. Erosion rate distribution of extraction location B.
Machines 12 00541 g012
Figure 13. Erosion rate distribution of extraction location C.
Machines 12 00541 g013
Figure 14. Erosion rate distribution of extraction location D.
Machines 12 00541 g014
Figure 15. Erosion rate under different particle diameters.
Machines 12 00541 g015
Table 1. Parameters for erosion model.
nlkR1R2R3R4R5
1.7653.062881.26 × 10−83.087−8.0278.477−3.9090.672
Disclaimer/Publisher’s Note: The statements, opinions and data contained in all publications are solely those of the individual author(s) and contributor(s) and not of MDPI and/or the editor(s). MDPI and/or the editor(s) disclaim responsibility for any injury to people or property resulting from any ideas, methods, instructions or products referred to in the content.

