Article

Assessment of the Uniform Wear Bending Strength of Large Modulus Rack and Pinion Pair: Theoretical vs. Experimental Results

1
Hubei Key Laboratory of Hydroelectric Machinery Design and Maintenance, China Three Gorges University, Yichang 443002, China
2
College of Mechanical & Power Engineering, China Three Gorges University, Yichang 443002, China
*
Author to whom correspondence should be addressed.
Machines 2024, 12(8), 570; https://doi.org/10.3390/machines12080570
Submission received: 24 July 2024 / Revised: 15 August 2024 / Accepted: 18 August 2024 / Published: 19 August 2024
(This article belongs to the Section Machine Design and Theory)

Abstract

:
Due to long-term operation under low-speed and heavy-load conditions, large module gears and racks are inevitably subject to tooth surface wear. To investigate the changes in gear tooth bending strength, the Three Gorges ship lift was taken as the research object and a simulation test bench was established. An analytical method, a finite element method, and an experimental method were utilized to analyze the bending stress of gears under normal and various uniform wear conditions. The obtained results revealed that with the increase in wear degree and load, the bending stress of single-tooth meshing was significantly higher than that of double-tooth meshing, and the single-tooth meshing time also increased, which indicates that gear wear accelerated the process of performance degradation. Furthermore, the relative errors obtained by the three calculation methods were all at a low level. This investigation aims to provide a solid theoretical and experimental basis for the dynamic analysis of large module gear and rack transmission.

1. Introduction

As the largest and most technically difficult ship lift in the world at present [1], the Three Gorges ship lift possesses the main characteristics of high lifting weight, low speed, high lift, large range of navigable water level upstream and downstream, and fast variability of the water level. Such a superstructure is mainly driven by four sets of open rack-and-pinion with a large modulus as the main transmission mechanism. As a result, the coupling between system components is increasingly enhanced, and the service environment and operating conditions are becoming more and more complex [2]. Under the influence of repeated long-term alternating stress, the working surface of the rack-and-pinion contact is prone to wear, pitting, peeling, cracking, and other damage, which can potentially damage the entire tooth surface or the breakage of gear teeth, resulting in transmission failure [3]. According to a survey report by Wollhofen in Germany, 18.2% of the transmission failure of open gears is caused by severe wear [4].
Li and Geng [5] proposed a finite element method (FEM)-based gear-bending stress analysis method that was applied to spatial mesh multi-gear teeth. Ko et al. [6] compared the bending stresses calculated by the FEM with various backup ratios and root filler radii with the stresses calculated by standard codes. Saribay [7] compared the bending stresses of spur gear teeth calculated by the FEM with standard spur gear stress formulas. Yu et al. [8] verified the correctness of the tooth-bending stress calculation method by simulation comparison analysis, which has important guiding importance for further research on high-speed composite transmission curved gears. Pedersen [9] showed that the bending stress could be remarkably reduced by employing asymmetric gear teeth and optimizing the gear shape through changes in the tool geometry. All of the above-mentioned investigations have mainly focused on gear pairs, but there is rare existing literature on pinion and rack with large modules. Cheng et al. [10,11] developed a connectivity criterion based on the stress intensity factor analysis for double cracks and inclusions to examine the residual fatigue life of a surface-quenched large modulus rack and a theoretical formula for the design of the layout of a fully balanced hoist vertical ship lift to ensure the stability. Yan et al. [12] investigated the bending strength and fatigue damage degree of the gear rack drive lifting mechanism of the riprap leveling ship in the Hong Kong–Zhuhai–Macao Bridge construction project. To this end, they proposed a safety assessment approach for the lifting mechanism damage; however, the bending stress of the gear tooth root with different wear degrees was not defined. Zhou et al. [13] proposed a time-varying mesh stiffness (TVMS) model of a modified gear-rack drive with tooth friction and wear. Tao et al. [14] established a three-dimensional linear contact hybrid elasto-hydrodynamic lubrication model of the open gear-rack drive mechanism. Although some mechanical aspects of the large module rack-and-pinion were examined, the bending stress of the rack-and-pinion was not taken into account.
The rack of the Three Gorges ship is engineered for a 70-year lifespan [15]. Through the use of induction hardening, steel casting creates a hardened layer on the tooth surface that reaches a depth of up to 9 mm [16], which in general is a complicated process [17]. The rack is less prone to damage than the gear in the process of meshing transmission [18]. In similar rack-and-pinion hoisting platforms with large modules such as Longyuan Zhenhua No. 3 [19], the world’s largest wind power construction platform, and Shengli No. 5 jack-up workover platform [20], the life designed for the rack is much longer than that of the gear. Therefore, the analysis of the wear mechanism and the bending strength of the gear tooth root in the lifting mechanism has more academic importance and engineering application value.
“Low speed” and “high speed” are relative terms in mechanical transmission. In this context, low speed usually refers to speeds below a few hundred rounds per minute. For example, low-speed motors typically operate at speeds below 1000 rpm [21]. Conversely, high speed usually refers to speeds of several thousand rpm or more. For example, high-speed rotating shafts typically operate at speeds over 3000 rpm [22]. Poor lubrication can exacerbate wear [23,24], which in turn may lead to cracking, pitting, and other forms of failure [25,26,27] that remarkably affect the fatigue life [28,29]; however, their interactions were not considered here. In the present work, the rack-and-pinion transmission pair of the Three Gorges ship lift was taken as the research object, and a test bench was constructed to simulate the working conditions of the vertical rack-and-pinion hoisting mechanism, which is commonly represented as a typical low-speed mechanism. Excluding lubrication issues, the variations in related parameters such as the load along the tooth profile and the gear tooth thickness after wear were methodically examined with the modified gear approach. The bending stresses of the tooth root of the normal gear, 1/12 worn gear, 1/6 worn gear, and 1/4 worn gear were evaluated analytically: numerically via FEM simulations, and experimentally by performing tests. The main goal was to examine the bending stress change and the response characteristics of the rack-and-pinion transmission system under complex conditions.
This study established a test bench to simulate the conditions of the vertical rack-and-pinion hoisting mechanism, analyzing parameters such as the load distribution and gear tooth wear effects. The initial setup involved defining the rack-and-pinion system parameters including the material properties, geometrical dimensions, and operating conditions such as load and speed. Based on the established theoretical background, mathematical modeling was conducted by introducing the uniform worn gear model, analyzing the variation of gear parameters under different wear conditions, the circumferential load distribution along the tooth profile, the tooth engagement distribution, and theoretical stress calculations. This integrated approach combined experimental data and theoretical models, which were further simulated using FEM to analyze the stress distribution under various operating conditions, providing a novel perspective on rack-and-pinion transmission performance in the presence of complex conditions.
To ensure the accuracy and reliability of different approaches, these were appropriately compared and validated. To this end, various approaches including theoretical calculations, FEM simulations, and experiments were utilized to analyze tooth root bending stresses, providing a comprehensive understanding of the wear effects and system response. These advanced insights and breakthrough numerical algorithms play a crucial role in improving the fault detection and condition monitoring of this and similar systems (such as rolling bearings) [30,31,32,33,34,35], providing a solid foundation for data analysis. The results were thoroughly analyzed to understand the impact of different variables on the system performance, leading to conclusions that can be applied to analogous cases. Finally, this study introduced an improved gearing method, which was validated through detailed experiments and simulations, also presenting a novel approach for the optimization of similar engineering systems. An application guide is provided to apply this method to other cases including potential modifications to suit various operating conditions or gear systems.

2. Large Module Rack-and-Pinion Hoisting Mechanism Experimental Platform

2.1. Introduction of Lifting Structure

The structural diagram and specific structure of the working condition simulation test bench are illustrated in Figure 1.
Two sets of vertical rack-and-pinion transmission systems were placed on the simulated lifting platform, which was raised and lowered by two sets of transmission chains consisting of a motor, torque meter, and bevel gear planetary reducer. To accurately ensure the horizontal position of the platform in the lifting process, the operating parameters of the motor and the rigid connection of the bevel gear shaft were controlled by a PLC to further guarantee the synchronous operation of the system. The hydraulic loading device was located in the middle of the lifting platform, and the tensioner was placed on the top of the cylinder. The pressure sensor was also appropriately embedded to detect the stress of the hydraulic system in real-time. The motor speed, steering as well as hydraulic cylinder expansion direction and pressure were controlled by the PLC-based control panel. The stability of the outer side of the rack support column was enhanced through the triangular truss steel structure, and was ensured by connecting the top of the column with the box girder, which enhanced the overall stiffness and stability of the structure.

2.2. Introduction to Design Parameters

The material 40Cr, characterized by strong wear resistance and superior stiffness, was utilized for the gear rack and is applicable to the test environment of gear racks with a large modulus. The main material properties of the gear rack are given in Table 1.
The design parameters of the test bench for the lifting mechanism of the gear and rack of the ship lift are presented in Table 2. The brackets are part of the parameters of the gear and rack of the Three Gorges ship lift.

3. Theoretical Calculations of the Bending Strength

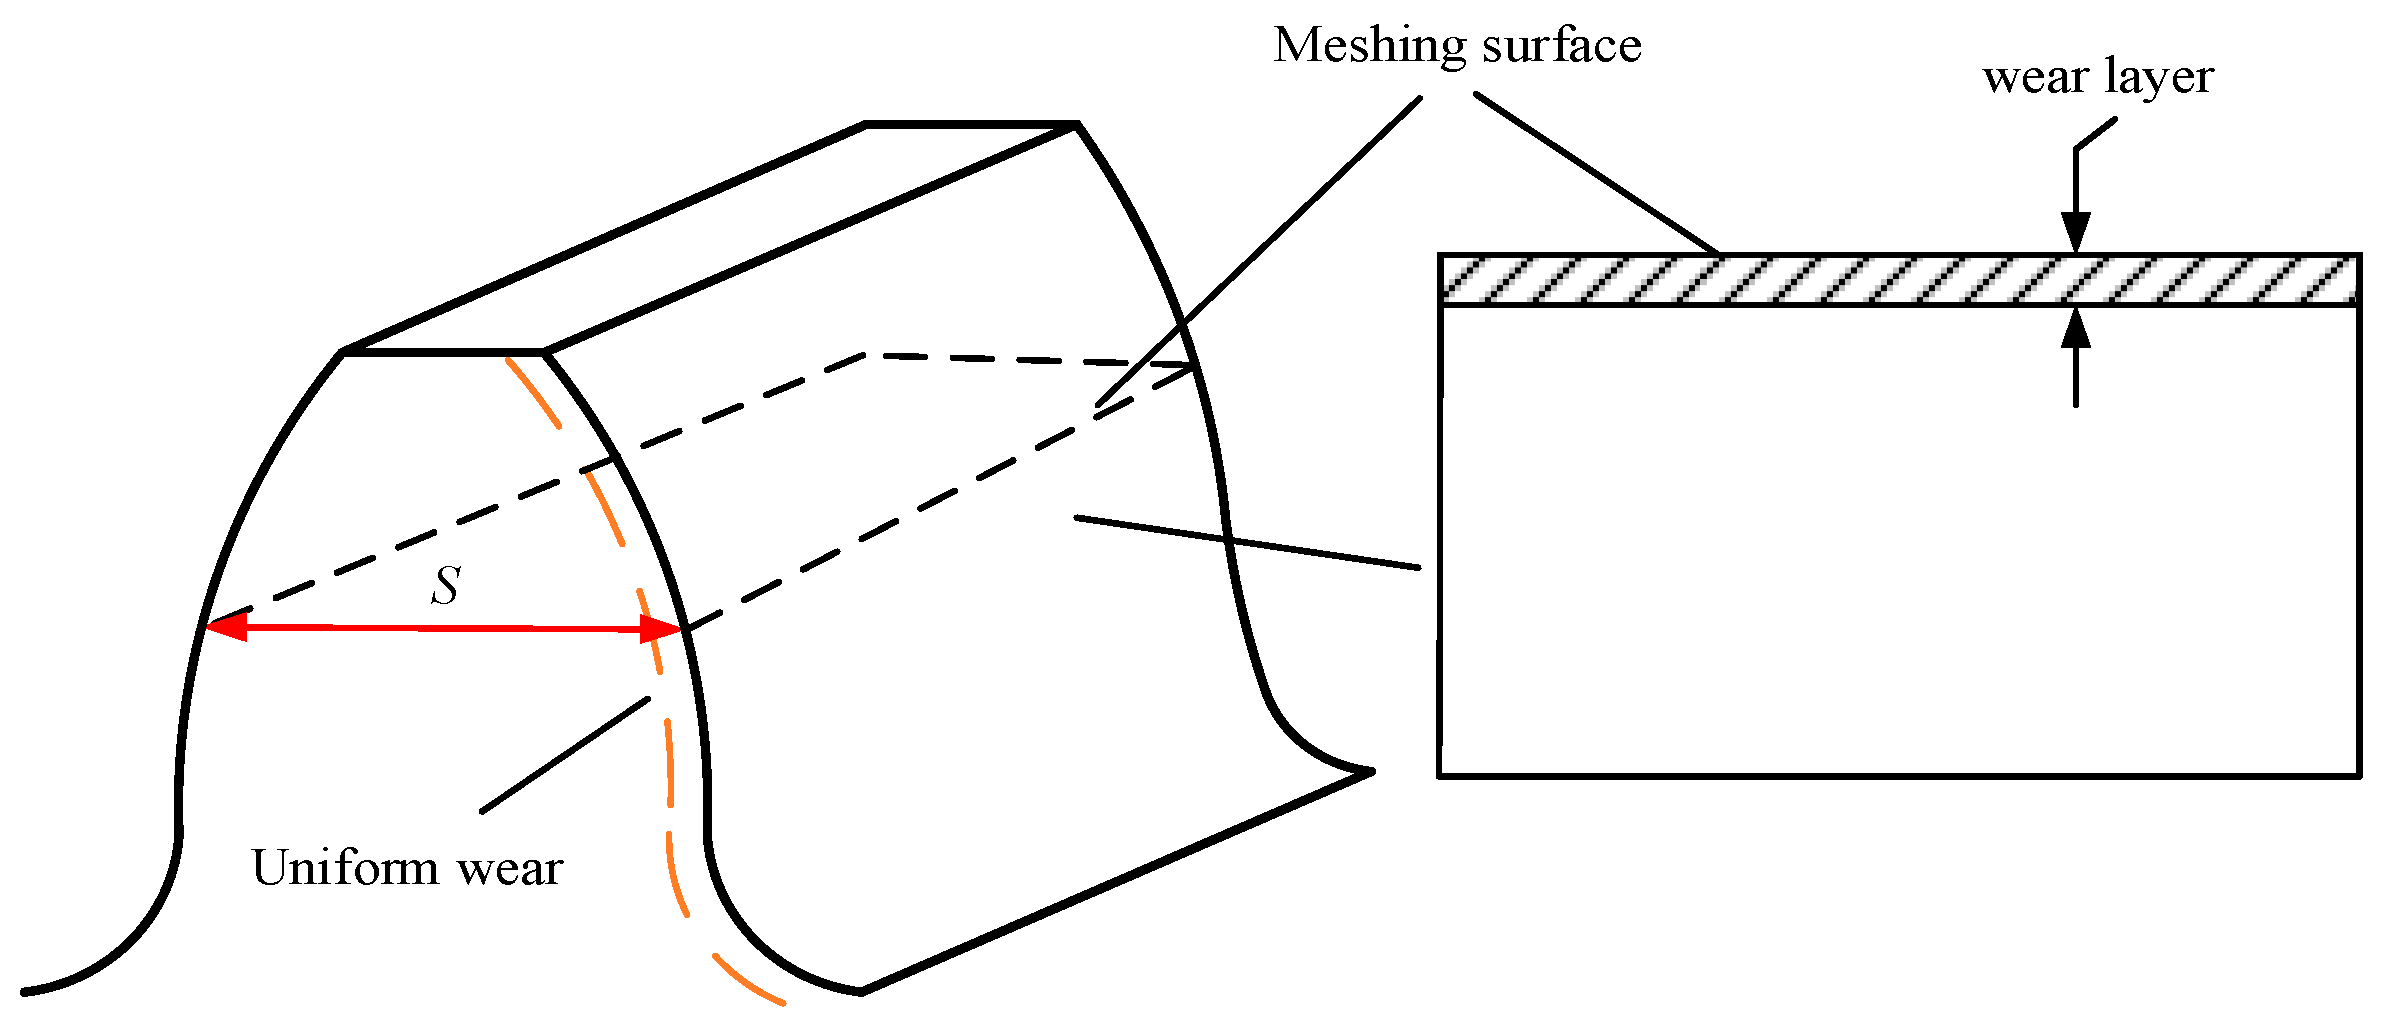
3.1. Introduction of the Gear Uniform Wear

The thickness of the gear tooth is mainly influenced by wear. Uniform wear means that all tooth thicknesses of gear S change in the same way [36]. This paper examined the uniform wear of gears by selecting different modification coefficients, as illustrated in Figure 2.
In this condition, modulus m , reference diameter d 1 , reference pitch P , and pressure angle α of the worn gear do not vary. However, wear will cause changes in several parameters including the contact ratio ε α , contact ratio coefficient Y ε , stress correction coefficient Y s a , and tooth form factor Y F a as the load is applied on the top of the teeth [37].

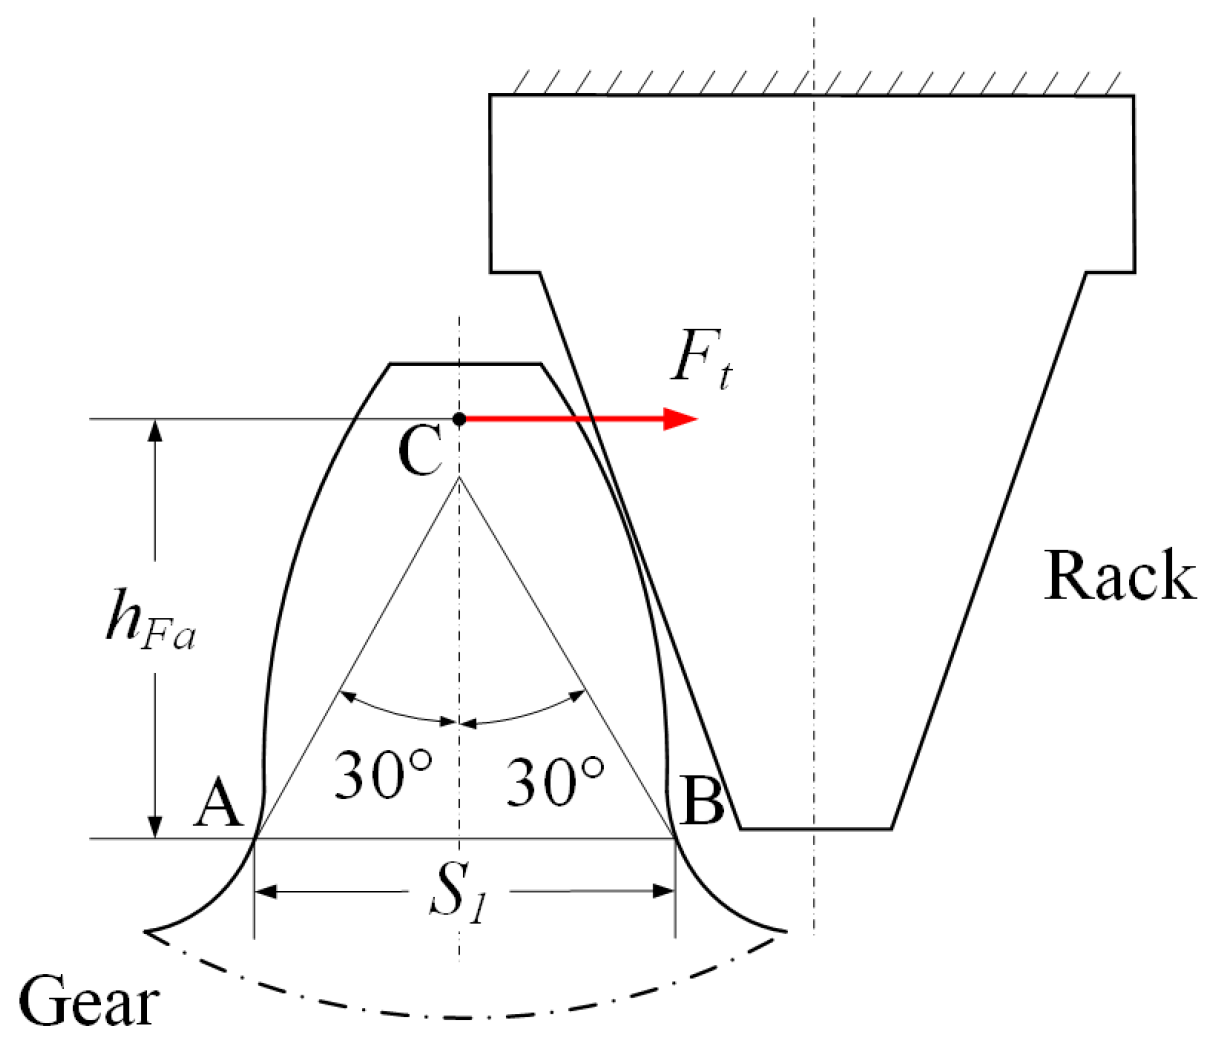
3.2. Calculation of the Bending Stress Parameters for Worn Gear

The bending stress of the gear ( σ F ) can be calculated by [38]:
σ F = K F F t Y F a Y s a Y ε b 1 m
where K F represents the load factor, F t is the circle force, Y F a is the tooth form factor, b 1 is the gear tooth width whose value is provided in Table 2, Y s a denotes the stress correction coefficient, Y ε is the contact ratio coefficient when the load acts on the tooth tip, and m is the gear module.
Since the gear is not completely rigid in the process of gear transmission, the load F t along the tooth’s profile is not constant [39]. The circle force distribution of the gear is presented in Figure 3, where B 1 C and D B 2 denote the double-tooth meshing, and C D represents the single-tooth meshing.
In general, F t varies in the direction of the tooth profile, which is mainly affected by the load distribution caused by the alternation of both the single and double teeth during the meshing process.
According to Ref. [40], the load factor ( K F ) can be evaluated by:
K F = K A K v K α K β
where K A represents the service factor, which is taken as 1.1; K V denotes the dynamic factor, which is taken as 1.1; K β is the tooth load distribution coefficient, which is taken as 1.1 [38]; and finally, K α signifies the inter-tooth load distribution coefficient. Between two pairs of teeth, its value varies periodically with gear meshing, the sum of which is 1. It can be calculated as follows [41,42]:
K α = cos [ b 0 ( ξ ξ m ) ] cos [ b 0 ( ξ ξ m ) ] + cos [ b 0 ( ξ + 1 ξ m ) ] ( B 1 C ,   D B 2   segment   double - tooth   meshing ) 1 ( C D   segment   single - tooth   meshing )
where ξ , ξ m , and b 0 denote the tooth profile parameters, which can be calculated in the following form:
ξ = Z 1 2 π r i 2 r b 2 1
ξ m = Z 1 2 π r f 2 r b 2 1 + ε α 2
b 0 = [ 1 2 ( 1 + ε α 2 ) 2 1 ] 1 2
where r f represents the radius of the dedendum circle; ε α signifies the contact ratio of the rack-and-pinion pair; r b is the radius of the base circle; Z 1 denotes the number of gear teeth; r i is the meshing radius [43], which is the distance from the contact position of the rack-and-pinion to the center of the gear. The meshing radius is divided into three intervals according to the change of single- and double-tooth meshing. The wear will lead to a change in the contact ratio between the rack-and-pinion, which affects the change in the endpoints of the meshing interval of the single and double teeth in the meshing process. The schematic diagram of the division of the meshing interval between the single and double tooth of the rack-and-pinion pair is illustrated in Figure 4. Wear could cause changes in the gear and rack meshing accuracy, which in turn affects the meshing intervals of single and multiple teeth. Additionally, the meshing radius values within these intervals may also change. The meshing radius division is also presented in Table 3.
The change in the inter-tooth load distribution coefficient ( K α ) of meshing tooth pair 1 ( K α 1 ) and meshing tooth pair 2 ( K α 2 ) during meshing can be obtained from Equation (3), as demonstrated in Figure 5. With the increase in wear degree, the single-tooth meshing expanded, while the double-tooth meshing shrunk.
Apart from being influenced by the tooth profile and inter-tooth load distribution coefficient, the force F t is also affected by the surface roughness and lubrication conditions [44,45,46]. However, these influencing factors will not be addressed in this paper.
The tooth form factor ( Y F a ) can be determined by the inscribed parabola method and the 30° tangent method [47], of which the latter is more common in the relevant literature. The expression of this factor is provided in Equation (7). On the basis of the 30° tangent method, the force diagram of the tooth profile is illustrated in Figure 6.
Y F a = 6 h F a m cos α a 1 S 1 m 2 cos α
where h F a represents the bending arm; S 1 is the tooth thickness in the dangerous section of the gear; α signifies the pressure angle of the reference circle. Furthermore, α a 1 denotes the pressure angle of the addendum circle and can be calculated by Equation (8):
α a 1 = m Z 1 cos α m Z 1 + 2 m ( h a + X )
where X represents the modification coefficient and h a denotes the addendum height.
In addition, Y s a can be stated by:
Y s a = 1.2 + 0.16 S 1 h F a ( S 1 2 r ρ f ) ( 1 1.2 + 2.1 h F a / S 1 )
where r ρ f represents the radius of curvature of the corner in the dangerous section of the gear, which can be obtained from Equation (10):
r ρ f = 0.375 m
Y ε can be formulated as:
Y ε = 0.25 + 0.75 ε α
where ε α denotes the contact ratio of the rack-and-pinion pair, which can be formulated as:
ε α = ( 1 / 2 π ) [ Z 1 ( tan α a 1 tan α ) + ( 4 ( h a * X T / m ) / sin 2 α ) ]
In Equation (12), α represents the pressure angle of the reference circle after gear wear and is equal to the value of α ; h a * denotes the addendum height coefficient with the standard value of 1, and its value before and after wear remains unchanged; T signifies the installation error, which is taken as zero because the rack-and-pinion pair here benefits from the standard installation.
Furthermore, X can be described as:
X = S 1 ( P / 2 ) 2 m tan α
where P is the pitch of the reference circle, which is given by P = π m .
According to the concept of “using small fetch big” [48], the bending stress of the tooth root ( σ F ) is inversely proportional to b m when the circular force F t on the gear teeth remains constant. When the tooth width of the gear ( b 1 ) is reduced by n times and the modulus m by t times, the applied load magnitude should be 1 / n t of the original one to obtain a similar bending stress of the tooth root. Therefore, the relationship between the circular force applied by the gear and rack lifting mechanism in the laboratory ( F t ) and the actual load of the Three Gorges ship lift ( F t ) can be stated by:
F t = F t n t
The load of the Three Gorges ship lift ( F t ) and the applied load of the bending strength of the test bench ( F t ) are presented in the third and sixth columns of Table 4. As can be seen, the six working conditions of the Three Gorges ship lift are introduced by the first and second columns, whereas the load conditions of the test bench under each working condition are displayed in the fourth and fifth columns.
The relevant parameters for calculating the bending stress of the tooth root of worn gear are presented in Table 5.

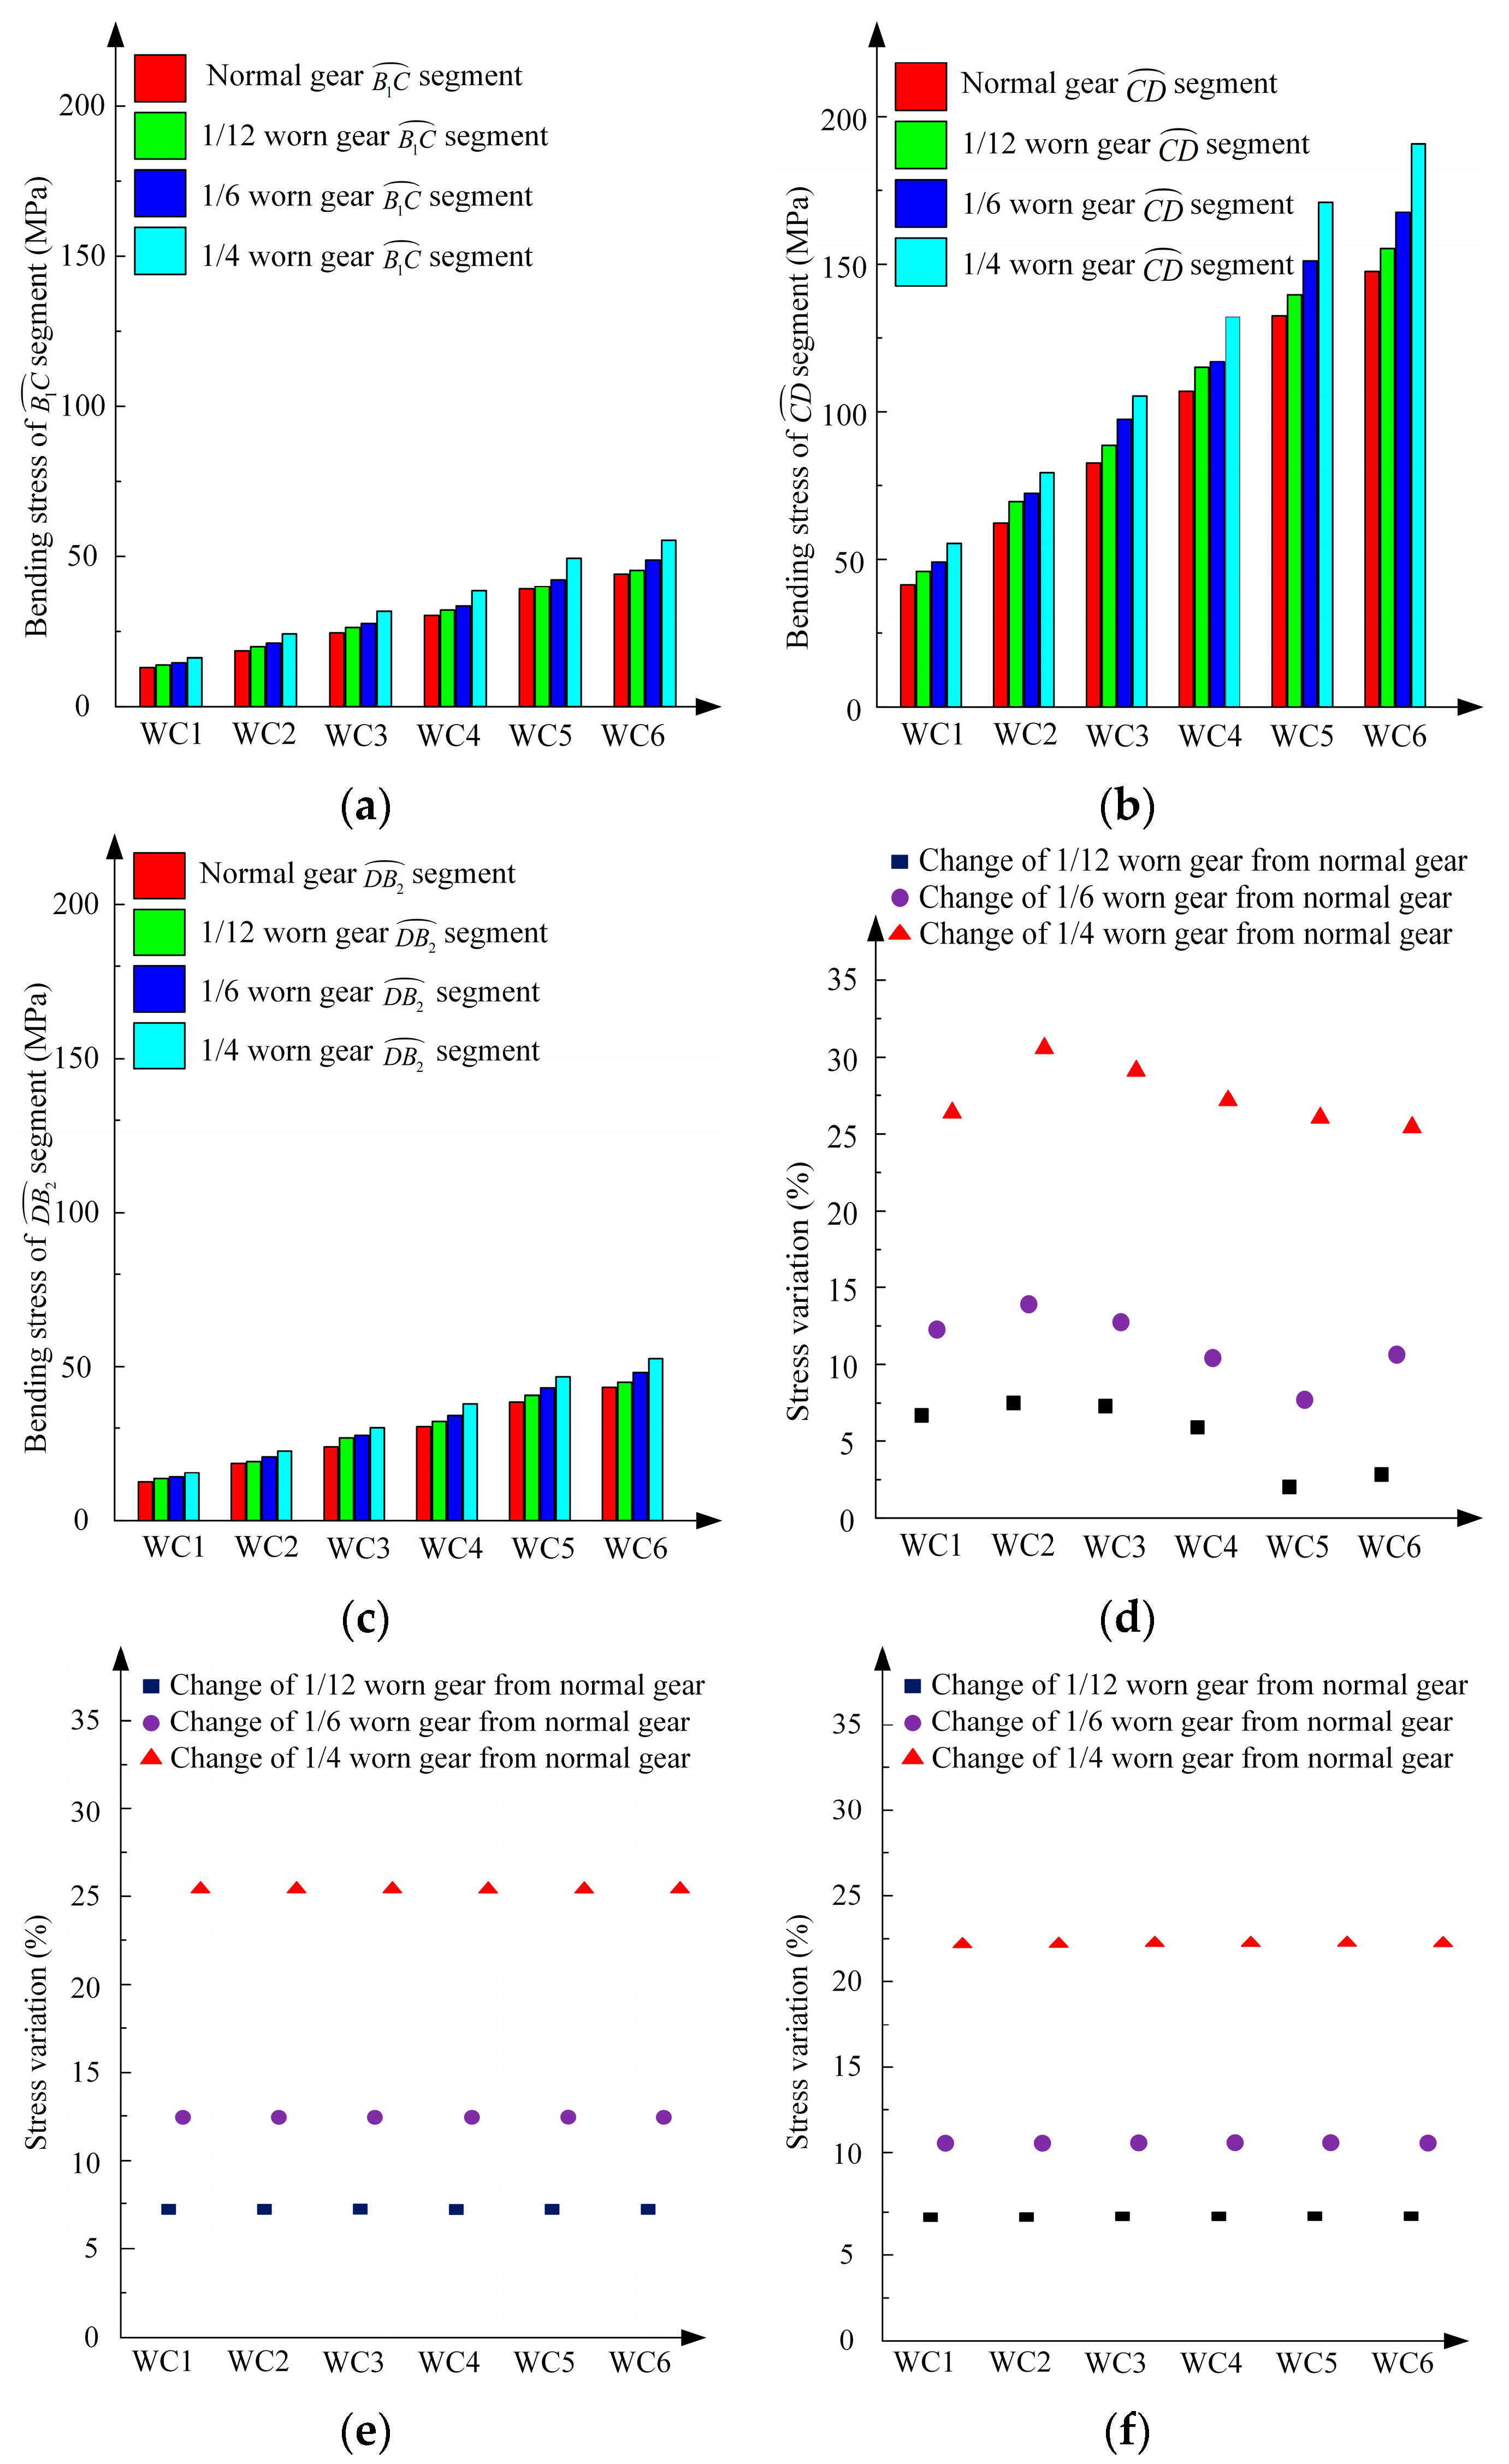
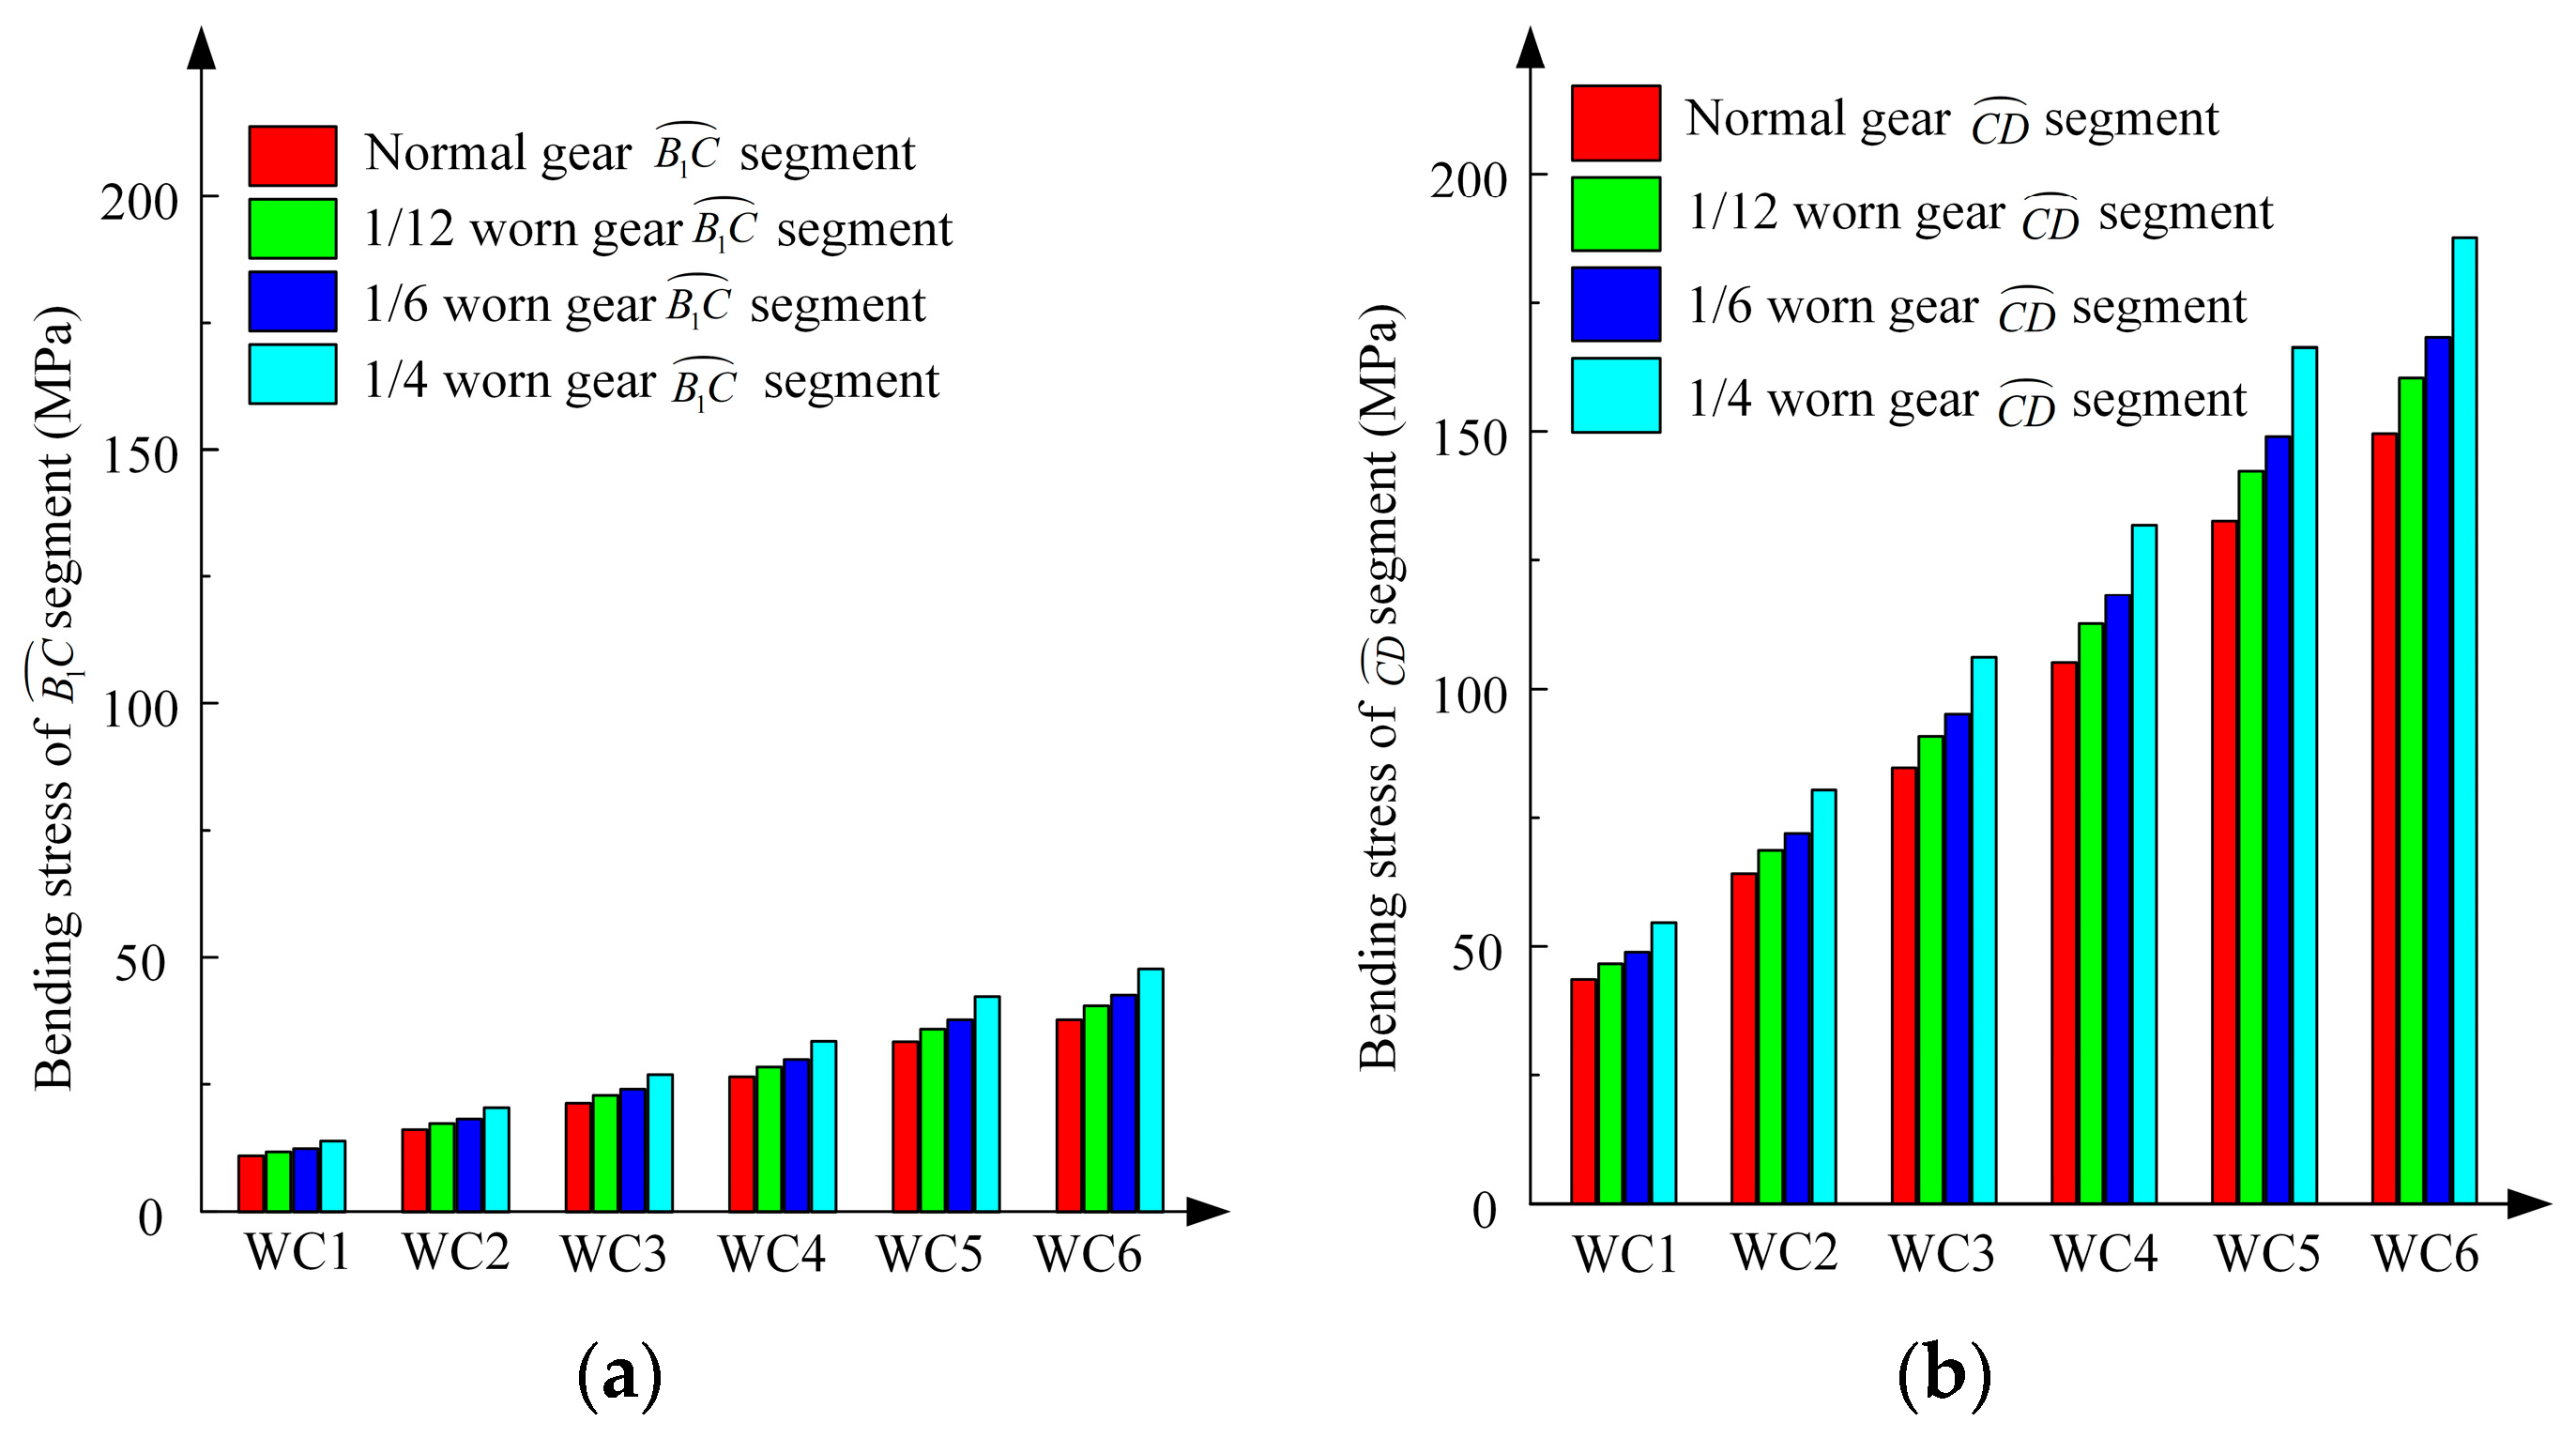
3.3. Bending Stress Calculation of Worn Gears

The main difference between meshing tooth pair 1 and meshing tooth pair 2 lies in their meshing time history and positional relationship within the gear system, specifically the timing of their engagement and disengagement. Combining the relevant parameters of the worn gear from Table 5 with the change in the inter-tooth load distribution coefficient (Kα1) of meshing tooth pair 1 in Figure 5 resulted in obtaining the change in bending stress at each point on the tooth profile of meshing tooth pair 1 under six working conditions, as illustrated in Figure 7.
It can be seen from Figure 7 that whether it was the normal gear or worn gear, the bending stress was significantly influenced by the tooth meshing and working condition. The bending stresses of the B 1 C segment, D B 2 segment double-tooth meshing, and C D segment single-tooth meshing were analyzed, as illustrated in Figure 8.
The analytically calculated bending stress of the same gear in terms of the load of WC 1–6 has been plotted in Figure 8a–c. The bending stress of single- and double-tooth meshing in the normal and worn gear rose with the increase in the working load, and this variation was more pronounced in the former case. The analytically calculated bending stress under the same working condition was upscaled with the growth in the degree of wear. The variations in the stress field of the B 1 C , C D , and D B 2 segments of the normal and worn gears under various working conditions were contrasted in the scatter plots in Figure 8d–f. Compared with the normal gear, the stress of double-tooth meshing on segment B 1 C of the 1/12, 1/6, and 1/4 worn gears were boosted by 7.3%, 12.8%, and 26.5%, whereas that of single-tooth meshing on segment C D grew by 7.2%, 12.4%, and 25.4%, while that of double-tooth meshing on segment D B 2 extended by 6.2%, 10.5%, and 22.2%, respectively. Merged with the results provided in Figure 7 and Table 3, the change in single-tooth meshing time with gear degree of wear is shown in Table 6. With the growth in wear, the wear of the gear deteriorated the working condition of the transmission system and accelerated the performance degradation process of the transmission system.

4. Finite Element Analysis

The FEM was utilized to validate the accuracy of the aforementioned analytical method for calculating the bending stress of the tooth root. The main assumptions used in the modeling of the problem were as follows:
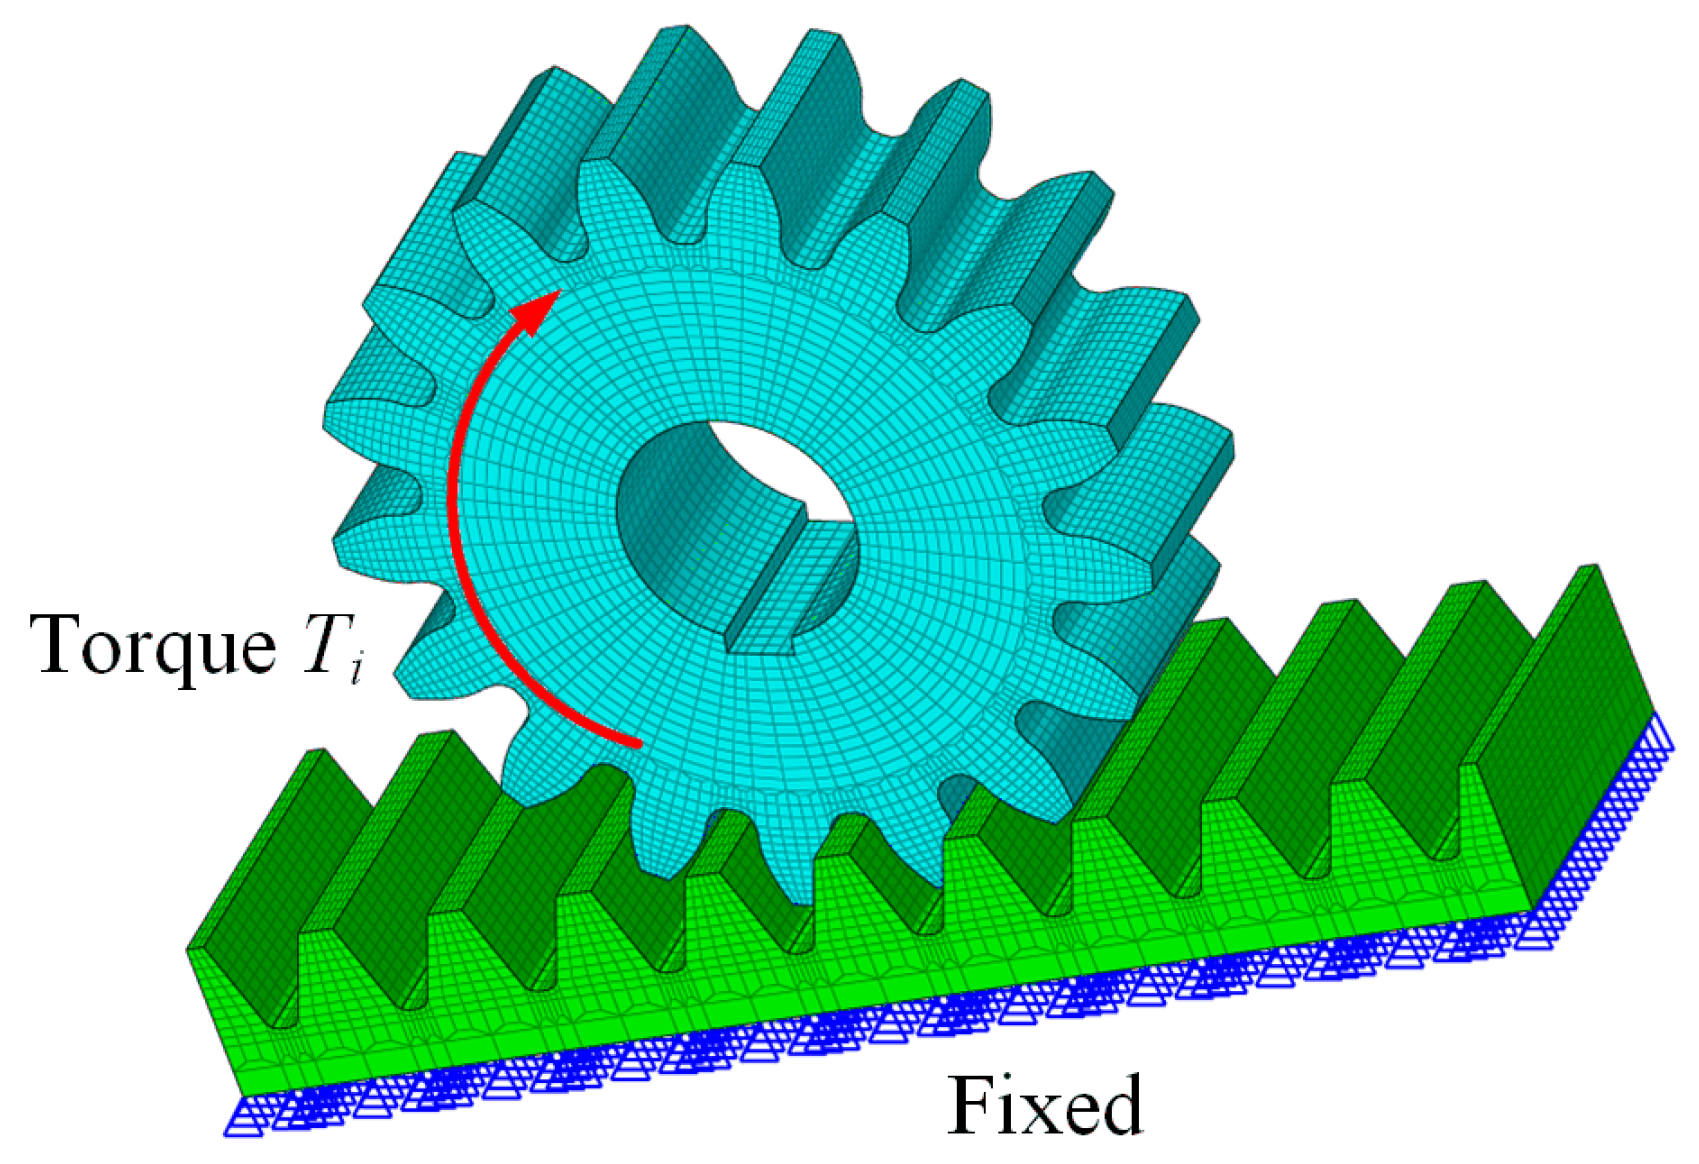
  • Geometric assumptions: The FEM model assumed simplified geometric representations of the structures under analysis including the gear and rack. The teeth were completely intact and original, without any microcracks and dislocations.
  • Mechanics of material assumptions: Material behavior was assumed to follow a linear elastic constitutive model, with properties described by 40Cr.
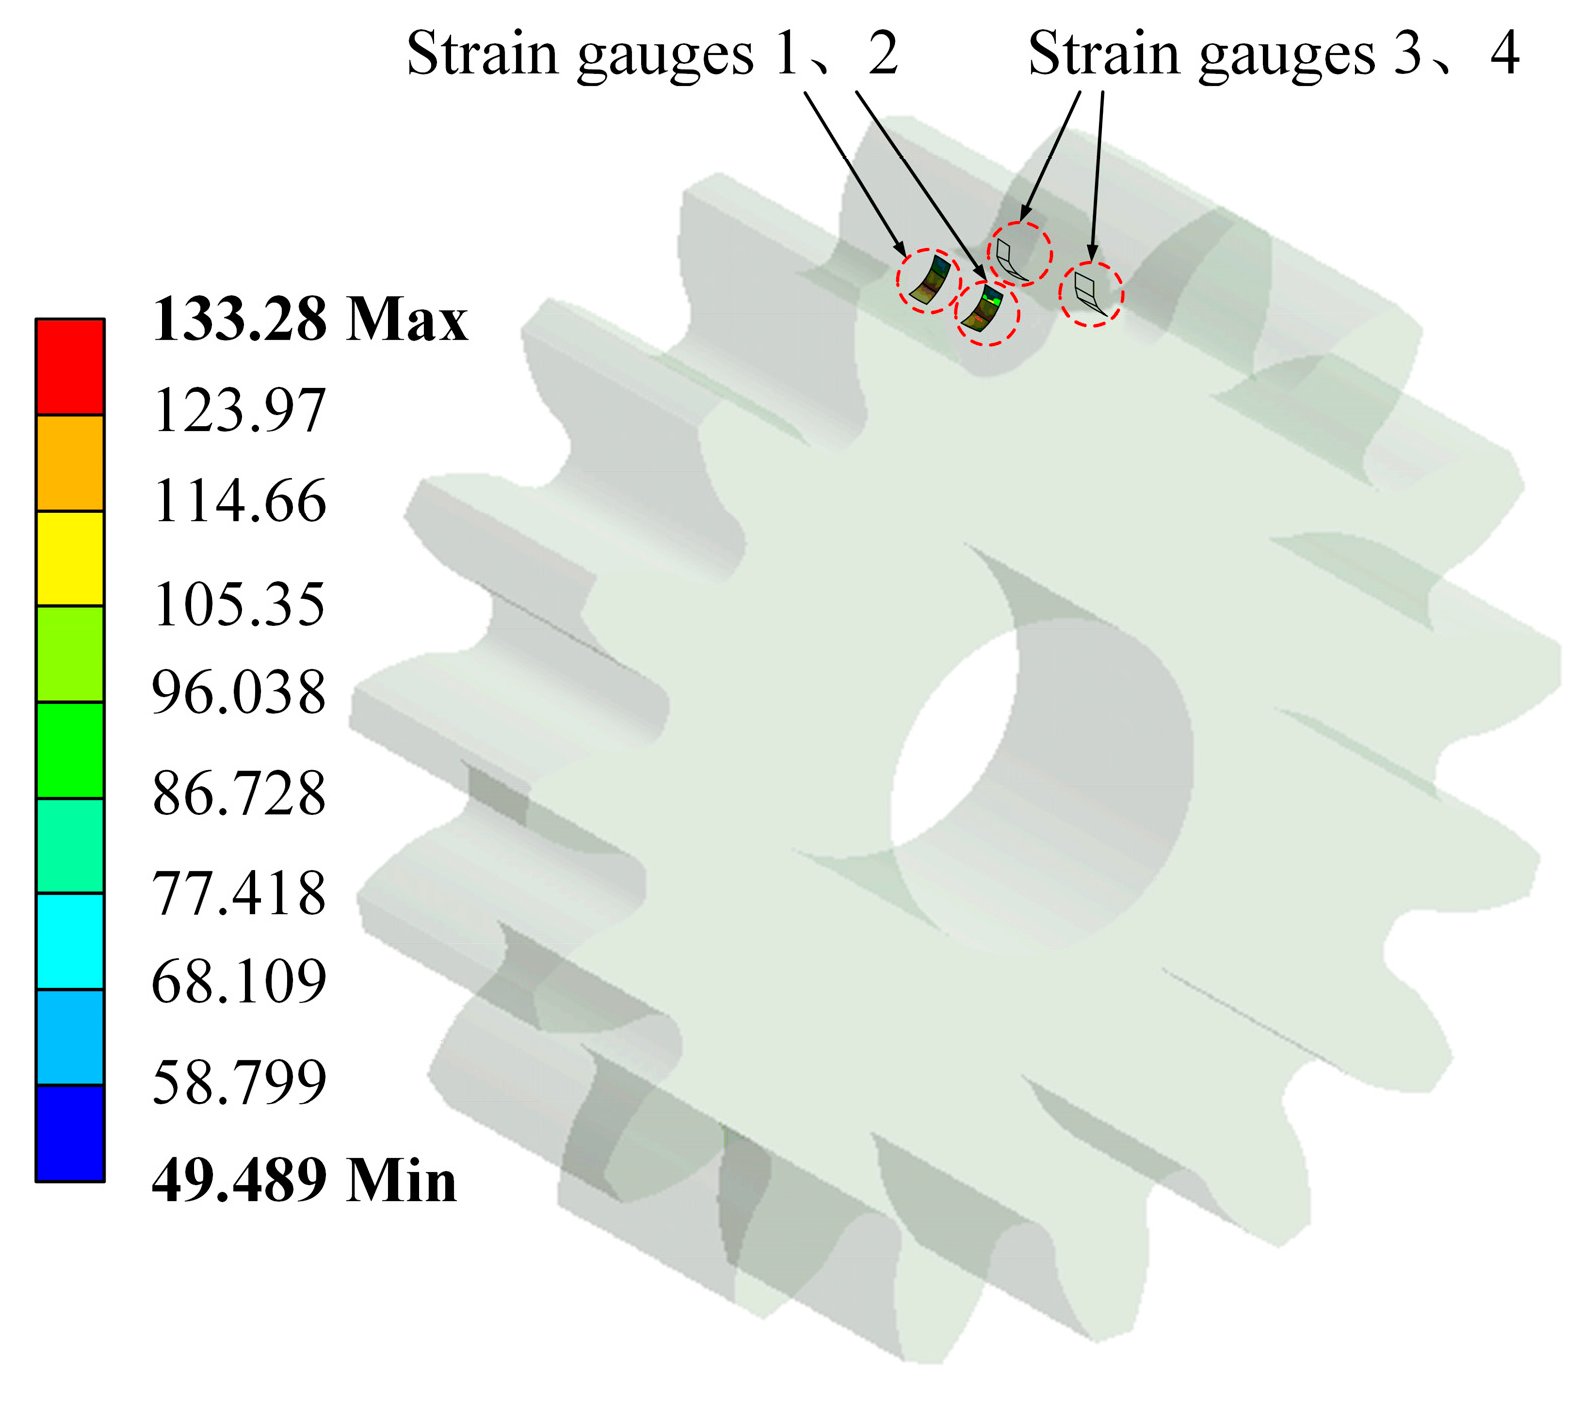
  • Boundary condition assumptions: Imposing a fixed constraint on the bottom of the rack represents the displacement boundary condition while applying torque to the gear represents the only force boundary condition (see Figure 9).
  • Mathematical assumptions: The model was based on assumptions of continuity, equilibrium, and numerical approximation associated with the FEM-based modeling.
The proposed FEM-based model was able to appropriately predict the stress distribution not only in static conditions, but also under the influence of dynamic torque or variable environmental forces for each element. This capability enhances the reliability and realism of the stress analysis at relatively high rotational speeds. Such a capability is crucial for more realistic application scenarios in engineering practice and contributes to improving the design and accuracy of gear system performance prediction. Therefore, future work will further explore the application of this model in various operating conditions by considering the wear conditions of actual gear systems to further refine subsequent research.
Taking into account factors such as tooth load distribution factor ( K α ), the mass weight of the lifting platform ( W z ), and mesh radius ( r i ), the torque T i can be evaluated by [49,50,51]:
T i = ( F t i + W z · g 2 ) · K α 1 · r i
where F t i denotes the circular force at the meshing position, W z represents the weight of the lifting platform on the test bench (0.9 t), g stands for the gravitational acceleration (9.8 m/s2), and K α 1 is the inter-tooth load distribution coefficient of meshing tooth pair 1, as presented in Figure 5.
Amalgamated with the boundary conditions in Figure 9 and Equation (15), the tooth root stress nephogram of the gear shown in Figure 10 was obtained, and the selected position corresponded to the experimental data acquisition position.
The variations in the bending stress of both normal and word gears based on the FEM calculations under working conditions are provided in Figure 11.
For a comparison with the analytical calculations, ten points were selected separately from the two double-tooth meshing, and five points from the single-tooth meshing to examine the variation in the FEM-based gear bending stress according to the division presented in Table 3. The FEM stress fields for both single- and double-tooth meshing were suitably analyzed and are presented in Figure 12.
Figure 12a–c displays the variation in bending stress in segments B 1 C , C D , and D B 2 under the same working conditions. Under each condition, the bending stress was gradually increased with the degree of gear wear. By comparing the double-tooth stress plots depicted in Figure 12a,c and the single-tooth stress described in Figure 12b under the same working conditions, the single-tooth stress was remarkably higher than the double-tooth stress, and the changing trend was consistent with the analytical calculations. The FEM bending stress of the worn gear under six working conditions compared to the normal gear is reflected in the scatter points presented in Figure 12d–f. Under similar wear conditions, the increase in stress was uncorrelated to the change in workload and fluctuated up and down. According to the stress variations of the 1/12, 1/6, and 1/4 worn gears compared to the normal gear, the amount of stress variation in the same working conditions increased further along the wear degree, which was also consistent with the analytical calculation results.
Generally, the proposed FEM-based approach offers higher capabilities compared to the analytical approach; however, analytical methods are usually faster and reduce computational efforts and labor costs.

5. Experimental Validation

5.1. Data Collection

To determine the precision of the predicted bending stresses by the analytical and FEM approaches, the bending stress of the tooth root was experimented by the static loading test. The load conditions and sizes for the six working conditions are provided in columns 4 and 5 in Table 4. Due to the contact extrusion between the tooth surface of the rack-and pinion in the meshing process, the strain gauge should be as close as possible to the tooth root when pasting to avoid damage. For this purpose, two strain gauges were arranged on both sides of the tooth, which were capable of reflecting the stress values in the up-and-down process. The stress value of the strain gauge was read by the DH3816N static strain analysis and testing system, and the stress data were collected by the DHDAS dynamic signal acquisition and analysis system. The position of strain gauges in the experiment is illustrated in Figure 13a,b, and the actual gear model can be seen in Figure 13c–f. The gear was manufactured using the wire cutting method, and the material was considered as 40Cr. The detailed material parameters are provided in Table 1. Different worn gears can be distinguished by measuring the tooth’s thickness at the dividing circle. The distance between the tooth root circle and the dividing circle passing through the center did not change with the degree of wear, which remained fixed at 283.5 mm.
The test was carried out specifically based on the following steps:
  • The hydraulic cylinder oil pressure was controlled in the PLC, and the detailed data of the oil pressure under each working condition are listed in column 5 of Table 4;
  • The hoisting mechanism was operated through the control cabinet, adjusting the meshing point of the rack-and-pinion according to the meshing radius of the gear;
  • Data were collected and saved by the DHDAS.

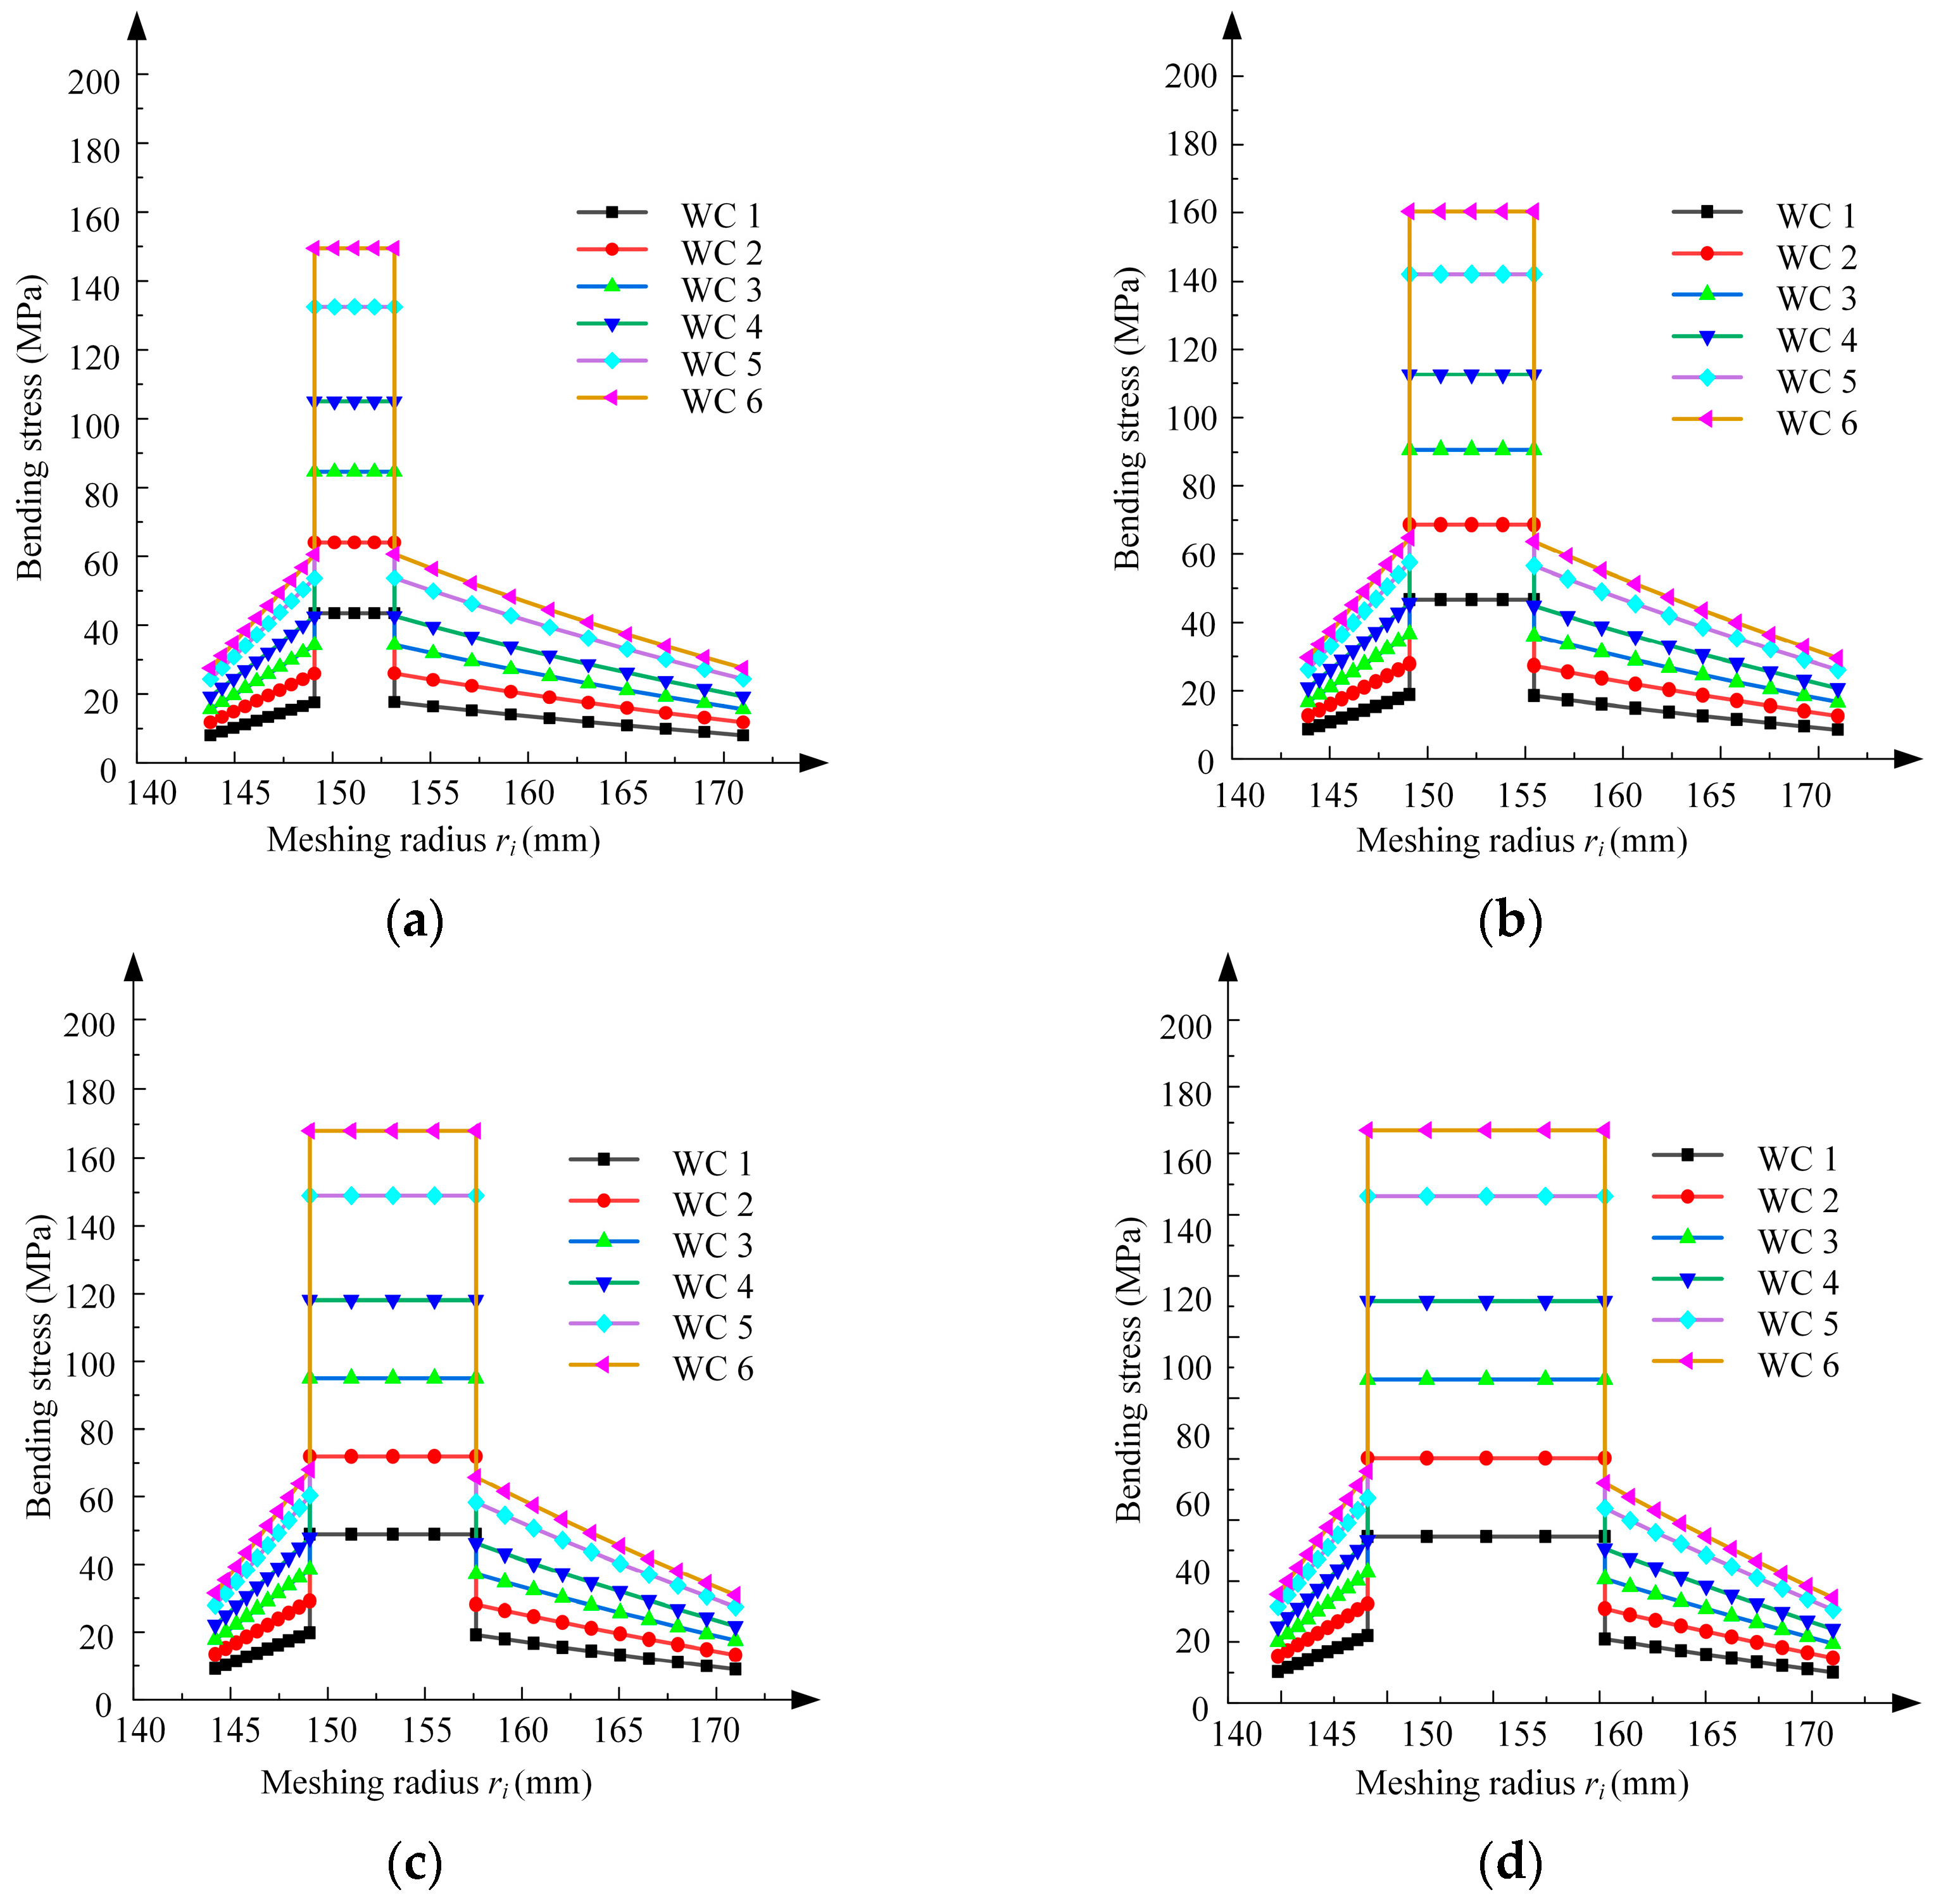
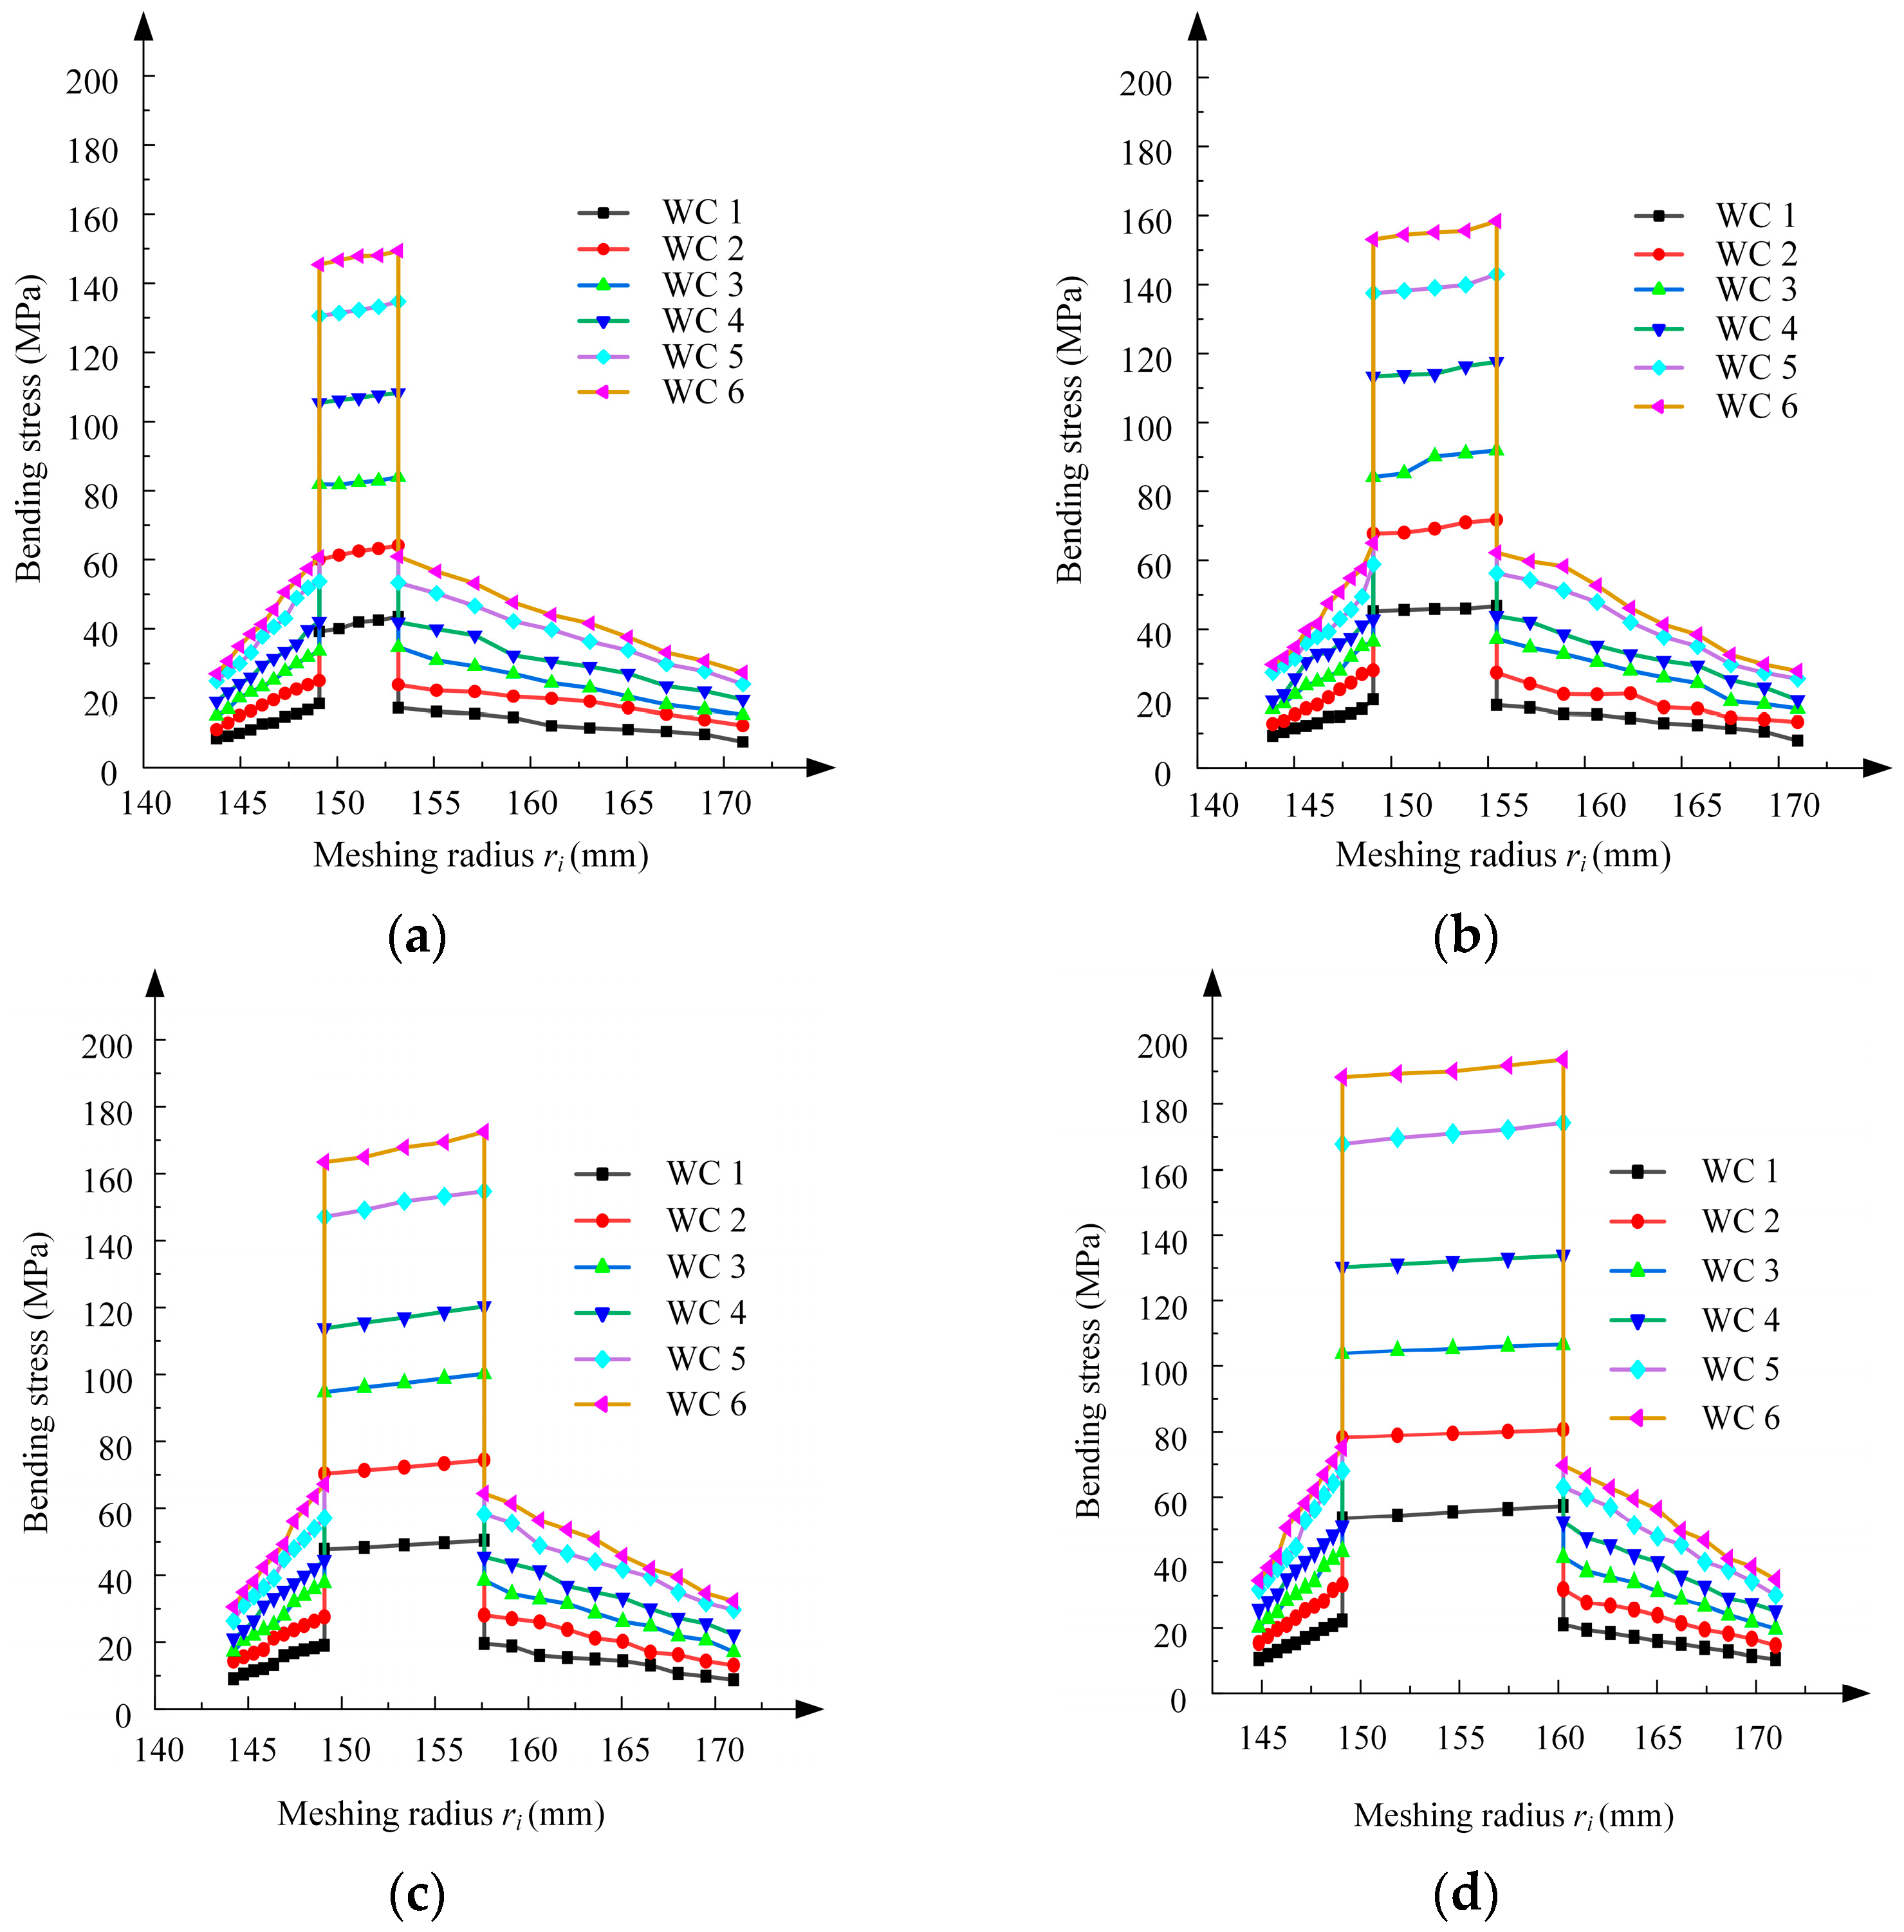
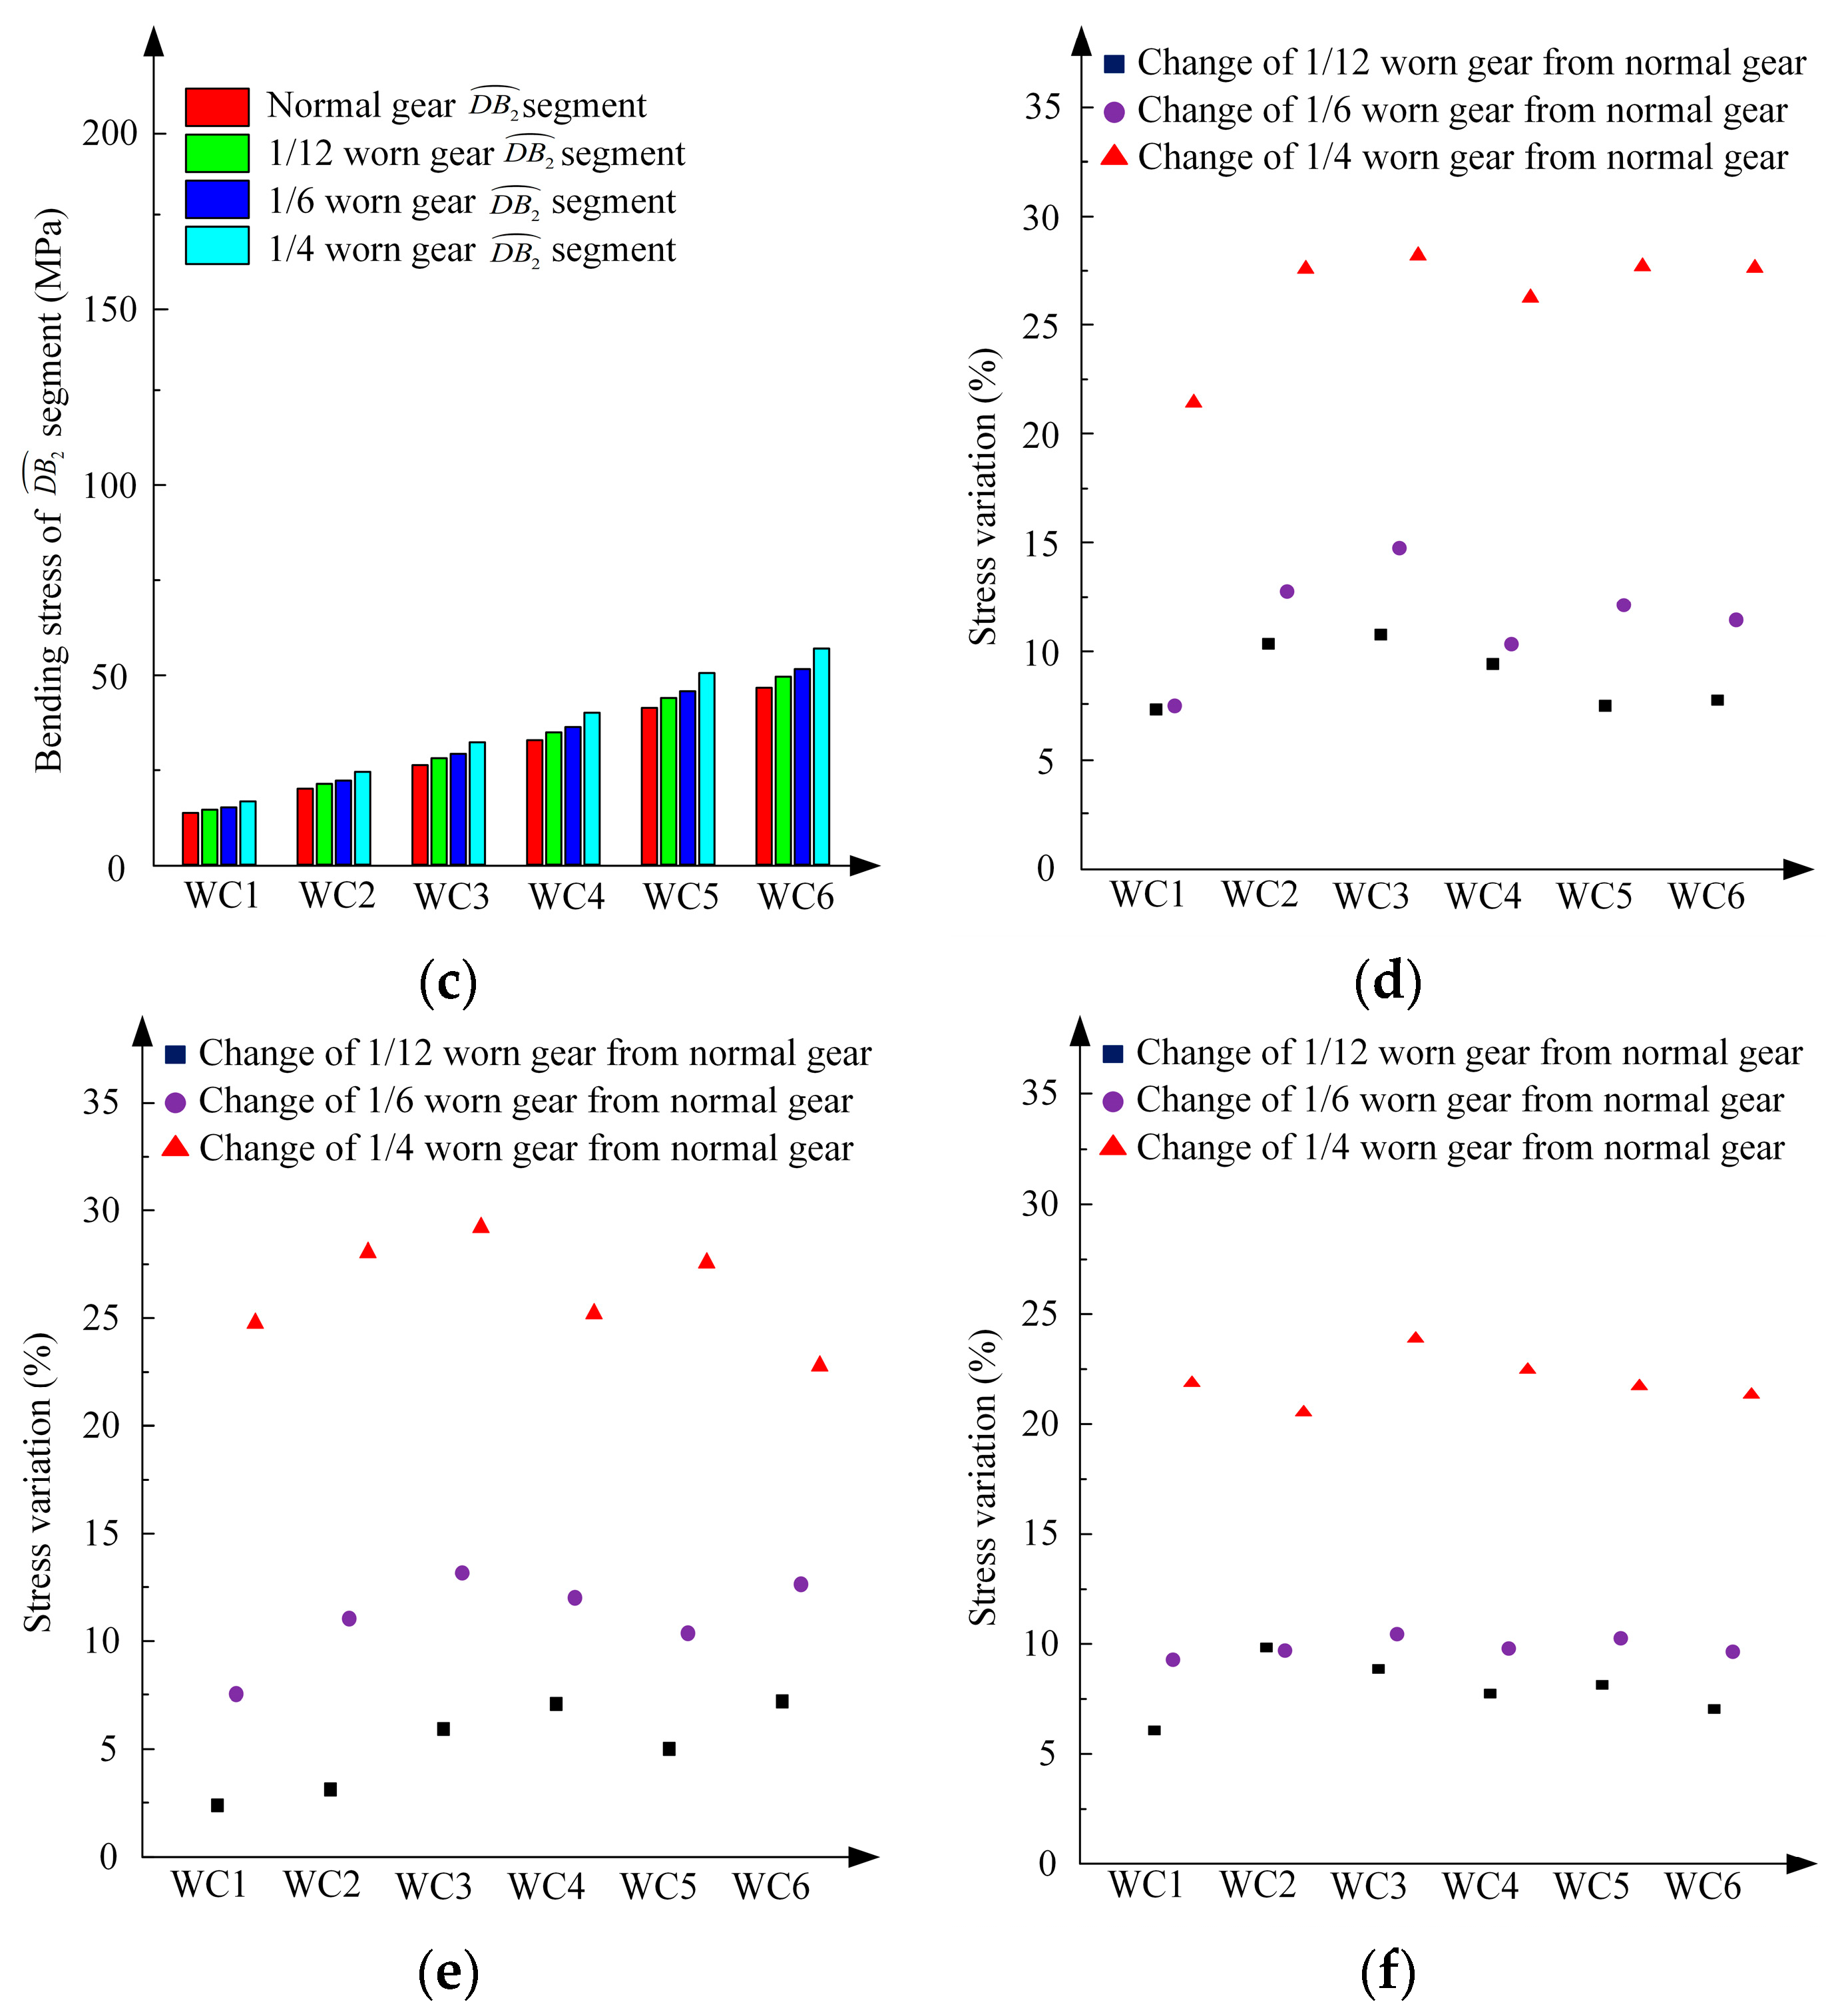
5.2. Analysis of the Experimental Results

Using the above acquisition process, the root bending stresses of meshing tooth pair 1 for normal and worn gears under six working conditions (WC) were obtained and are plotted in Figure 14.
To facilitate mutual verification of analytical calculation and FEM calculation, the experimental bending stress changes with the wear and working conditions for the single- and double-tooth meshing are demonstrated in Figure 15.
The experimental bending stresses of both the single- and double-tooth meshing sections of different gears under various working conditions are plotted in Figure 15a–c. In segment D B 2 of working condition 2, the bending stress of the 1/12 worn gear was obtained as 20.44 MPa, while that of the 1/6 wear stress was predicted to be 20.4 MPa, which was potentially caused by the slight fluctuation in the oil pressure of the hydraulic cylinder. In addition, other stresses both increased with the intensification degree of wear. It can be clearly observed that the stress of single-tooth meshing was much higher than that of double-tooth meshing, and its numerical change process was consistent with the analytical and FEM calculations. The increase in the stress increment of single- and double-tooth meshing among the wear levels under each condition is revealed in the scatter diagrams in Figure 15d–f. In general, the stress changes became more significant with increasing wear, which was basically consistent with both the analytical and FEM calculations.

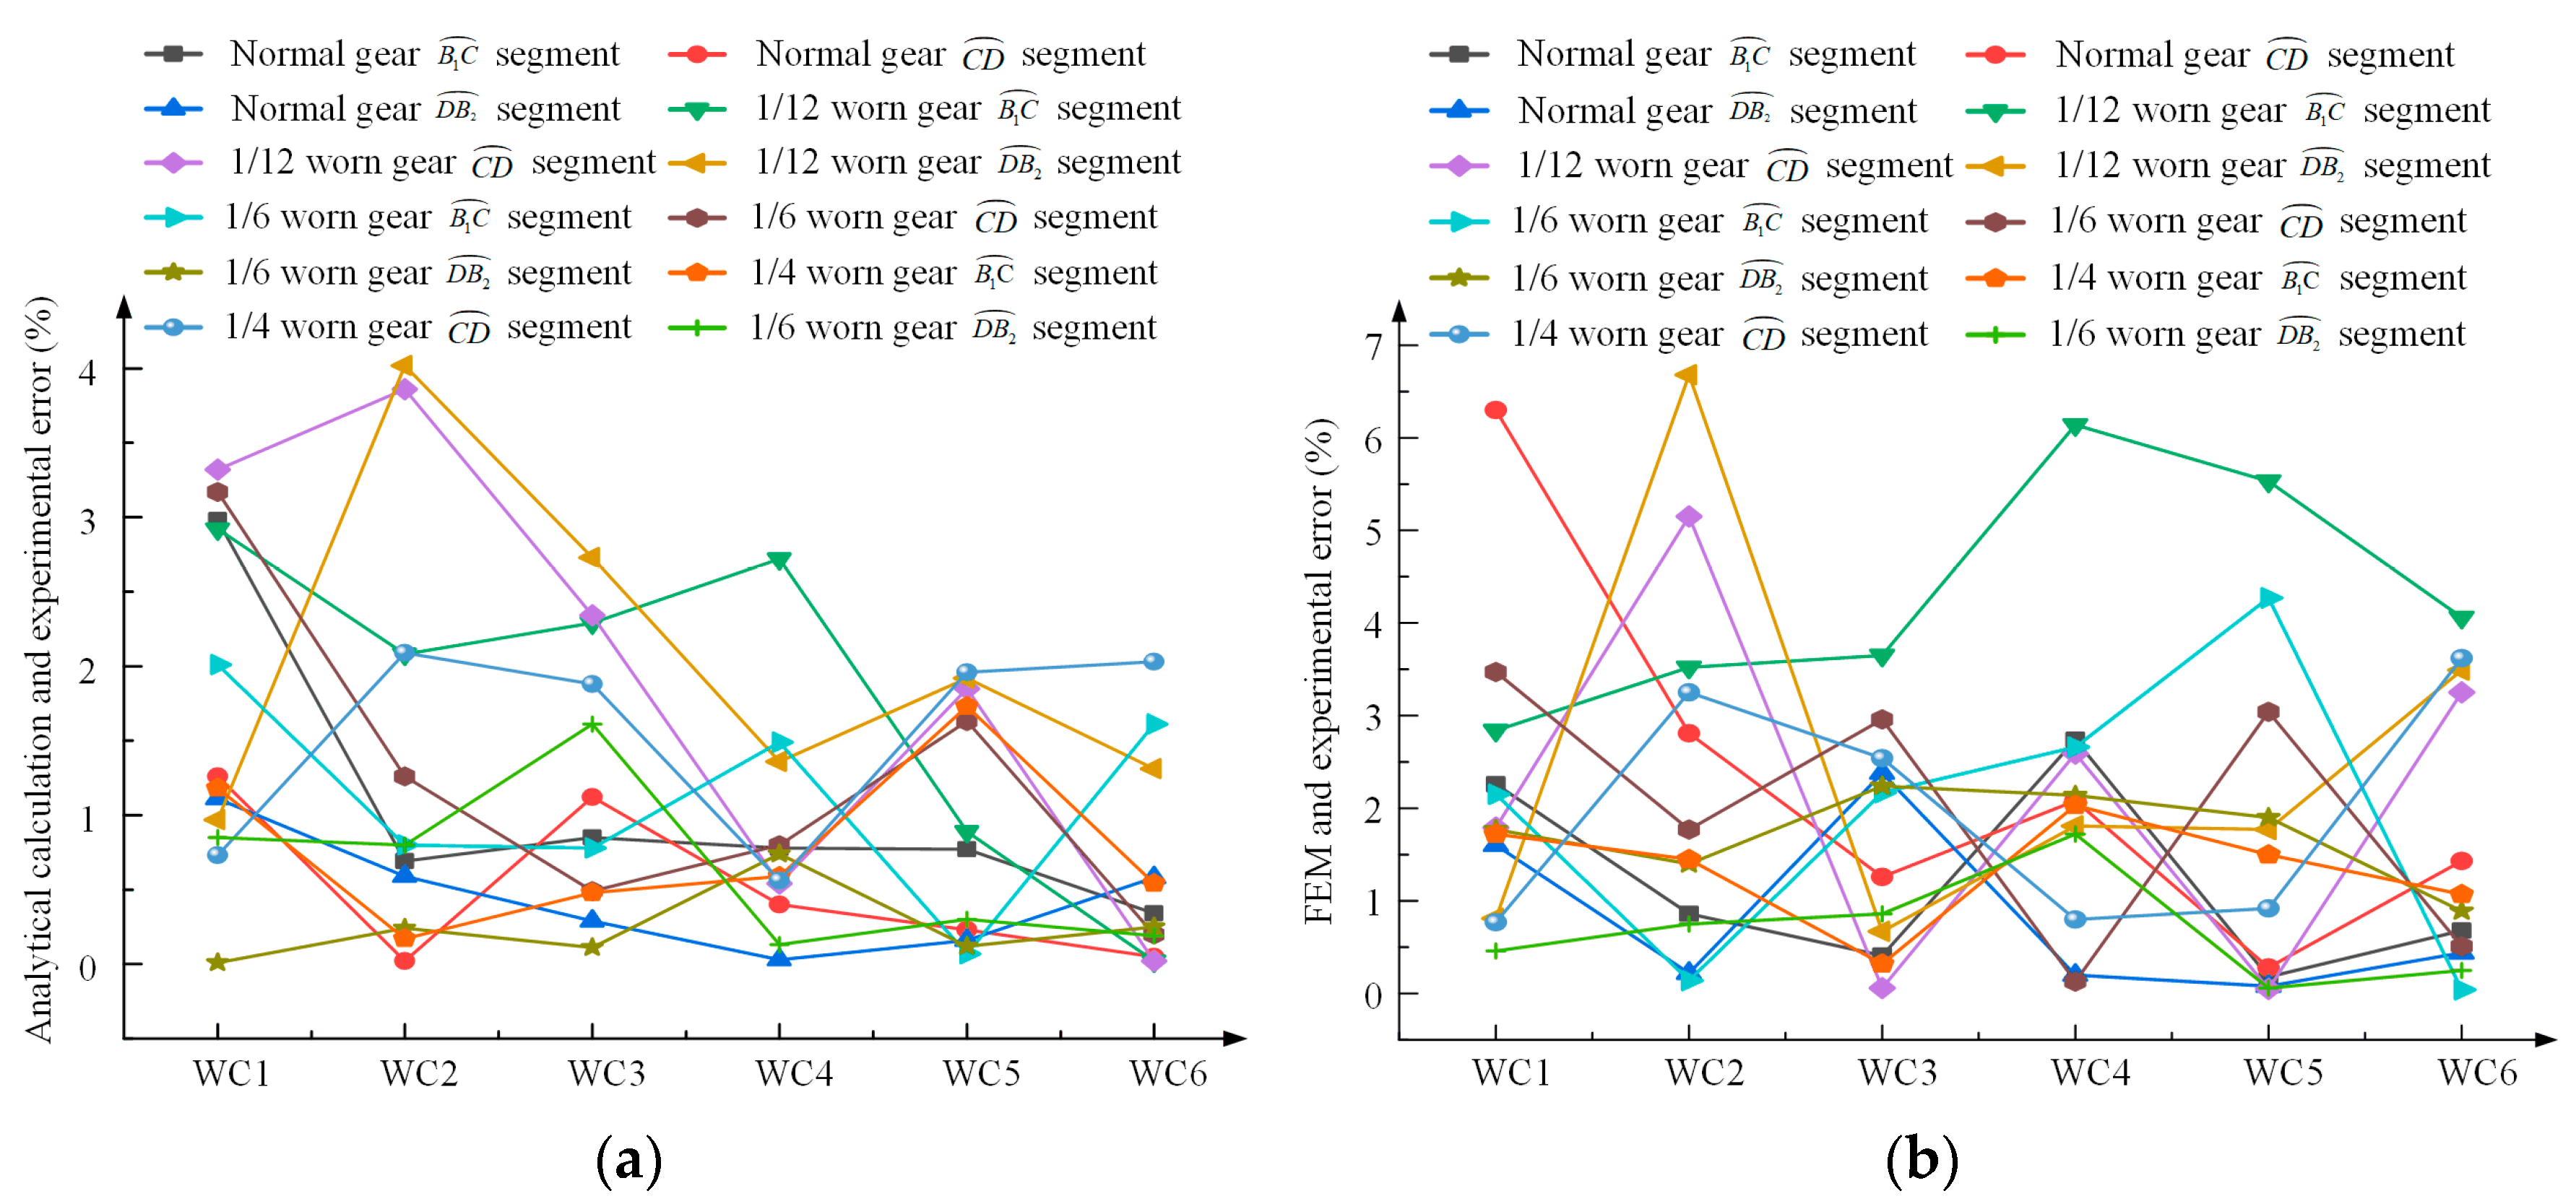
5.3. Comparative Analysis of Three Methods

Combined with Figure 7, Figure 11 and Figure 15, the errors on the bending stress of single-tooth segments B 1 C , D B 2 , and double-tooth segment C D obtained by the analytical solution, FEM, and experiments for the normal, 1/12, 1/6, and 1/4 worn gears are analyzed in Figure 16.
Combined with the plotted results in Figure 16, the errors between the analytical calculation results and experimental results as well as between the FEM’s predicted results and experimentally observed data can be interpreted in some detail as follows:
(1)
Error of the analytical results through a comparison with the experimentally observed data
The maximum error between the bending stresses obtained by the analytical calculation and the experimentally observed data was obtained as 4.02%, which occurred in the double-tooth meshing segment D B 2 of the 1/12 worn gear under working condition 2. The minimum error was 0.01%, which occurred in the double-teeth meshing segment D B 2 of the 1/6 worn gear under condition 1. The other errors were small in the range, so the bending stress obtained by these two approaches could be mutually verified with fairly good accuracy.
(2)
Error of the FEM results through a comparison with the experimentally observed data
The maximum error between the bending stresses obtained by the FEM calculation and the experimental results was estimated to be 6.68%, which occurred in the double-tooth meshing segment D B 2 of the 1/12 worn gear under working condition 2. The minimum error was obtained as 0.04%, which occurred in the double-tooth meshing segment D B 2 of the 1/6 worn gear under condition 6. The error was distributed within the allowable range, so the bending stress obtained by the experimental tests could prove the reliability of the FEM results.
In summary, the errors between the analytical and FEM results, analytical and experimental results, and FEM and experimental results were all at a low level, which could confirm each other while ensuring the accuracy of the analysis. Therefore, this paper provides a fairly solid theoretical support and an appropriate experimental basis for the kinematic analysis and dynamic analysis of large modulus rack-and-pinion.

6. Conclusions

According to the verifications performed among the analytical, FEM, and experimental results on the bending stress of normal and worn gears, the main obtained results can be summarized as:
(1)
In this paper, the rack-and-pinion transmission pair of the Three Gorges ship lift was considered as the research object to establish a simulation experimental platform for the working conditions of the vertical rack-and-pinion lifting mechanism. The changes in related parameters such as load along the tooth profile and the tooth thickness of the gear after uniform wear were methodically investigated by the modified gear method. Three methods, which were analytical calculation, FEM calculation, and experiment, were adopted to evaluate the bending stresses of the normal, 1/12, 1/6, and 1/4 uniform worn gears. The obtained results of the above three methodologies indicate that the bending stress in single-tooth meshing was substantially higher than that of double-tooth meshing to increase the degree of wear and loading. With increasing wear, the single-tooth meshing time increased, which revealed that gear wear deteriorated the working condition of the transmission system and accelerated the degradation process of the transmission system performance.
(2)
By analyzing the errors between the analytical and FEM results, analytical and experimental results, and FEM and experimental results, the obtained relative discrepancies among of the various results were all at a low level, and therefore, the three methods can confirm each other, which guarantees the accuracy of the analysis. As a result, this paper is able to provide theoretical support and an empirical basis for the kinematic analysis and dynamic analysis of large modulus rack-and-pinion transmission.
(3)
By examining the effect of different degrees of uniform wear on the tooth surface on the change in bending stress at the root of the large-module gear rack pair under the working condition of the Three Gorges ship lift, it is applicable to various application scenarios of the large-module gear rack pair. It plays a critical role in how to ensure the safe, reliable, and efficient performance status of a large-module gear rack pair lifting platform during service operations as well as monitoring and assessing the condition on-site or online. Similarly, studying the failure mechanism and dynamic response characteristics of rack-and-pinion transmission under complex working conditions and revealing the degradation of equipment service performance and the evolution of reliability is of great significance and practical engineering value.
In this study, we developed a test bench to replicate the conditions of a vertical rack-and-pinion lifting mechanism, focusing on parameters such as load distribution and gear tooth wear effects. This integrated approach merges the experimental data with theoretical models and provides new insights into the performance of rack-and-pinion transmissions under complex scenarios. In addition, this paper adopted various methodologies to reasonably examine tooth root bending stresses including theoretical calculations, FEM simulations, and experimental tests, which provide a thorough understanding of the wear effects and system behavior. Finally, this study presented an improved gear method that was validated through extensive experiments and simulations and proposed a new strategy for strengthening similar engineering systems.
The next step is to conduct a comprehensive assessment of the lifespan and condition monitoring of the rack-and-pinion lifting mechanism on the basis of these crucial findings. This includes analyzing the long-term performance of the system and further optimizing its reliability and stability by integrating experimental and theoretical models. The aim is to ensure its sustainable operation under different operating conditions.

Author Contributions

Z.G.: Supervision, Investigation, Writing-review and editing. B.C.: Conceptualization, Methodology, Validation, Funding acquisition, Supervision, Writing-review and editing. X.C.: Supervision, Investigation. All authors have read and agreed to the published version of the manuscript.

Funding

This research was funded by the National Natural Science Foundation of China [Grant 51975324], the Key R&D Project in Hubei Province [Grant 2023BAB129], and the Hubei Key Laboratory of Hydroelectric Machinery Design & Maintenance [Grants 2021KJX02, 2021KJX13, and 2020KJX02]. The article processing charges (APC) were funded by the aforementioned grants.

Data Availability Statement

The original contributions presented in the study are included in the article, further inquiries can be directed to the corresponding author.

Conflicts of Interest

The authors declare no conflicts of interest.

References

  1. Suo, L.; Niu, X.; Xie, H. 6.07-The Three Gorges Project in China, comprehensive renewable energy. Compr. Renew. Energy 2012, 6, 179–226. [Google Scholar] [CrossRef]
  2. Yuan, Y.; Ji, B.; Yuan, X.; Huang, Y. Lockage scheduling of Three Gorges-Gezhouba dams by hybrid of chaotic particle swarm optimization and heuristic-adjusted strategies. Appl. Math. Comput. 2015, 270, 74–89. [Google Scholar] [CrossRef]
  3. Liu, Z.; Yuan, Y.; Xiao, W.; Zhang, H. Method of calculation and experiment of bending stress for rough module racks. J. Mech. Eng. 2016, 52, 152–159. [Google Scholar] [CrossRef]
  4. Liu, H.; Liu, H.; Zhu, C.; Parker, R. Effects of lubrication on gear performance: A review. Mechan. Mach. Theory 2020, 145, 103701. [Google Scholar] [CrossRef]
  5. Li, G.; Geng, Z. Gear bending stress analysis of automatic transmissions with different fillet curves. Int. J. Automot. Sci. Technol. 2021, 5, 100–106. [Google Scholar] [CrossRef]
  6. Ko, K.E.; Lim, D.H.; Kim, P.Y.; Park, J. A study on the bending stress of the hollow sun gear in a planetary gear train. J. Mech. Sci. Technol. 2010, 24, 29–32. [Google Scholar] [CrossRef]
  7. Saribay, Z. Tooth geometry and bending stress analysis of conjugate meshing face-gear pairs. Proc. Inst. Mech. Eng. Part C J. Mech. Eng. Sci. 2013, 227, 1302–1314. [Google Scholar] [CrossRef]
  8. Yu, Y.; Lin, C.; Hu, Y. Tooth bending stress analysis of high speed curve face gear of composite transmission. Mech. Ind. 2021, 22, 20. [Google Scholar] [CrossRef]
  9. Pedersen, N. Improving bending stress in spur gears using asymmetric gears and shape optimization. Mech. Mach. Theory 2010, 45, 1707–1720. [Google Scholar] [CrossRef]
  10. Cheng, X.; Shi, D.; Liu, C.; Xia, R.; Zhang, Y.; Zhou, J. Double cracks with single-inclusion fatigue propagation of surface-quenched large modulus rack. Adv. Mech. Eng. 2019, 11, 1687814019895745. [Google Scholar] [CrossRef]
  11. Cheng, X.; Shi, D.; Li, H.; Xia, R.; Zhang, Y.; Zhou, J. Stability and parameters influence study of fully balanced hoist vertical ship lift. Struct. Eng. Mech. 2018, 66, 583–594. [Google Scholar] [CrossRef]
  12. Yan, H.; Li, P.; Liu, H.; Wang, Z.; Wei, D. Research on the bending and fatigue damage degree of the climbing mechanism of the riprap leveling ship after wear. China Shipbuild. 2020, 61, 164–172. [Google Scholar]
  13. Zhou, C.; Dong, X.; Wang, H.; Liu, Z. Time-varying mesh stiffness model of a modified gear–rack drive with tooth friction and wear. J. Braz. Soc. Mech. Sci. Eng. 2022, 44, 213. [Google Scholar] [CrossRef]
  14. Tao, J.; Wen, A.; Liu, Z.; Yu, S. Lean lubrication of ultra large modulus open gear and rack pair: A case study of the gear-rack drive mechanism of the Chinese “Three Gorge Dam” ship lift. J. Clean. Prod. 2020, 282, 124450. [Google Scholar] [CrossRef]
  15. Zhao, T.; Shi, D.; Yao, Z.; Mao, H.; Cheng, S.; Peng, H. Crack spacing threshold of double cracks propagation for large-module rack. J. Cent. South Univ. 2015, 22, 2533–2539. [Google Scholar] [CrossRef]
  16. Shi, D.; Cai, D.; Wu, Z. Finite element analysis on nut post structure of Three Gorges Project ship lift. J. Cent. South Univ. Technol. 2009, 16, 614–620. [Google Scholar] [CrossRef]
  17. Zhao, X.; Lin, Q.; Yu, H. A co-scheduling problem of ship lift and ship lock at the three gorges dam. IEEE Access 2020, 8, 132893–132910. [Google Scholar] [CrossRef]
  18. Akkermann, J.; Wu, X. The ship lift at the Three-Gorges-Dam in China-construction of the world’s largest elevator. Bautechnik 2016, 93, 899–906. [Google Scholar] [CrossRef]
  19. Tang, X. Longyuan Zhenhua Three: The world’s largest wind power construction platform built by China’s power. Electr. Power Equip. Manag. 2018, 9, 96. [Google Scholar]
  20. Li, D.; Pang, X.; Fan, Y.-b.; Xue, L.; Wang, L.; Shi, Z. The jetting valve design of the leg shoe on the Shengli No. 5 workover platform. In Proceedings of the 2011 International Conference on Remote Sensing, Environment and Transportation Engineering, Nanjing, China, 24–26 June 2021; pp. 2696–2699. [Google Scholar]
  21. Dasgupta, K.; Kumar, N.; Kumar, R. Steady state performance analysis of hydrostatic transmission system using two motor summation drive. J. Inst. Eng. (India) Ser. C 2013, 94, 357–363. [Google Scholar] [CrossRef]
  22. Waragai, M.; Takayama, T. Development of a high-speed and low-torque loss two-way clutch. ROBOMECH J. 2022, 9, 21. [Google Scholar] [CrossRef]
  23. Liu, H. Tribological behavior of a novel magnetorheological fluid under adverse lubrication conditions. Tribol. Trans. 2019, 62, 834–841. [Google Scholar]
  24. Doerner, M.D. Effects of particle contamination on boundary lubricated wear. Wear 2020, 452–453, 203316. [Google Scholar] [CrossRef]
  25. Taylor, S. Influence of lubrication conditions on surface pitting and subsurface fatigue in rolling-sliding contacts. Tribol. Trans. 2016, 59, 437–448. [Google Scholar]
  26. Zhang, H. Effect of lubrication regimes on microstructure and fatigue behavior of high-strength steel. Wear 2017, 376–377, 1613–1622. [Google Scholar]
  27. Chen, X. Tribological performance and failure mechanism of gear surface under different lubrication conditions. J. Tribol. 2018, 140, 051501. [Google Scholar]
  28. Spitas, C.; Giannakopoulos, A.E. Influence of poor lubrication on the fatigue life of an engine camshaft. Int. J. Fatigue 2016, 91, 52–61. [Google Scholar]
  29. García-Rodríguez, A.; González-Morán, C.O. Influence of lubrication on the fatigue life of spur gears. Wear 2019, 426–427, 1652–1659. [Google Scholar]
  30. Yuan, H.; Lei, Z.; You, X.; Dong, Z.; Zhang, H.; Zhang, C.; Zhao, Y.; Liu, J. Fault diagnosis of driving gear in rack and pinion drives based on multi-scale local binary pattern extraction and sparse representation. Meas. Sci. Technol. 2023, 34, 055017. [Google Scholar] [CrossRef]
  31. Xi, C.; Yang, J.; Liang, X.; Ramli, R.B.; Tian, S.; Feng, G.; Zhen, D. An improved gated convolutional neural network for rolling bearing fault diagnosis with imbalanced data. Int. J. Hydromechatron. 2023, 6, 108–132. [Google Scholar] [CrossRef]
  32. Zhao, Y.; Zhou, M.; Xu, X.; Zhang, N. Fault diagnosis of rolling bearings with noise signal based on modified kernel principal component analysis and DC-ResNet. CAAI Trans. Intell. Technol. 2023, 8, 1014–1028. [Google Scholar] [CrossRef]
  33. Zhen, D.; Li, D.; Feng, G.; Zhang, H.; Gu, F. Rolling bearing fault diagnosis based on VMD reconstruction and DCS demodulation. Int. J. Hydromechatron. 2022, 5, 205–225. [Google Scholar] [CrossRef]
  34. Jin, X.; Cheng, F.; Peng, Y.; Qiao, W.; Qu, L. Drivetrain gearbox fault diagnosis: Vibration-and current-based approaches. IEEE Ind. Appl. Mag. 2018, 24, 56–66. [Google Scholar] [CrossRef]
  35. Ehrmann, C.; Isabey, P.; Fleischer, J. Condition monitoring of rack and pinion drive systems: Necessity and challenges in production environments. Procedia CIRP 2016, 40, 197–201. [Google Scholar] [CrossRef]
  36. Feng, S.; Mao, J.; Xie, Y. Analysis and calculation of gear mesh stiffness with tooth wear. J. Mech. Eng. 2015, 51, 27–32. [Google Scholar] [CrossRef]
  37. Dong, P.; Zuo, S.; Du, S.; Tenberge, P.; Wang, S.; Xu, X.; Wang, X. Optimum design of the tooth root profile for improving bending capacity. Mechan Mach Theory 2020, 151, 103910. [Google Scholar] [CrossRef]
  38. Lin, C.; Wei, W.; Wang, S.; Xia, X.; Xin, Q. Bending stress analysis of eccentric straight and helical curve-face gear pair. Int. J. Mech. Mater. Des. 2020, 16, 401–414. [Google Scholar] [CrossRef]
  39. Shen, Z.; Qiao, B.; Yang, L.; Luo, W.; Chen, X. Evaluating the influence of tooth surface wear on TVMS of planetary gear set. Mech. Mach. Theory 2019, 136, 206–223. [Google Scholar] [CrossRef]
  40. Sekar, R. Determination of load dependent gear loss factor on asymmetric spur gear. Mech. Mach. Theory 2019, 135, 322–335. [Google Scholar] [CrossRef]
  41. Pedrero, J.; Pleguezuelos, M.; Artés, M.; Antona, J. Load distribution model along the line of contact for involute external gears. Mech. Mach. Theory 2010, 45, 780–794. [Google Scholar] [CrossRef]
  42. Sanchez, M.; Pleguezuelos, M.; Pedrero, J. Enhanced model of load distribution along the line of contact for non-standard involute external gears. Meccanica 2013, 48, 527–543. [Google Scholar] [CrossRef]
  43. Zheng, M.; Zhou, C.; Liu, Z. Transient thermal elastohydrodynamic lubrication for super-modulus modified gear-rack drive. J. Hunan Univ. (Nat. Sci.) 2021, 48, 11. [Google Scholar] [CrossRef]
  44. Park, C.; Jung, S.; Kim, J.; Kwak, S. Influence of gear surface lubrication on torque and friction in planetary gears. Tribol. Int. 2018, 126, 761–764. [Google Scholar]
  45. Zhang, L.; Zhang, W.; Liu, Y.; Ma, J. Effects of lubrication on tooth surface fatigue life and dynamic performance of spur gears. J. Tribol. 2019, 141, 051401. [Google Scholar]
  46. Belhocine, M.; Kahraman, A. Influence of lubrication on power loss and contact fatigue life of helical gears. J. Mech. Des. 2020, 142, 041401. [Google Scholar]
  47. Sekar, R.P.; Muthuveerappan, G. Estimation of tooth form factor for normal contact ratio asymmetric spur gear tooth. Mech. Mach. Theory 2015, 80, 187–218. [Google Scholar] [CrossRef]
  48. Wang, Z. Research of the Large Module Gear-Rack Bending Fatigue Strength. Master’s Thesis, Henan University of Technology, Zhengzhou, China, 2013. [Google Scholar]
  49. Smith, A.; Johnson, B. Influence of tooth load distribution factor and mesh radius on gear torque. Int. J. Mech. Eng. 2017, 6, 123–135. [Google Scholar]
  50. Wang, X.; Chen, Y.; Li, Z. Effects of tooth contact ratio and meshing radius on gear torque transmission. J. Tribol. 2018, 140, 041301. [Google Scholar]
  51. Brown, C.; Miller, D. Influence of gear tooth profile modification and mesh radius on torque distribution in spur gears. Tribol. Int. 2019, 131, 210–220. [Google Scholar]
Figure 1. Structure diagram of the test bench: (a) Structural diagram. (b) Physical map of the structure (note: 1—bevel gear planetary reducer; 2—lifting platform; 3—drive frequency con-version motor; 4—speed torque meter; 5—column rack; 6—transmission gear; 7—hydraulic cylinder loading control; 8—rack support column; 9—overall support structure).
Machines 12 00570 g001
Figure 2. Schematic representation of the uniform wear.
Machines 12 00570 g002
Figure 3. Distribution of the circular force along the tooth profile.
Machines 12 00570 g003
Figure 4. Schematic representation of the single- and double-tooth meshing regions.
Machines 12 00570 g004
Figure 5. Variation in the inter-tooth load distribution coefficient ( K α ) in terms of the meshing radius ( r i ): (a) normal gear; (b) 1/12 worn gear; (c) 1/6 worn gear; (d) 1/4 worn gear.
Machines 12 00570 g005
Figure 6. Force diagram of the gear tooth profile.
Machines 12 00570 g006
Figure 7. Analytical calculation of the bending stress for both the normal and worn gears: (a) normal gear; (b) 1/12 worn gear; (c) 1/6 worn gear; (d) 1/4 worn gear.
Machines 12 00570 g007
Figure 8. Analytical calculation of the bending stress of the normal and worn gear under various working conditions. (a) Variation in the bending stress in segment B 1 C . (b) Variation in the bending stress in segment C D . (c) Variation in the bending stress in segment D B 2 . (d) Variation in the stress of the wear tooth B 1 C segment compared with the normal tooth. (e) Variation in the stress of the wear tooth C D segment compared with the normal tooth. (f) Variation in the stress of the wear tooth D B 2 segment compared with the normal tooth.
Machines 12 00570 g008aMachines 12 00570 g008b
Figure 9. Mesh and boundary conditions used for the numerical modeling of the rack-and-pinion.
Machines 12 00570 g009
Figure 10. The tooth root stress nephogram of the gear (unit: MPa).
Machines 12 00570 g010
Figure 11. The bending stress variations in the normal and worn gear simulation calculation results: (a) normal gear; (b) 1/12 worn gear; (c) 1/6 worn gear; (d) 1/4 worn gear.
Machines 12 00570 g011
Figure 12. FEM calculation of the bending stress as a function of the working condition and wear: (a) variation in the bending stress in the segment; (b) variation in the bending stress in segment C D ; (c) variation in the bending stress in segment D B 2 ; (d) variation in the stress of the wear tooth B 1 C segment compared with the normal tooth; (e) variation in the stress of the wear tooth C D segment compared with the normal tooth; (f) variation in the stress of the wear tooth D B 2 segment compared with the normal tooth.
Machines 12 00570 g012
Figure 13. Strain gauge sticking and actual pictures of the gear: (a) actual picture of the strain gauge pasting; (b) schematic representation of the strain gauge sticking; (c) actual model of gear; (d) actual model of 1/12 worn gear; (e) actual model of 1/6 worn gear; (f) actual model of 1/4 worn gear (unit: mm).
Machines 12 00570 g013aMachines 12 00570 g013b
Figure 14. Experimental bending stresses of the normal and worn gears: (a) normal gear; (b) 1/12 worn gear; (c) 1/6 worn gear; (d) 1/4 worn gear.
Machines 12 00570 g014
Figure 15. Experimental bending stress changes in terms of the working condition and wear: (a) variation in the bending stress in segment B 1 C ; (b) variation in the bending stress in segment C D ; (c) variation in the bending stress in segment D B 2 ; (d) variation in the stress of the wear tooth B 1 C segment compared with the normal tooth; (e) variation in the stress of the wear tooth C D segment compared with the normal tooth; (f) variation in the stress of the wear tooth D B 2 segment compared with the normal tooth.
Machines 12 00570 g015aMachines 12 00570 g015b
Figure 16. Error analysis of the bending stress under three methods: (a) analytical calculation and experiment; (b) FEM and experiment.
Machines 12 00570 g016
Table 1. Material properties of the rack-and-pinion.
E (MPa) μ ρ (kg/m3) σ Hlim (MPa) σ Flim (MPa)
2.11 × 1050.297850382.5355
Table 2. Design parameters of the rack-and-pinion lifting mechanism.
ParameterValueParameterValue
Module m (mm)18 (62.667)Tooth width of rack b 2 (mm)150
Number of teeth Z 1 17 (16)Tooth height of rack h (mm)80
Pitch circle d 1 (mm)306 (1002.672)Addendum coefficient h a * 1
Pressure angle α (°)20Clearance coefficient c * 0.25
Tooth width of gear b 1 (mm)100 (610)Distance from gear center to rack reference line L (mm)153
Table 3. The division of the single- and double-tooth meshing under normal and wear conditions.
Meshing Interval (mm)Normal1/12 Wear1/6 Wear1/4 Wear
Double-tooth B 1 C segment meshing radius 143.77 ,   149.08 143.89 ,   149.08 144.21 ,   149.08 144.85 ,   149.08
D B 2 segment meshing radius 153.17 ,   171 155.45 ,   171 157.54 ,   171 160.25 ,   171
Single-tooth C D segment meshing radius 149.08 ,   153.17 149.08 ,   153.17 149.08 ,   157.54 149.08 ,   160.25
Table 4. Introduction of the Three Gorges ship lift and test conditions.
Working ConditionWorking Conditions of the Three Gorges Ship Lift F t (KN)Test Bench under PressureCompression Size (t) F t (KN)
WC1−10 cm misloaded water depth headwind to accelerate the rise−583No-load + self-weight of the test bench−(0 + 0.9)18.65
WC2+10 cm misloaded water depth and descending at a constant speed against the wind−770Oil cylinder + lift table dead weight−(0.9 + 0.9)−27.45
WC3−5 cm misloaded water depth rising at a constant speed with the wind957Oil cylinder + lift table dead weight(1.8 + 0.9)−36.25
WC4+5 cm misloaded water depth headwind accelerated descent−1207Oil cylinder + lift table dead weight(2.7 + 0.9)45.06
WC5+5 cm misloaded water depth downwind to slow down and ascend1362Oil cylinder + lift table dead weight(3.6 + 0.9)−56.83
WC6−5 cm misloaded water depth downwind to slow down and descend396Oil cylinder + lift table dead weight−(4.5 + 0.9)64.13
Table 5. Relevant parameters of the worn gear.
ParametersNormal1/12 Wear1/6 Wear1/4 Wear
S (mm)28.2725.9124.7421.20
X 0−0.072−0.133−0.206
α (°)20202020
α a 1 (°)32.78032.09231.49230.749
T (mm)0000
ε α 1.74781.631.531.41
Y ε 0.6790.710.740.78
h F a (mm)29.1328.2826.8927.43
S 1 (mm)33.7532.7731.9131.14
Y F a 2.472.562.582.79
Y s a 1.881.8601.8571.817
Table 6. The change in single-tooth meshing proportion time with wear.
Gear ConditionNormal1/12 Wear1/6 Wear1/4 Wear
Proportion of single-tooth meshing time (%)15.023.531.642.7
Disclaimer/Publisher’s Note: The statements, opinions and data contained in all publications are solely those of the individual author(s) and contributor(s) and not of MDPI and/or the editor(s). MDPI and/or the editor(s) disclaim responsibility for any injury to people or property resulting from any ideas, methods, instructions or products referred to in the content.

