Abstract
New energy vehicles have emerged as a prominent focus in the automotive industry. This study develops a comprehensive modeling specification for fuel cell systems in new energy vehicles and establishes a framework for fatigue life analysis in the frequency domain. First, a finite element model of the fuel cell system was created in accordance with established standards, followed by grid convergence analysis and grid quality correction to enhance model accuracy. Next, random vibration analysis was performed to determine the root mean square (RMS) stress distribution of the fixed plate assembly in a random vibration environment, and the results were validated through experimental tests. Finally, Miner’s linear cumulative damage rule and the rainflow distribution model for random processes were applied to predict the fatigue life of the fixed plate assembly and connecting bolts. Critical locations for potential structural fatigue were identified, and the simulation results were corroborated through fatigue testing. The findings validate the accuracy of the proposed fatigue analysis framework and offer valuable insights for the continued development of fuel cell systems.
1. Introduction
Compared to conventional fuel vehicles, current fuel cell systems exhibit lower energy density and require additional components, leading to increased overall mass. Further, extending the driving range necessitates additional mass in the battery system, which in turn introduces structural reliability challenges that hinder the development of new energy vehicles.
Considerable research has been dedicated to enhancing the reliability and fatigue life prediction of new energy vehicles. Hasan et al. [1] employed a numerical approach to predict the fatigue life of polymer electrolyte membranes, correlating mechanical durability with hydration-induced cyclic stresses. Kim [2] proposed a multi-material battery pack design for electric vehicles, evaluating its performance through random vibration fatigue tests. Researchers such as Chen [3] and Wen [4] utilized topology optimization for various fuel cell system components. Shojayian et al. [5] developed a statistical model to predict fuel cell membrane degradation during vehicle operation, integrating finite element simulations and genetic algorithms for parameter calibration. Salunkhe et al. [6] focused on designing a lightweight and durable front axle for electric and fuel cell buses, emphasizing fatigue behavior and strength optimization. Kim et al. [7] assessed the vibration reliability of fuel cell stack structures, employing the Dirlik method. Xu and Wang [8] introduced a fatigue damage spectrum-based approach to optimize vibration durability testing for vehicle batteries under diverse environmental conditions. Xu [9] explored the fatigue and impact performance of Mg/Al wheels, optimizing riveting parameters for enhanced durability and lightweight design. Dong et al. [10] developed a lightweight two-stage protection structure for locomotive battery boxes, addressing thermal management and structural integrity while reducing cost and weight.
Despite these advancements, there remains limited research on the overall structural reliability analysis of fuel cell systems. Structural fatigue continues to be a critical factor that requires attention [11,12,13,14]. In the context of structural vibration fatigue, Lu et al. [15] studied the random vibration fatigue behavior of directionally solidified superalloys, proposing an improved frequency-domain life prediction model. Zhang et al. [16] applied random vibration fatigue analysis to optimize the design of a power battery bracket for electric trucks, achieving significant mass reduction while maintaining fatigue life, validated through finite element modeling and proving ground testing. Wang et al. [17] introduced a deep learning-based framework for predicting the fatigue life of car seat frames under random vibrations, improving efficiency and real-time analysis. Zhang et al. [18] developed a long short-term memory (LSTM)-based method for non-stationary vibration fatigue life prediction, enhancing accuracy and computational efficiency for automotive components. Zhang et al. [19] used a dual-objective optimization method (NSGA-II) to enhance the crushing stress and vibration fatigue life of electric vehicle battery pack systems. Czerlunkiewicz et al. [20] explored the integration of finite element analysis (FEA) in early design validation to predict vibration fatigue in automotive components, comparing various computational methods for estimating durability under cyclic loading conditions.
This study focuses on the fuel cell system of new energy vehicles, integrating random vibration testing with computational simulations. It defines a general modeling specification for fuel cell systems and investigates their fatigue life under random vibration conditions. The research process, establishes a framework for fatigue life analysis and lightweight design. The standardized analysis approach developed here provides insights for the future research and development of fuel cell systems.
2. Basic Theoretical Model
2.1. Miner Linear Damage Accumulation Theory
In the linear fatigue damage accumulation theory, the fatigue damage of the structure can be accumulated linearly, and each stress level is independent and unrelated to the other. When the accumulated damage value reaches a certain value, the structure or specimen will be fatigued. Palmgren–Miner theory [21] (Miner criterion for short) is a typical linear fatigue cumulative damage theory. This criterion assumes that the life of the structure at a certain stress level is N, and the structural damage D under a single cyclic load is expressed as Equation (1); under the action of n loads at this stress level, the damage D caused to the structure is expressed as Equation (2); under the action of loads with continuously changing amplitudes, the formula for the structural damage D is expressed as Equation (3).
where n(Si) represents the number of load cycles with stress amplitude of Si per element time; N(Si) represents the structural fatigue life corresponding to the stress level on the S-N curve.
Miner’s criterion introduces critical fatigue damage DCR to determine the fatigue failure of the structure. It stipulates that when DCR = 1, when DCR > 1 the structure will suffer fatigue failure. Therefore, the fatigue life of the structure can be calculated using Equation (4).
As a simple linear damage accumulation criterion, the Miner criterion does not consider the effect of the load loading order on damage. In actual engineering, when the number of load levels is small, the fatigue damage of the structure is greatly affected by the load loading order. At this time, the result obtained by applying the Miner criterion is quite different from the actual result. For random loads, the effect of the load loading order is small, so the Miner criterion is still widely used in engineering. In this study, Miner’s linear cumulative damage theory is used to calculate the fatigue damage of the battery pack fixing plate under random vibration conditions.
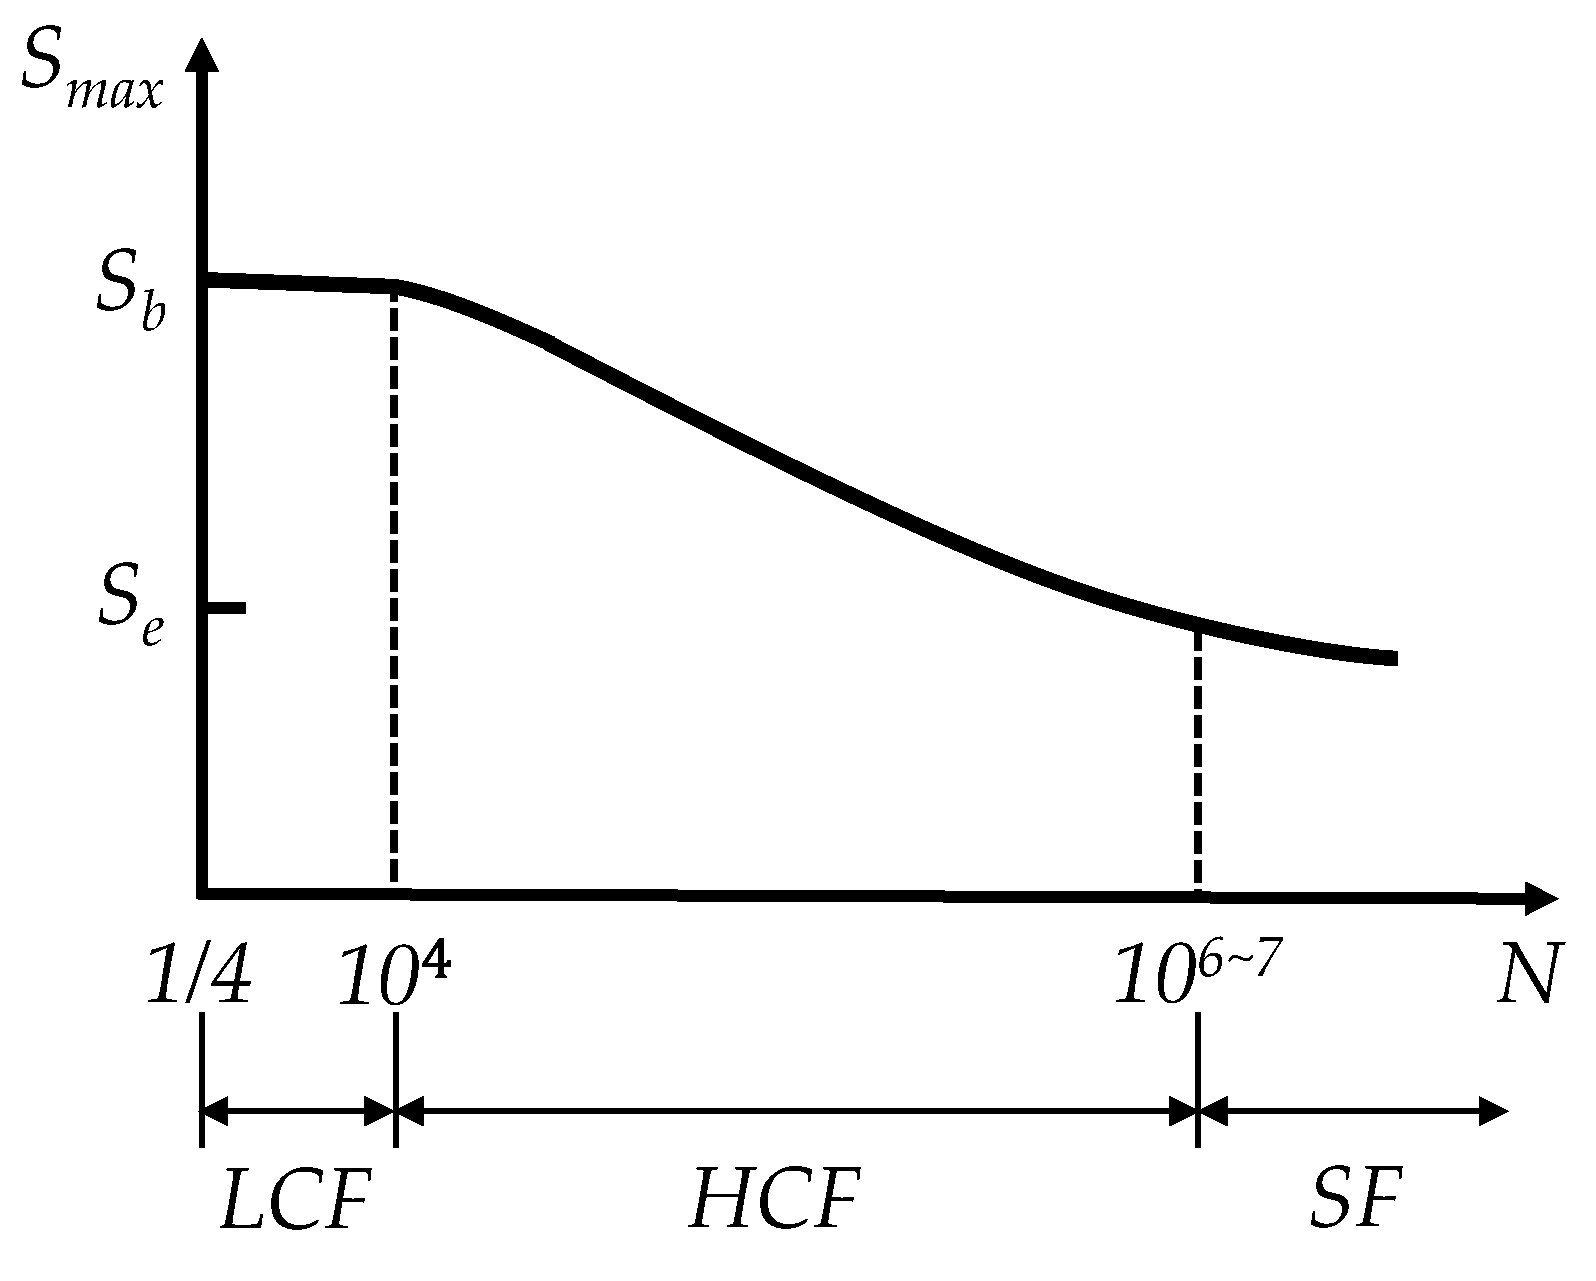
For high cycle fatigue, it is necessary to establish the relationship between applied stress and fatigue life, namely the S-N curve, or the wohler curve. The S-N curve includes three regions: low cycle fatigue region (LCF), high cycle fatigue region (HCF), and sub-fatigue region (SF), as shown in Figure 1.
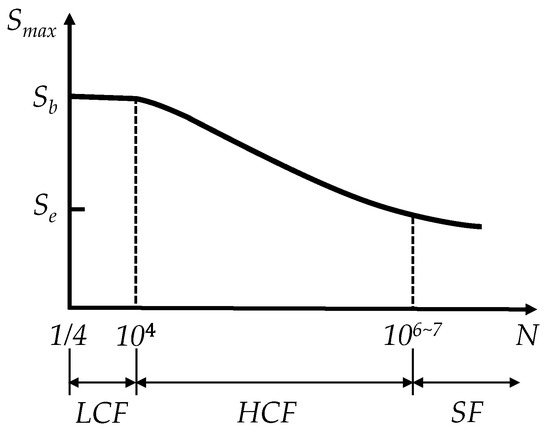
Figure 1.
Typical S-N curve.
The random vibration problem of the fuel cell system usually belongs to high cycle fatigue. The fatigue problem usually occurs in the HCF or SF area. The formulas describing the curve in the high cycle fatigue area include the exponential function formula, power function formula, Basquin formula, Weibullgo formula, and other forms. Among them, the power function formula is widely used [22]. The formula is expressed as Equation (5). Taking the logarithm of the left and right sides, we obtain Equation (6). In the logarithmic coordinate, the life and stress amplitude are linearly related.
where a and b are material constants obtained by curve fitting.
2.2. Power Spectral Density (PSD)
For random vibration signals, the correlation function can be used to describe the signal’s characteristics of change over time, and PSD can be used to describe the signal’s characteristics of change over frequency [23]. The autopower spectral density function Sxx(ω) and the autocorrelation function Rxx(t) are a pair of Fourier transforms, called the Wiener–Khinchin formula, as shown in Equation (7):
Another method is used here to calculate the autopower spectral density, that is, first perform Fourier transform on the vibration signal to obtain its spectrum X(f), and then multiply the spectrum with its own conjugate XH(f) to obtain the autopower spectrum. The power spectral density G(f) represents the energy distribution per element frequency, which can be expressed by dividing the autopower spectrum by the frequency resolution. It generally refers to the unilateral power spectral density.
where N is the total number of sampling points, fs is the sampling frequency, and PSD describes the variance of the excitation or response as the frequency changes. Its digital characteristics can be characterized by spectral moments of various orders. The formula is as follows:
Among them, m0, m1, and m4 represent the zero-order moment, second-order moment, and fourth-order moment of the PSD, respectively. The irregular factor λ is usually introduced to determine whether the vibration is a narrowband process or a broadband process:
when λ is close to 0, it is a broadband process; when λ is close to 1, it is a narrowband process; λ = 0 indicates white noise. The mean positive crossing rate v+ and peak crossing rate vp of the Gaussian random vibration signal in engineering are expressed as:
2.3. Stochastic Process Rain Flow Distribution Model
According to the probability density function of random signals, assuming that the amplitude probability density function of random load under stress level Si is p(Si), and the number of load cycles to which the structure is subjected per element time is v, then the number of stress cycles within the stress range (Si, Si + ∆Si) within time T is:
Combined with Miner’s linear cumulative damage law, under a continuous stress state, the cumulative damage D within time T is:
Then the fatigue life in time T is:
Combining the power function S-N curve, we can obtain:
It can be seen from Equation (15) that obtaining the stress amplitude probability density function of the structural response is the key to analyzing its fatigue life.
For a narrow-band random process, the peaks and troughs appear alternately. Therefore, a Rayleigh distribution can be used to approximate the narrow-band amplitude probability density function. The influencing factor is the root mean square σ of the stress random process, see Equation (16).
where α is the shape parameter and β is the scale parameter.
When the model is an ideal narrowband distribution random process, the rain flow amplitude distribution is Rayleigh distribution, and the shape function is α = 2. When the bandwidth parameter gradually increases, the shape parameter gradually decreases. The relationship between the shape parameter α and the bandwidth coefficient ε can be written as:
β reflects the amplitude variation range in the rain flow amplitude distribution model in the narrow-band random process. Its main influencing factors are the root mean square σ and the irregular factor γ. The relationship between them can be expressed by Equation (18):
when the vibration load is a broadband response, the low-frequency stress cycle and the high-frequency stress cycle work together, and the mean of the high-frequency stress cycle is usually a non-zero value, so the peak value of the broadband stress cycle is usually larger than its stress amplitude. At this time, the narrowband distribution model is no longer applicable. Dirlik [24] uses an empirical formula to estimate the probability distribution model of the rain flow cycle amplitude through Monte Carlo simulation. The Dirlik method formula is relatively complex, but it has strong adaptability and high accuracy. It is the current mainstream rain flow distribution model. Its empirical formula is:
where ; ; ; ;
; ; ;
3. Analysis Process
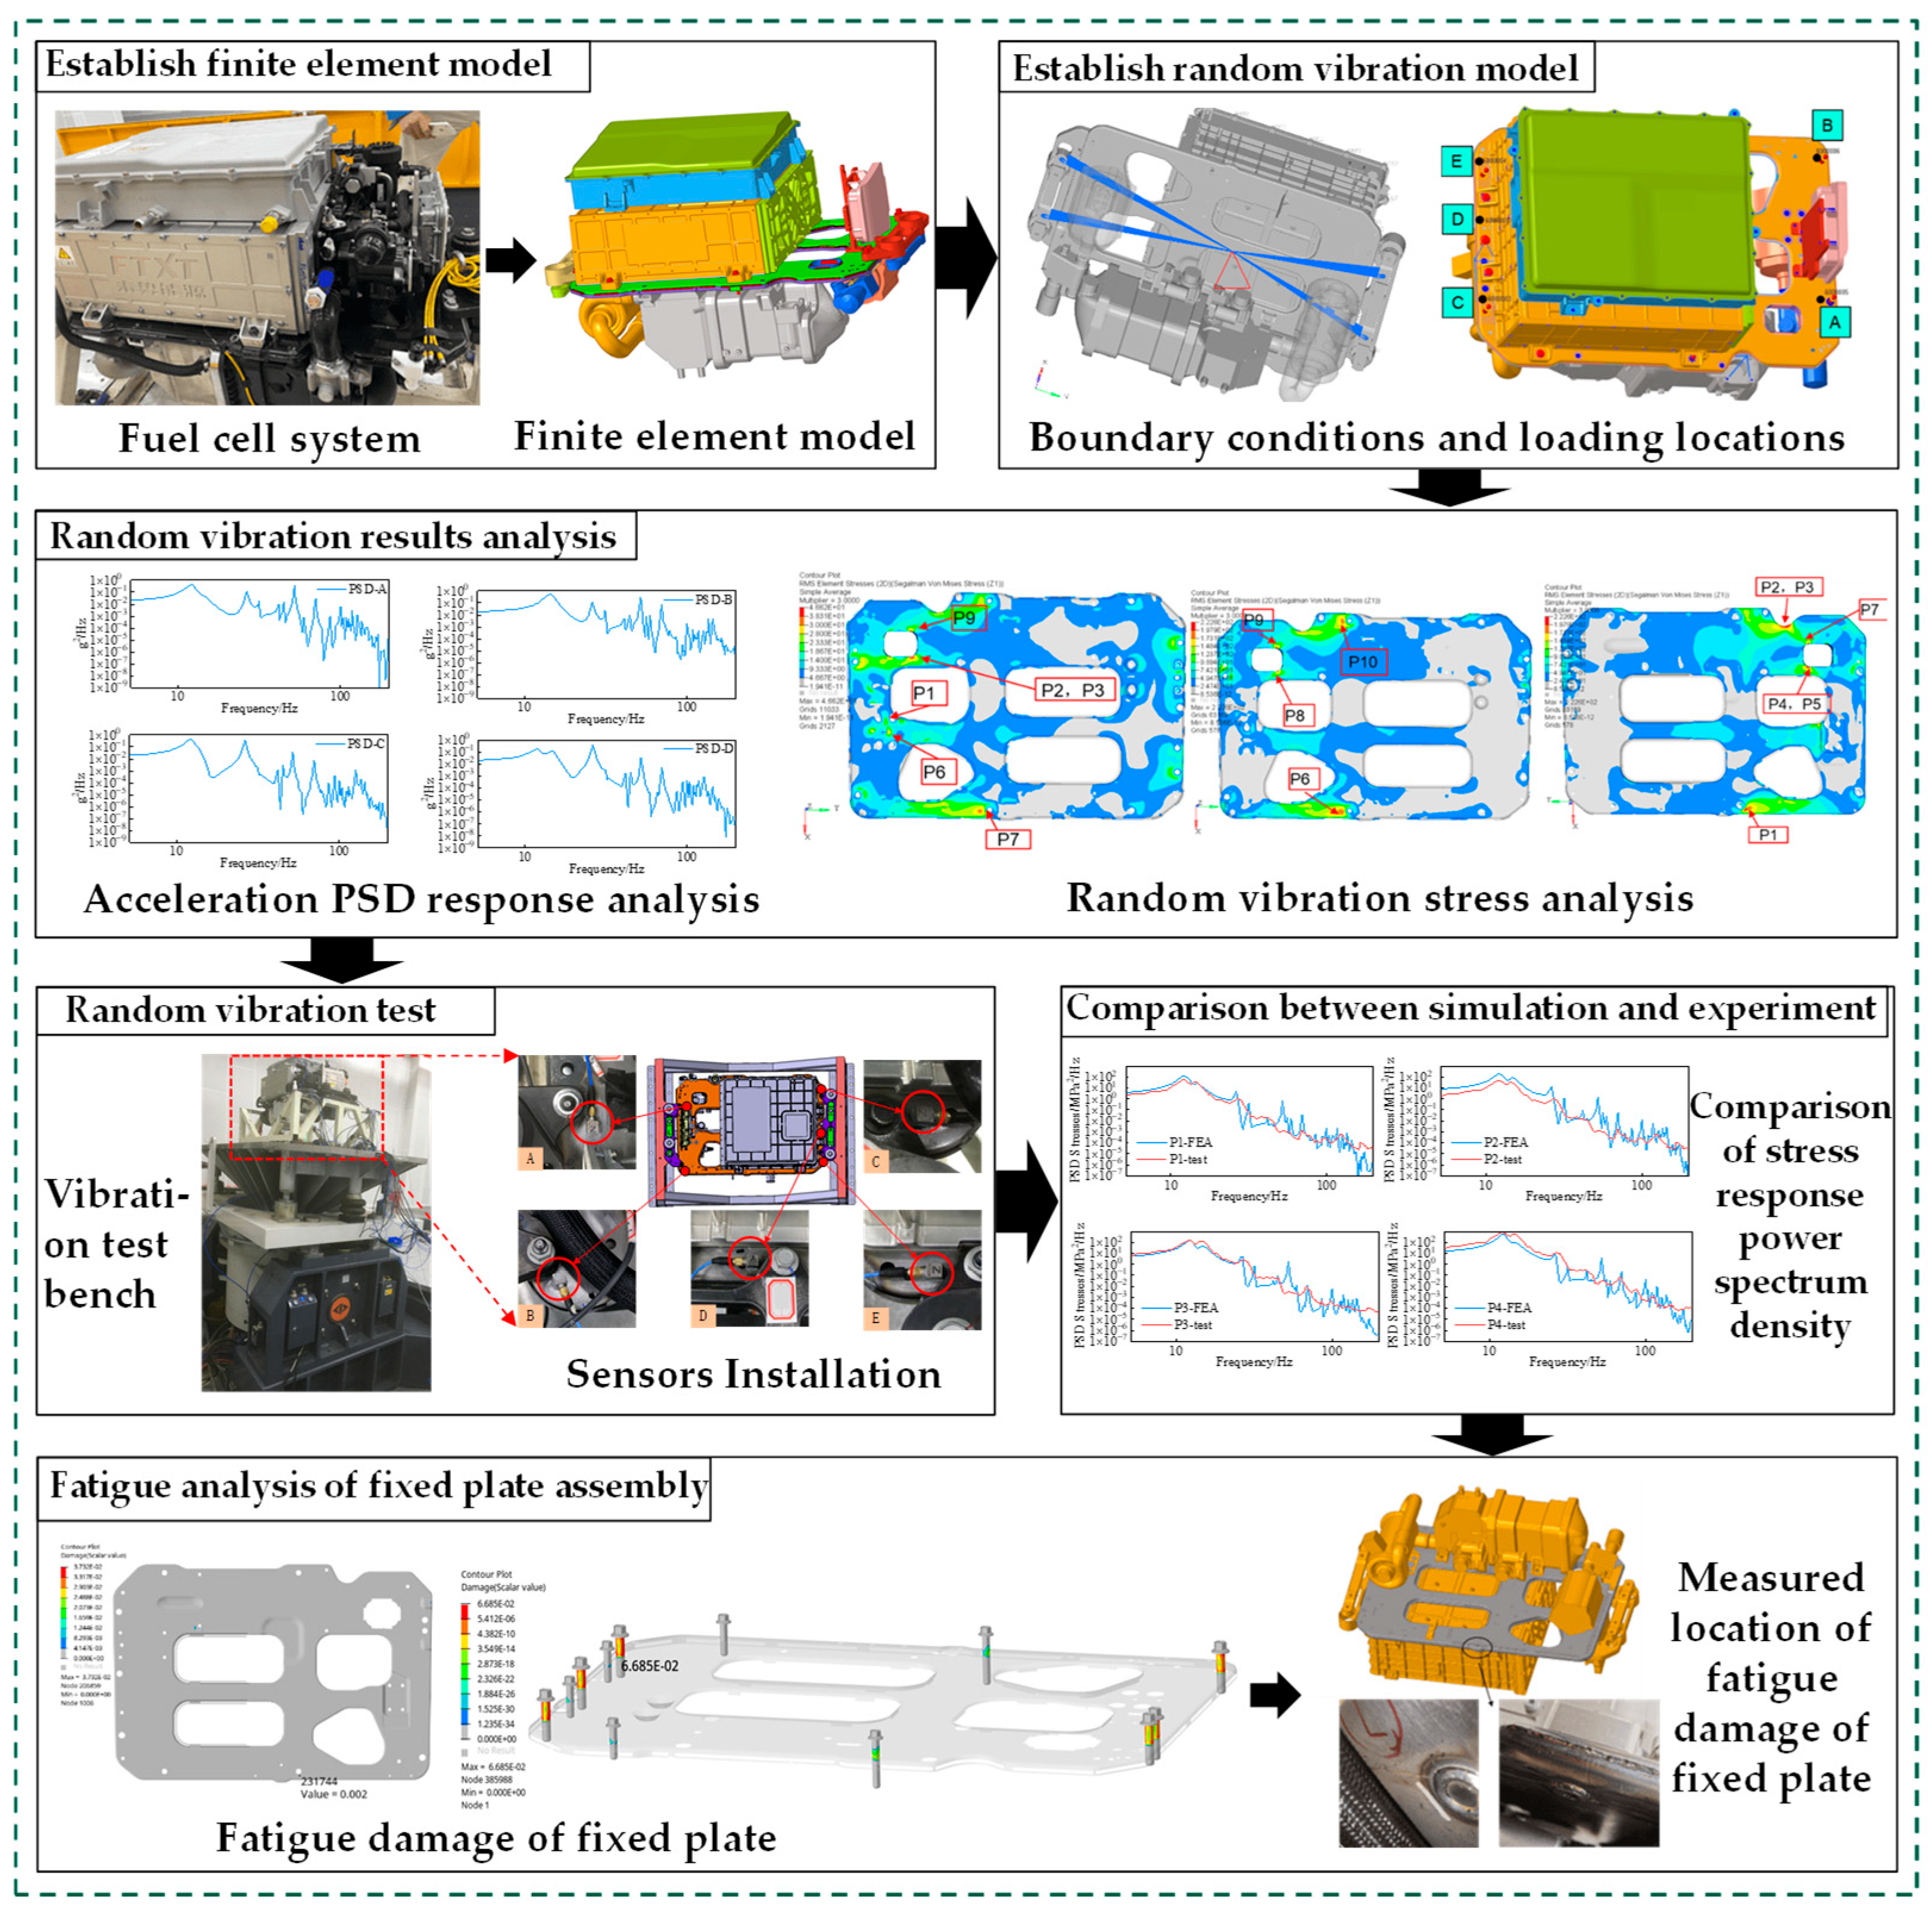
Figure 2 presents a schematic representation of the research framework outlined in this study. Initially, a finite element model of the fuel cell system is developed based on the computer aided design (CAD) model, adhering to industry-specific standards. Subsequently, the random vibration conditions specified in GB/T 2423.43 are applied as excitation inputs. The analysis involves performing a frequency-domain random vibration root mean square (RMS) stress analysis, alongside an acceleration power spectral density analysis of the fuel cell system assembly. These simulation results are then compared with experimental data obtained from corresponding random vibration tests. Finally, employing frequency-domain fatigue analysis theory, the S-N curve for the material of the fixed plate assembly in the fuel cell system is derived. Using Miner’s rule for linear cumulative damage, the fatigue life of both the fixed plate assembly and its connecting bolts is predicted. Critical locations exhibiting significant structural fatigue damage are identified, and the reliability of the simulation outcomes is validated through experimental fatigue testing.
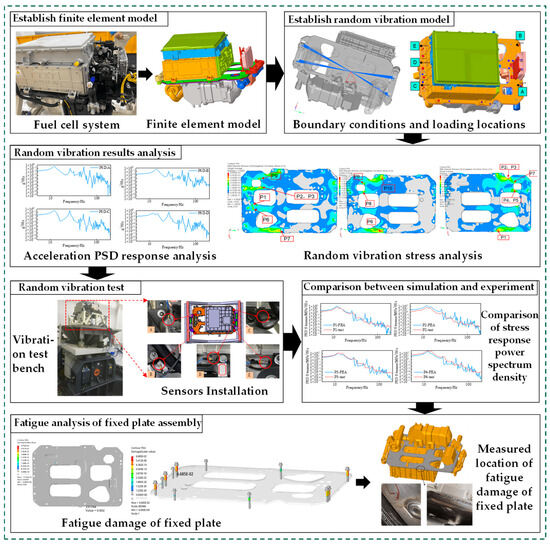
Figure 2.
Fuel Cell System Fatigue Analysis Framework.
4. Random Vibration Simulation Analysis
4.1. Establishment of Finite Element Model of Fuel Cell System
Fuel cells have gained significant traction in the automotive industry owing to their high energy conversion efficiency, low noise levels, and zero-emission characteristics, among other advantages. This study focuses on a hydrogen fuel cell system integrated into a specific vehicle model, as illustrated in Figure 3. The individual components of the fuel cell system are mounted on both the upper and lower surfaces of a support plate via bolted connections or welding. These components are subsequently linked to the vehicle’s body through a suspension bracket. The overall fuel cell system is characterized by a complex assembly of various parts and intricate structural configurations.

Figure 3.
Physical image of battery pack and three-dimensional solid image.
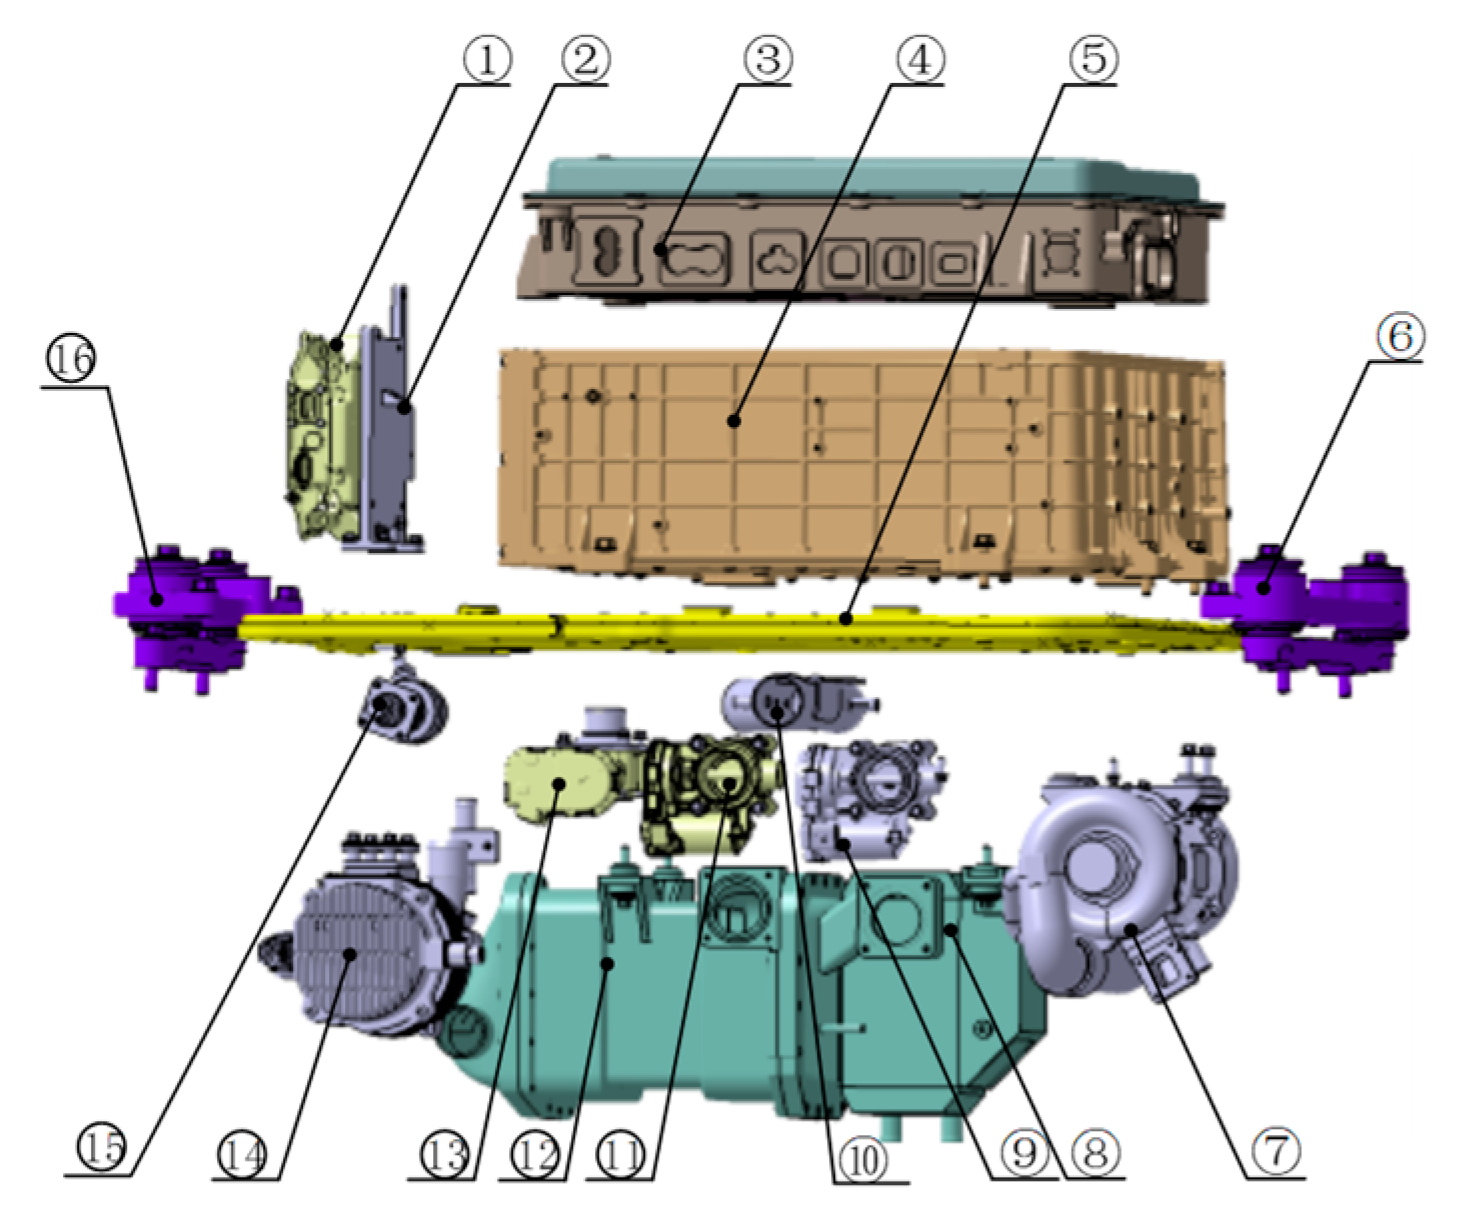
The fuel cell system comprises seven primary assemblies: the DC/DC converter, stack, cooling module, system suspension, system fixing plate, electrical module, and air module. The geometric models of these assemblies are depicted in Figure 4, while the fundamental parameters of each assembly’s components are summarized in Table 1. Detailed material specifications are provided in Table 2 [2].
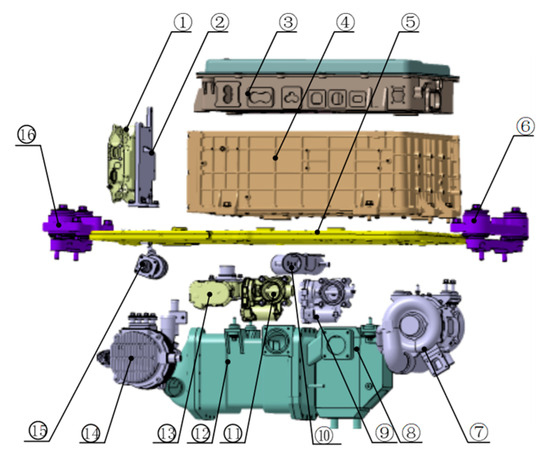
Figure 4.
Fuel cell system geometry diagram.

Table 1.
Basic parameters of each assembly.

Table 2.
Material parameters.
The DC/DC converter is bolted to the stack shell, which in turn is mounted at the upper end of the support plate using bolts. The cooling assembly’s primary function is to regulate the stack’s temperature and consists of a heater, heater bracket, and cooling pump. These components are affixed to the upper and lower surfaces of the support plate by bolts. The system suspension assembly comprises suspension brackets on both sides, with each bracket consisting of a rubber suspension and a connecting bracket. The fuel cell system is connected to the vehicle body through the suspension assembly. The system’s fixed plate assembly, consisting of a fixed plate and reinforcement plate, plays a crucial role in supporting and securing the various system components. As the primary load-bearing element of the fuel cell system, its structural integrity is vital to the overall safety of the system.
The fuel cell system investigated in this study features a substantial number of components, with intricate geometric details such as cooling fins and numerous manufacturing process features (e.g., chamfers, countersunk holes). To enhance modeling efficiency and simplify the mesh generation process without compromising computational accuracy, certain geometric features may be omitted. Specifically, components with thicknesses significantly smaller than their length and width dimensions are modeled using PSHELL elements. Prior to mesh generation, the mid-surface of the plate and shell parts must be extracted. However, complex geometries may lead to issues such as damaged or duplicated surfaces and free edges in the extracted mid-surfaces. Therefore, a careful verification and cleaning process is necessary to remove tolerance errors and eliminate free edges before mesh division. The specific simplification guidelines are as follows:
- (a)
- Holes with diameters smaller than 3 mm are excluded from the model to improve mesh quality.
- (b)
- For small flanges, a single row of elements is sufficient; however, when the flange size exceeds twice the size of the basic element, at least two rows of elements are required.
- (c)
- Chamfer features smaller than half the size of the basic element can be ignored unless stress concentration occurs at the chamfer, in which case the chamfer should be retained.
RBE2 elements are rigid elements commonly used to simulate connections such as bolts, screws, welding, and bonding, with the advantage of not requiring material or section properties. In fuel cell systems, bolt connections between assemblies are typically modeled using RBE2 elements. For the heater and fixing plate brackets, which are coated with white hard glue, the range of the RBE elements is appropriately expanded to reflect this coating. In modeling the fixed plate assembly of the fuel cell system, both TRIA3 and QUAD4 shell elements are suitable for meshing. To improve calculation accuracy, the QUAD4 mesh ratio should be maximized. The initial mesh size is recommended to be 8 mm, with the final size determined through mesh convergence analysis. For three-dimensional meshing, 3D elements such as tetrahedral (TETRA4) and hexahedral (CHEXA) elements are commonly employed. For regular geometries like cuboids and cylinders, CHEXA elements are preferred to improve accuracy. For more complex geometries, TETRA4 elements are recommended. For the suspension bracket, chamfer features are preserved, and a tetrahedral mesh is used, with an element size of 3 mm. The mesh size at the chamfer is adjusted based on its dimensions. The suspension bushing, composed of rubber is difficult to model in detail due to its complex dynamic properties. To simplify, a fixed stiffness model is used for the rubber bushing, with CBUSH elements simulating its mechanical properties. Average stiffness values are applied in the X, Y, and Z directions.
Simulation errors primarily arise from model simplifications and numerical truncation, referred to as model errors and computational errors, respectively. Generally, reducing the grid cell size decreases model errors and enhances result accuracy. However, smaller element sizes lead to exponentially higher computational costs. Therefore, selecting an appropriate element size is crucial for balancing computational efficiency with analysis accuracy. The optimal grid size is determined through grid convergence analysis.
In this study, grid sizes of 3 mm, 5 mm, and 8 mm were used, with the modal frequencies of the first six modes of the fuel cell system listed in Table 3. The first mode shape is illustrated in Figure 5. Results show that varying grid sizes result in modal frequency changes within 2%, with similar mode shapes. Thus, a 3 mm grid size appears to have reached convergence, and the results for 5 mm and 8 mm grids are within acceptable error limits. The appropriate grid size for each fuel cell assembly can be selected based on its significance in the analysis.

Table 3.
System-constrained modal frequency comparison/Hz.

Figure 5.
Modal frequencies at different element sizes: (a) 3 mm grid first-order mode; (b) 5 mm grid first-order mode; (c) 8 mm grid first-order mode.
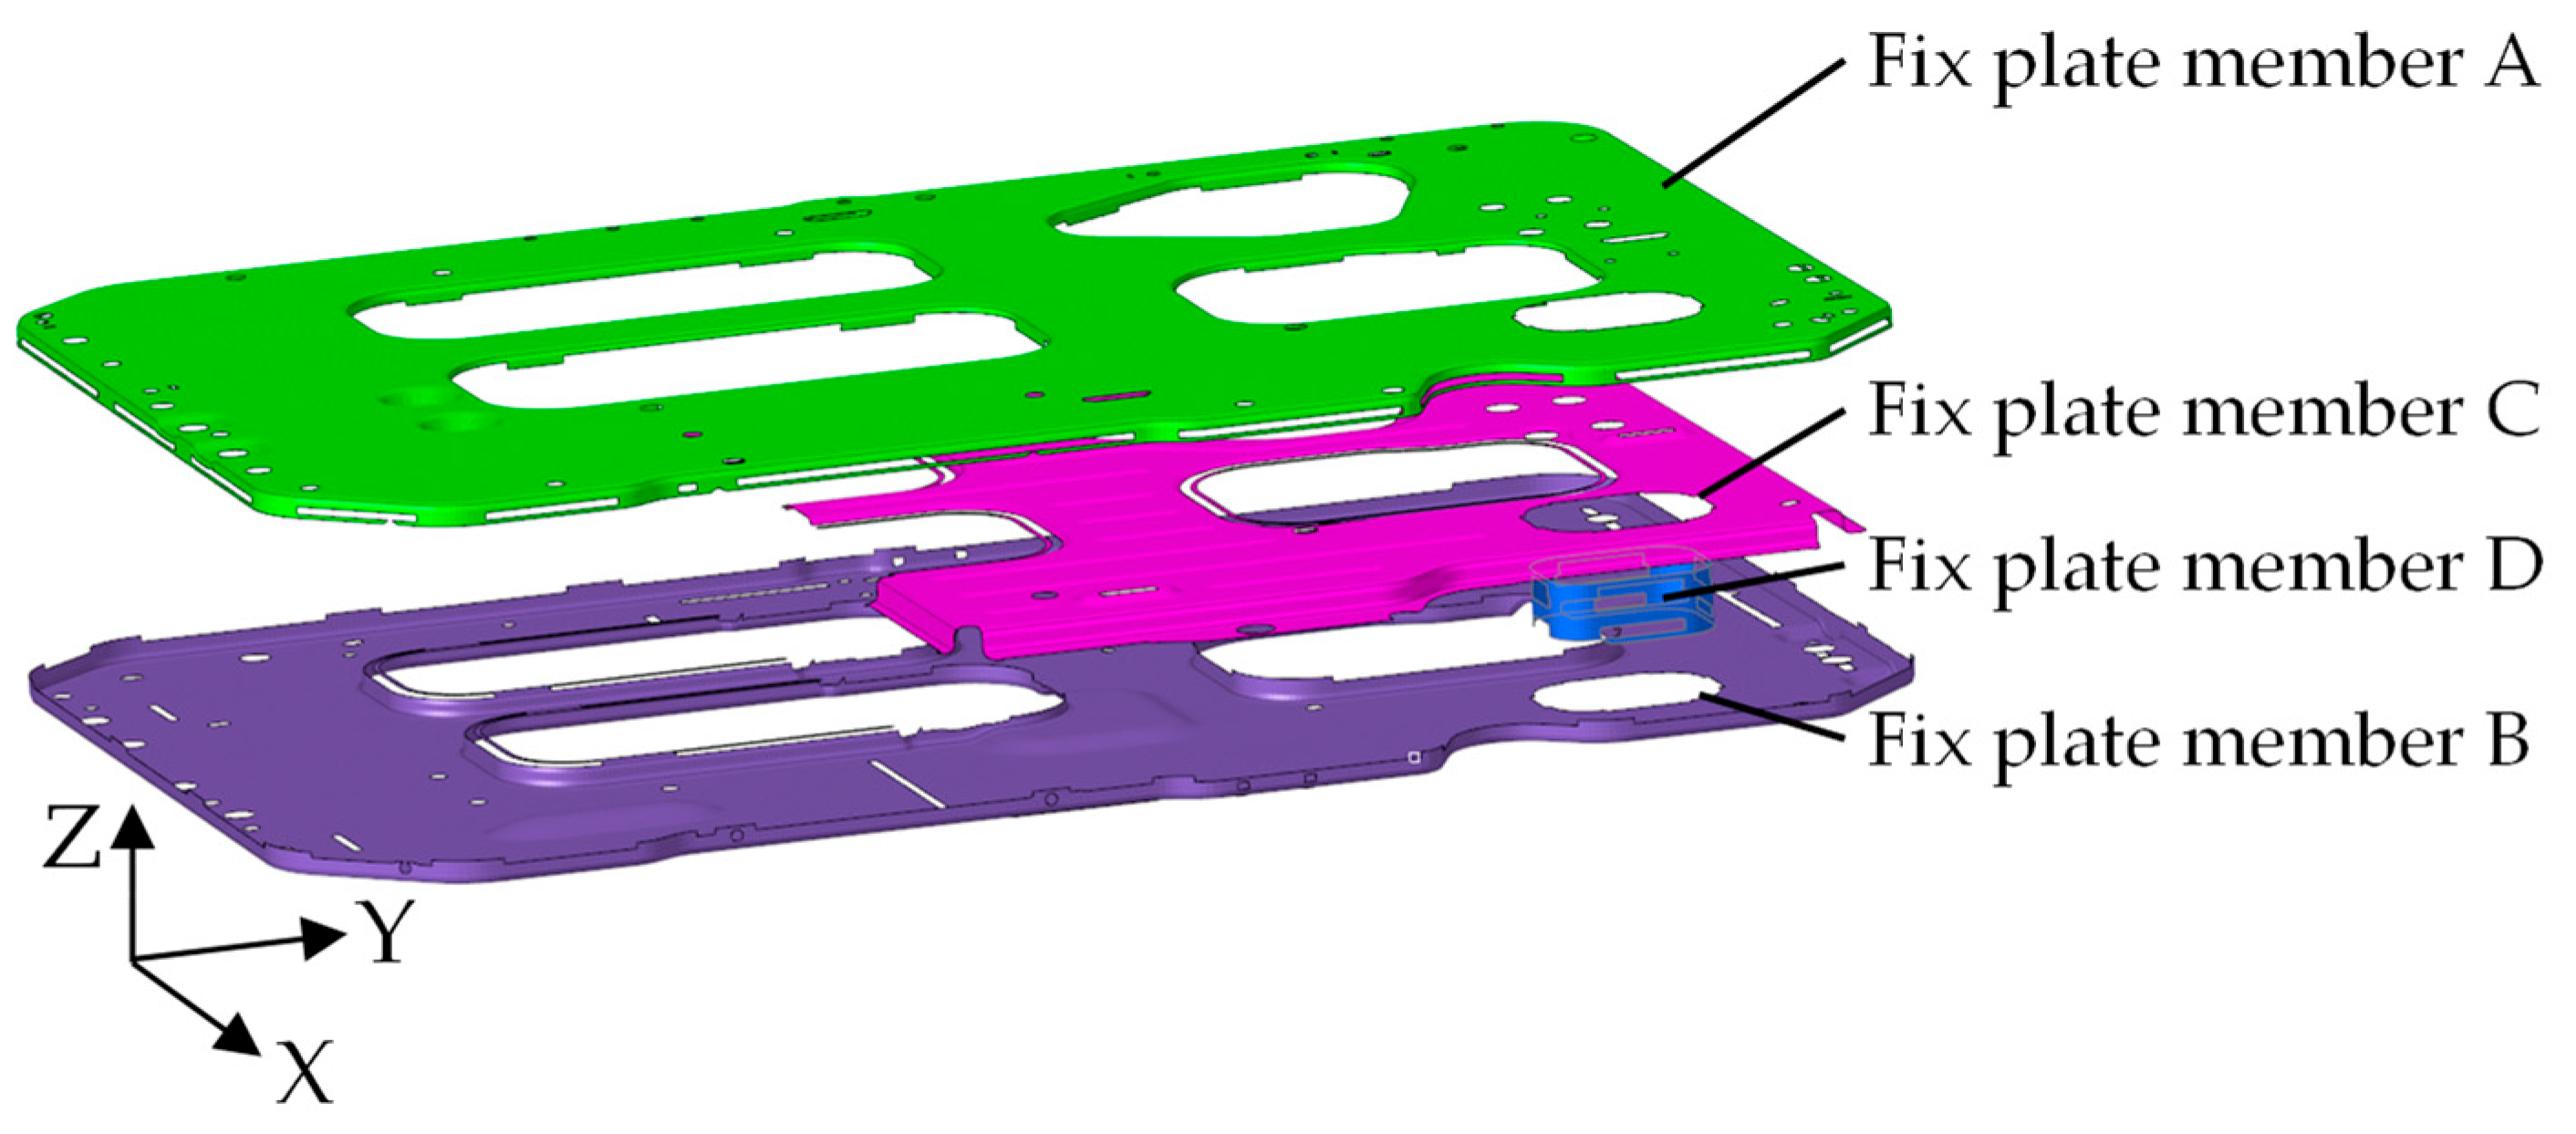
The system fixed plate assembly serves as the primary support structure for the entire fuel cell system. Each assembly is attached to the fixed plate using bolts and other fastening methods. Due to its significant stress concentration, the fixed plate is critical for fatigue life analysis and requires detailed modeling. The structure and key parameters of the fixed plate assembly are presented in Figure 6 and Table 4, respectively.
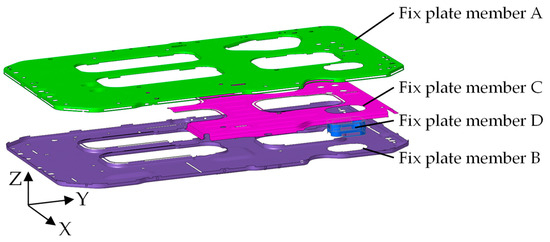
Figure 6.
Fixed plate assembly geometry diagram.

Table 4.
Fixed plate size parameter table.
The fuel cell system fixed plate assembly is mainly meshed with quadrilateral shell elements. The element thickness is set to 2 mm and the element size is 3 mm. At the bolt-hole position, the element size can be set to 2 mm. At the same time, the washer element is set to 2~3 layers, as shown in Figure 7a. It is required that the proportion of triangular elements does not exceed 3%, and the Jacobian ratio is not less than 0.6.

Figure 7.
Features of threaded holes: (a) Meshing at screw holes; (b) Threaded hole CAD model; (c) Finite element model of threaded hole.
The intercooler, stack housing, and other components are connected to the fixed plate assembly by bolts. Threaded tubes are welded to the corresponding screw holes on the fixed plate. Due to the accumulation of welding materials, the material thickness around the screw holes increases. The cross-section of the screw holes in the CAD model is shown in Figure 7b. Therefore, it is necessary to set the material properties of the elements around the screw holes to have a thicker thickness, as shown in Figure 7c below.
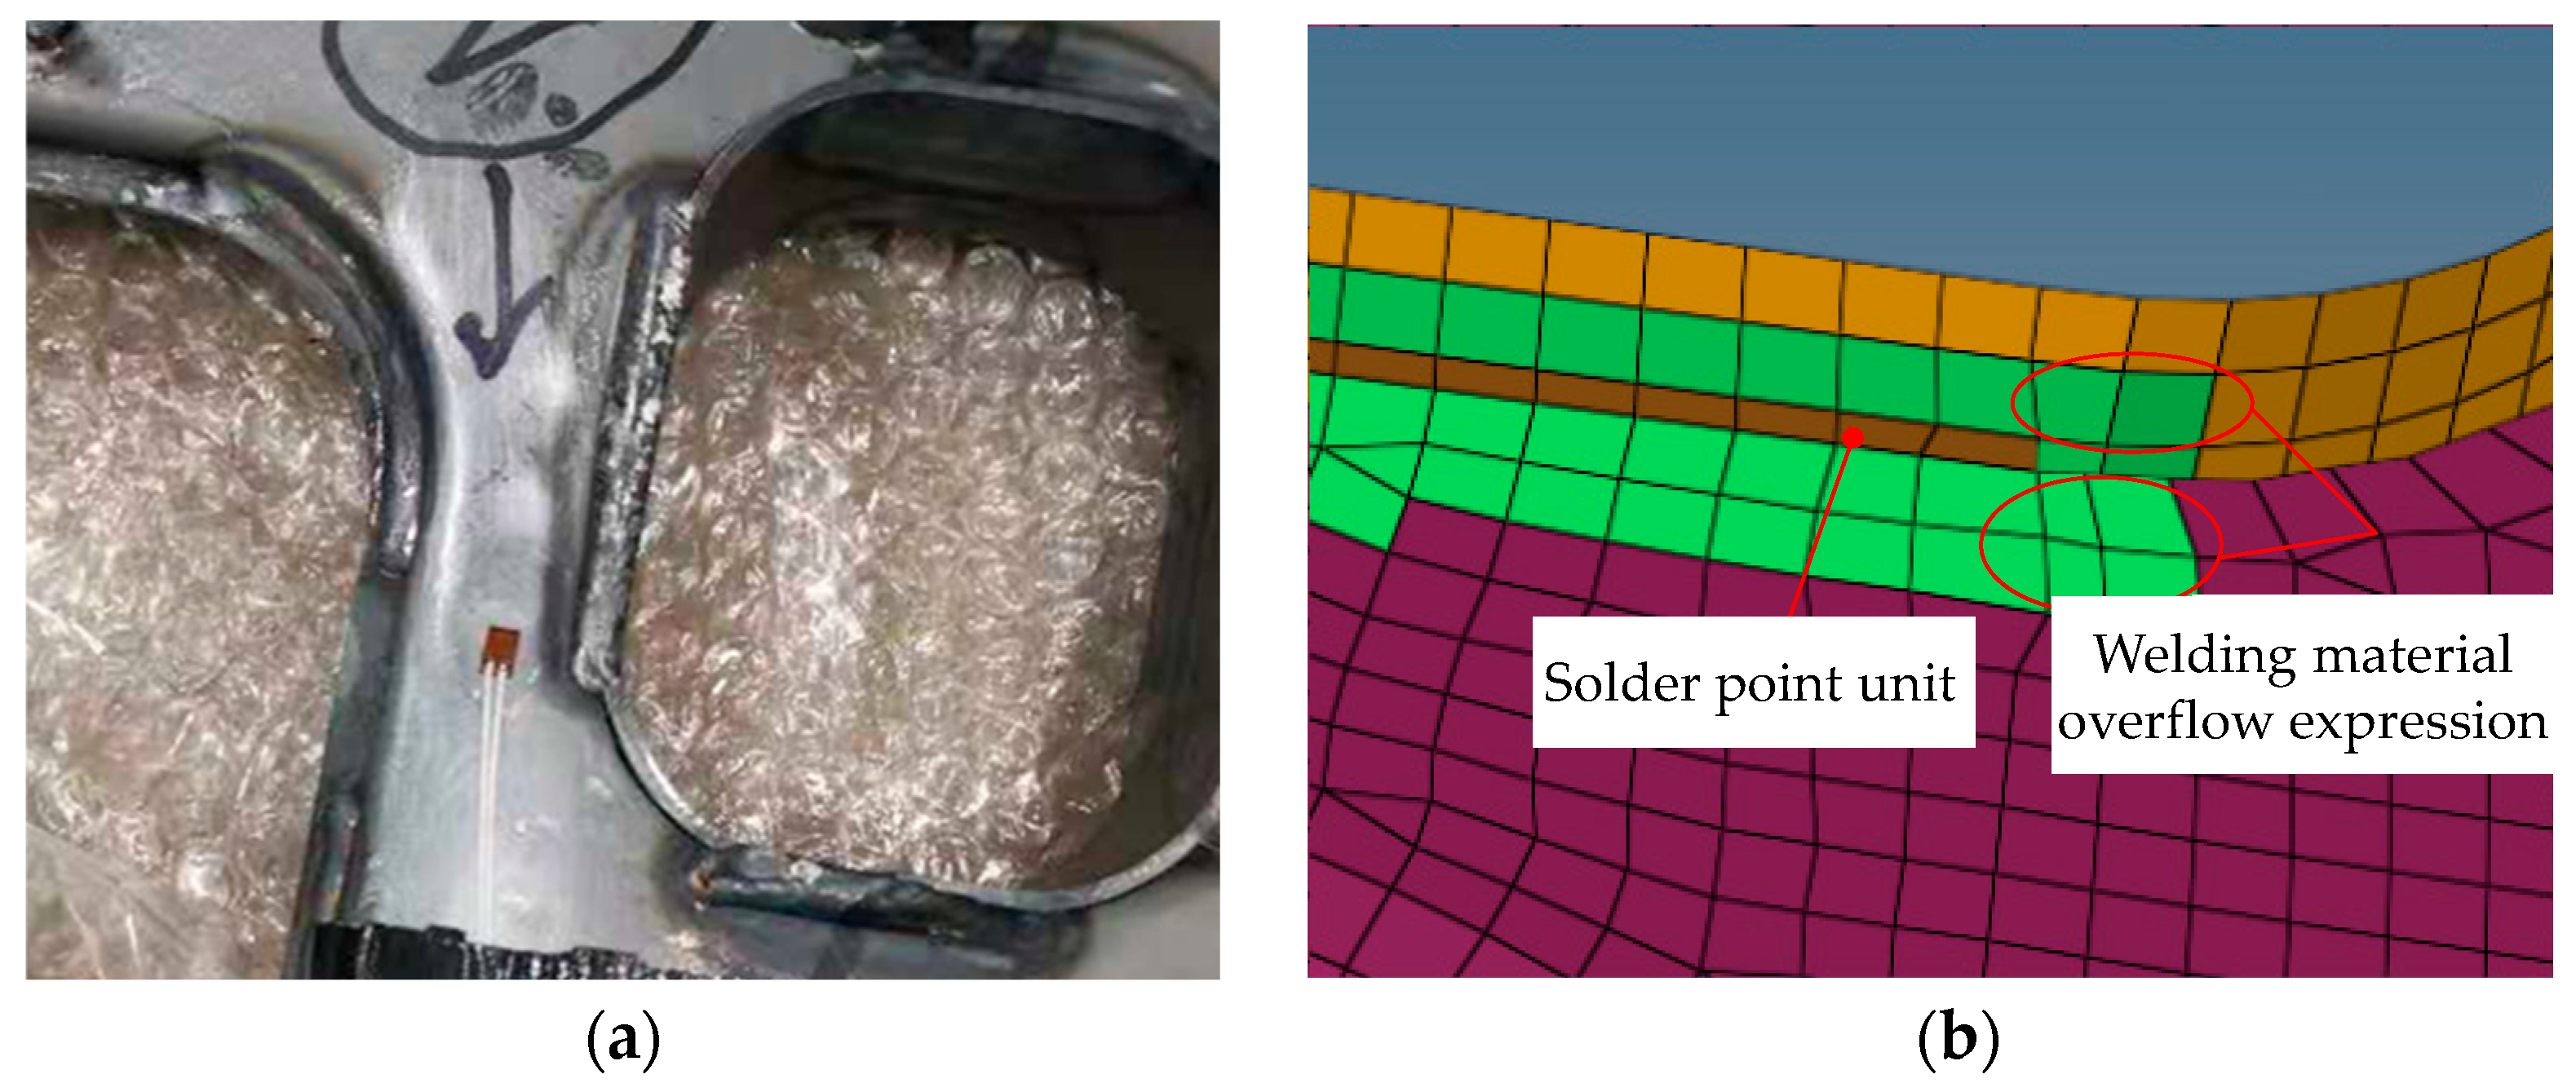
The fixed plate assembly is mainly composed of the upper support plate component A, the lower support plate component B, the middle reinforcement support plate component C, and the annular component D, and each component is connected to the other by welding. The weld connection includes weld elements and surrounding connection elements. For the connection element, the element can be moved from the support plate to a new layer as a connection element, and then the material properties of the welding are assigned; for the welding element, CQUAD element division is used, and the welding material properties are assigned, and the element thickness is set to 4 mm. Considering the actual situation that the welding material overflow area of the welding part is large, as shown in Figure 8a below, 2~3 rows of elements are selected at the beginning and end of each weld during modeling, and the modeling is shown in Figure 8b.
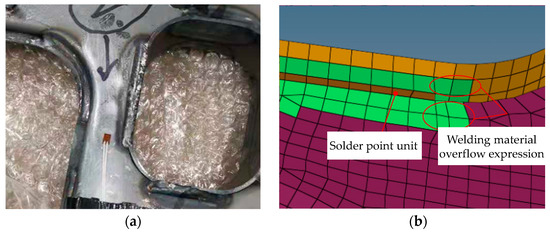
Figure 8.
Welding position modeling: (a) Welding position diagram; (b) Finite element model of welding position.
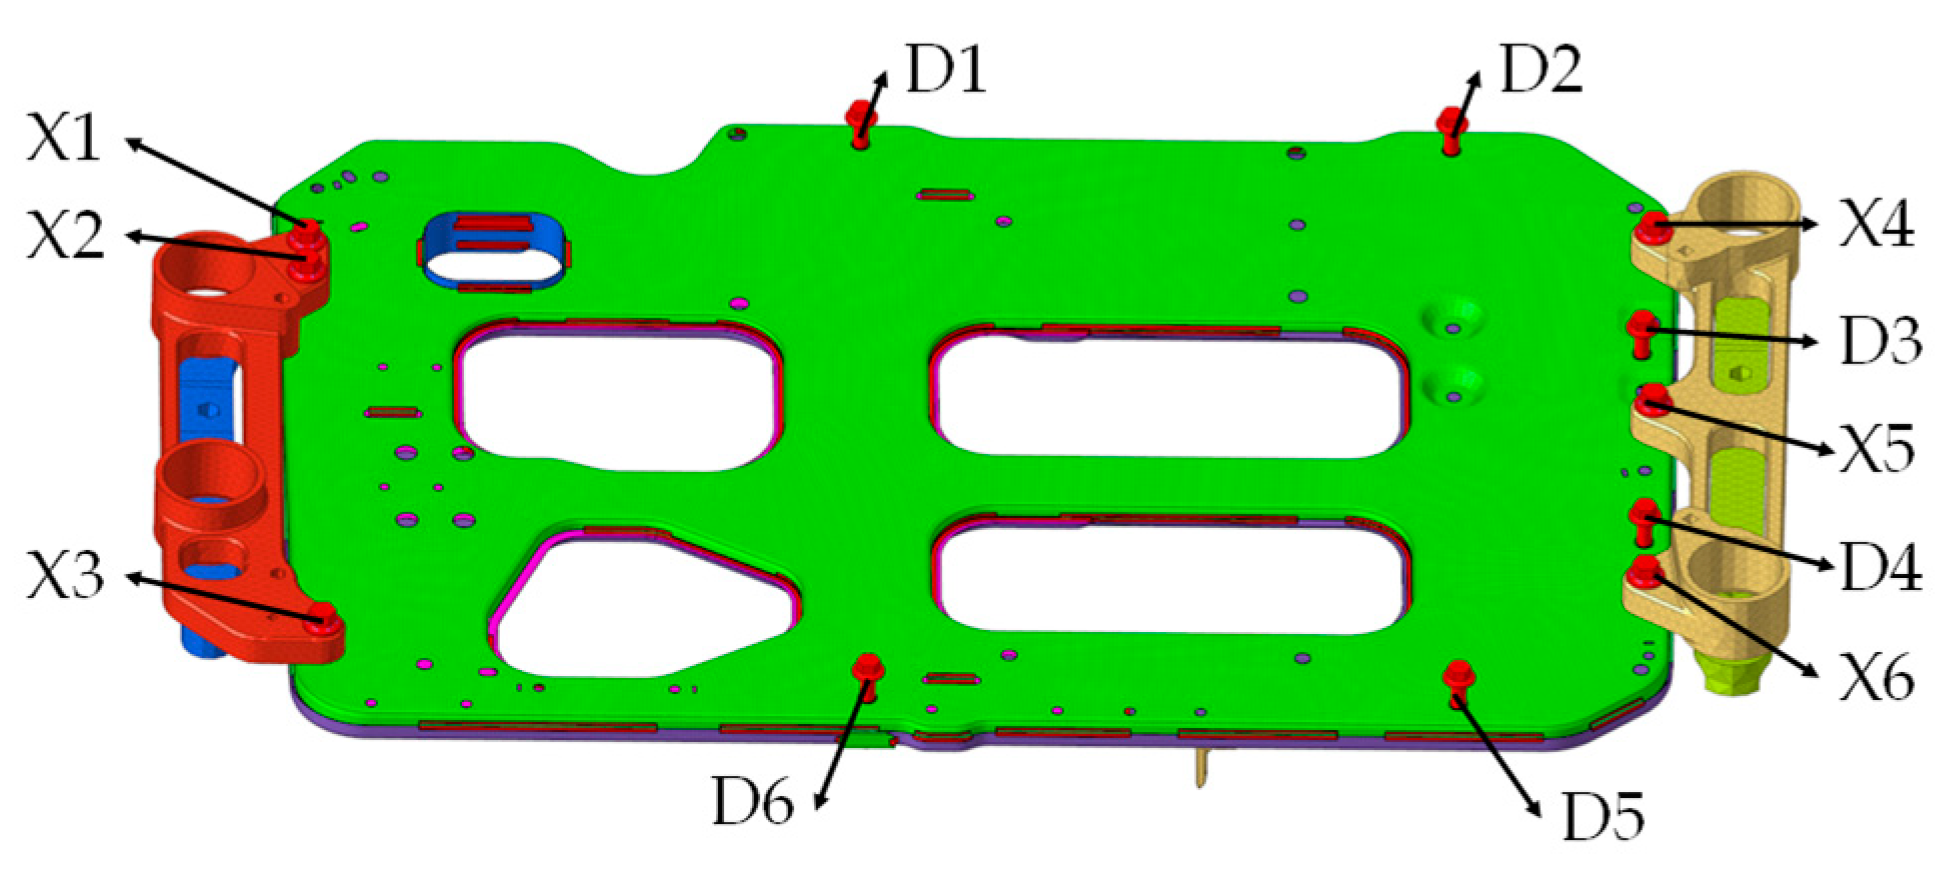
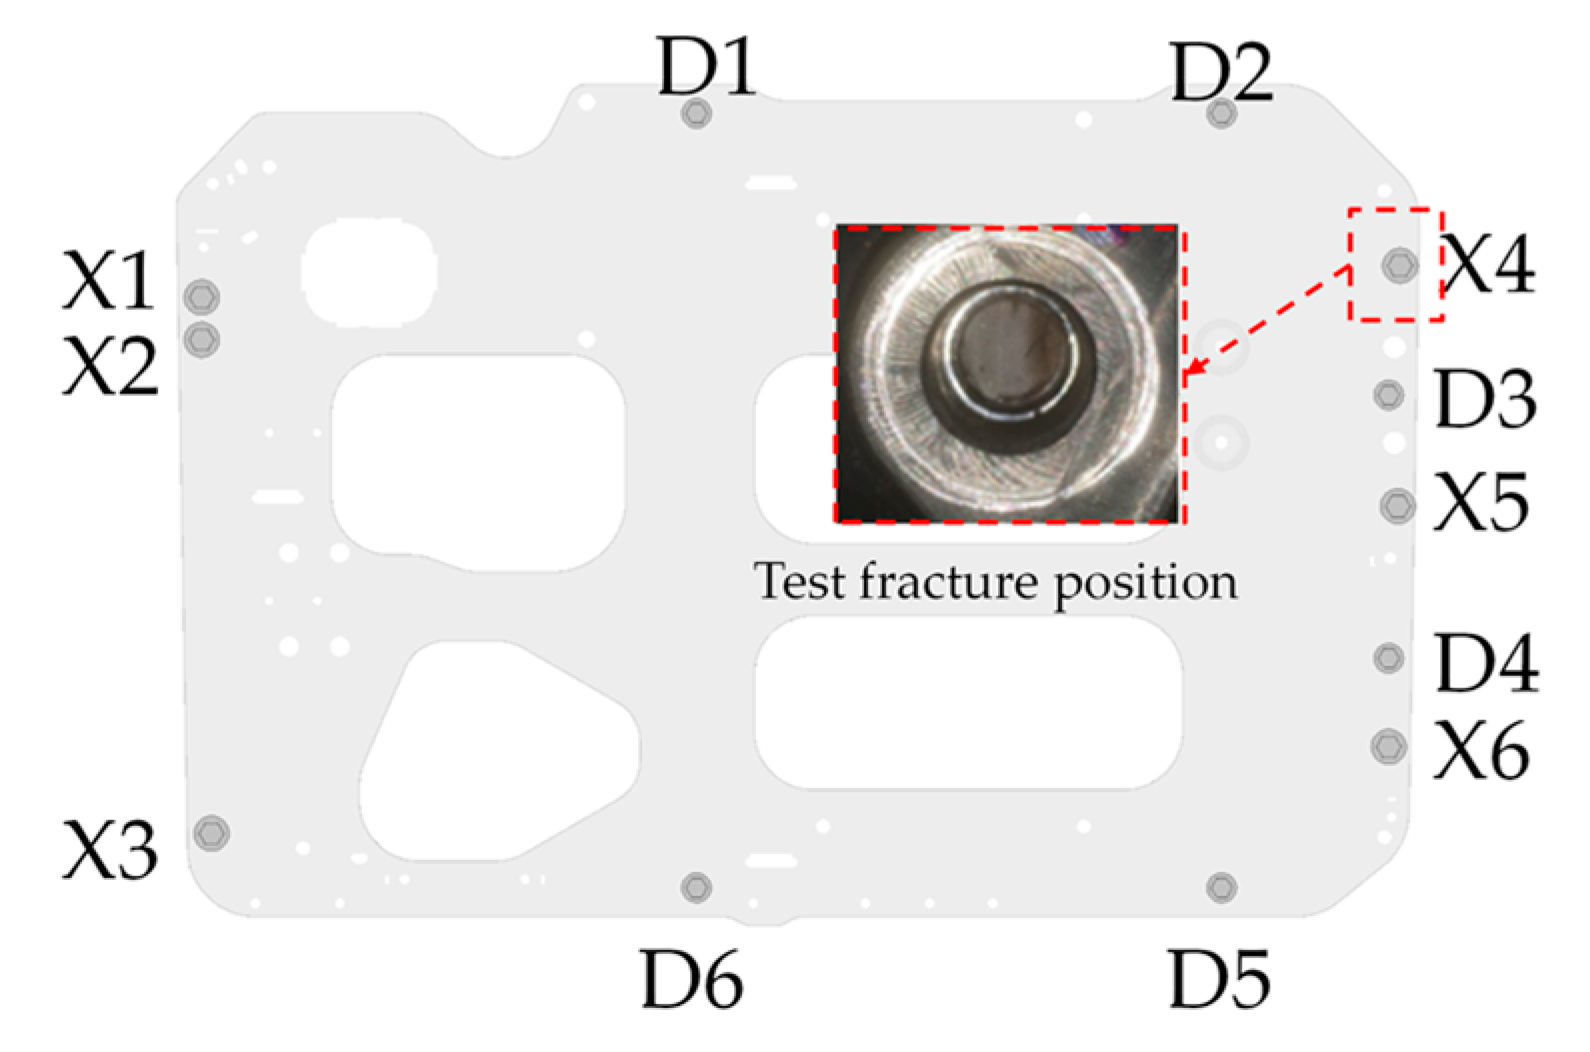
The battery stack assembly and suspension bracket are bolted to the fixed plate assembly, where the bolts experience significant concentrated stress. To assess the fatigue performance of these bolts, detailed modeling is required. The suspension bracket is attached using M12 bolts (X1 to X6), while the battery stack assembly is connected with M10 bolts (D1 to D6), as illustrated in Figure 9. The bolts are meshed with hexahedral elements of 2 mm grid size, and chamfer features are retained.
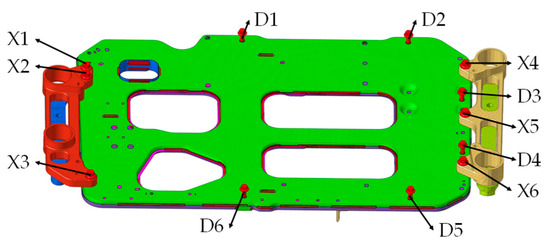
Figure 9.
Bolt location and model.
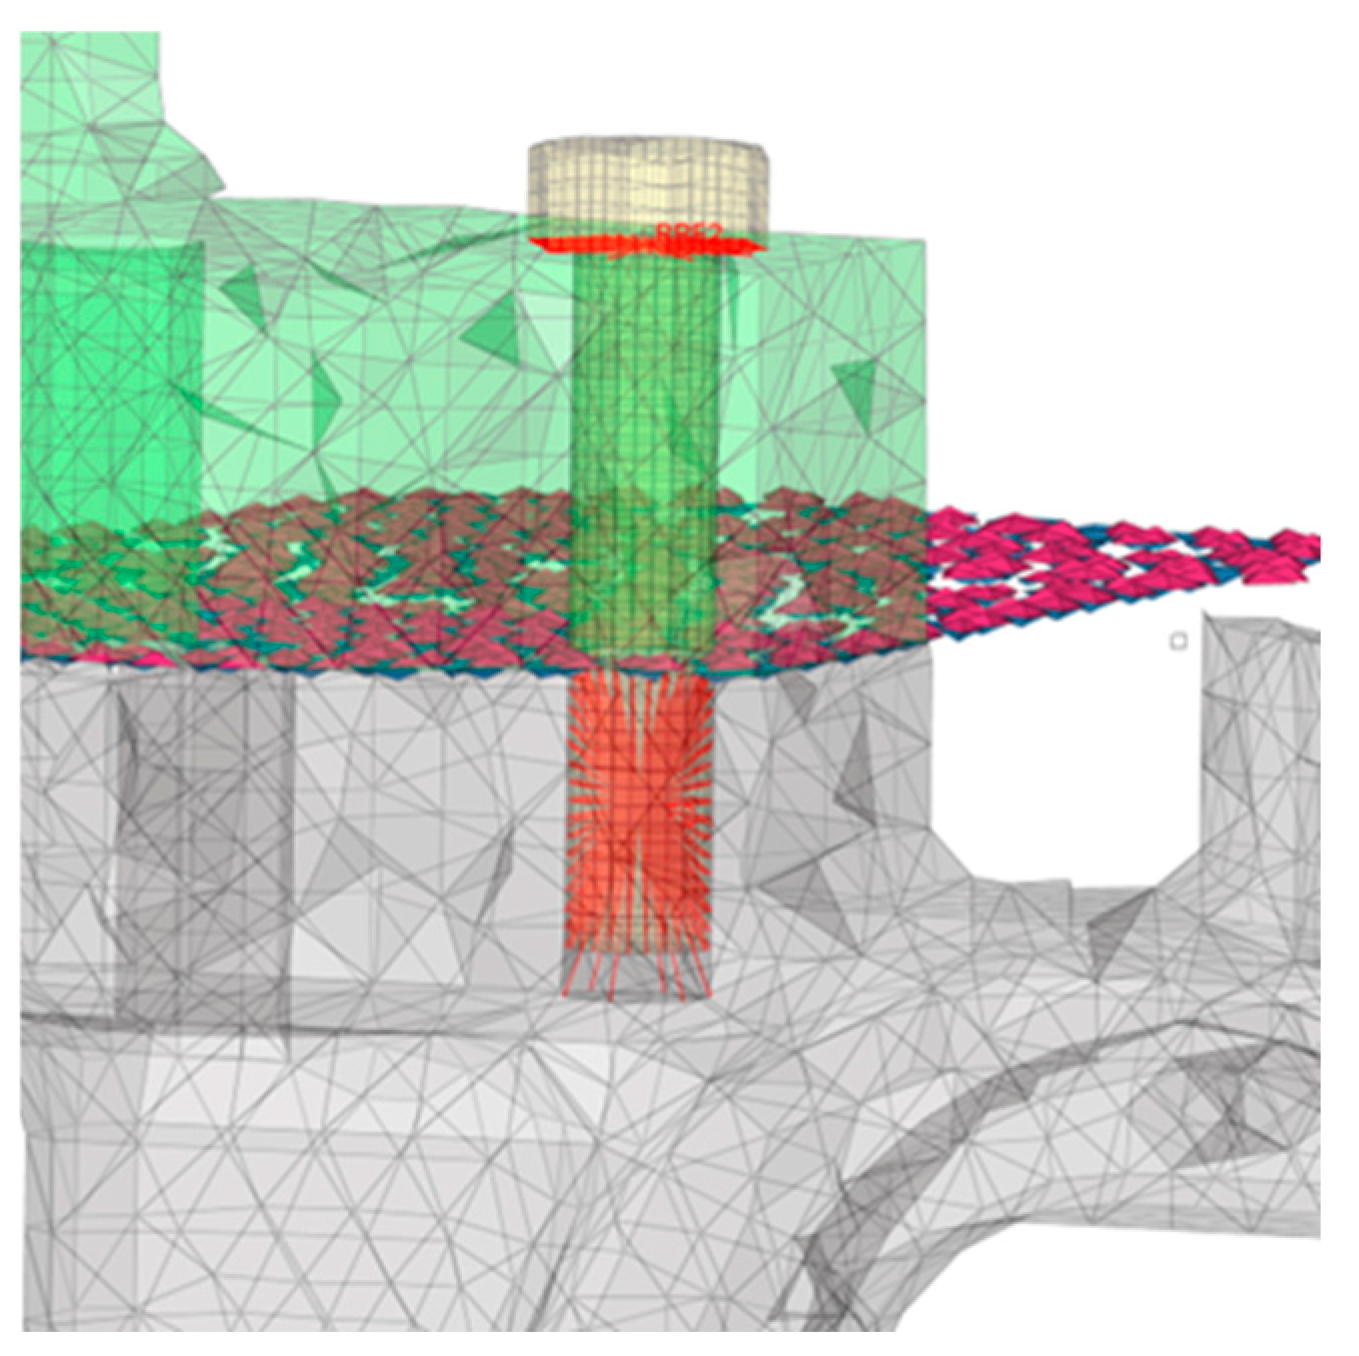
Given the high-stress concentration at the bolted connections, which are prone to random vibration-induced fatigue failure, the bolted connections must be modeled accurately. The structure of the threaded hole is shown in Figure 10, with the threaded pipe connecting the fixed plate components A and C via weld elements.

Figure 10.
Finite element modeling of threaded holes and bolts: (a) Finite element modeling of threaded holes; (b) Bolt connection details.
The stack assembly, suspension bracket, and other components are bolted to the fixed plate assembly. For example, the bolt connection at position D6 is illustrated in Figure 10b. The bolt support surface is connected to the stack housing boss using an RBE2 element, and both the bolt and threaded pipe are modeled with RBE2 elements.
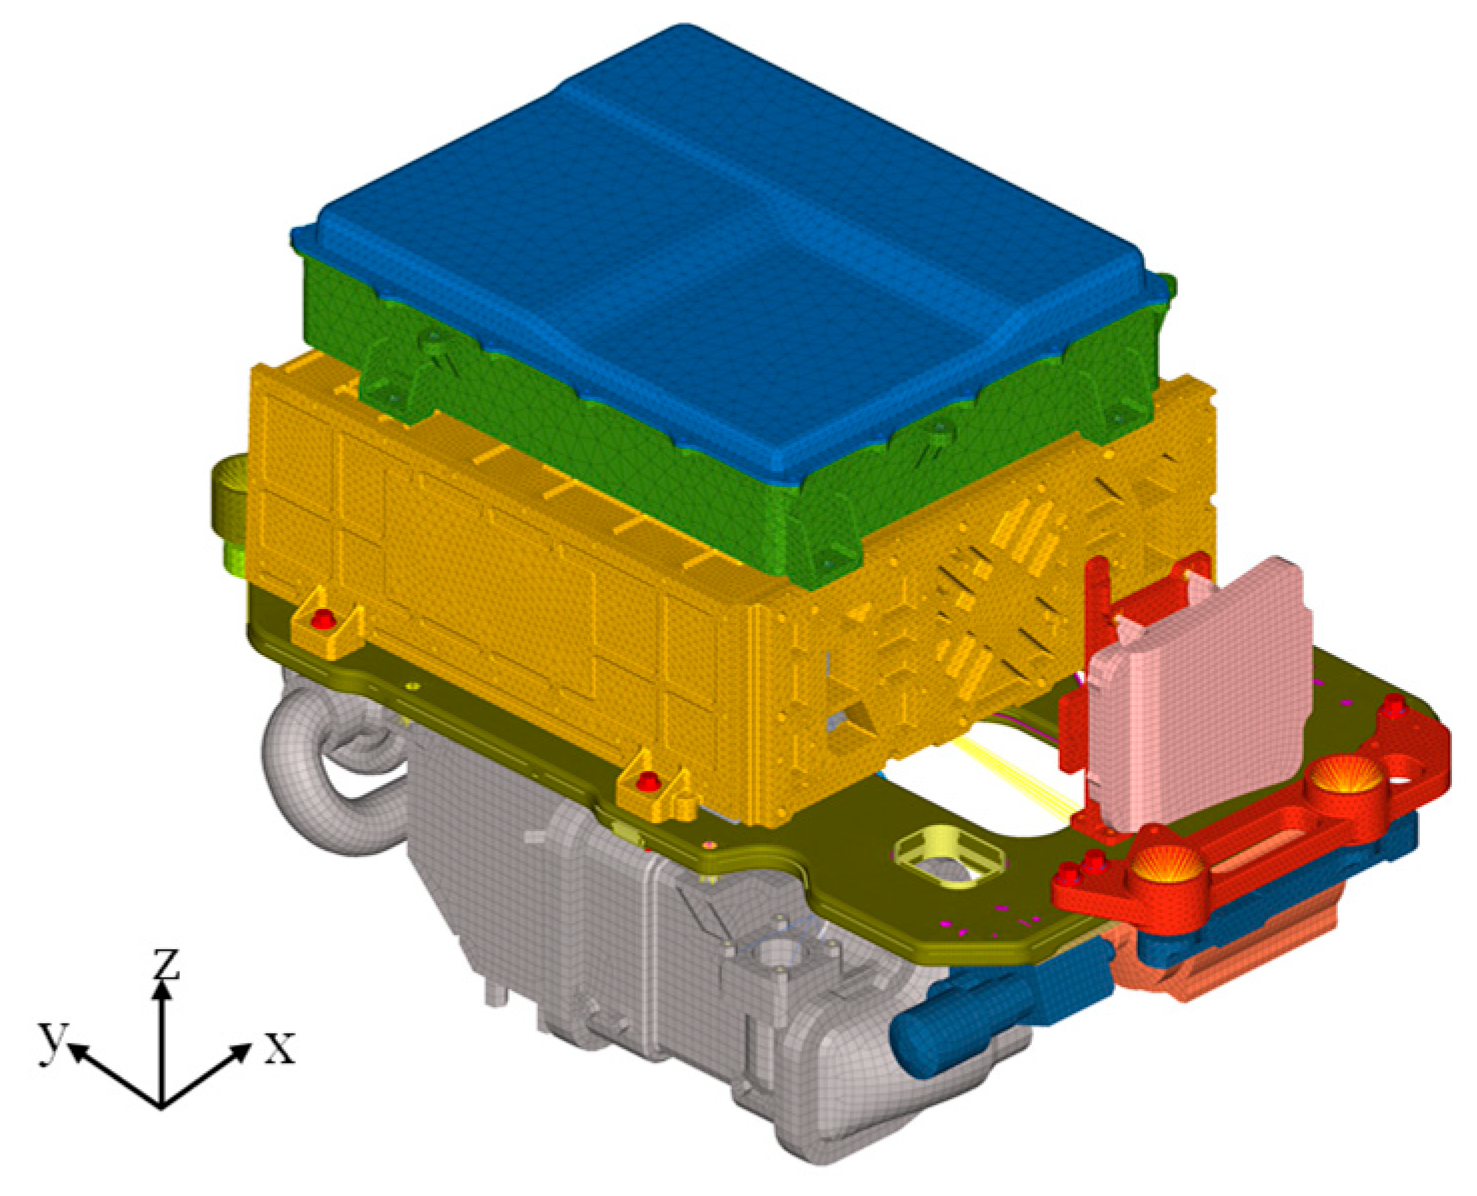
The finite element model of the fuel cell system is constructed as shown in Figure 11. Due to simplifications in geometric features and dimensional deviations, discrepancies exist between the finite element model and the actual structure. To address mass discrepancies, the uniform mass method is employed, using COM2 elements placed at the center of mass of rigid bodies to correct the mass deviation. The final finite element model of the fuel cell system, comprising 582,484 elements, is summarized in Table 5.
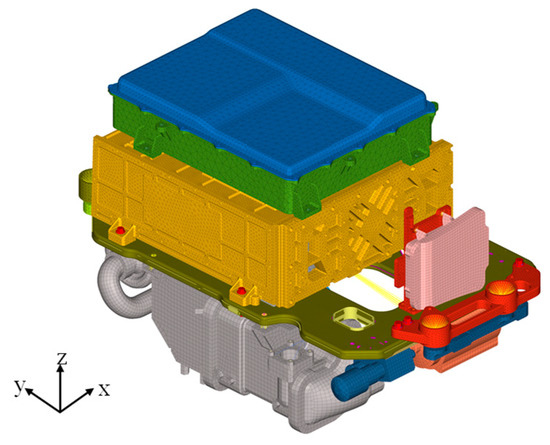
Figure 11.
Fuel cell system finite element model.

Table 5.
Fuel cell system element information summary.
4.2. Establishment of Random Vibration Model
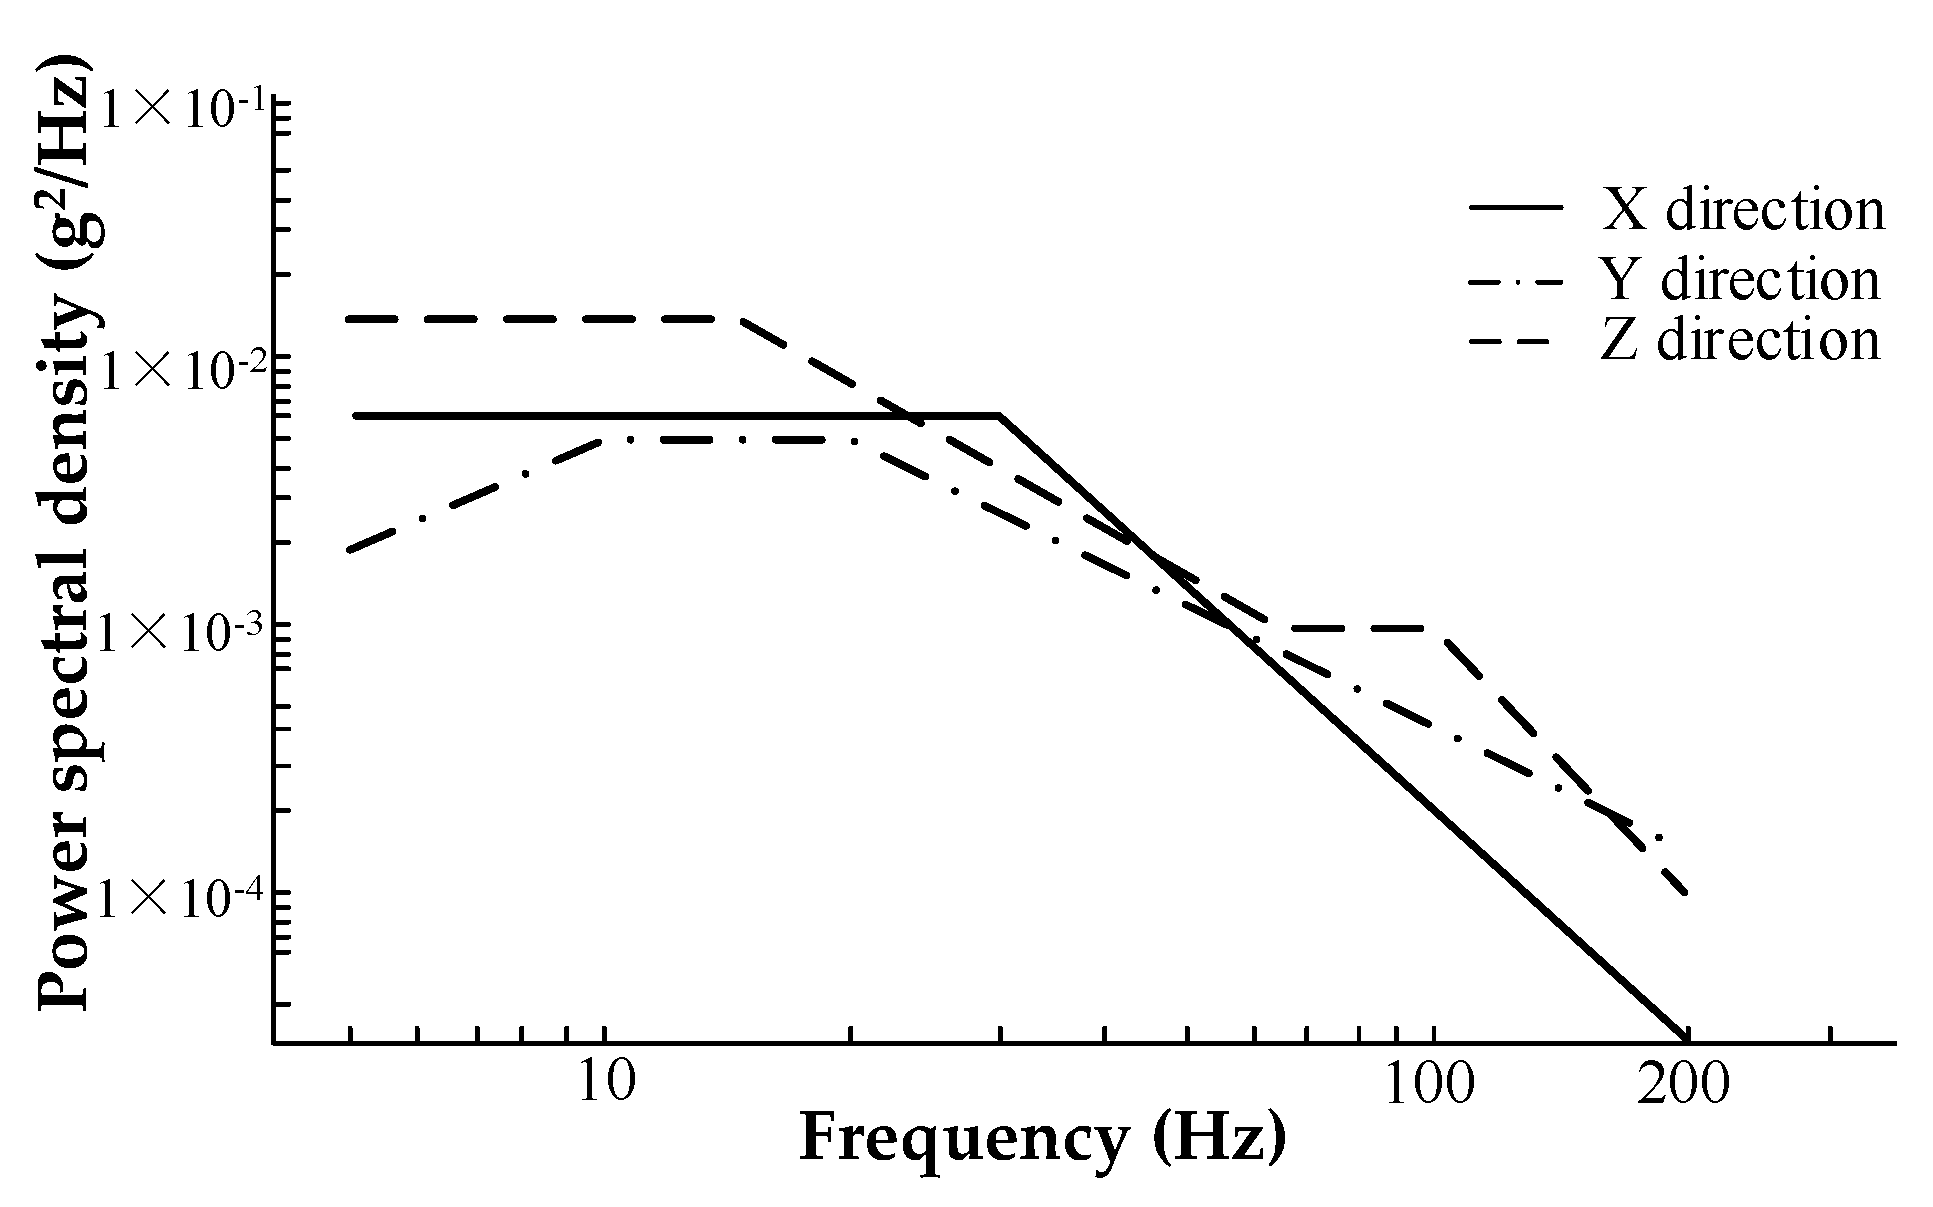
Building on the finite element model from Section 4.1 and using the OptiStruct solver, this section applies the random vibration conditions specified in GB/T 2423.43 [25] (Figure 12) as excitation to conduct frequency-domain random vibration RMS stress and acceleration power spectral density response analyses at the suspension connection of the fuel cell system. The stress distribution across each assembly under these random vibration conditions is evaluated, and the simulation results are compared with experimental data to refine the finite element model parameters.
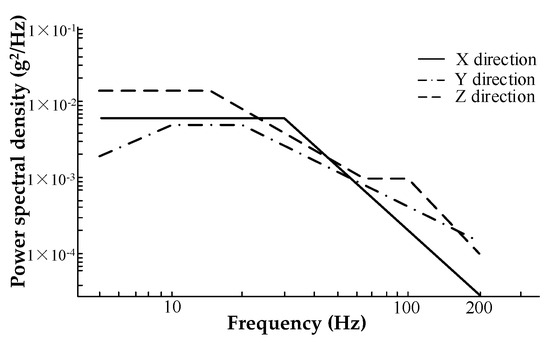
Figure 12.
GB/T 2423.43 vehicle battery pack or system random vibration test curve.
For a linear system, its vibration equation can be expressed as:
where m, c, k are the mass, damping, and stiffness coefficients of the structure, respectively; x(t), , are the displacement, velocity, and acceleration of the structure, respectively; f(t) is the external load of the structure.
By solving the above differential equation, the transfer function D of the structure is obtained as:
where, ω0 is the structural natural frequency; ζ is the structural damping ratio. For the above formula, when taking different values, the structural frequency response function curves under different damping ratios can be obtained.
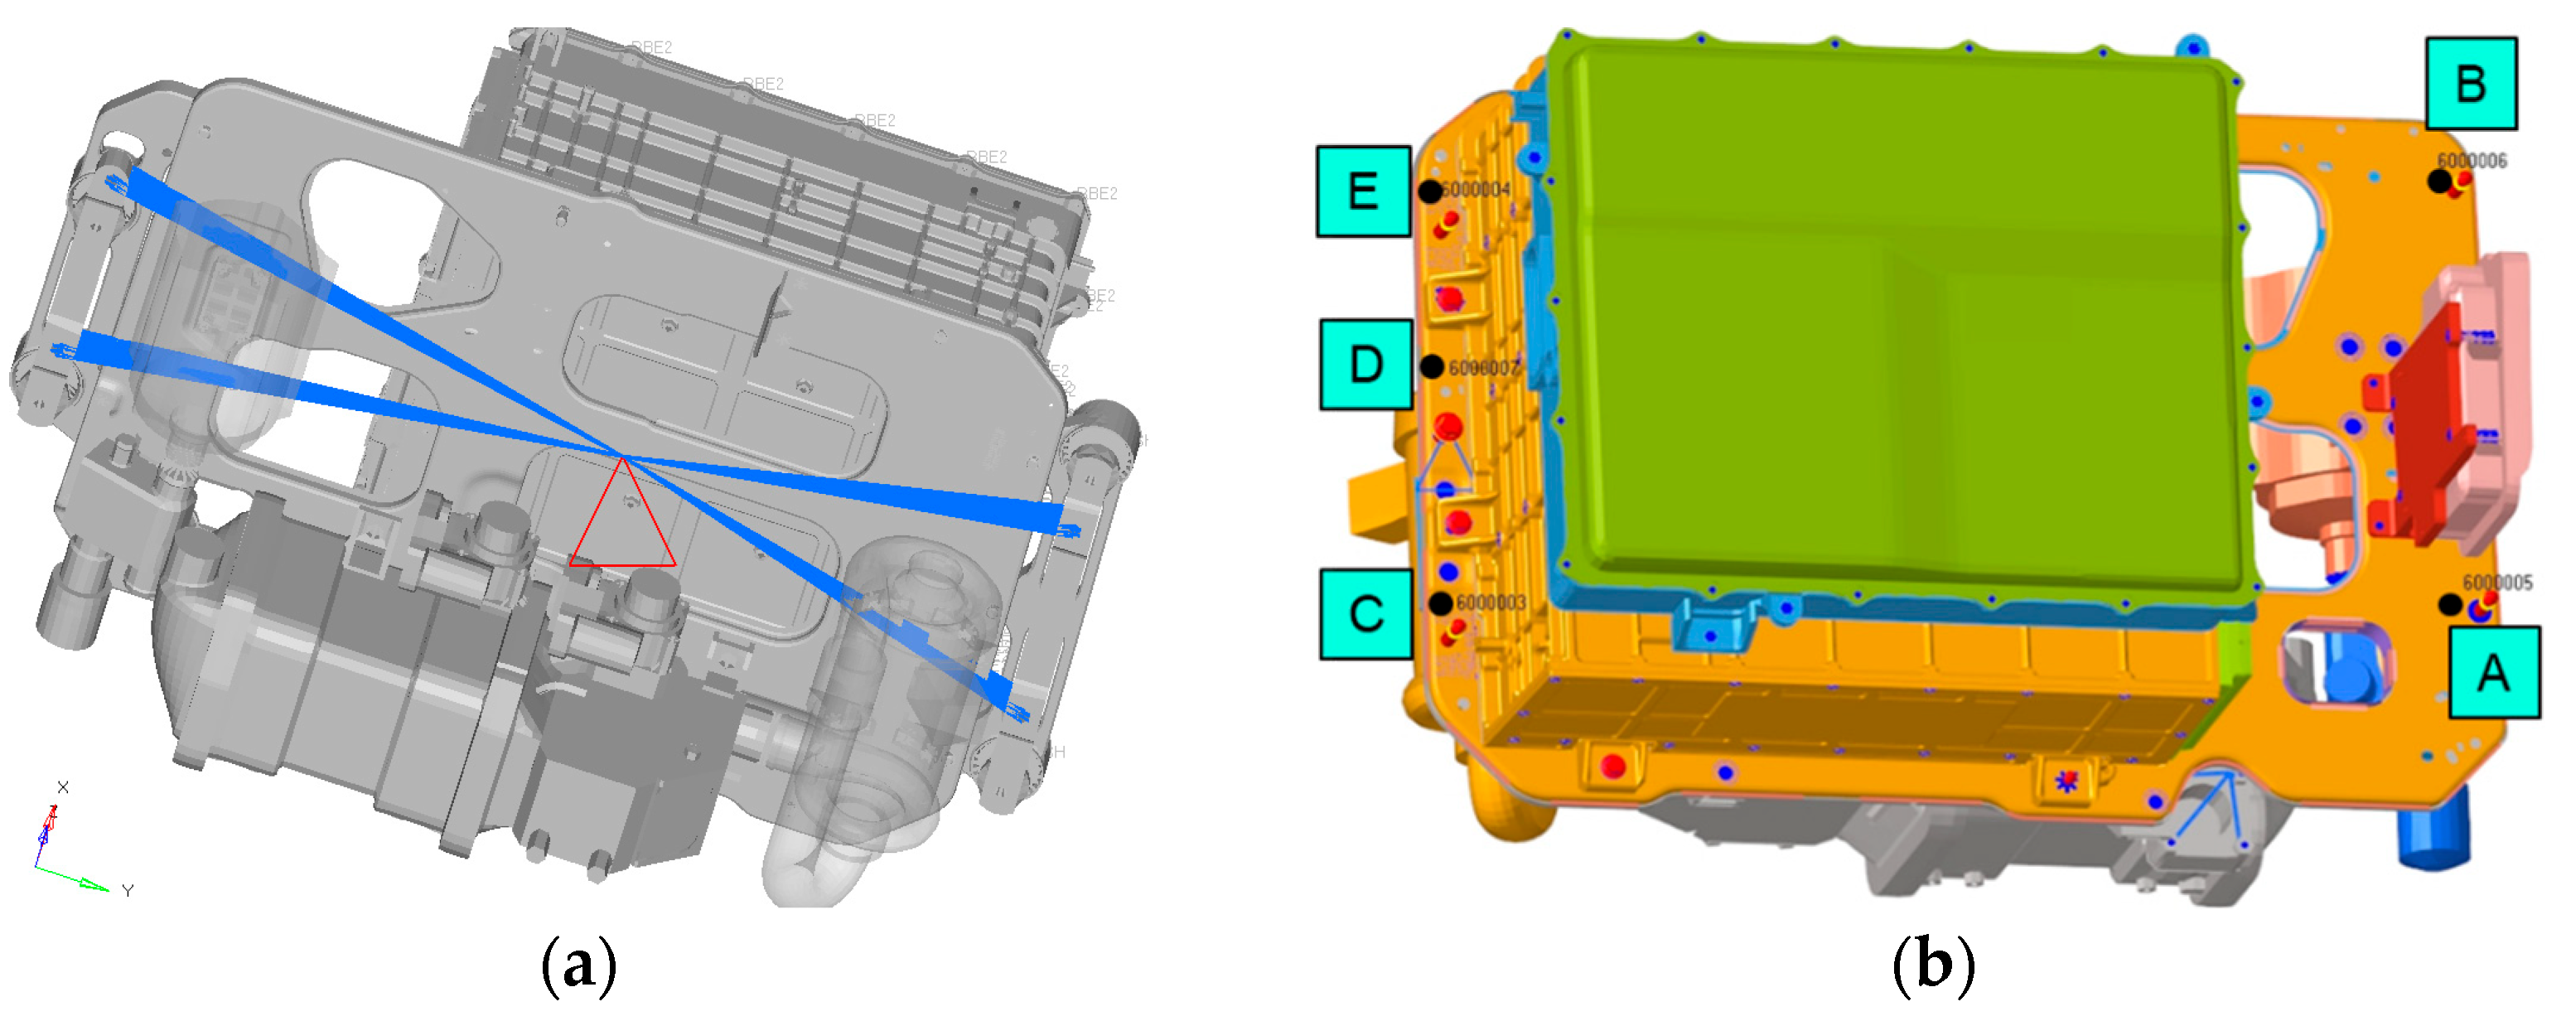
The damping ratio, as indicated by the above formula, is a crucial parameter for both the inherent properties of the structure and vibration fatigue. The damping card TABDMP1 is applied to the fuel cell system and its value is determined to be 0.05 [26]. The RBE2 element is used to connect the suspension bracket’s various attachment points, constraining its six degrees of freedom. Random excitation in the X, Y, and Z directions is applied to the constraint points using the SPCD card in Nastran. The excitation’s power spectrum follows the national standard random vibration excitation PSD curve. The boundary conditions for the random vibration analysis and the locations of the acceleration PSD output points (A–E) are shown in Figure 13. The time step is set to 1 Hz, and the acceleration power spectral density is defined in the output graph.
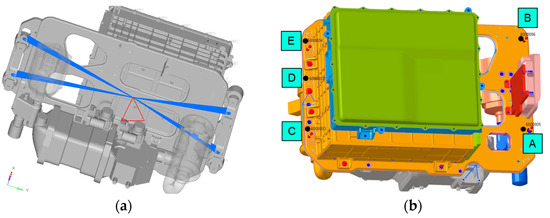
Figure 13.
Random Vibration Analysis Cases: (a) Boundary conditions for random vibration analysis; (b) Acceleration PSD output point location.
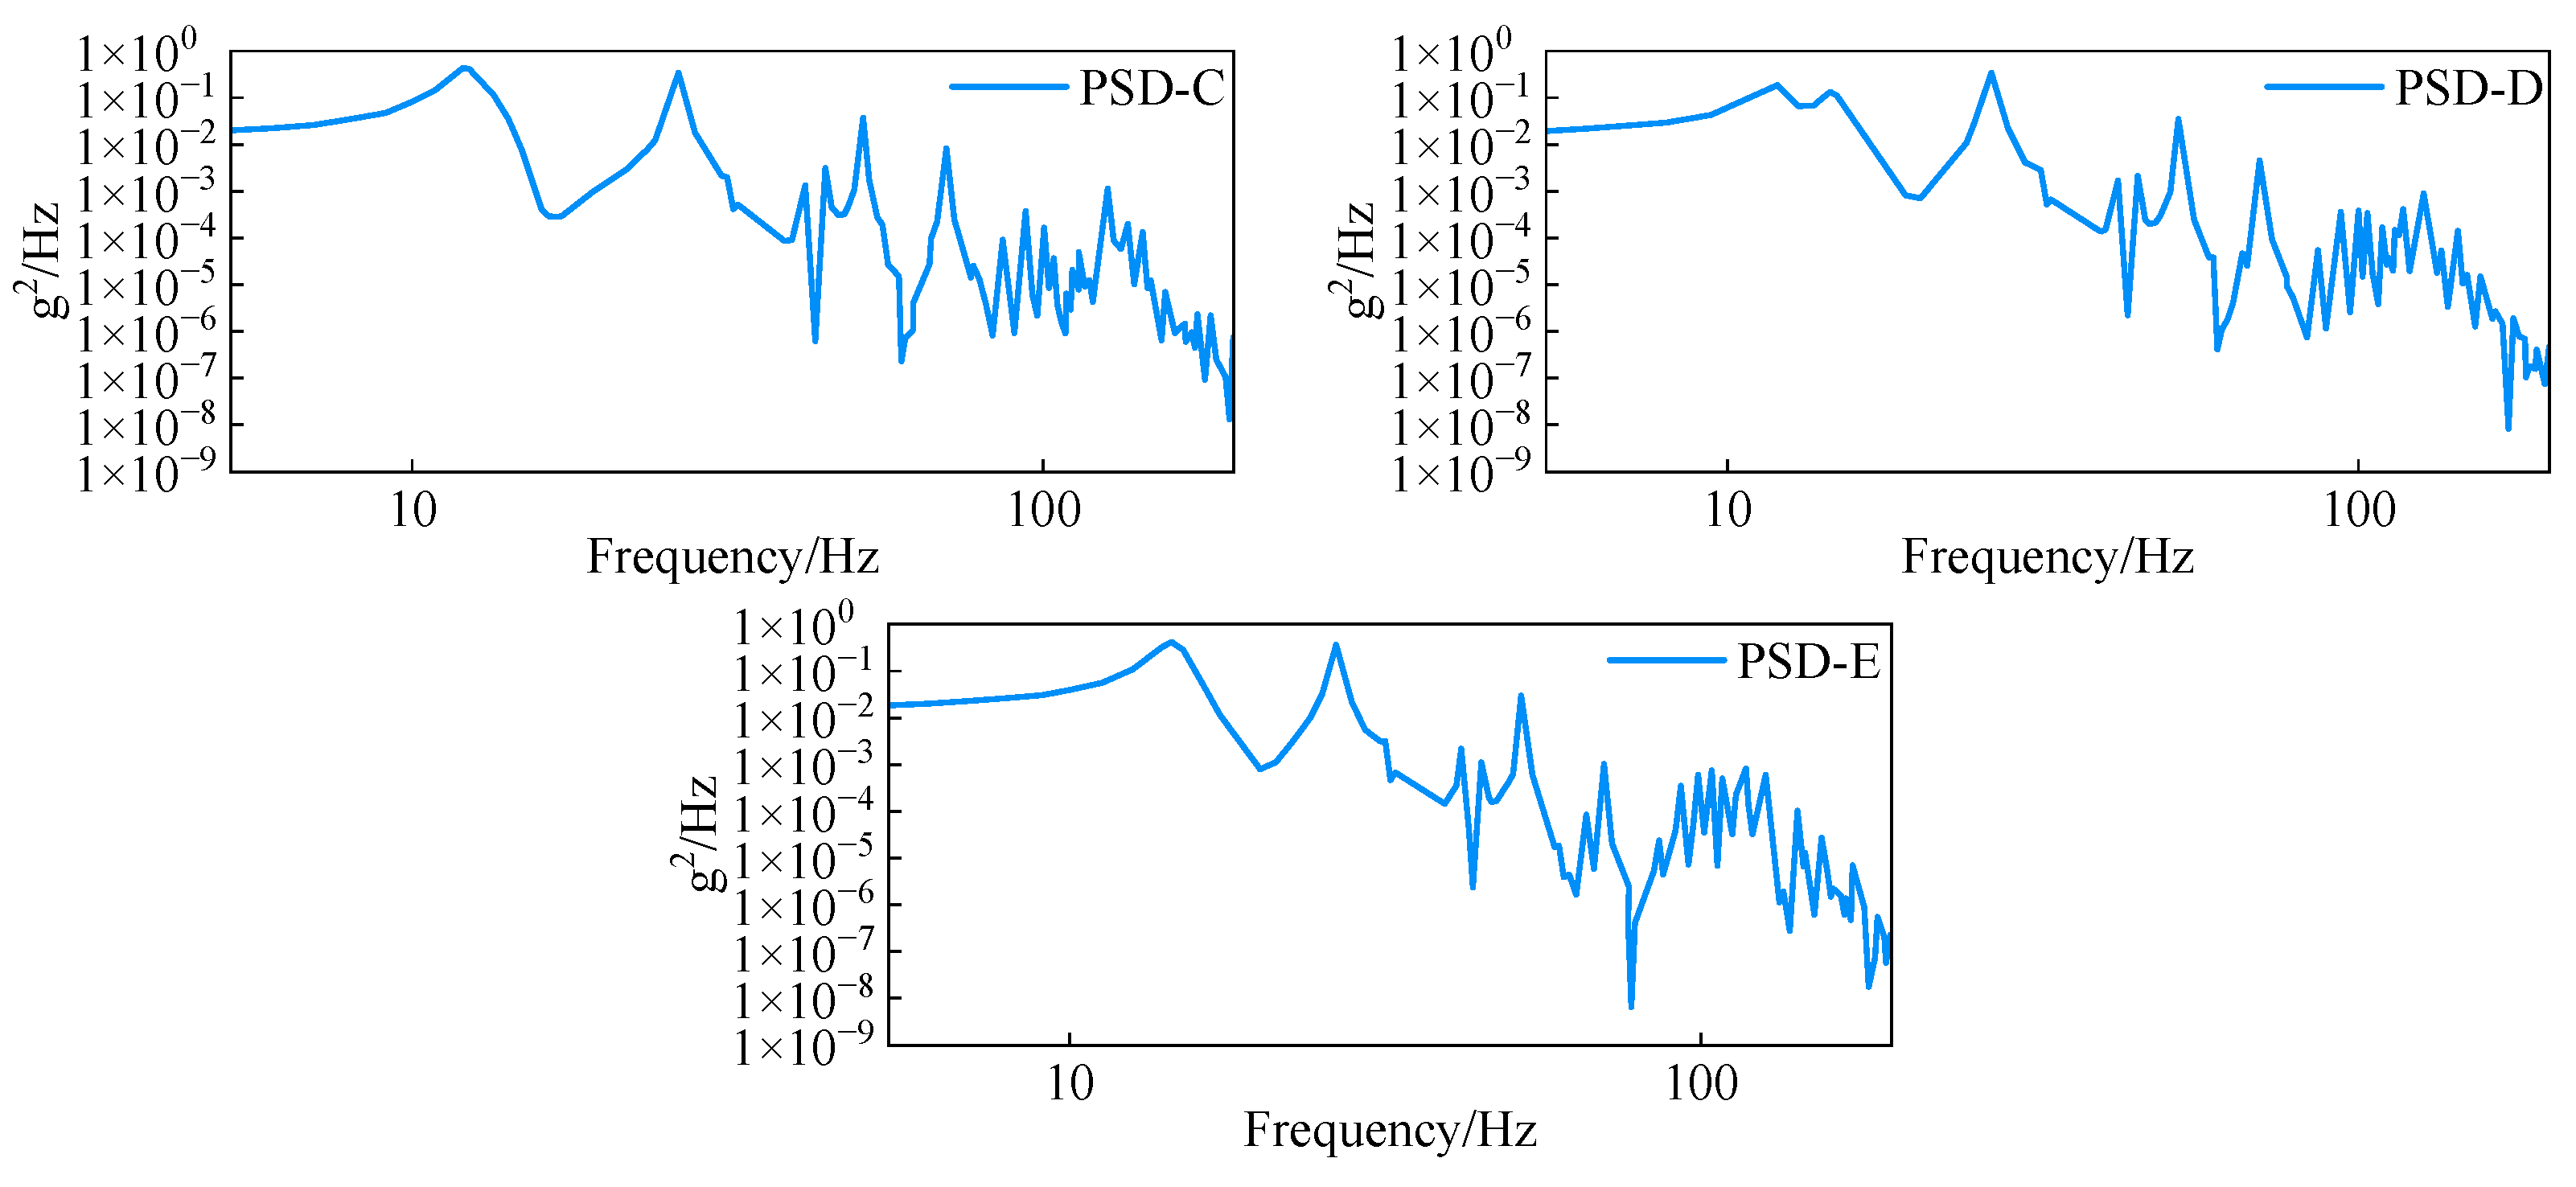
Given that the vehicle is primarily excited in the Z-direction during operation, this study outputs only the Z-direction acceleration response power spectral density, as shown in Figure 14. The simulated acceleration power spectrum reveals that vibration energy is predominantly concentrated in the low-frequency range, with a gradual decay of energy at higher frequencies. This distribution closely matches the excitation PSD curve for the national standard operating conditions.

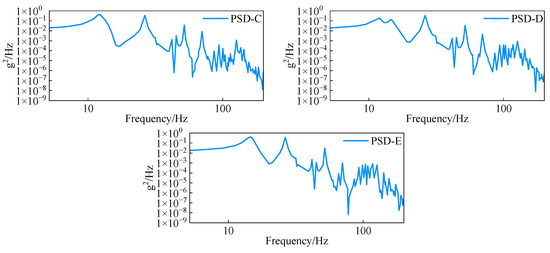
Figure 14.
Acceleration of PSD response at each point.
4.3. Random Vibration Stress Analysis of Fuel Cell System
As a critical load-bearing component of the fuel cell system, the fixed plate assembly experiences complex loading and high stress, necessitating detailed analysis. The RMS stress distributions of the upper and lower plates under random vibration conditions are shown in Figure 15 and Figure 16. Under X-direction random vibration, the RMS stress of the fixed plate assembly is concentrated in three regions: near the D4 and D6 positions where the stack shell and fixed plate A are connected, and around the welds of fixed plate component D. The maximum RMS stress is 60.4 MPa. In the Y-direction, stress concentration occurs around the heater-A plate connection, the D6 position, and the welds of structural component D, with a maximum RMS stress of 46.62 MPa. In the Z-direction, the RMS stress is mainly concentrated in two areas: near the D6 position and around the welds of structural component D with fixed plates A and B. The maximum RMS stress in this direction reaches 222.62 MPa.

Figure 15.
Fixed plate A plate RMS stress: (a) Fixed plate A plate X-axis RMS stress; (b) Fixed plate A plate Y-axis RMS stress; (c) Fixed plate A plate Z-axis RMS stress.

Figure 16.
Fixed plate B plate RMS stress: (a) Fixed plate B plate X-axis RMS stress; (b) Fixed plate B plate Y-axis RMS stress; (c) Fixed plate B plate Z-axis RMS stress.
The RMS stress distribution reveals that the fixed plate assembly, as the primary load-bearing component, experiences high stress under random vibration conditions. Notably, due to the greater excitation energy in the Z-direction under national standard conditions, the RMS stress in this direction is the highest, indicating that the fixed plate is most susceptible to fatigue failure in the Z-direction.
5. Fuel Cell System Random Vibration Test
Vibration testing simulates the structural vibration behavior of a product to assess its vibration resistance under actual operating conditions. It helps identify structural weaknesses by replicating various real-world scenarios. In this study, a random vibration test was performed on the fuel cell system, evaluating the RMS stress of the fixed plate assembly and the system’s acceleration power spectral density under the random vibration conditions specified by the national standard GB/T 2423.43 “Safety Requirements for Power Batteries for Electric Vehicles”. The test results were then compared with the simulation outcomes.
5.1. Test Environment Construction
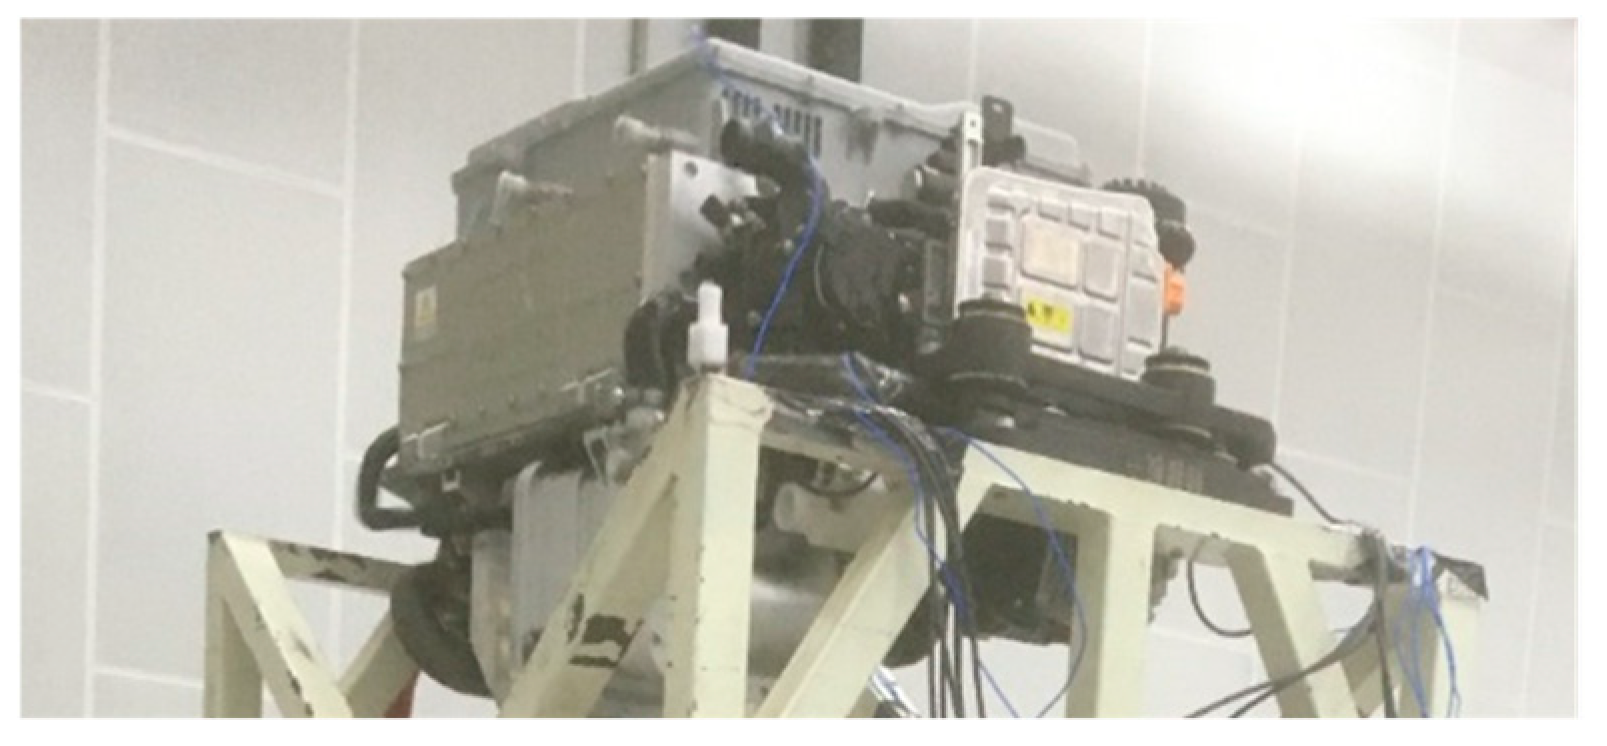
The random vibration test aims to assess the stress at critical points of the fuel cell system, validate the finite element model results, and provide a basis for parameter correction. Due to the large mass and volume of the fuel cell system, a unidirectional excitation platform, as shown in Figure 17, was employed. This platform consists of an expansion platform, a fixed platform, a ground base, and an excitation cylinder. The fuel cell system is bolted to the fixture at the suspension bracket, which is then connected to the vibration platform.
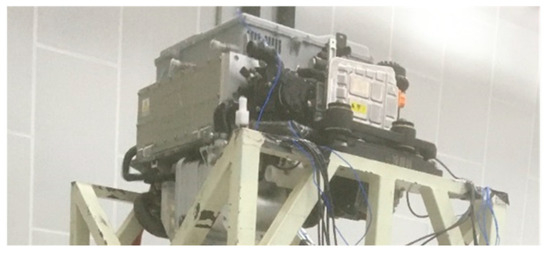
Figure 17.
Vibration test bench.
The test utilizes primarily a three-axis acceleration sensor and a resistance strain gauge. The acceleration sensor model is the PCB J356A45 (Manufacturer: PCB; Country: USA; City: New York), and the strain gauge model is BX120-2AA (Manufacturer: YiYang; Country: China; City: Beijing), as shown in Figure 18a and Figure 18b, respectively.

Figure 18.
Test sensor: (a) Three-axis acceleration sensor; (b) Resistance strain gauge.
Test data are collected by the LMS SCADAS III 316W data acquisition system and transmitted to the computer via a Category VI network cable. Data processing is performed using Simcenter Testlab 18.
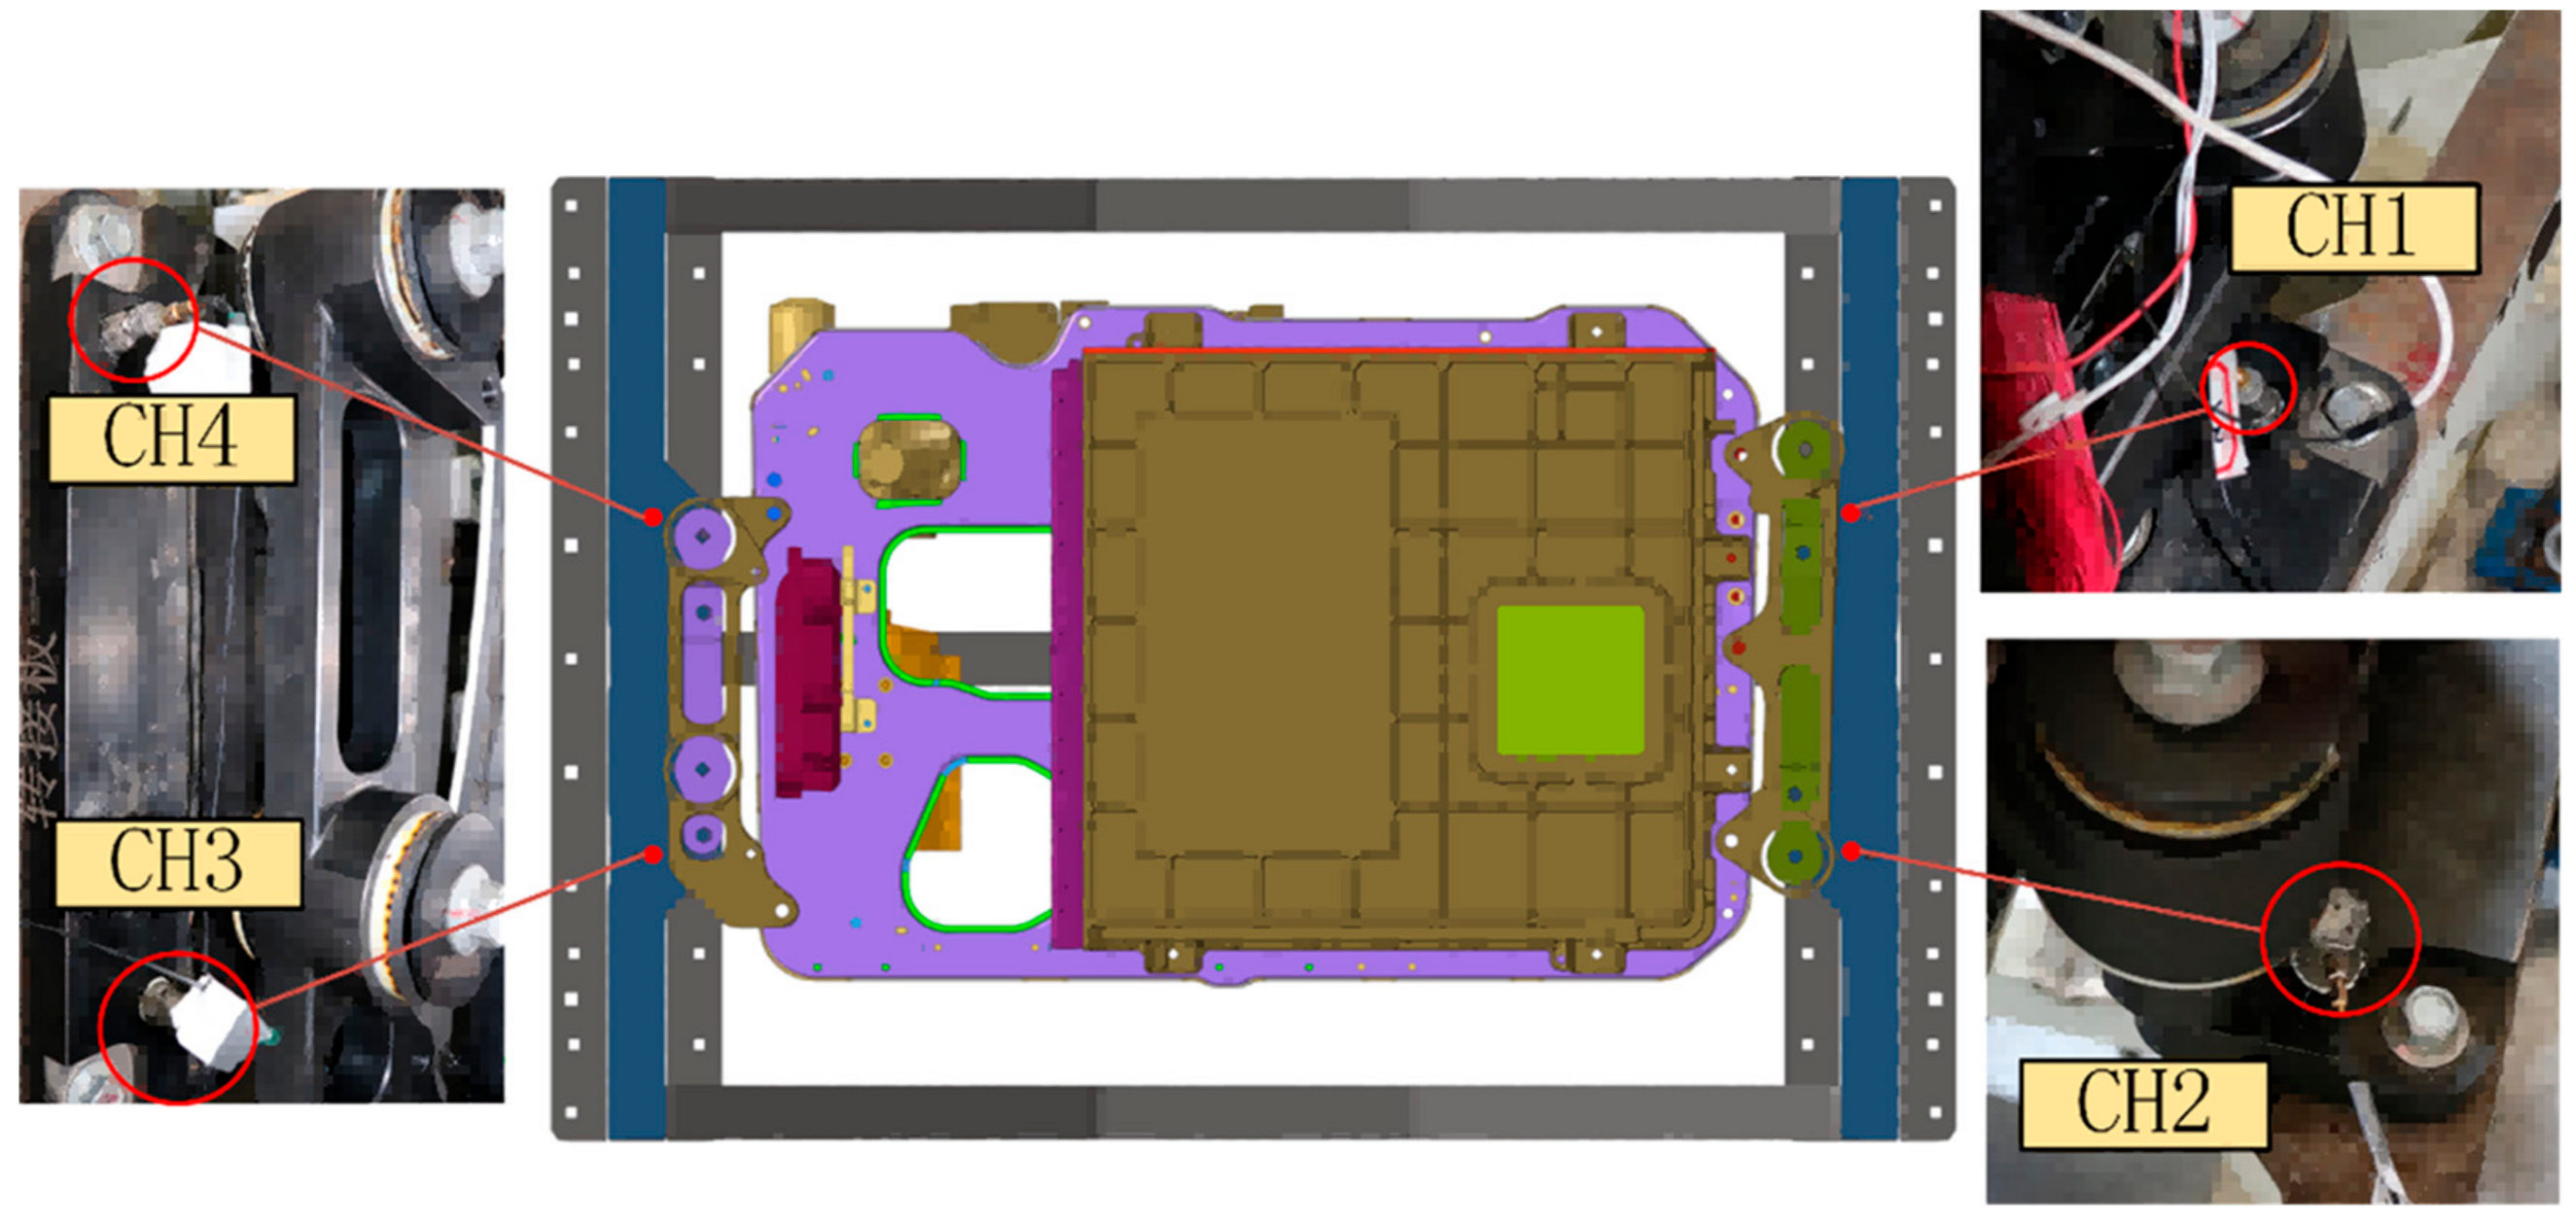
Prior to testing, the sensitivity of the acceleration sensor and strain gauge must be calibrated, followed by system debugging. To ensure a secure connection between the fixture and the expansion table, an acceleration sensor is installed at the junction of the fixture’s suspension bracket and the fuel cell system, as shown in Figure 19. Z-direction acceleration sweep excitation is applied via the excitation table, and the acceleration responses at four fixture locations are recorded.
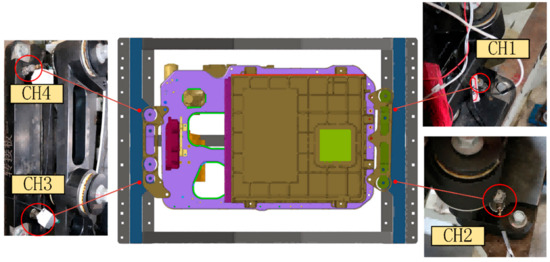
Figure 19.
Equipment debugging sensor installation location.
5.2. Random Vibration Stress Benchmark Test
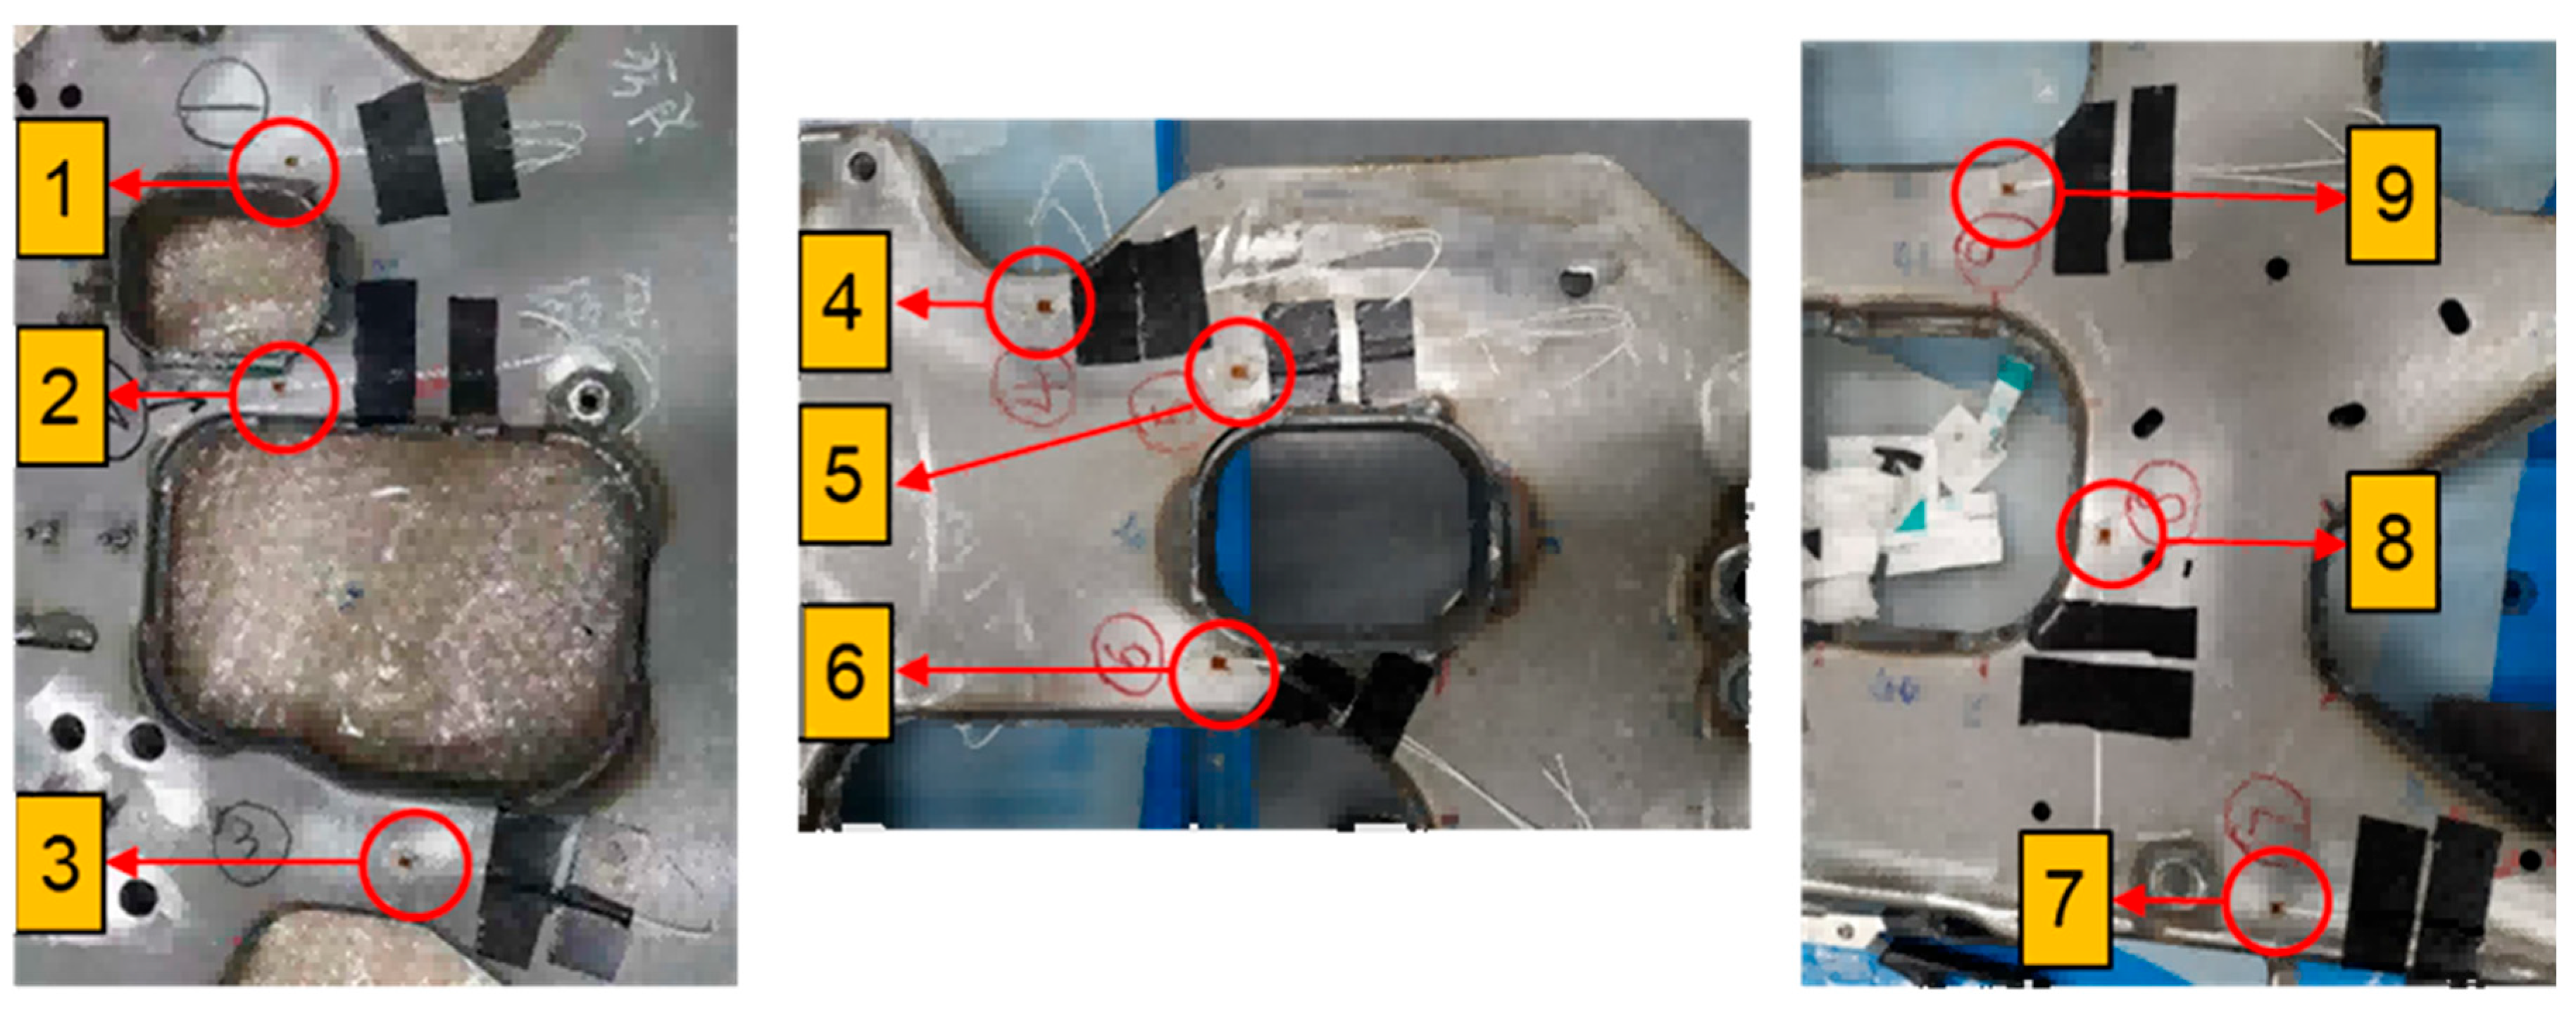
To assess the stress levels at critical points of the fuel cell system during random vibration and to validate the finite element model results, a random vibration stress benchmark test was conducted. The simulation analysis revealed that the fixed plate assembly experiences significantly higher stress than other assemblies, so the test primarily focused on this component. In practice, direct measurement of stress is challenging; structural stress is typically inferred from strain measurements. Points 1–9 in fixed plates A and B in Figure 20 have been identified as potential fatigue damage points, therefore strain gauges are attached at these locations.
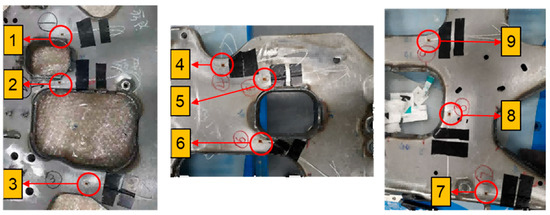
Figure 20.
Strain gauge pasting actual picture.
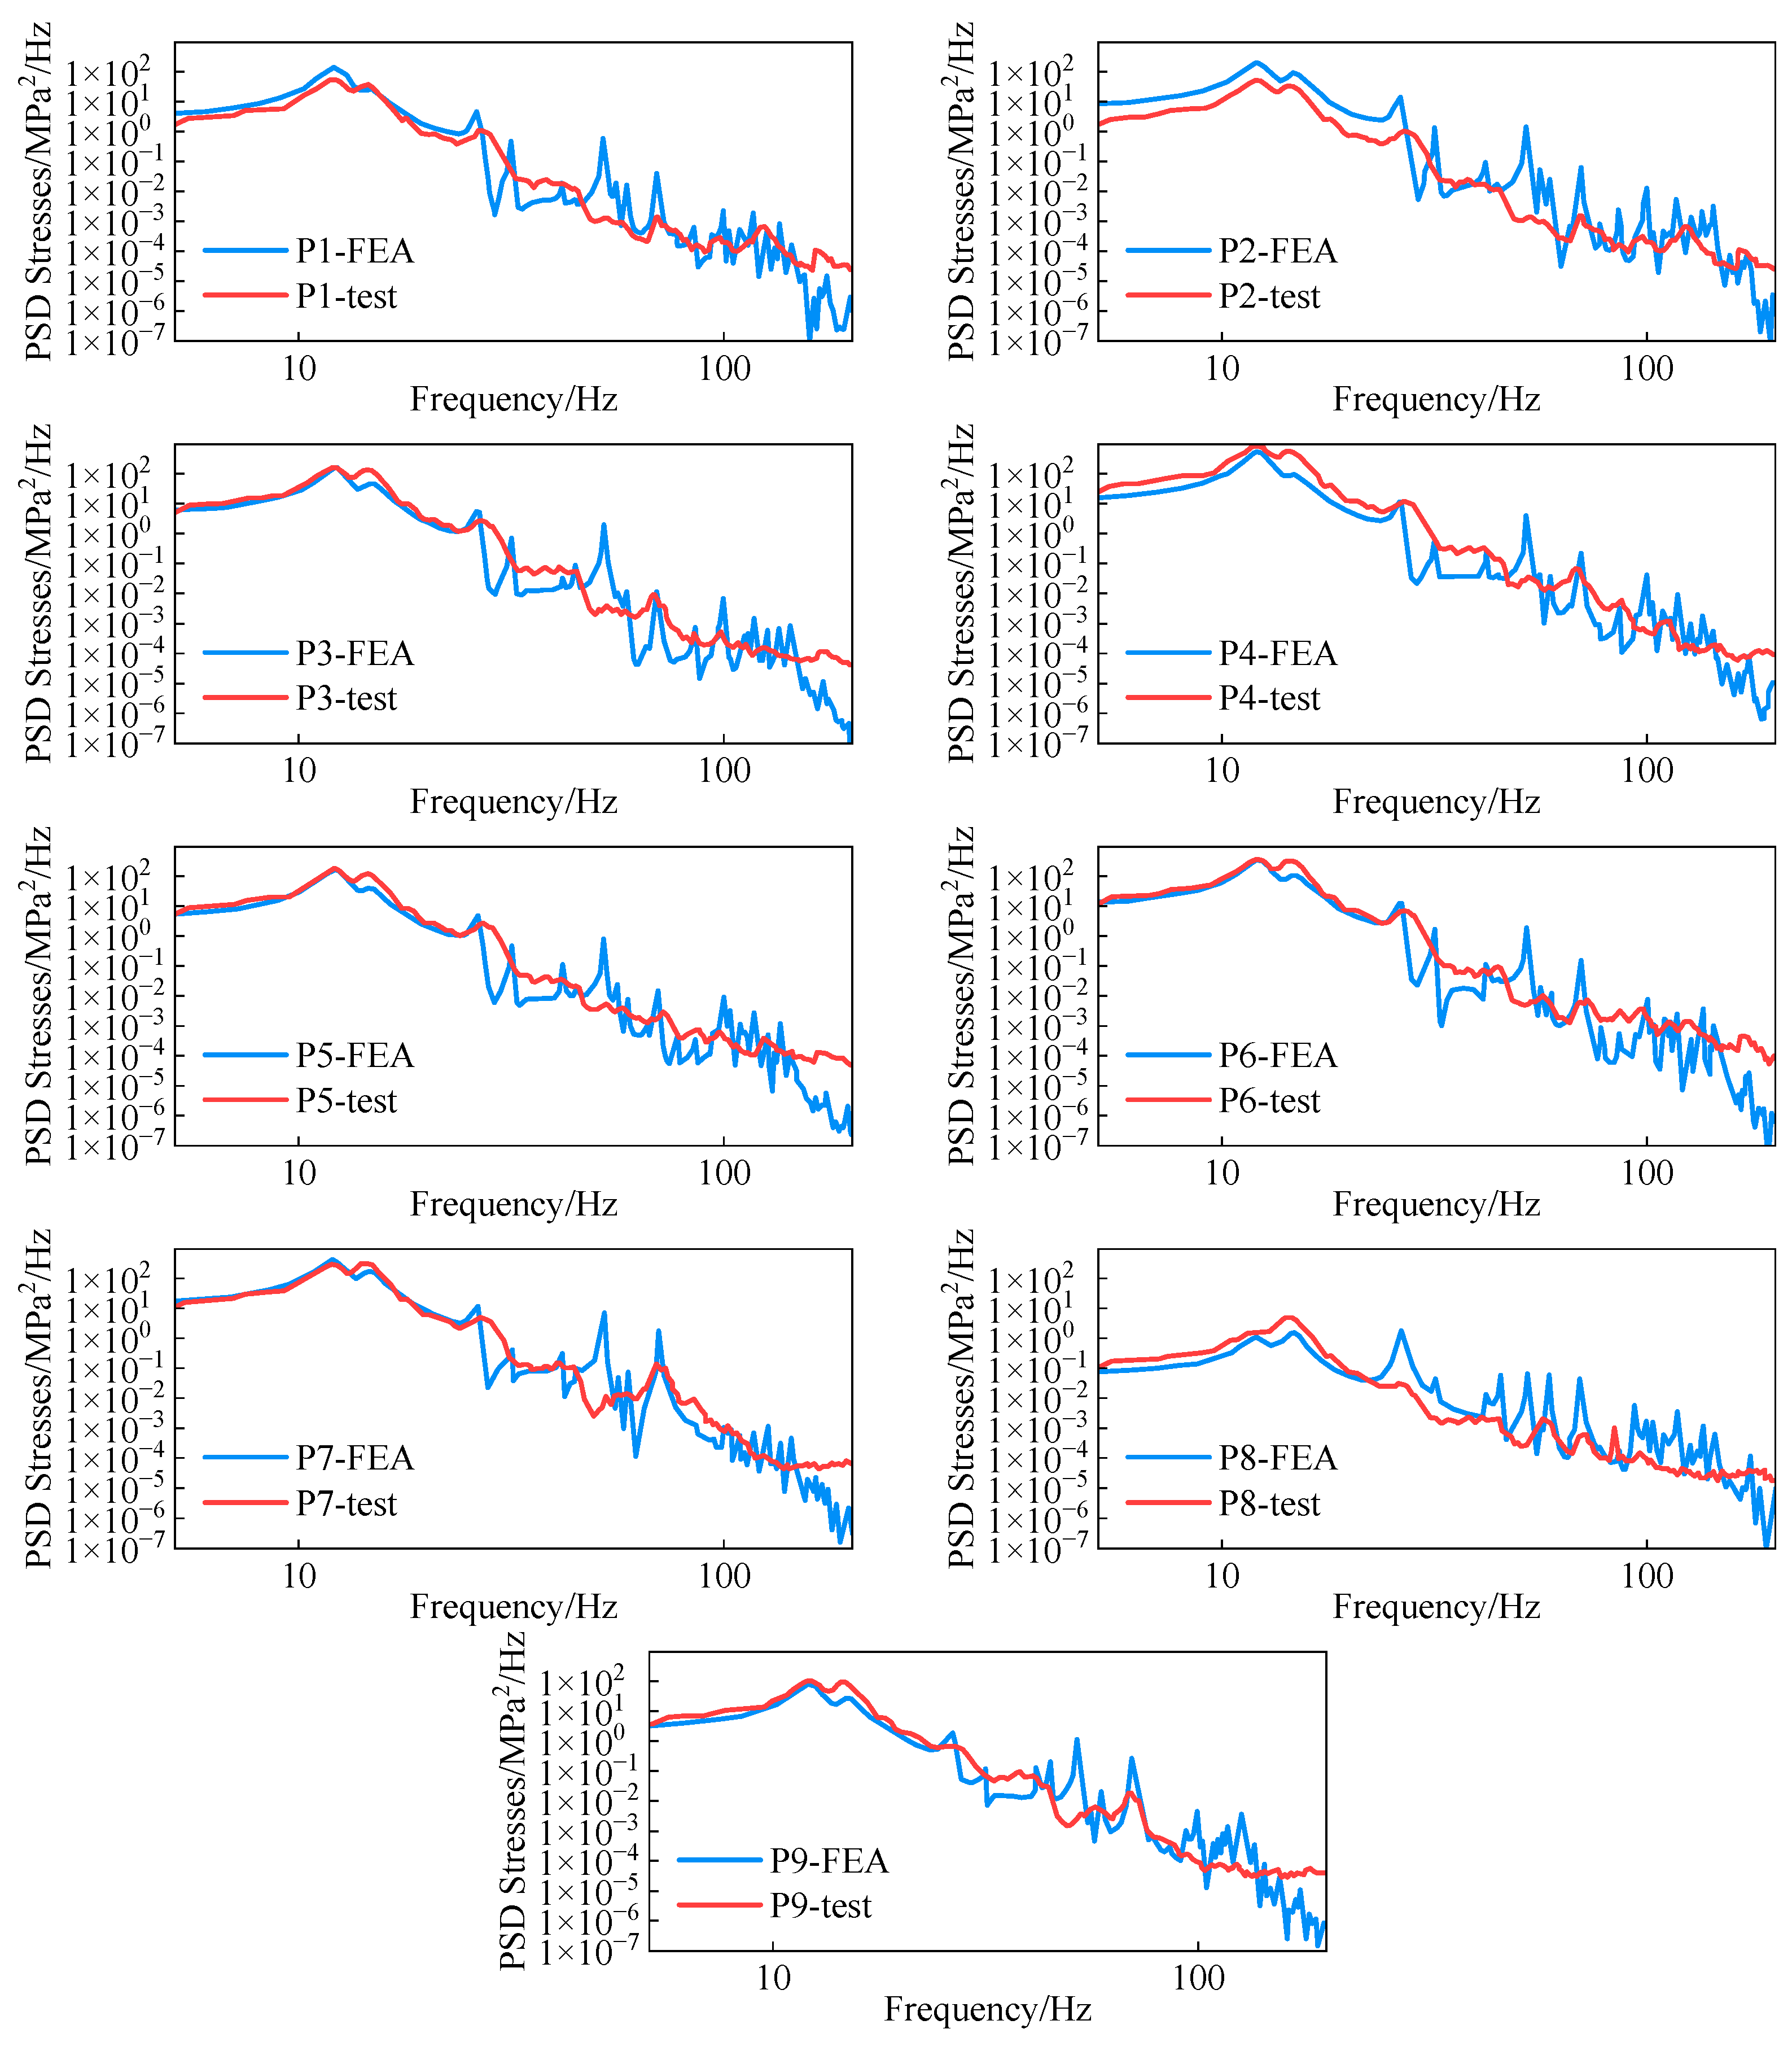
The time-domain strain data are converted to stress time-domain data, followed by autocorrelation processing. Fourier transformation is then applied to obtain the stress response PSD curve for each measurement point. The experimental and simulated PSD curves are compared, as shown in Figure 21.
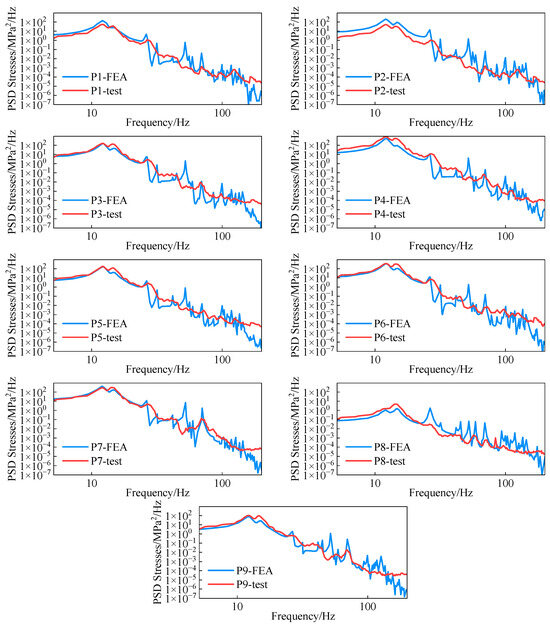
Figure 21.
Comparison between simulation and test of stress response power spectrum density curve at each measuring point.
As shown in the figure, stress is higher at low frequencies and lower at high frequencies, consistent with the energy distribution of the national standard random vibration excitation PSD, which is predominantly at low frequencies. The simulation results for each measuring point align closely with the experimental data, as presented in Table 6. The error between the experimental and simulated RMS values is less than 10%, confirming the accuracy of the simulation.

Table 6.
Comparison of RMS stress at each measuring point.
6. Fatigue Life Analysis of the Fixed Plate Assembly of a Fuel Cell System
6.1. Frequency Domain Fatigue Analysis
Each component of the fuel cell system is connected to the fixed plate assembly by bolts or other methods. As indicated by the random vibration stress analysis, the fixed plate assembly, being the primary load-bearing component, experiences significantly higher stress levels than other assemblies, making it susceptible to fatigue failure. Therefore, this study conducts a fatigue analysis of the fixed plate assembly and its connecting bolts.
The fatigue analysis is performed using the nCode DesignLife module [27], which supports static, transient, and random vibration fatigue analyses. This software uses a process-based block diagram to build the necessary modules, incorporating various probability density function models. Its built-in material library includes S-N curves for standard specimens and multiple mean stress correction methods, facilitating an intuitive fatigue analysis process.
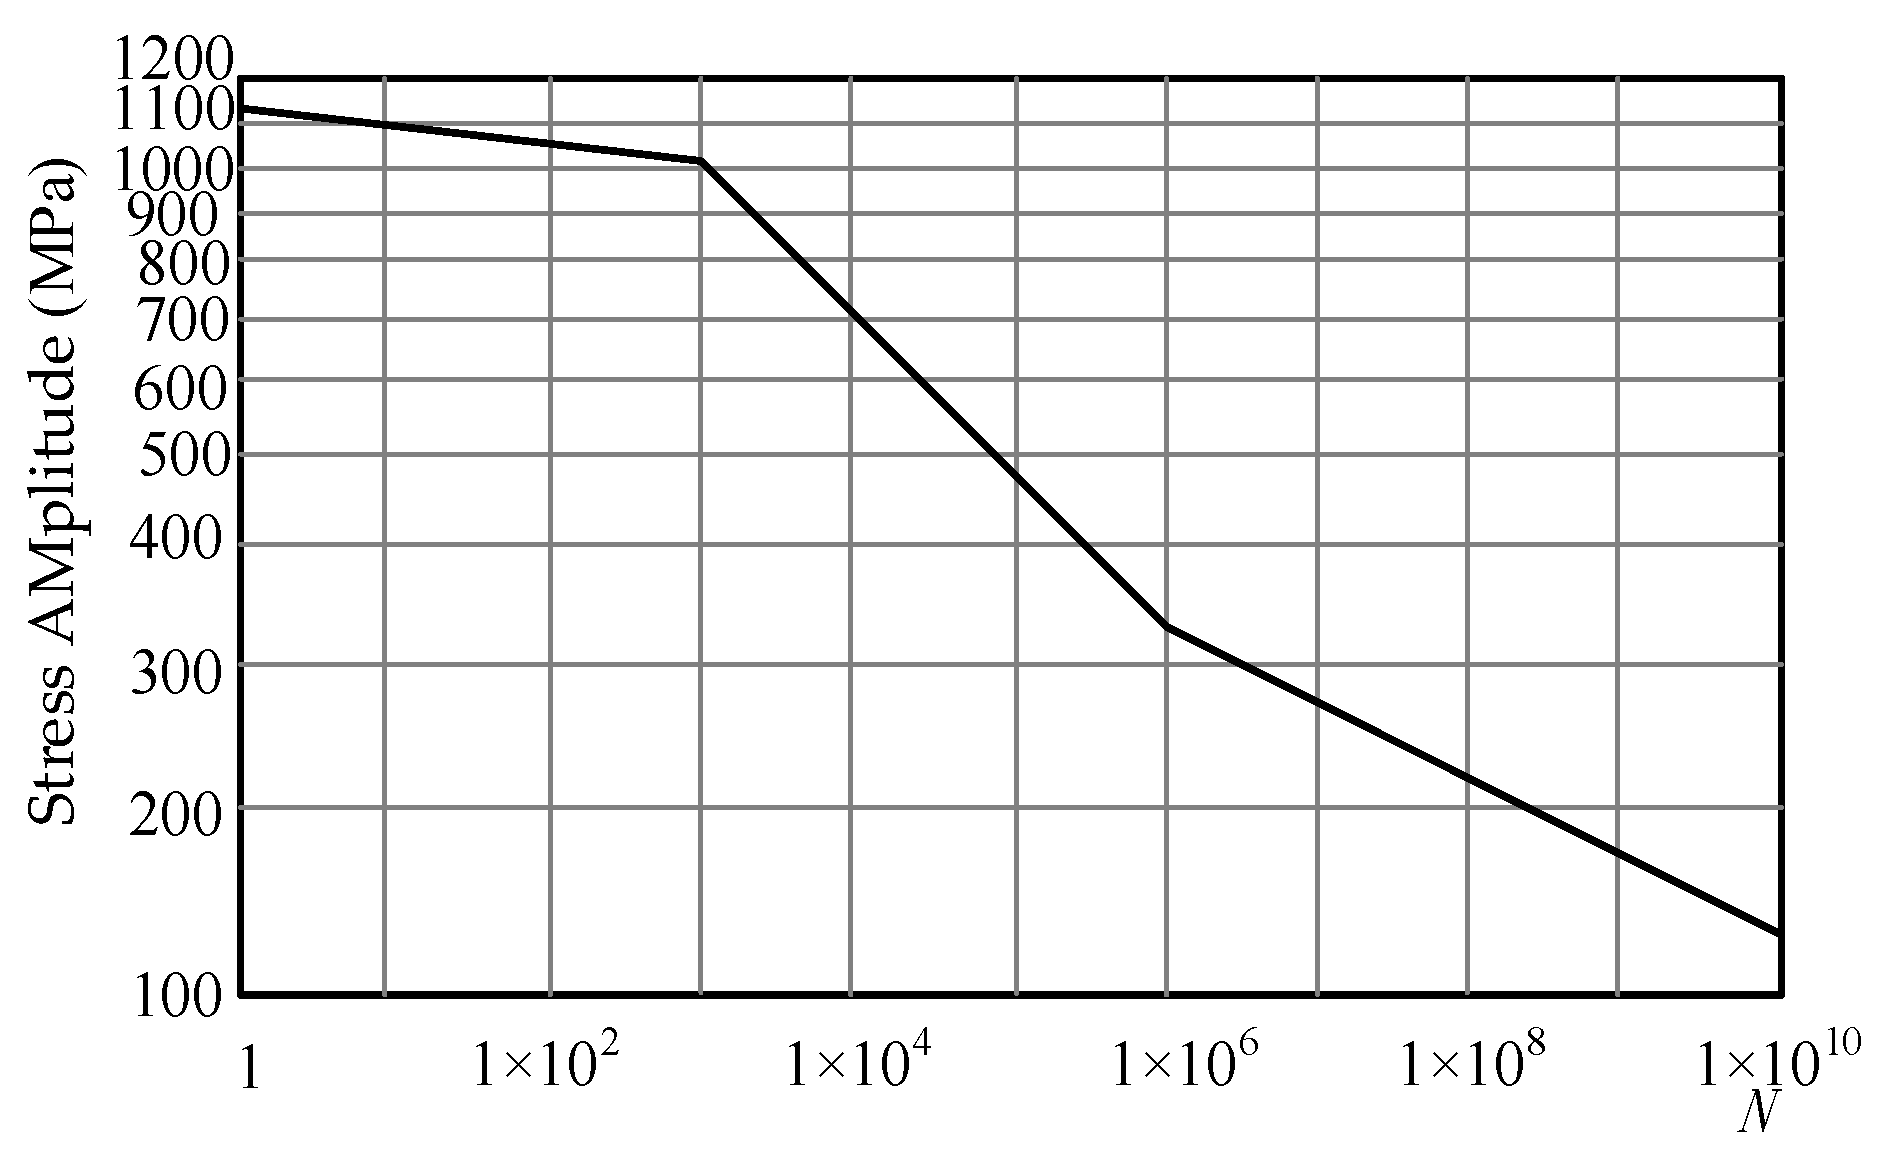
The fixed plate assembly is fabricated from 510 L steel, commonly used in automobile beams. Its chemical composition includes iron, carbon, manganese, and silicon, with low carbon content and higher levels of manganese and silicon, along with trace amounts of alloying elements like chromium, niobium, and vanadium. The material’s internal structure is ferrite-pearlite, and its estimated fatigue limit is 0.38 × Su, with a fatigue life of 106 cycles. Based on the low-cycle fatigue limit (S1000) and high-cycle fatigue limit (Sbe), the S-N curve for 510 L steel is estimated, as shown in Figure 22. The Miner linear damage accumulation rule is applied, with the Goodman mean stress correction used for the fatigue calculation.
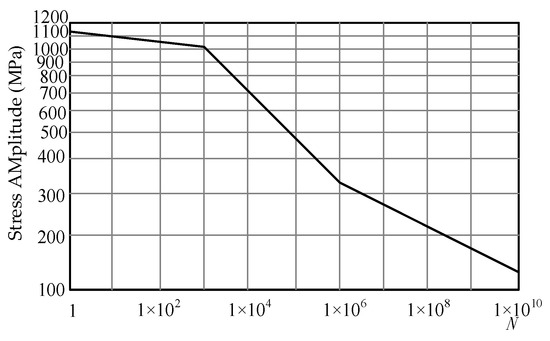
Figure 22.
S-N curve of 510L material.
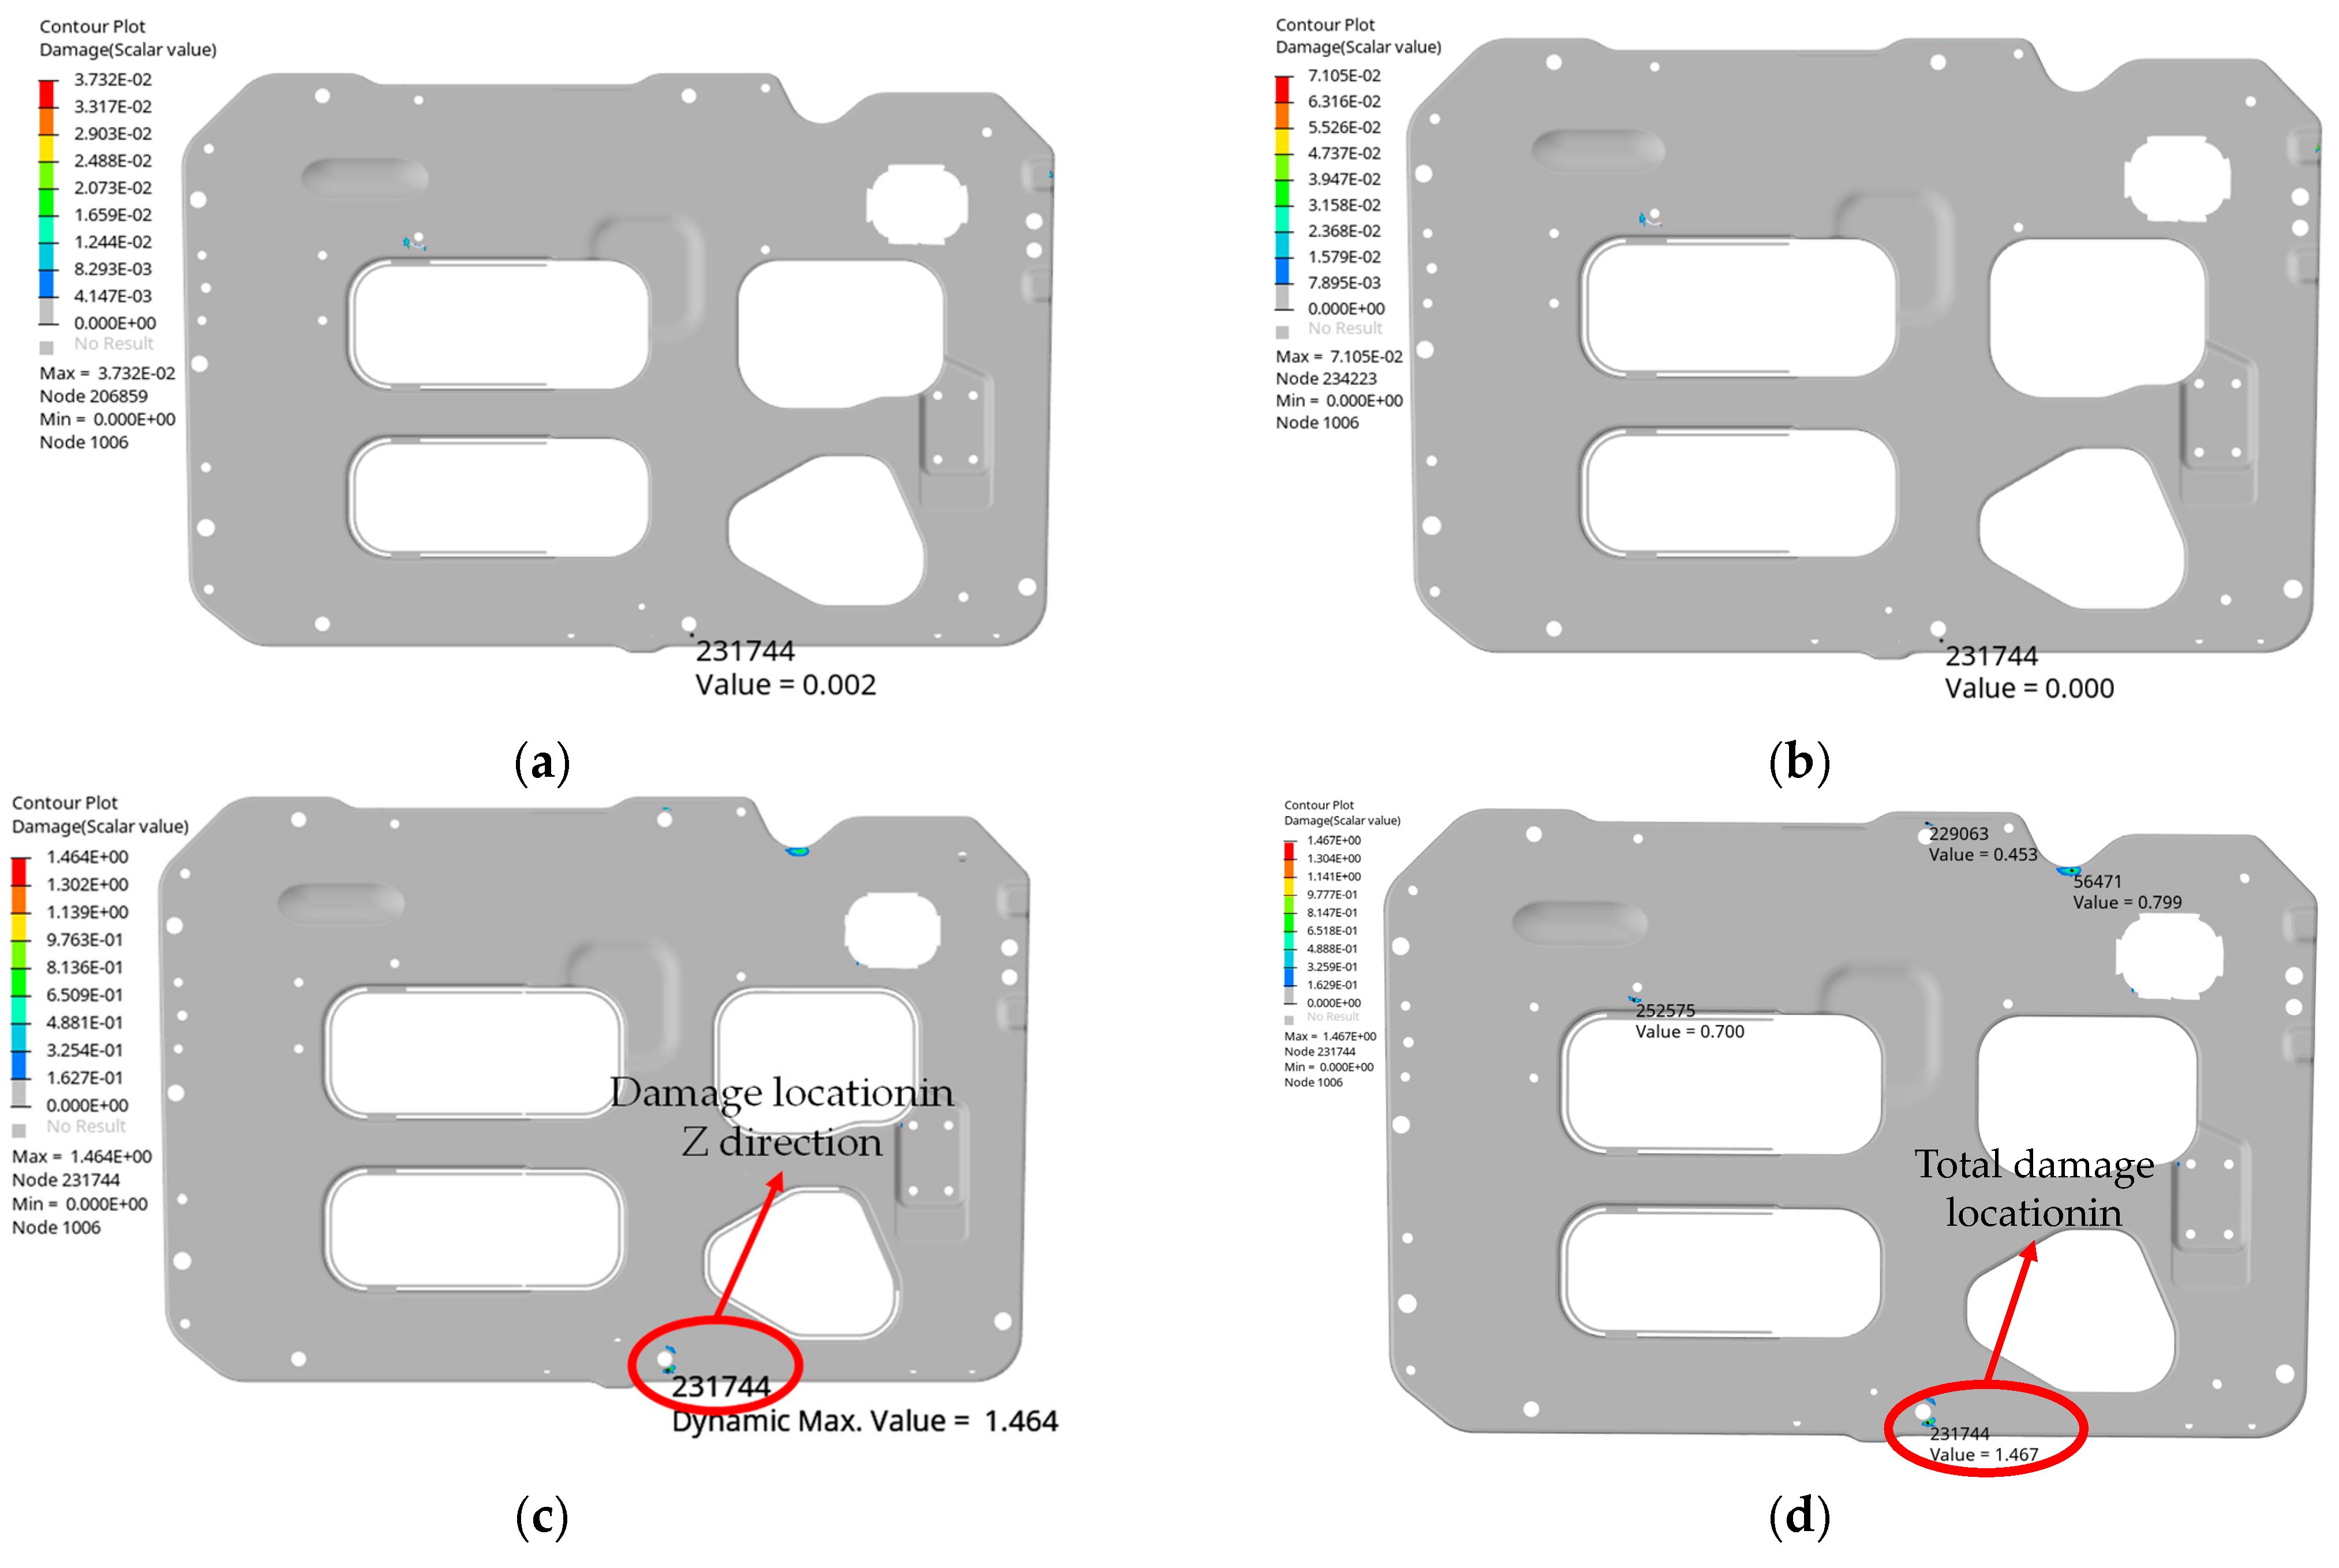
The finite element results are imported into the software, and the load PSD curve based on the national standard GB/T 2423.43 “Safety Requirements for Power Batteries for Electric Vehicles” is applied. Random vibration is simulated in the X, Y, and Z directions for 12 h each, with fixed-frequency excitation at 24 Hz for one hour in each direction. After mapping the load, the calculation is performed to determine the fatigue damage of the fuel cell system’s fixed plate assembly under vibration in all three directions, as shown in Figure 23.
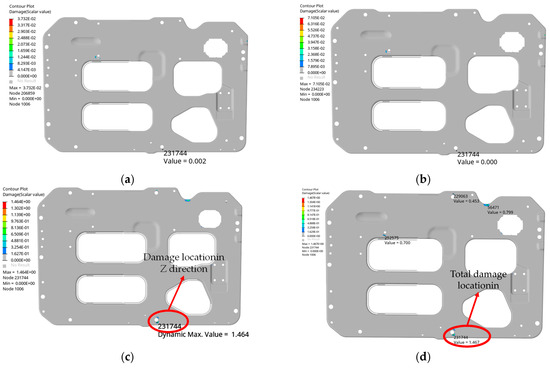
Figure 23.
Fatigue damage of fixed plate: (a) Fatigue damage under X-axis vibration; (b) Fatigue damage under Y-axis vibration; (c) Fatigue damage under Z-axis vibration; (d) Total fatigue damage.
As shown in the figure, under vibration in the X and Y directions, the fatigue damage values of the structure are 0.037 and 0.071, respectively, both less than 1. However, under Z-direction vibration, the fatigue damage exceeds 1, with a maximum value of 1.467, located at the connection between the stack shell and the fixed plate (Figure 23). This indicates that the fixed plate assembly is susceptible to fatigue failure under Z-direction excitation. The analysis suggests that the primary load on the fixed plate assembly is in the Z direction, where higher excitation and stress concentration lead to significant fatigue damage.
6.2. Bolt Fatigue Life Analysis
In the fuel cell system, the stack housing and other large-mass assemblies are bolted to the fixed plate assembly, which is then connected to the suspension bracket and, subsequently, to the vehicle body. Bolts serve as the primary connectors between various components and are subjected to complex alternating loads during vehicle operation. Thus, fatigue performance analysis of the bolts is essential. In this study, the finite element method for simulating bolt preload involves applying tensile force to the second grid where the bolt contacts, as illustrated in Figure 24.
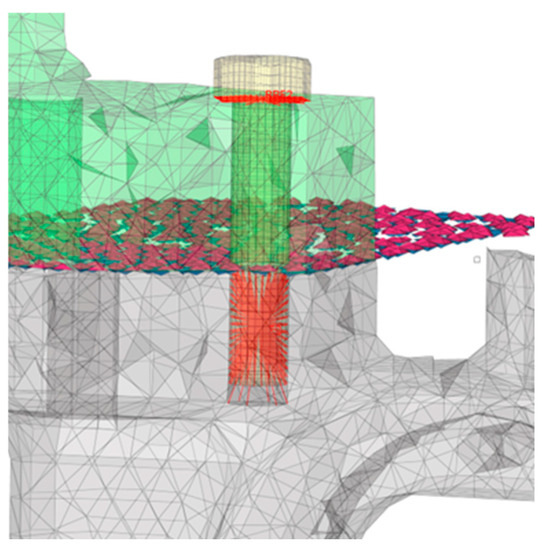
Figure 24.
Bolt preload finite element model.
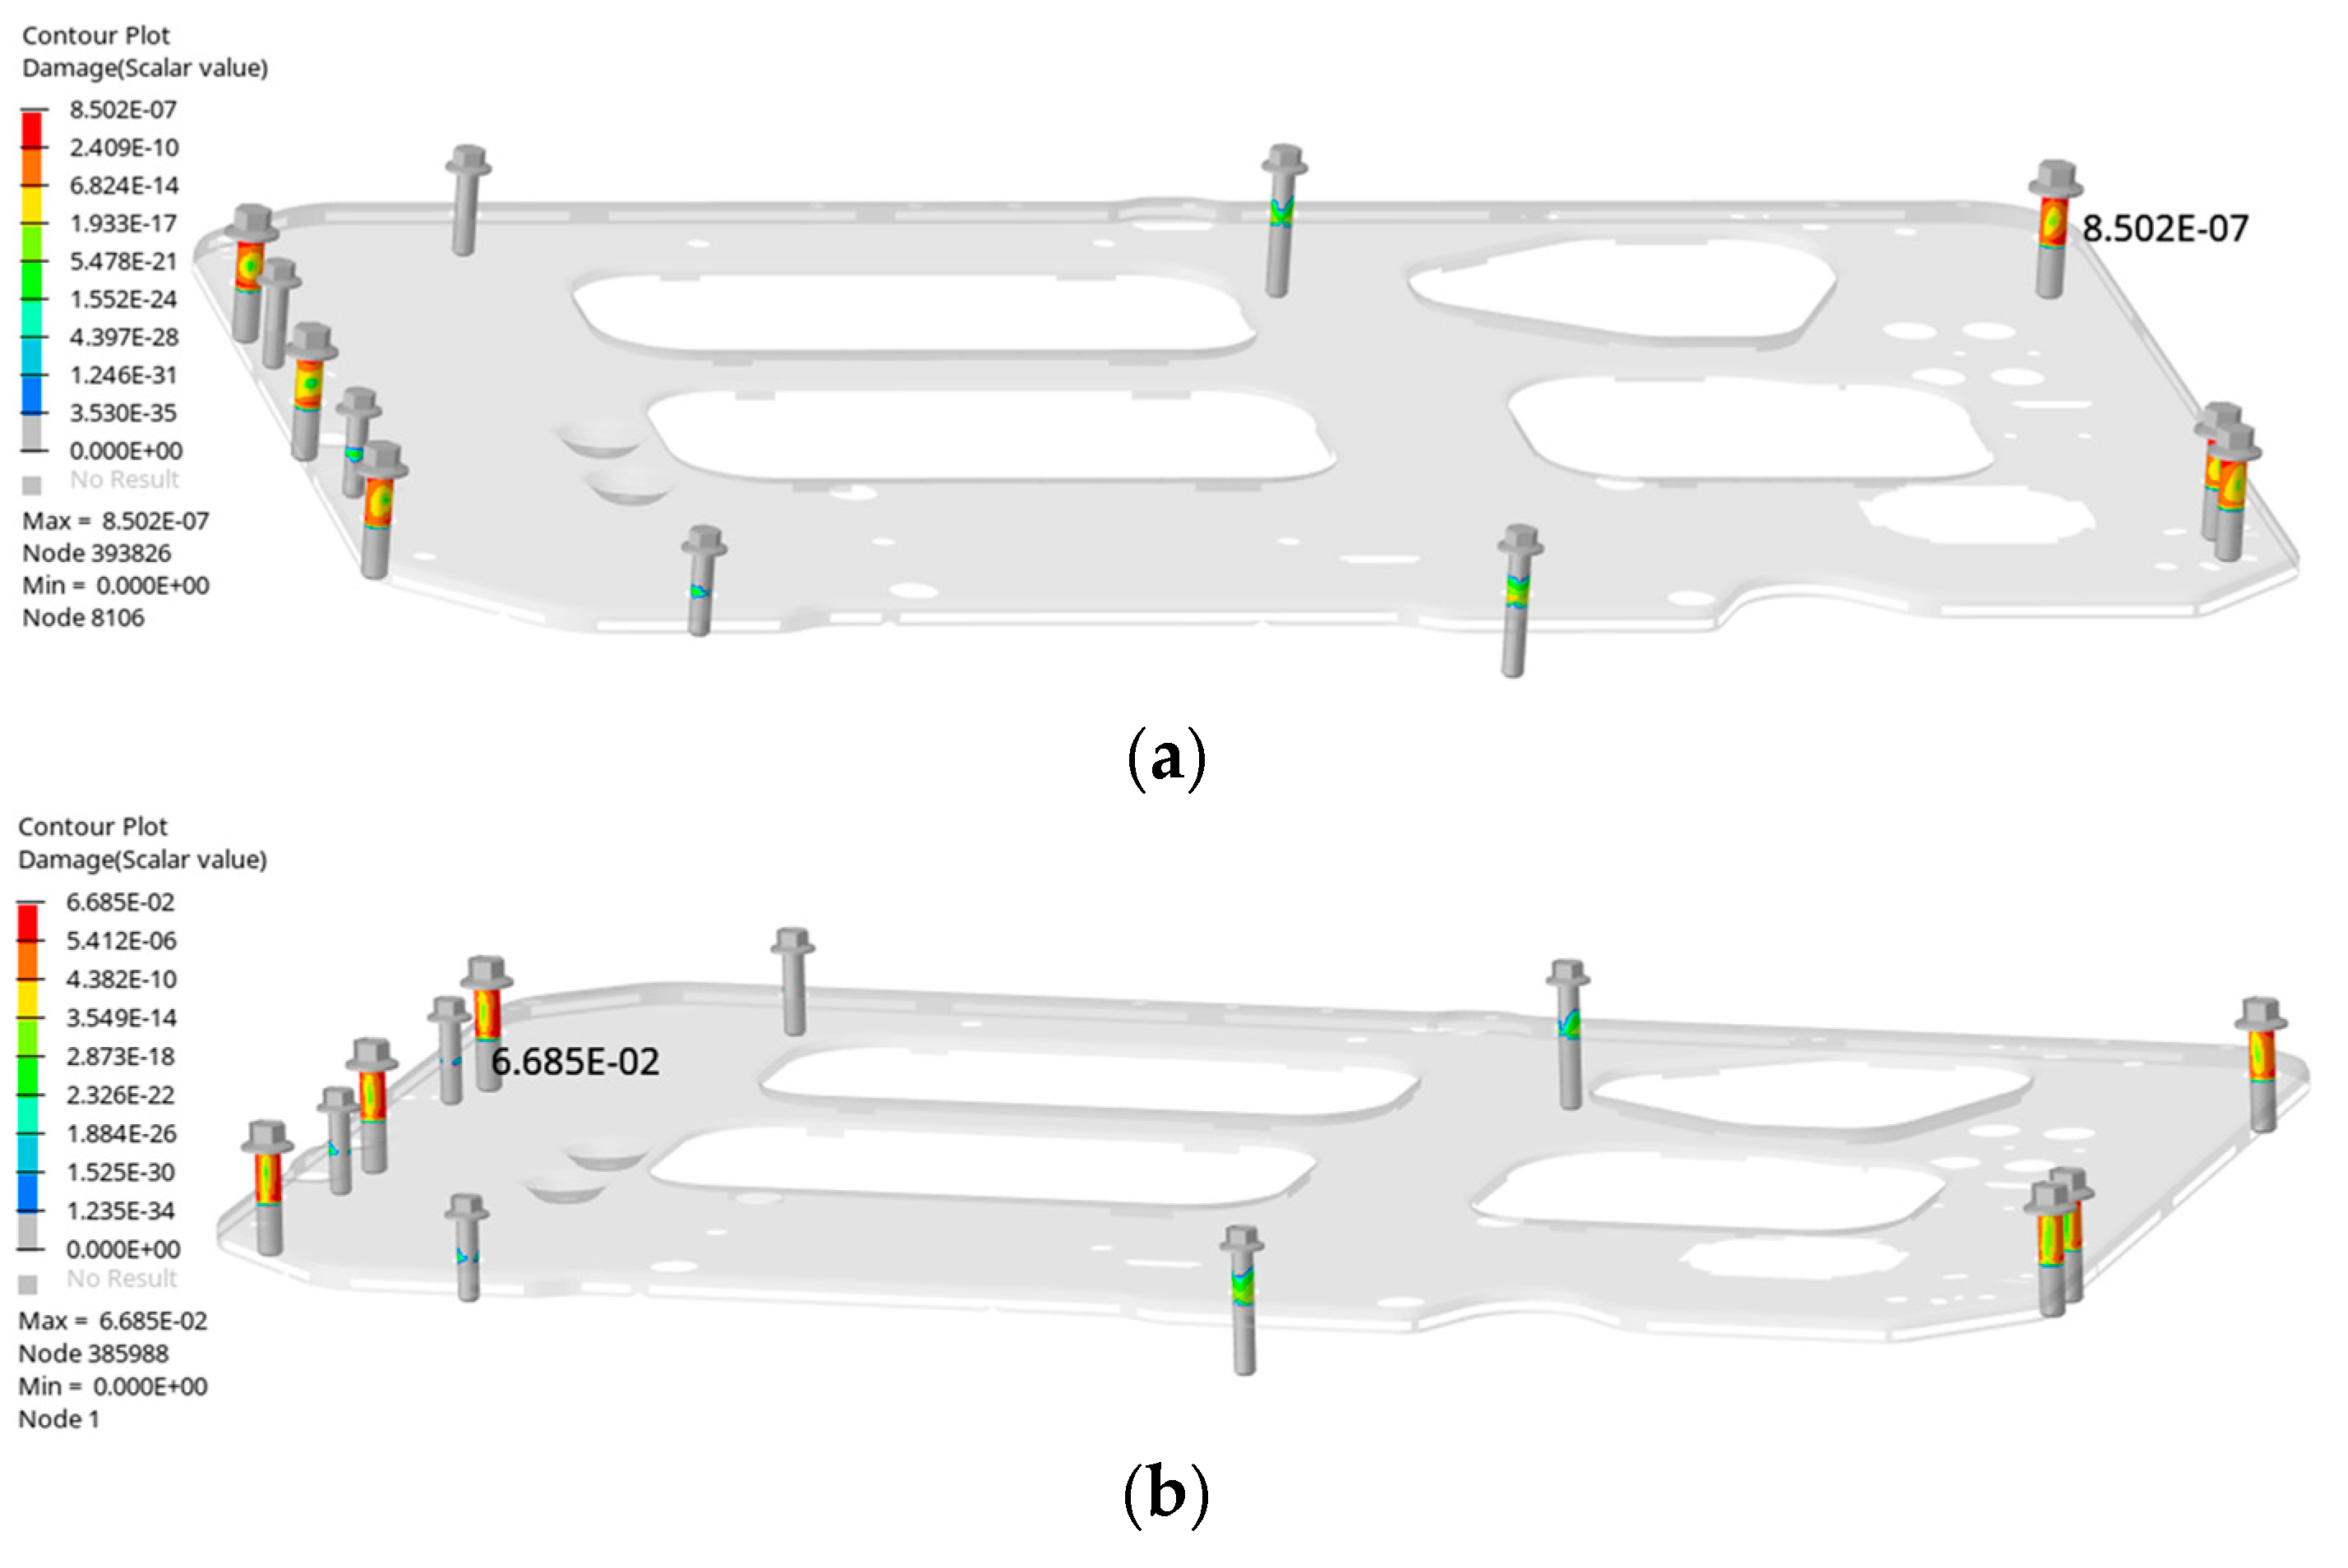
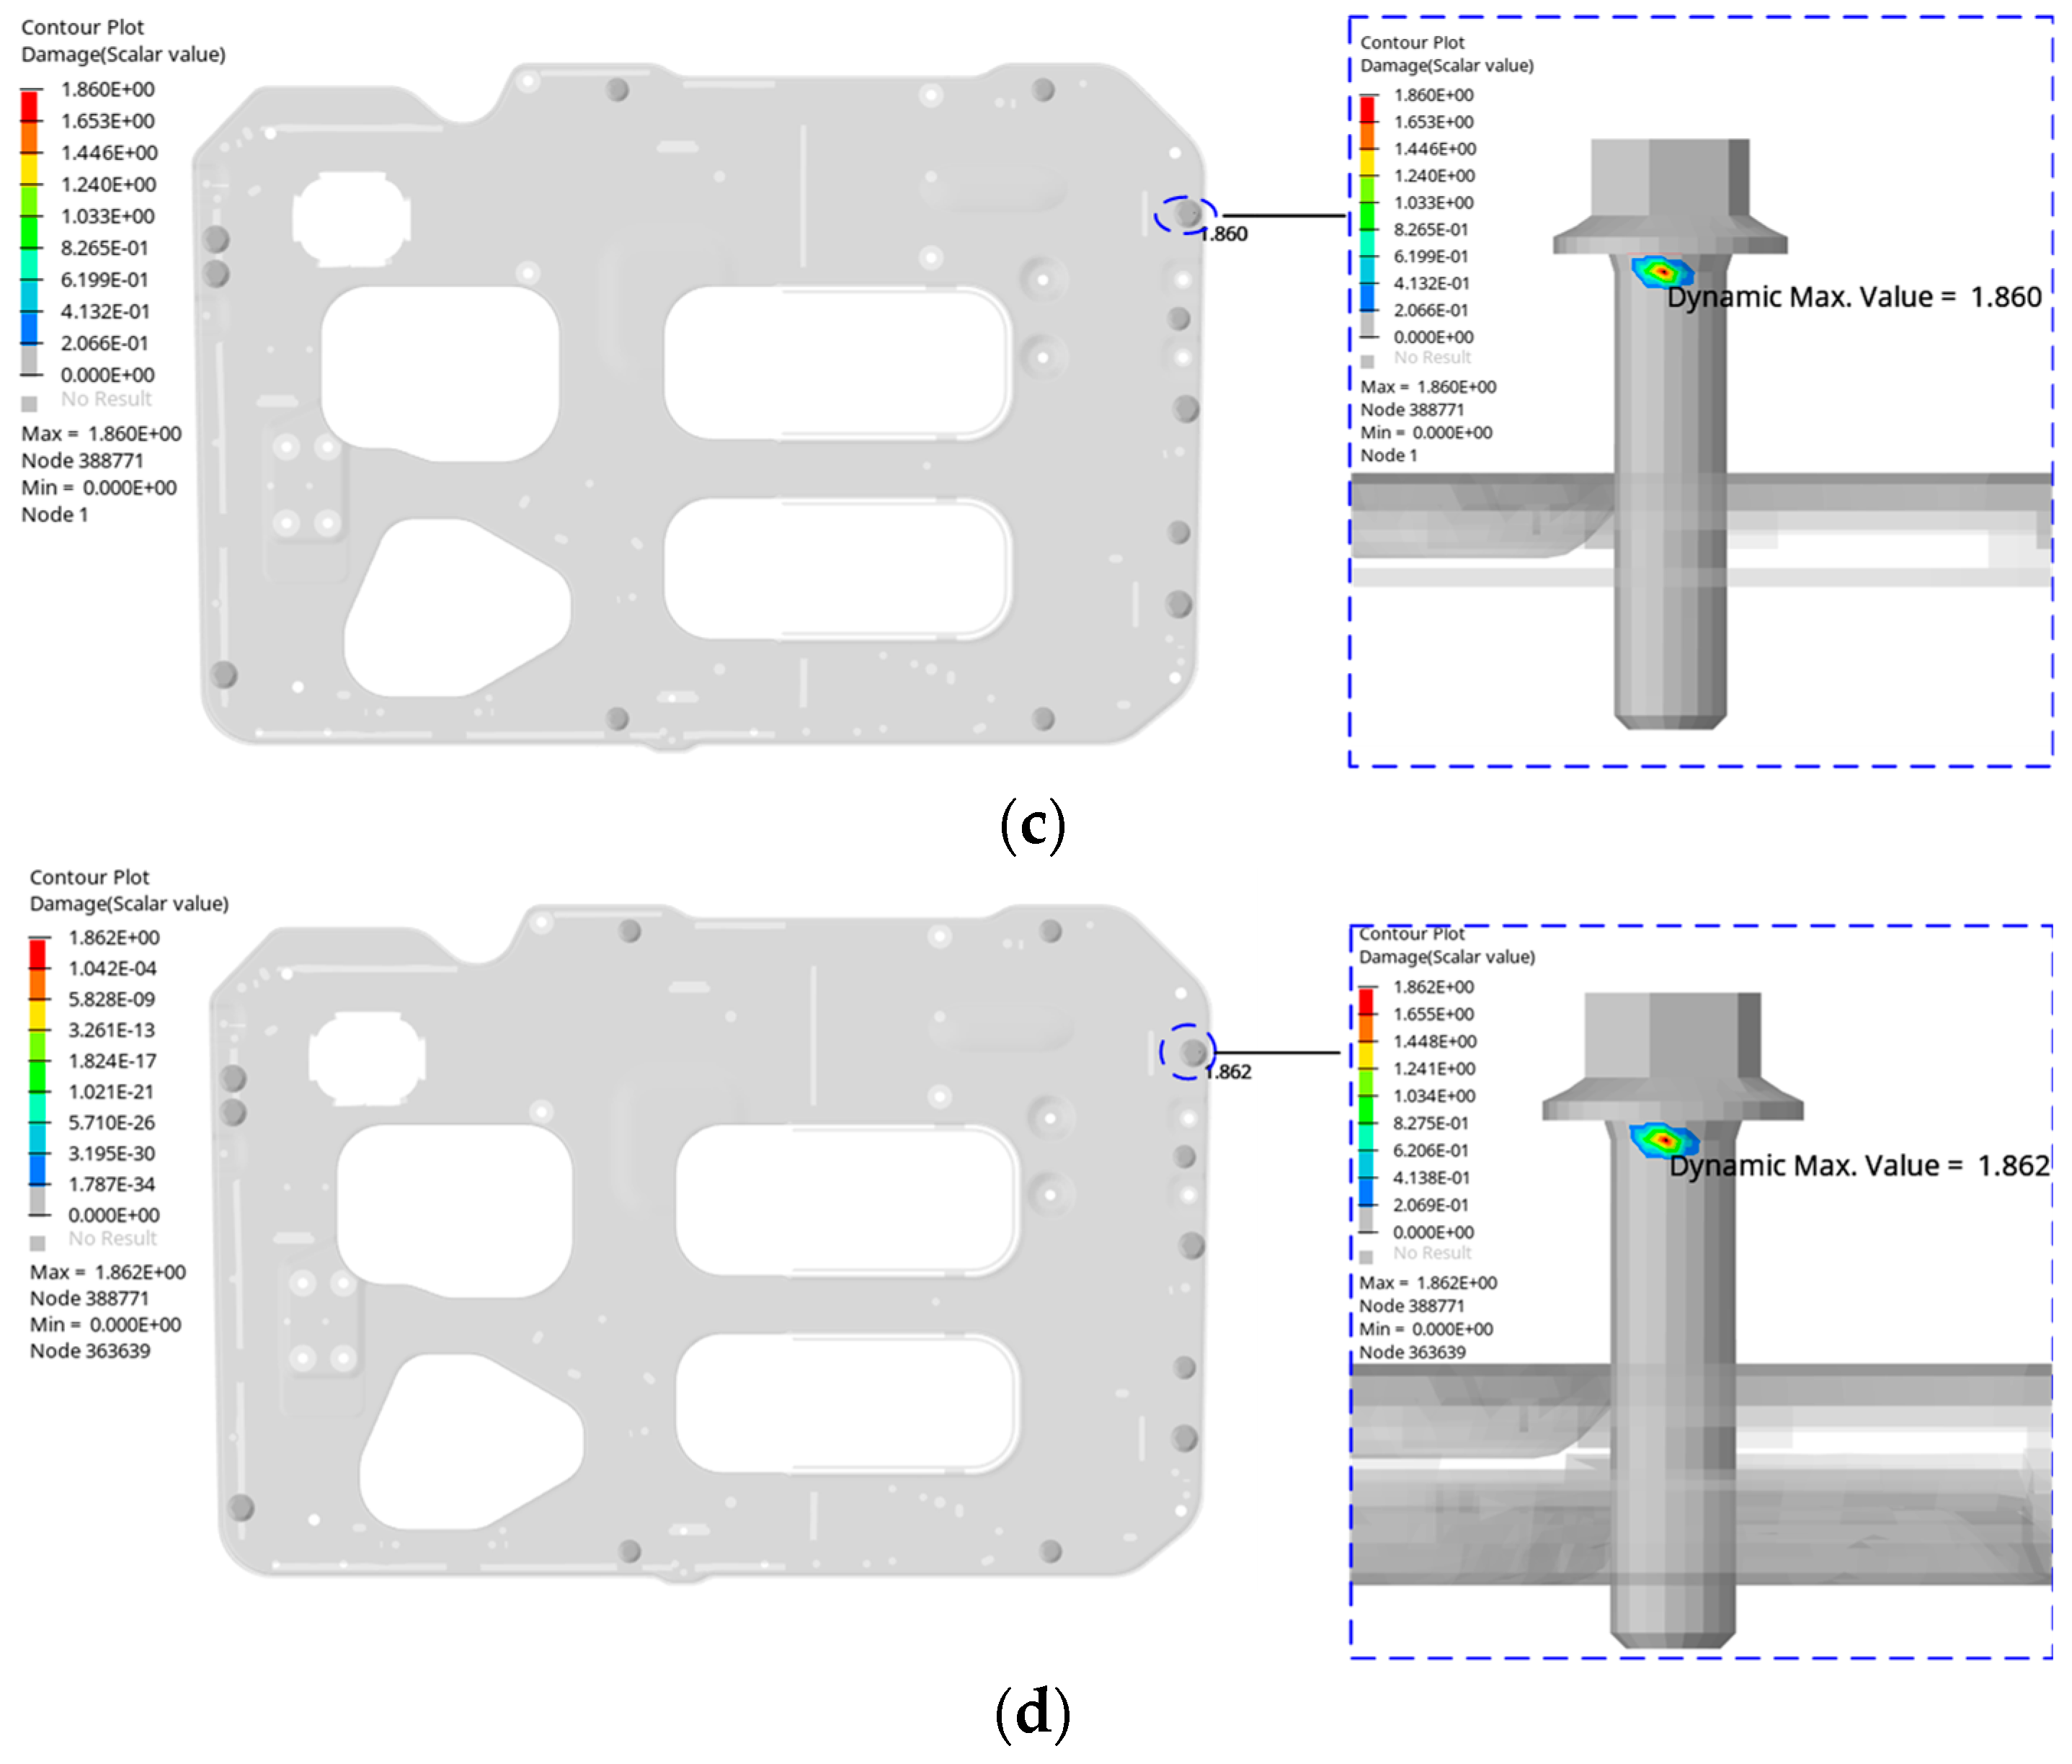
Under bolt preload, the stress frequency response function of the fuel cell system from the excitation point to the bolt is derived. The bolts used are M10-8/SWRCH35K, with material parameters provided in Table 7. By mapping the GB/T 2423.43 “Safety Requirements for Power Batteries for Electric Vehicles” standard through nCode and applying the corresponding PSD curve, the fatigue life of the bolts is evaluated, as shown in Figure 25. Under X-axis vibration, the stress remains below the bolt’s fatigue limit, indicating no fatigue damage. Under Y-axis vibration, the maximum fatigue damage of the X6 bolt connecting the fixed plate to the suspension bracket is 0.06, which is minimal, suggesting a low likelihood of fatigue failure. However, under Z-axis vibration, the X4 bolt’s fatigue damage reaches 1.86, indicating imminent failure due to fatigue under these conditions.

Table 7.
Bolt material parameters.
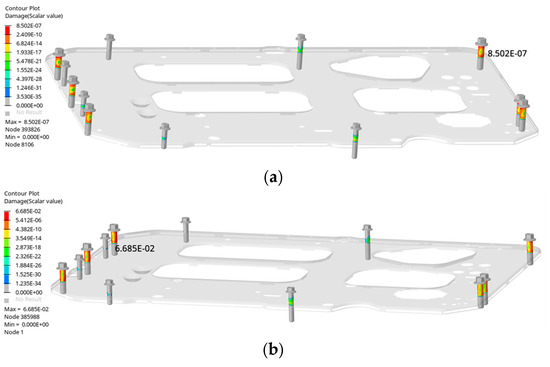
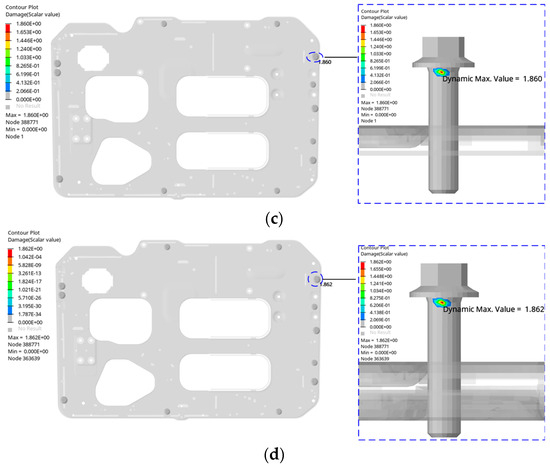
Figure 25.
Bolt fatigue damage: (a) Fatigue damage of bolts under condition X; (b) Fatigue damage of bolts under condition Y; (c) Fatigue damage of bolts under condition Z; (d) Fatigue damage of bolts under general working conditions.
6.3. Comparison of Fatigue Simulation Results with Test Results
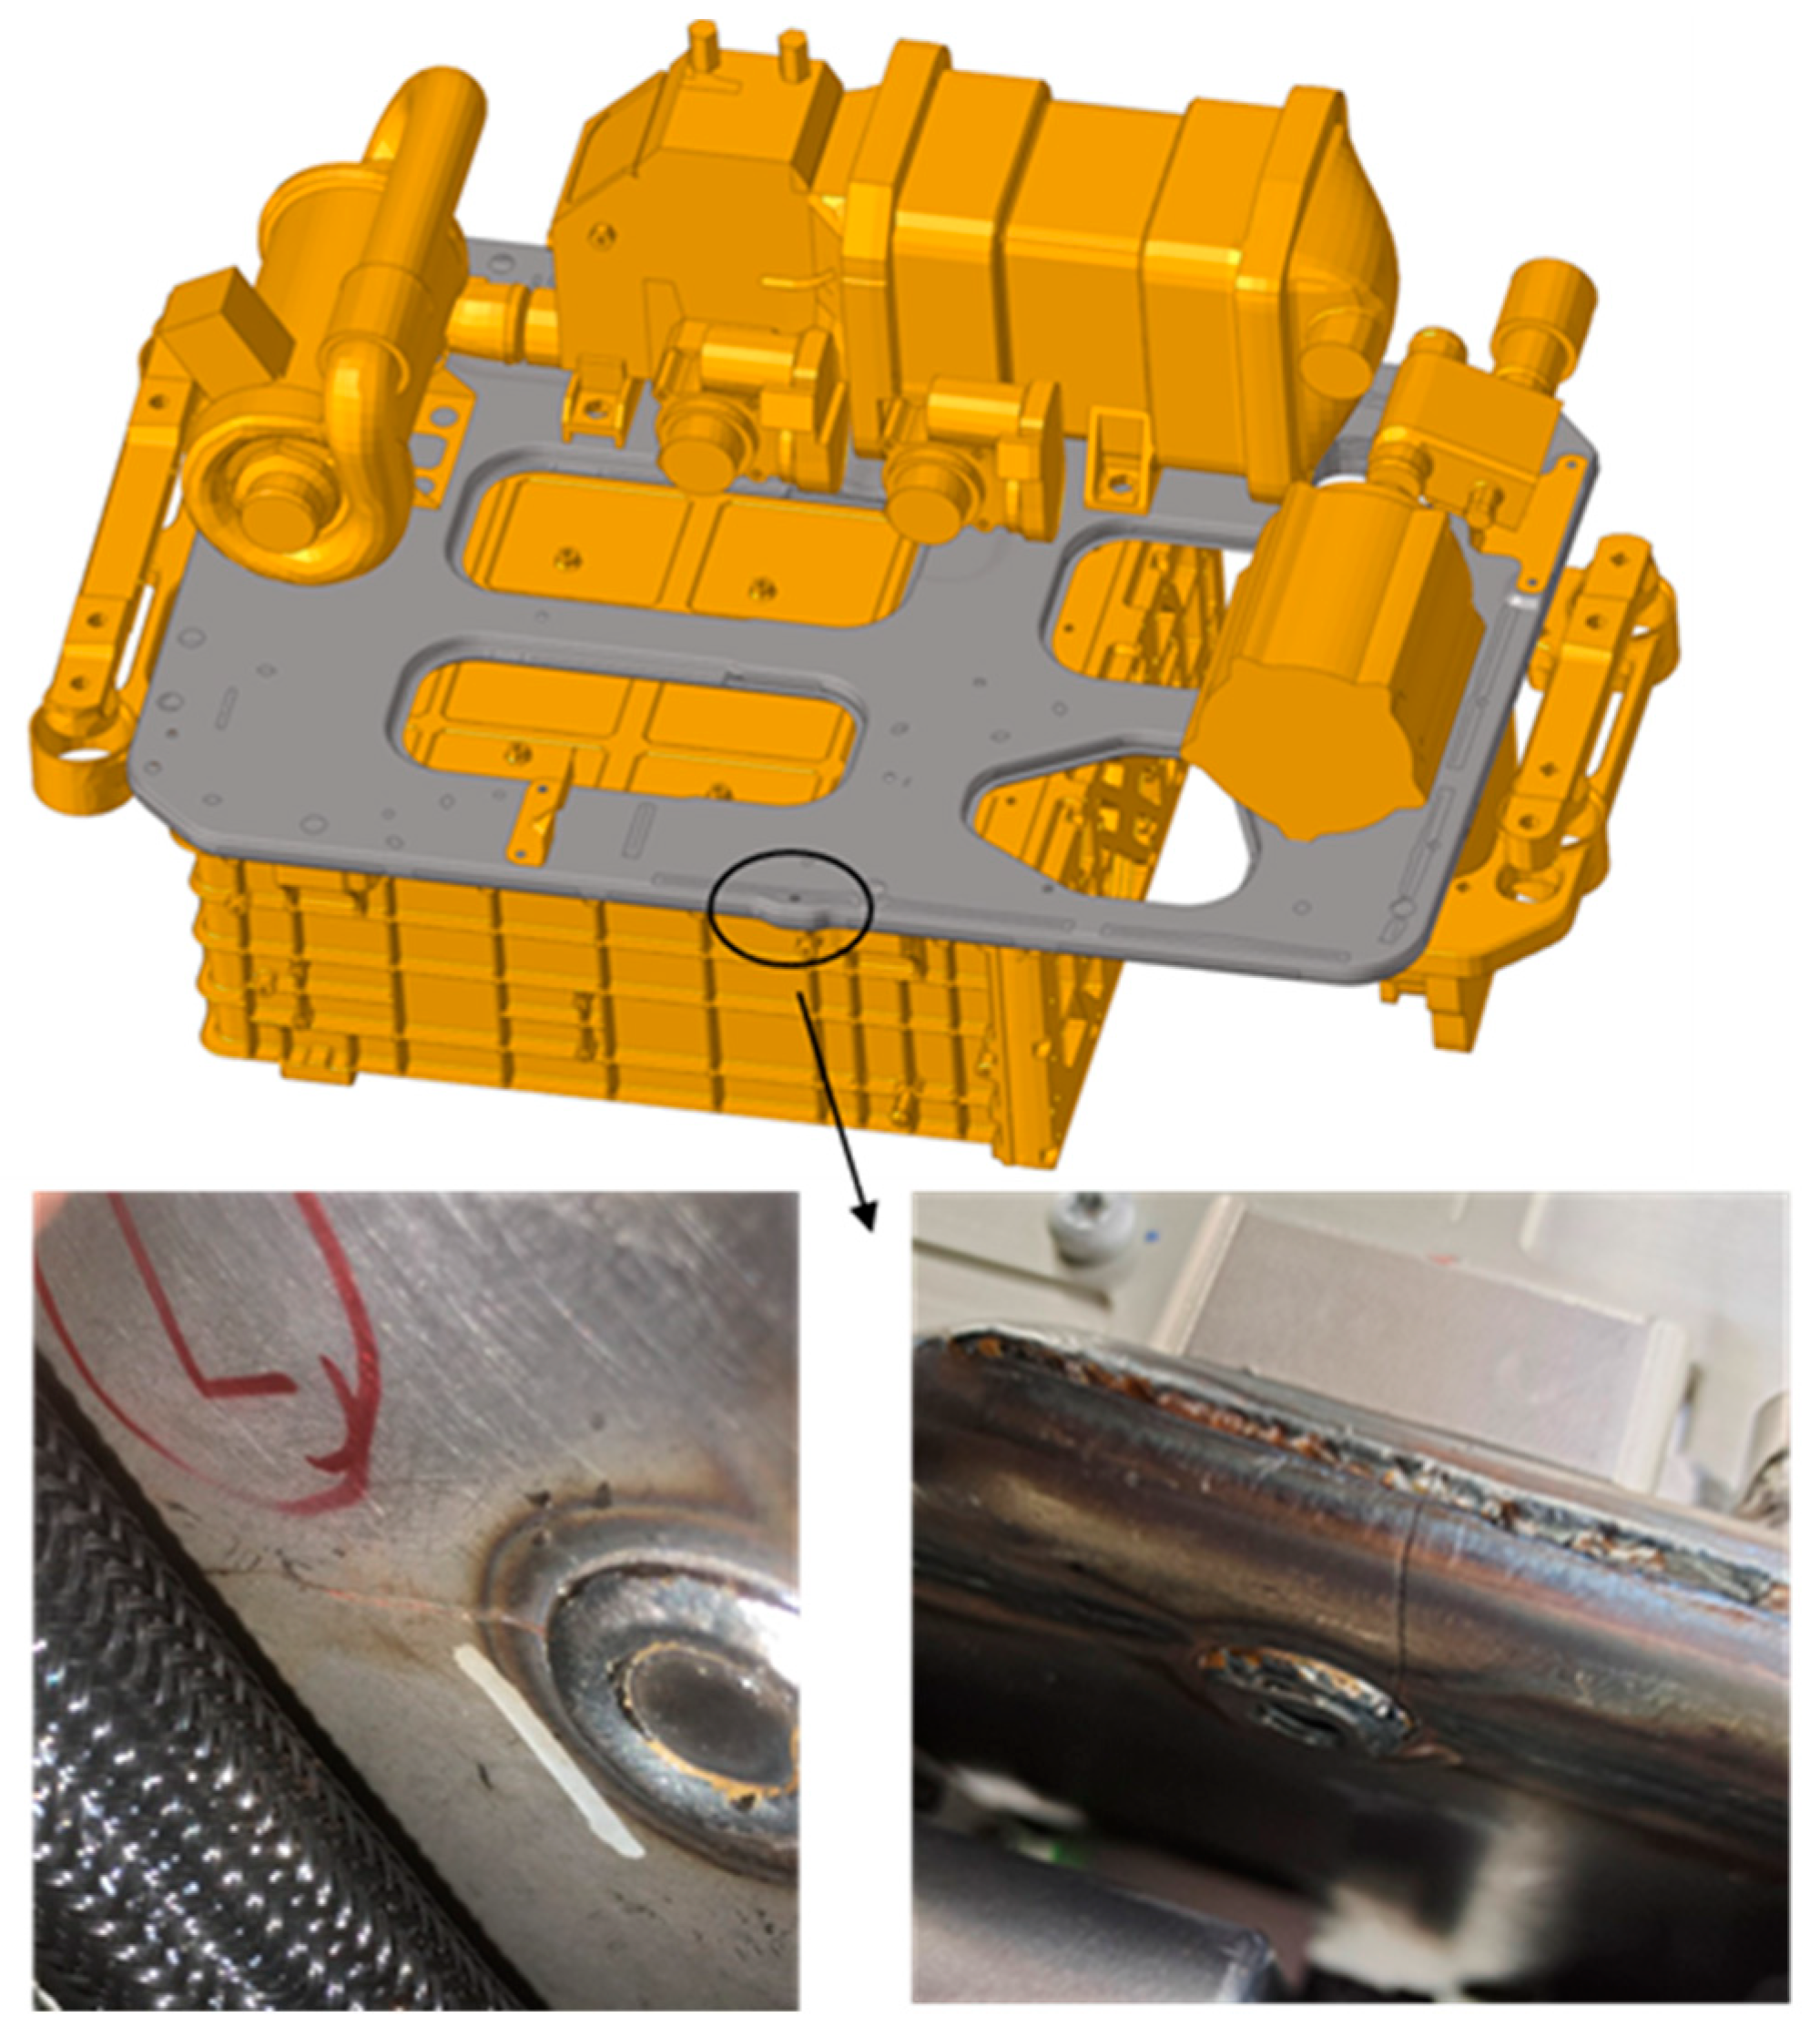
Random vibration testing, conducted in accordance with national standards, revealed that the fixed plate assembly of the fuel cell system remained intact under random and fixed-frequency vibrations in the X and Y directions. However, under random and fixed-frequency vibrations in the Z direction, cracks developed at the D6 position of the B plate, consistent with the damage predicted by fatigue simulations. The locations of the fatigue cracks are shown in Figure 26 and Figure 27.
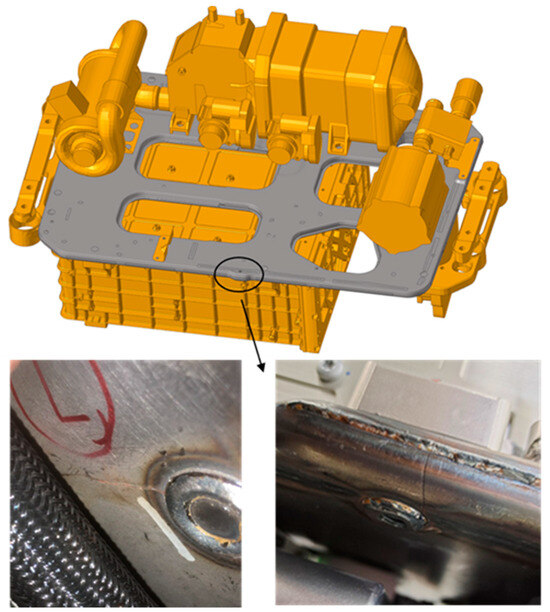
Figure 26.
Fatigue damage location of the fixing plate.
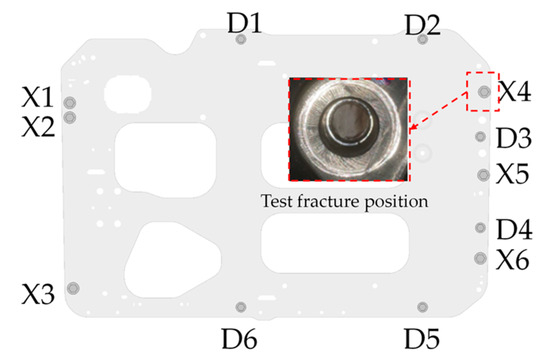
Figure 27.
Bolt fatigue damage location.
No bolt failure occurred during vibrations in the X and Y directions. In contrast, the bolt at position X4 failed during Z-axis vibration, as shown in Figure 27. The maximum RMS stress of the X4 bolt in the Z direction was 608.8 MPa, confirming it as a critical failure point. These findings validate the fatigue analysis of the fuel cell system and highlight the risk of fatigue damage at both the D6 position on the fixed plate B and the X4 bolt connection. To enhance system performance, structural or component optimization is recommended.
7. Conclusions
This study analyzes a fuel cell system by conducting frequency-domain random vibration analysis on each assembly and fatigue analysis of the key component, the fixed plate assembly. The main contributions are as follows:
General modeling standards for the fuel cell system were established, including grid element size, feature cleaning, and warpage. Tetrahedral elements were used for the stack assembly, DC/DC converter, and suspension bracket, while quadrilateral elements were applied to other assemblies. Hexahedral elements were used for the bolts connecting the fixed plate assembly, with a basic element size of 3 mm. The model was mass-corrected to improve accuracy.
The random vibration excitation spectrum from the national standard GB/T 2423.43 (“Safety Requirements for Power Batteries for Electric Vehicles”) was applied to perform random vibration acceleration power spectrum response and stress analysis. Under Z-direction random vibration, the maximum RMS stress in the fixed plate assembly was 222.62 MPa. A random vibration test was conducted to validate the simulation results, and the errors between the test and simulation were within an acceptable range, confirming the model’s reliability.
The fatigue life of the fixed plate assembly and connecting bolts was predicted using the Miner linear cumulative damage law. The S-N curve of the material was fitted, and the results were validated by a random vibration fatigue test. Both the test and simulation indicated potential fatigue failure of component B and the connecting bolts under national standard excitation conditions, necessitating design improvements.
Future work will focus on enhancing fatigue analysis by incorporating nonlinear models for suspension components, thus improving the accuracy of the finite element model for fuel cell systems.
Author Contributions
Conceptualization, Z.L.; Methodology, Z.L.; Writing—original draft, M.W. and P.G.; Writing—review & editing, Y.G.; Supervision, Z.L. and D.G.; Project administration, Z.L.; Funding acquisition, Z.L. All authors have read and agreed to the published version of the manuscript.
Funding
This research was funded by the National Natural Science Foundation of China (grant number 52405283, 52175239).
Data Availability Statement
The data presented in this study are available on request from the corresponding author.
Conflicts of Interest
The authors declare no conflict of interest.
References
- Hasan, M.; Chen, J.; Waldecker, J.R.; Santare, M.H. Predicting fatigue lifetimes of a reinforced membrane in polymer electrolyte membrane fuel cell using plastic energy. J. Power Sources 2022, 539, 231597. [Google Scholar] [CrossRef]
- Kim, H.G.; Kim, G.C.; Ji, W.; Lee, Y.S.; Jang, S.; Shin, C.M. Random vibration fatigue analysis of a multi-material battery pack structure for an electric vehicle. Funct. Compos. Struct. 2021, 3, 025006. [Google Scholar] [CrossRef]
- Chen, J.; Xuan, D.; Wang, B.; Jiang, R. Structure optimization of battery thermal management systems using sensitivity analysis and stud genetic algorithms. Appl. Sci. 2021, 11, 7440. [Google Scholar] [CrossRef]
- Shuai, W.; Li, E.; Wang, H.; Li, Y. Space mapping-assisted optimization of a thin-walled honeycomb structure for battery packaging. Struct. Multidiscip. Optim. 2020, 62, 937–955. [Google Scholar] [CrossRef]
- Shojayian, M.; Sebdani, M.M.; Kjeang, E. Simulation of fuel cell membrane durability under vehicle operation. J. Power Sources 2024, 613, 234855. [Google Scholar] [CrossRef]
- Salunkhe, A.; Kumar, N.G. New Generation Front Axle for EV and FCEV Buses; Technical Paper; SAE International: Warrendale, PA, USA, 2024. [Google Scholar]
- Kim, D.; Sim, K.; Park, J. Experimental study on vibration-induced clamping force reduction in fuel cell structures. Int. J. Hydrog. Energy 2022, 47, 37609–37616. [Google Scholar] [CrossRef]
- Yan, X.; Guo, D.; Wan, X.; Sun, J.; Quan, X.; Wang, Y. A Fatigue Damage Spectrum-Based Approach to Vibration Durability Test for Vehicle Batteries. SAE Int. J. Commer. Veh. 2024, 17, 20. [Google Scholar] [CrossRef]
- Xu, W.; Wang, D. Fatigue and impact analysis and multi-objective optimization design of Mg/Al assembled wheel considering riveting residual stress. Front. Mech. Eng. 2022, 17, 45. [Google Scholar] [CrossRef]
- Dong, S.; Lv, J.; Wang, K.; Li, W.; Tian, Y. Design and optimization for a new locomotive power battery box. Sustainability 2022, 14, 12810. [Google Scholar] [CrossRef]
- Zhu, G.; He, L.; Jia, X.; Tan, Z.; Qin, Q. Experimental Study on Vibration and Noise Reduction of Gear Transmission System Based on ISFD. Machines 2024, 12, 531. [Google Scholar] [CrossRef]
- Sahu, A.K.; Haddad, R.Z.; Al-Ani, D.; Bilgin, B. Thermomechanical Rotor Fatigue of an Interior Permanent Magnet Synchronous Motor. Machines 2024, 12, 158. [Google Scholar] [CrossRef]
- Zhou, W.; Zhang, G.; Wang, H.; Peng, C.; Liu, X.; Xiao, H.; Liang, X. Experimental Fatigue Evaluation of Bogie Frames on Metro Trains. Machines 2022, 10, 1003. [Google Scholar] [CrossRef]
- Pan, L.; Guan, X.; Luan, X.; Huang, Y.; Zhang, R.; Choi, J.-H.; Zhu, X. Fatigue Analysis of Dozer Push Arms under Tilt Bulldozing Conditions. Machines 2022, 10, 38. [Google Scholar] [CrossRef]
- Lu, H.; Wang, J.; Lian, Y.; Wen, Z.; Liu, T.; Yue, Z. Random vibration fatigue behavior of directionally solidified superalloy: Experiments and evaluation of life prediction methods. Int. J. Fatigue 2023, 175, 107746. [Google Scholar] [CrossRef]
- Zhang, Z.; Jiang, B.; Zhang, G.; Liu, W.; Li, F.; Yin, Y. Improvement and lightweight design of power battery bracket based on random vibration fatigue analysis. Comput. Aided Eng. 2023, 32, 11–15. [Google Scholar]
- Wang, S.; Wu, C.; Sun, B.; Wang, H.; Ding, X.; Yu, H.; Ni, W.; Xiong, M.; Zhang, H. Data-based deep learning for random vibration fatigue life prediction of car seat frame. Nonlinear Dyn. 2024, 1–25. [Google Scholar] [CrossRef]
- Zhang, C.; Wan, R.; He, J.; Yu, J.; Zhao, Y. Non-stationary vibration fatigue life prediction of automotive components based on long short-term memory network. Int. J. Fatigue 2024, 187, 108459. [Google Scholar] [CrossRef]
- Zhang, X.; Xiong, Y.; Pan, Y.; Du, H.; Liu, B. Crushing stress and vibration fatigue-life optimization of a battery-pack system. Struct. Multidiscip. Optim. 2023, 66, 48. [Google Scholar] [CrossRef]
- Czerlunczakiewicz, E.; Majerczak, M.; Bonato, M. Fatigue Simulations for Automotive Components undergoing Vibration Loadings: Effect of nonlinear behavior. Procedia Struct. Integr. 2024, 57, 743–753. [Google Scholar] [CrossRef]
- Miner, M.A. Cumulative damage in fatigue. J. Appl. Mech. 1945, 12, 159–164. [Google Scholar] [CrossRef]
- Osgood, C.C. Fatigue Design: International Series on the Strength and Fracture of Materials and Structures; Elsevier: Amsterdam, The Netherlands, 2013. [Google Scholar]
- Parhi, K.K.; Ayinala, M. Low-Complexity Welch Power Spectral Density Computation. In IEEE Transactions on Circuits and Systems I: Regular Papers; IEEE: Piscataway, NJ, USA, 2014; Volume 61, pp. 172–182. [Google Scholar]
- Dirlik, T.; Benasciutti, D. Dirlik and Tovo-Benasciutti Spectral Methods in Vibration Fatigue: A Review with a Historical Perspective. Metals 2021, 11, 1333. [Google Scholar] [CrossRef]
- GB/T 2423.43-2008; Environmental Testing for Electric and Electronic Products-Part 2:Test Methods-Mounting of Specimens for Vibration, Impact and Similar Dynamic Tests. China Standards Press: Beijing, China, 2008.
- Tripathi, P.K.; Kumar, N. Fatigue damage spectrum-based assessment of vibration standards on battery pack for EV’s using stress as a response metric. In Proceedings of the 2019 IEEE Transportation Electrification Conference (ITEC-India), Bengaluru, India, 17–19 December 2019; pp. 1–6. [Google Scholar]
- Li, Y.; Lu, P.; Liu, C.; Ren, W.; Wen, J. Fatigue Life of a Comb Plate Expansion Joint. Machines 2023, 11, 494. [Google Scholar] [CrossRef]
Disclaimer/Publisher’s Note: The statements, opinions and data contained in all publications are solely those of the individual author(s) and contributor(s) and not of MDPI and/or the editor(s). MDPI and/or the editor(s) disclaim responsibility for any injury to people or property resulting from any ideas, methods, instructions or products referred to in the content. |
© 2024 by the authors. Licensee MDPI, Basel, Switzerland. This article is an open access article distributed under the terms and conditions of the Creative Commons Attribution (CC BY) license (https://creativecommons.org/licenses/by/4.0/).

