Abstract
In modern freeform surfaced optics manufacturing, ultraprecision machining through single-point diamond turning (SPDT) plays a crucial role due to its ability to meet the high accuracy demands of optical design and stringent surface quality requirements of the final optic. The process involves meticulous steps, including optic surface modeling and analysis, optic design, machining toolpath generation, and manufacturing. This paper presents an integrated approach to customized precision design and the manufacturing of freeform surfaced varifocal lenses through a web-based e-portal. The approach implements an e-portal-driven manufacturing system that seamlessly integrates lens design, modeling and analysis, toolpath generation for ultraprecision machining, mass personalized customization, and service delivery. The e-portal is specifically designed to meet the stringent demands of personalized mass customization, and to offer a highly interactive and transparent experience for the lens users. By using Shiny and R-script programming for platform development and combining COMSOL Multiphysics for the ray tracing simulation, the e-portal leverages open-source technologies to provide manufacturing service agility, responsiveness, and accessibility. Furthermore, the integration of R-script and Shiny programming allows for advanced interactive information processing, which also enables the e-portal-driven manufacturing system to be well suited for personalized complex products such as freeform surfaced lenses.
1. Introduction
In contemporary freeform surfaced lens design and manufacturing, personalized mass customization is the primary feature, alongside maintaining high precision, standards of quality, the shortest delivery time, and cost efficiency. Varifocal lens manufacturing has been widely developed since the conception of freeform surface technology has freed many lens designers from the constraints of the traditional mass production of lenses by enabling a local prescription laboratory to deliver varifocal lenses designed and produced in a responsively mass-customized manner for a specific wearer [1]. A varifocal lens is composed of three main zones: a distant-vision zone, a near-vision zone, and a corridor zone that naturally bridges these two. Ensuring uniform optical power within the corridor zone is critical for providing clear near and distant vision, meeting specific clinical vision requirements. The manufacturing process of varifocal lenses typically involves the use of single-point diamond turning (SPDT) in the fast tool servo (FTS) mode, which is well suited to meet the high quality and controllable mass customization demands of the industry. Due to the stringent accuracy requirements in optics design and the high surface quality standards for the final product, a meticulous process is followed. This process encompasses surface modeling, design, toolpath generation with design for manufacturing, vision assessment, and the deterministic manufacturing of the lens.
However, such industrial processes often highlight the challenges in aligning optical design with manufacturing realities. The surface design is typically based on the unique specifications provided by the customer, while the manufacturing process is guided by the geometric constraints of the optical system. Discrepancies between design specifications and manufacturing constraints can lead to defects in the final product, resulting in surface quality degradation. This underscores the need for a platform that enables the integration between optical design and manufacturing seamlessly. Furthermore, such a platform would render a higher degree of responsiveness in the manufacturing process. In highly mass-customized production environments, effective communication among all the stakeholders and customers is crucial for ensuring that products meet all necessary specifications, particularly following the ultimate manufacturing goals in quality, costs, delivery time, and customer satisfaction. A web-based e-platform should facilitate real-time collaboration among design teams, manufacturers, and customers, ensuring smooth integration and communication throughout the entire production process chain and supply chain [2,3].
In recent years, advancements in freeform surface technology and CNC machine processes have driven extensive research and development in varifocal lens design. Typically, lens design is guided by simple heuristics and a few adjustable parameters. Since the introduction of Maitenaz lenses in 1967 [4], numerous patented designs have emerged. Methods such as those proposed by Winthrop [5] allocate power along a curve and distribute it across the rest of the lens, while Wei [6] in 2019 proposed designing a meridian line first and then constructing the surface accordingly. Additionally, numerical methods, including B-splines and NURBS, have been employed for designing and modeling varifocal lenses [4,7,8] based on their high ability to represent a freeform surface detail and avoid quality loss during the transfer process between design and manufacturing. For varifocal lens manufacturing, a range of new processing techniques have been proposed, such as the injection method [9], slow tool servo ultraprecision machining [10], fast tool servo ultraprecision machining [11], etc. In mass production, injection molding offers high efficiency and low cost, making it suitable for large-scale manufacturing. However, it has limitations, including unavoidable defects, adhesion issues between the mold and lens surface, refractive index variation, and limited customization. Traditional fly-cutting processes effectively produce freeform surfaces with adaptive customization, though they require subsequent polishing. This polishing step can risk surface damage, potentially introducing defects that compromise the original design.
In the freeform surface optics industry, it is essential to consider the diffraction effects caused by surface topography. During the ultraprecision machining process, surface topography is generated through the interaction between the tool profile and the workpiece [12]. The resulting surface topography produced by ultraprecision machining is characterized by tool marks, material swelling and recovery, vibration-induced waves, material pile-up, and material cracks/surface wrinkles/fractures/defects/dimples [13]. State-of-the-art research on surface characteristics has been conducted to study cutting mechanisms. Since in 1964 Sata proposed the existence of material swelling [14], the research of material recovery and swelling in the SPDT ultraprecision machining process has been widely studied in depth [15,16]. The crystallographic orientation of the material induces variation in the elastic recovery and plastic deformation of the surface and further leads to the formation of a wavy surface. Lee et al. in 1999 reported an observation of a wavy surface through a straight cutting test [17]. Later, Cheung in 2002 [18] observed that the pits and cracks formed at the surface of AL661/15SiCp in ultraprecision machining were induced by the hard SiC reinforcement. In 2006, Simoneau et al. [19] proposed that surface micro-defects, illustrated by dimples occurring at a hard–soft grain boundary, influenced surface roughness during micro-scale cutting. Liu and Melkote [20] presented that material pile-up was one key physical factor influencing nanometric surface roughness formation. Zhang et al. in 2013 [21] investigated the influence of spindle vibration on surface topography in ultraprecision machining.
This paper presents a case study on the development of a web-based e-portal, and investigates the underlying associated holistic theoretical analysis, Multiphysics-based simulations, and their implementation and application perspectives. The framework of the e-portal has the ideology of enabling built-in information processing activities in a highly responsive mass-customized digital environment, which enables freeform surfaced optics design and manufacturing seamlessly while quality is assured in the ‘earlier’ stage in a virtual manner. The implementation of the e-portal developed enables users—such as optometrists, lens manufacturers, or patients—to input their prescriptions and visualize the resulting designed surface through 2D contour plots, 3D surface models, and functional performance in ray tracing simulations. Additionally, the resulting surface’s point cloud file can be generated and shared with manufacturers to facilitate personalized ‘mass production’. Therefore, the implementation and application perspectives are also discussed in depth in this paper.
2. Framework of the e-Portal Development
Efficient and effective varifocal lens production requires a manufacturing system that enables end-to-end personalized manufacturing capabilities. This involves initiating the lens design process by addressing each customer’s specific requirements, planning and controlling customized production orders, and fulfilling and delivering products that meet both quality standards and customer satisfaction [22].
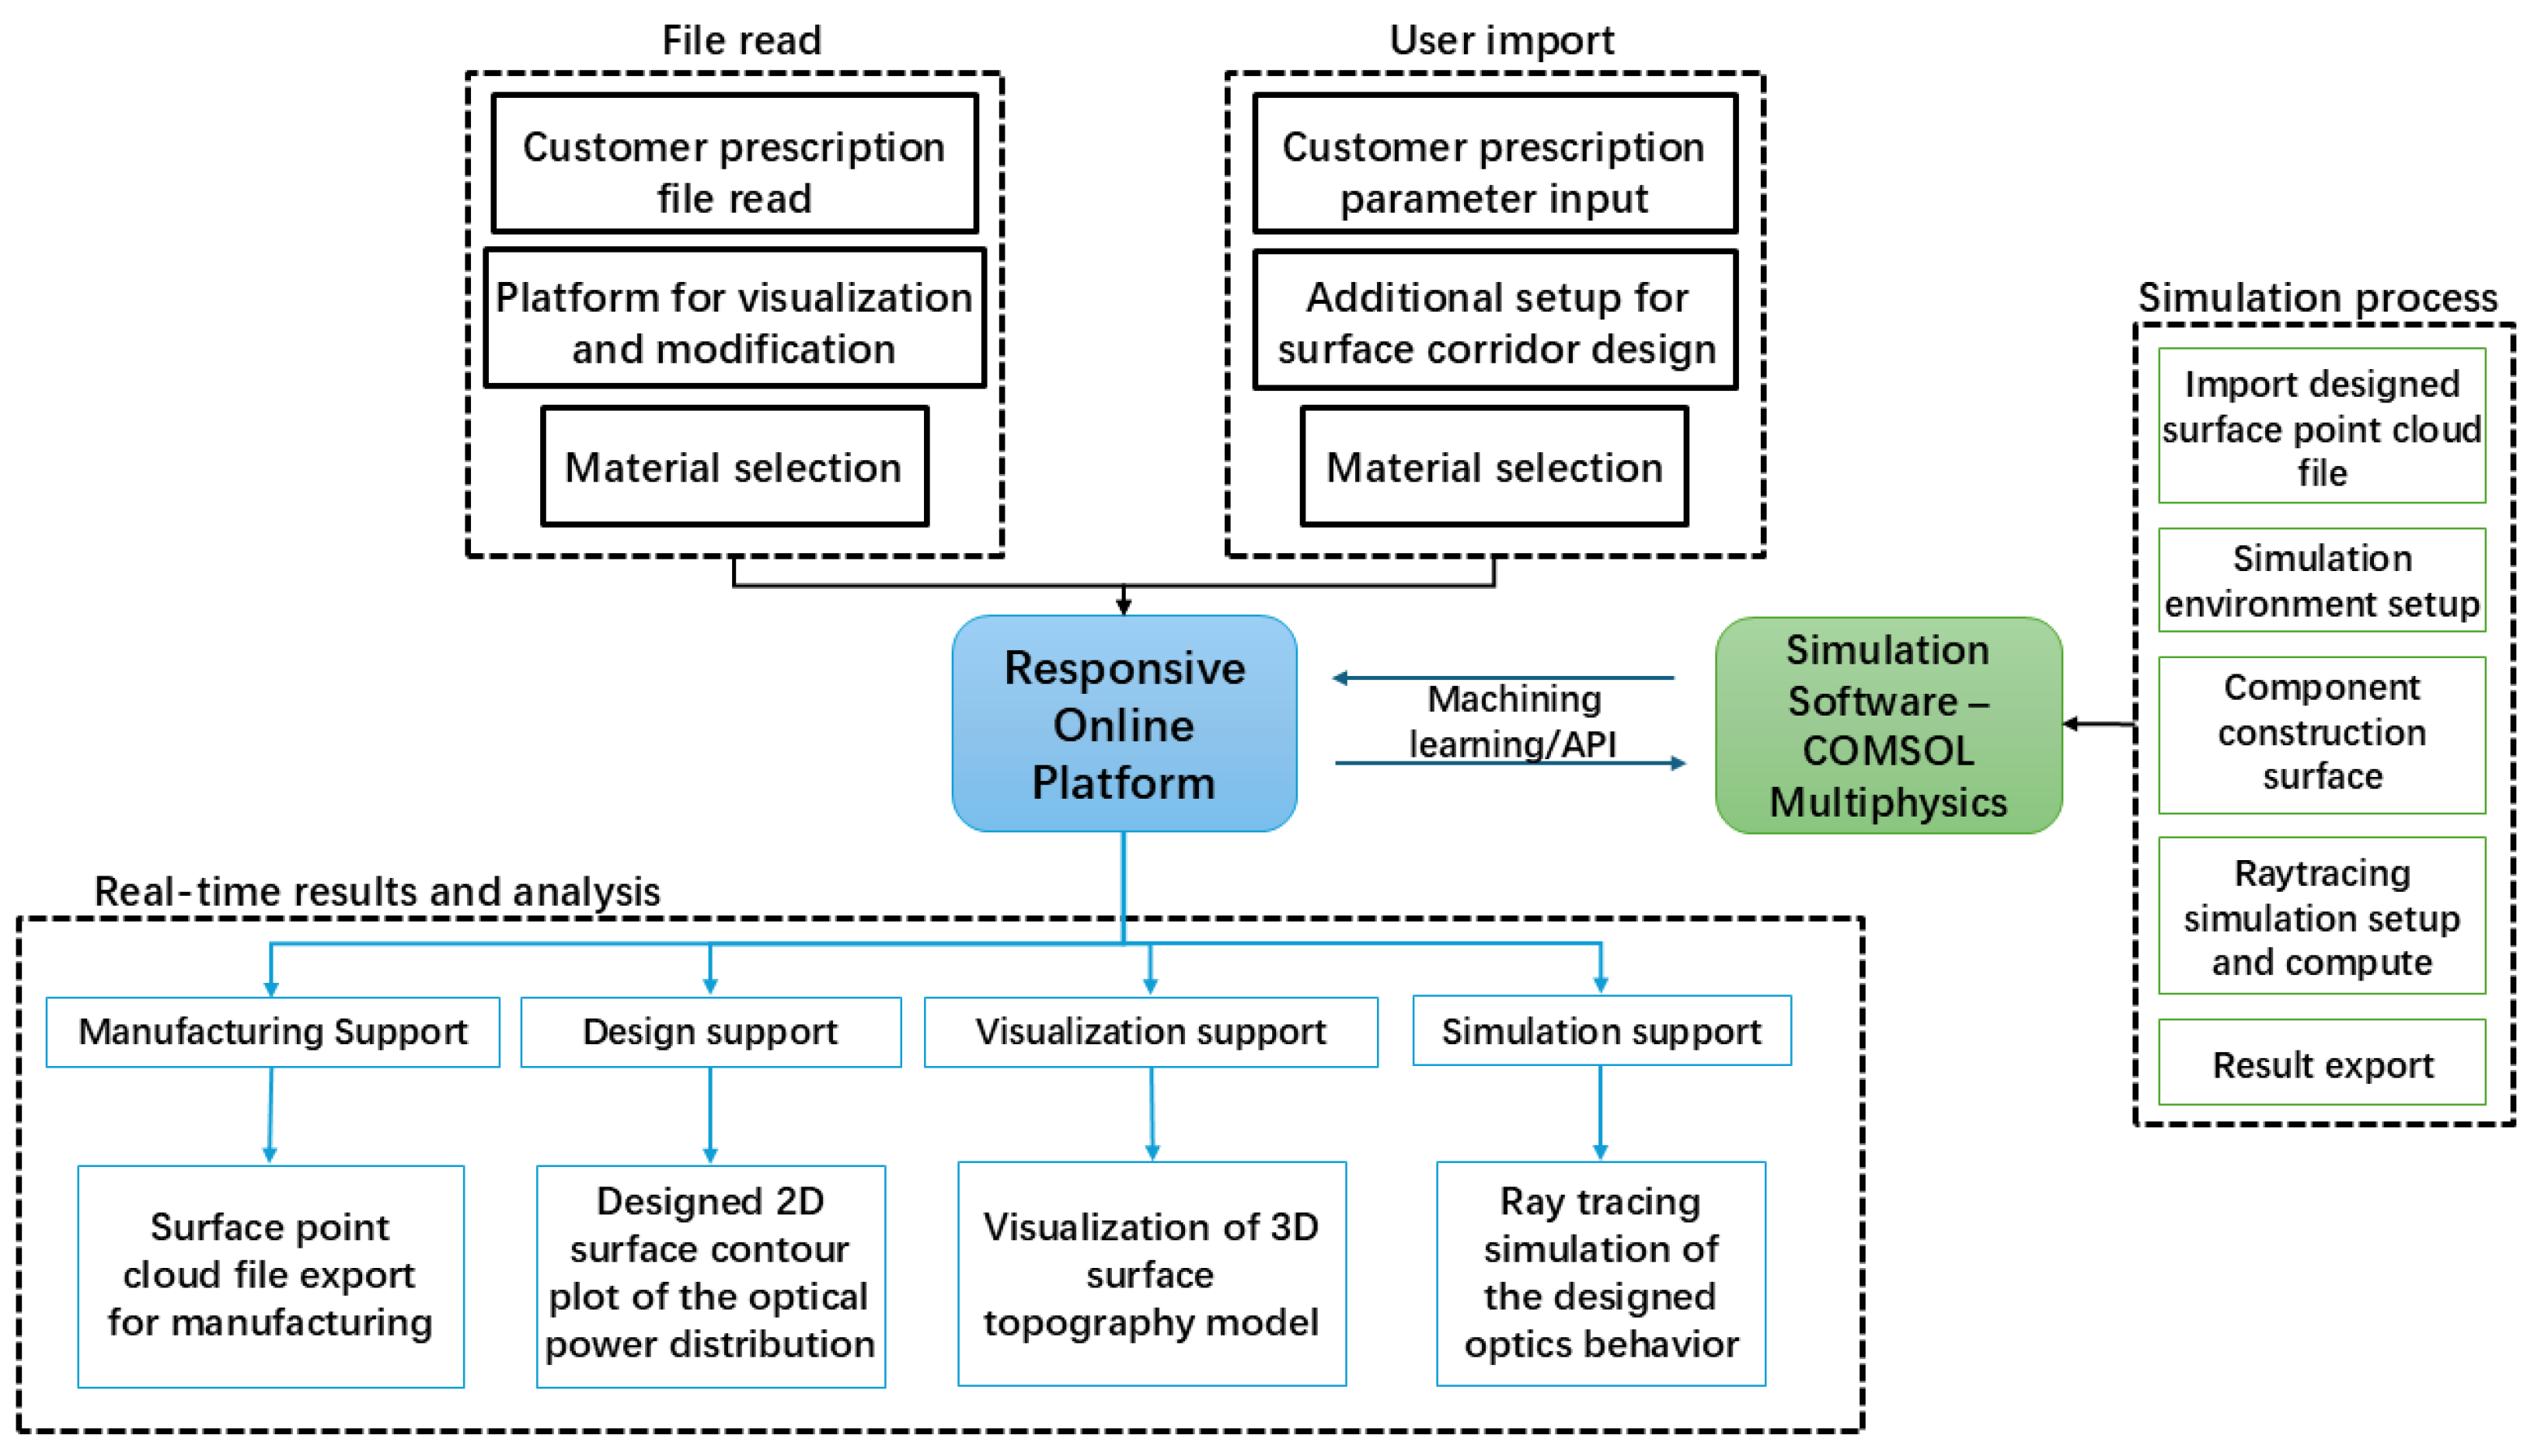
The responsive online platform primarily consists of three key functional modules, as illustrated in Figure 1: the prescription data import module, the simulation support module, and the embedded results and analysis module. In the varifocal lens design module, the varifocal lens freeform surface is designed according to the customer’s personal prescription. Modeling and a series of assessments are conducted to ensure the designed freeform surface meets the lens quality requirements. The initial function of the online platform is to import data. Once all optical parameters have been correctly uploaded, the platform provides a visualized result of the designed surface and generates the calculated point cloud file in real time, supported by the results and analysis module and the simulation support module. The following subsections will describe these three modules in detail.
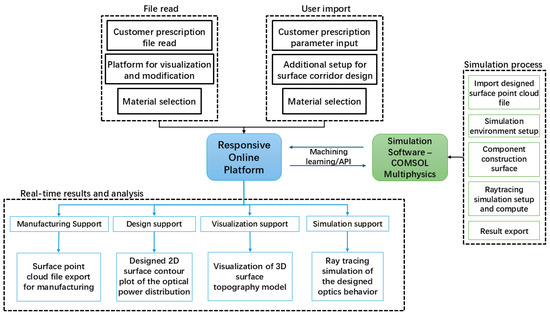
Figure 1.
Manufacturing system of freeform surfaced optics and the built-in information processing activities.
3. Freeform Surfaced Lens: Prescription Data Input, Modelling and Analysis, and Material Specification and Selection
3.1. Surface Data Import
The e-portal system acts as a kernel of the manufacturing system, which can facilitate the customer’s customized requirement either in prescriptions or prescript data, undertake the modeling and design of the personalized freeform surfaces, design and manufacturing of the freeform surfaced lens, and virtual assessment of the lens quality via ray tracing, and help track and trace the lens design and manufacturing processes for customers. To some extent, the e-portal reflects an advanced level of e-manufacturing for the seamless integration of the lens design, manufacturing, and services [23,24]. Its essentials are to provide the interactive dynamics and the improved accuracy and productivity of the lens design and manufacturing by digitalization and data automation.
As illustrated in Table 1, the key optical and geometric parameters involved in the optical surface design have been listed. The optical parameters define the curvature radius of each lens zone, while the geometric parameters determine the positions of the near-vision and far-view zones, as well as the shape of the progressive corridor of the lens. In the industrial optics process, the geometric parameters are typically decided by the designer or manufacturer based on considerations of manufacturing and lens blank model selection. The optical parameters are provided by the customer according to their optometry results.

Table 1.
The optical and geometric parameters for a varifocal lens.
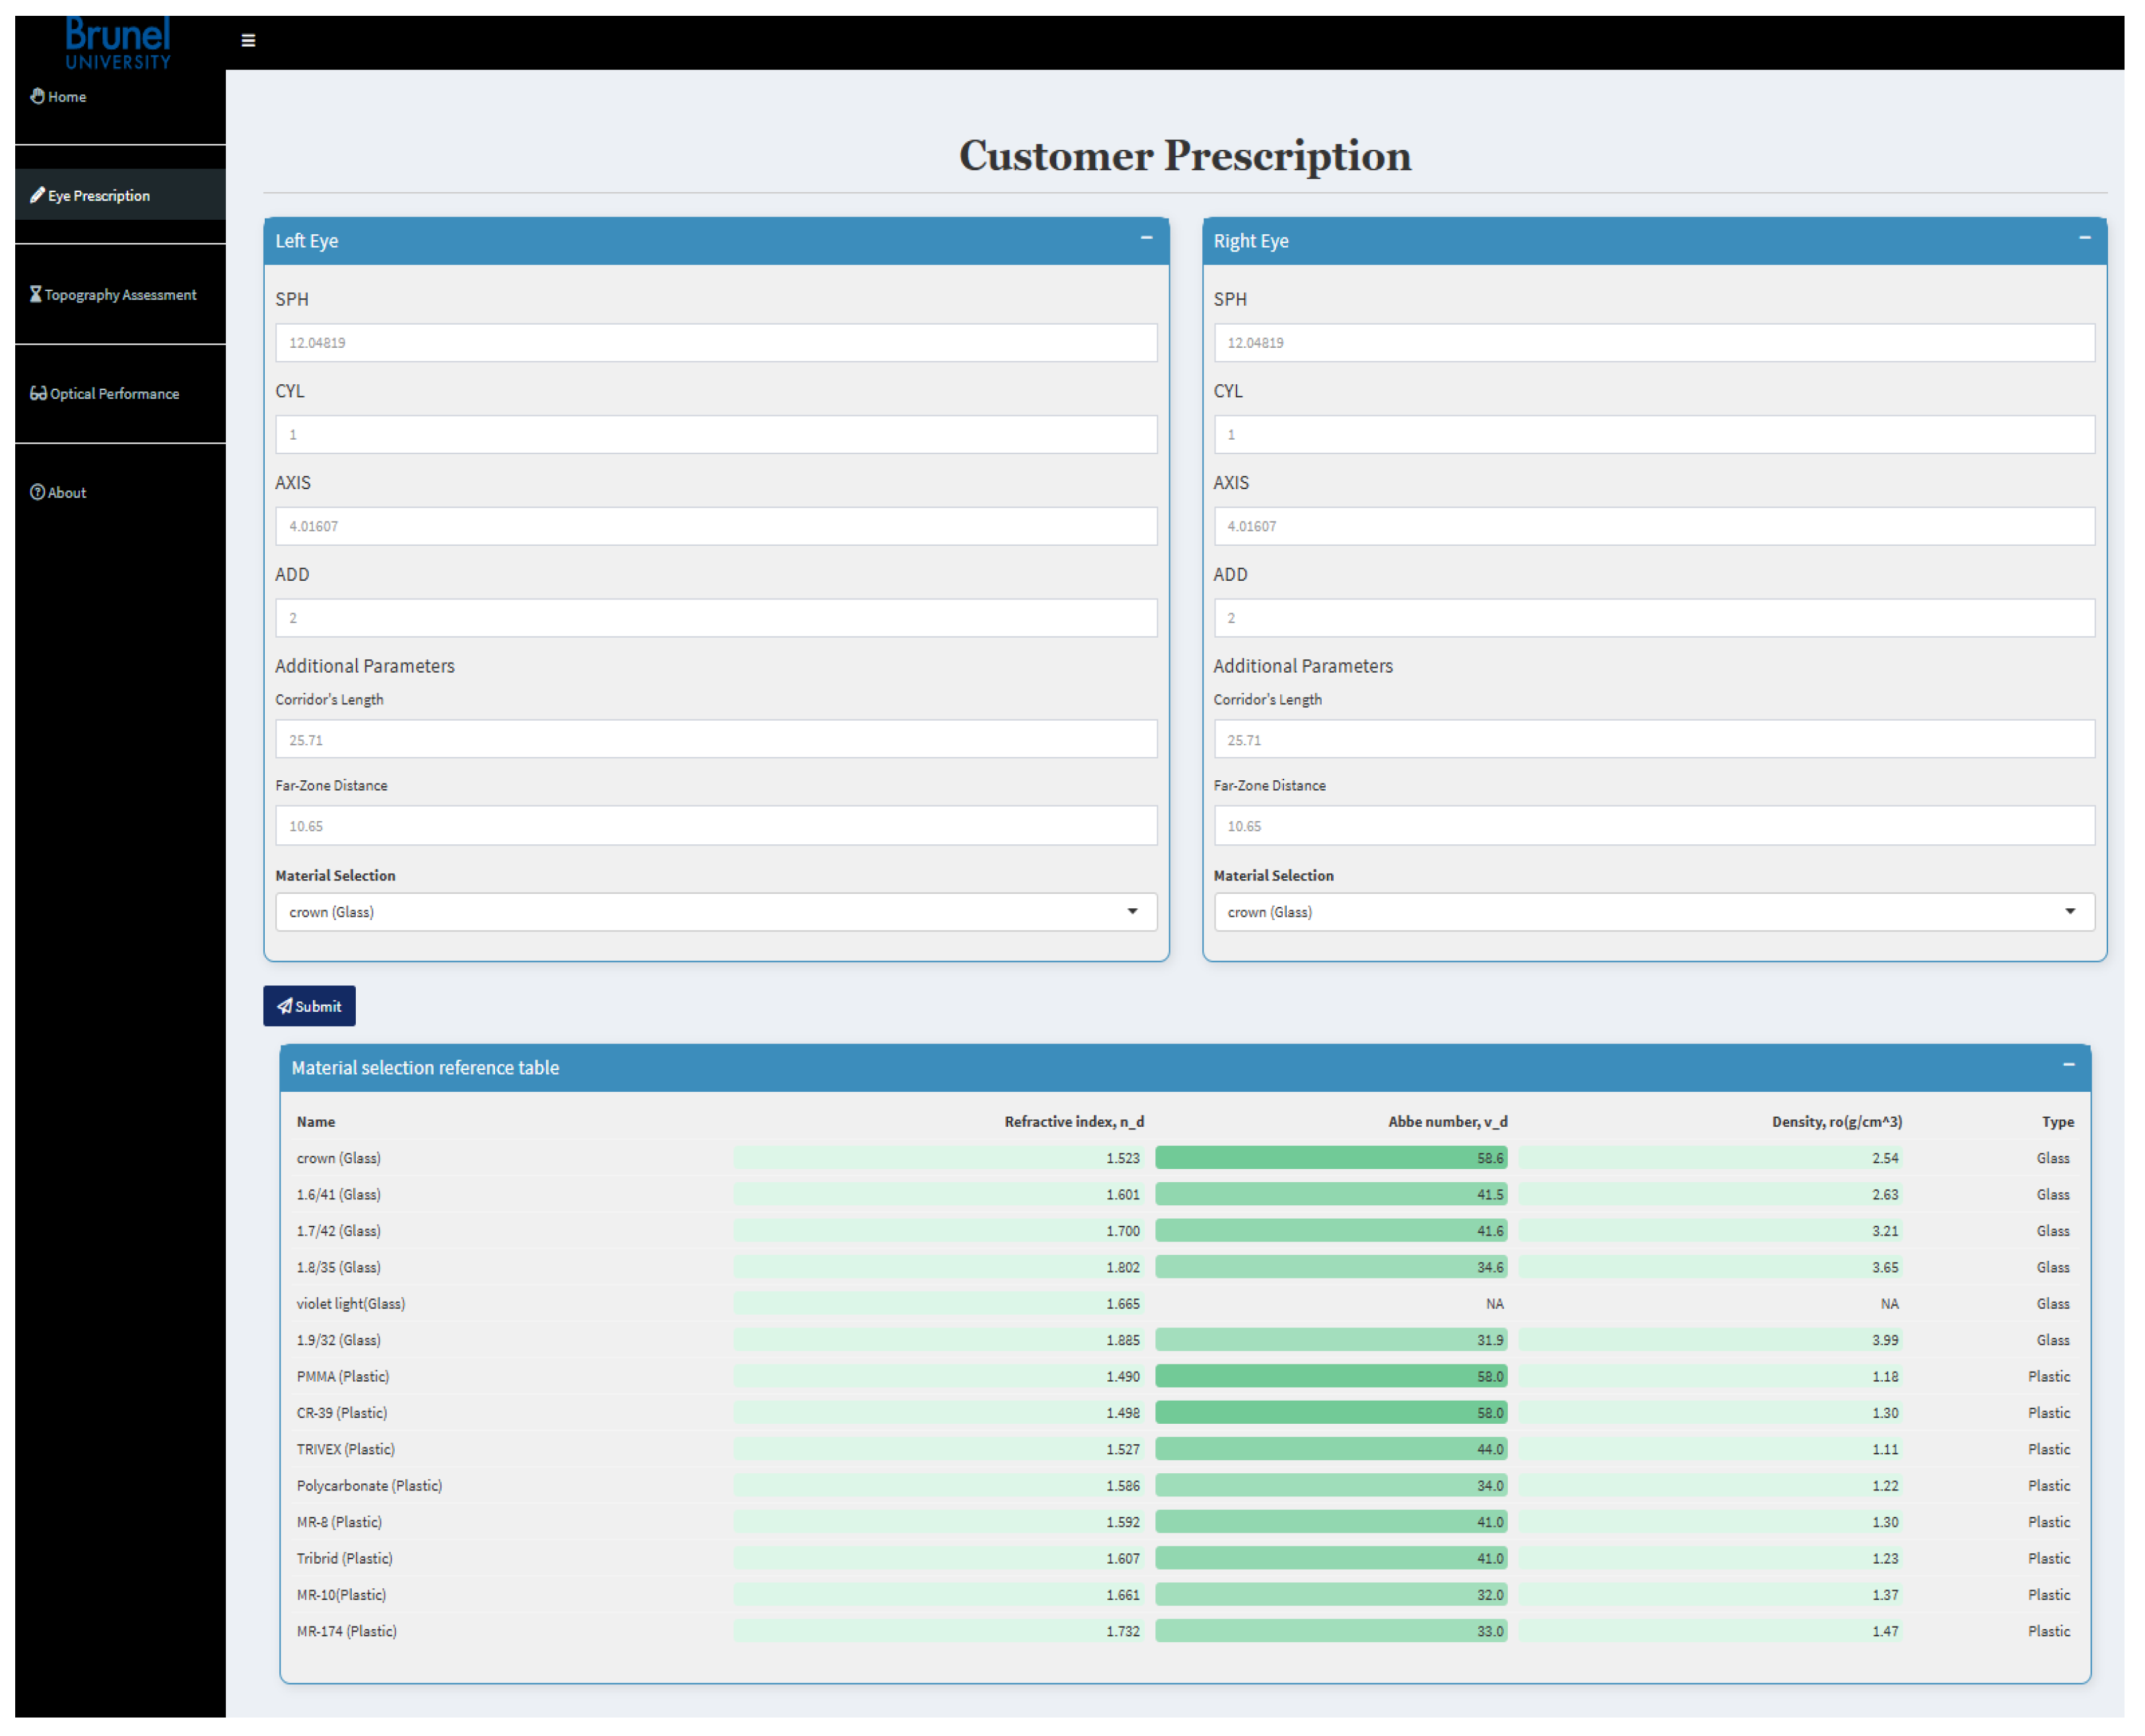
On the online platform, customers have two options for uploading their prescriptions. In order for manufacturers to handle a large number of prescriptions, the platform provides a file upload function that allows them to upload customer prescriptions in an Excel table format. The platform also presents initial data statistics, enabling the uploader to review and modify their data if necessary. Additionally, the platform allows customers to manually input both the geometric and optical parameters of their prescriptions, as illustrated in Figure 2.
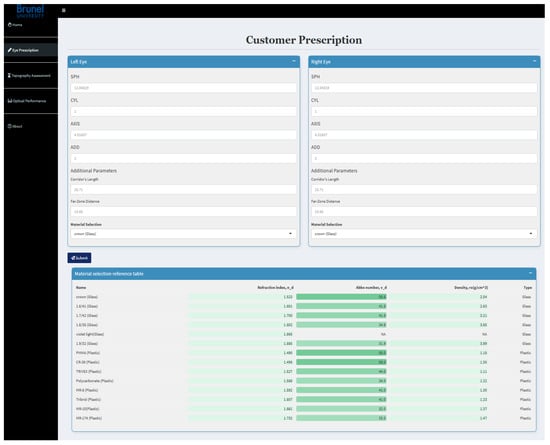
Figure 2.
Prescription import page of the e-portal, enabling customers to responsively input their respective vision prescription and specification of their optics materials.
3.2. Lens Material Specification and Selection
Material specification and selection play a crucial role in optical surface design. They not only affect the resulting surface power, refractive index, and radius distribution, but also influence the thickness—center thickness (CT) and edge thickness (ET)—of the lens product. Based on formula (1), the CT and ET of a lens based on its power (D), refractive index (n), and diameter (d) can be calculated.
One of the primary properties of materials used in ophthalmic design is the refractive index (n), defined as the ratio between the speed of light in a vacuum and the speed of light in the material for a given wavelength. This value is always greater than 1, as light travels faster in a vacuum than in any material. The refractive index is directly related to the curvature and thickness of the lens [25]. In ophthalmic optics, the refractive index plays a crucial role because it connects the optical properties of a lens—namely, refractive and prismatic power—with the lens geometry, particularly curvature and thickness.
Equation (2) represents the example of this relation, which links the power of a thin lens P with the radii of curvature and of the two lens surfaces through the refractive index n. By combining these geometric factors into a single parameter K, it becomes evident that the same lens power can be achieved with different combinations of materials and curvatures. Refractive indices for glass materials range from 1.5 to 2, while those for plastics vary from 1.498 to 1.74 for high-index polymers [25]. Table 2 summarizes the properties of the most common materials in the ophthalmic industry. The platform includes dozens of widely used optical materials, compiled in Table 2, which provides a reference of essential parameters for each material, allowing users to select the appropriate options during data import.
Table 2.
Summary of the main specifications of a selection of ophthalmic materials [7].
3.3. Computational Modeling and Analysis
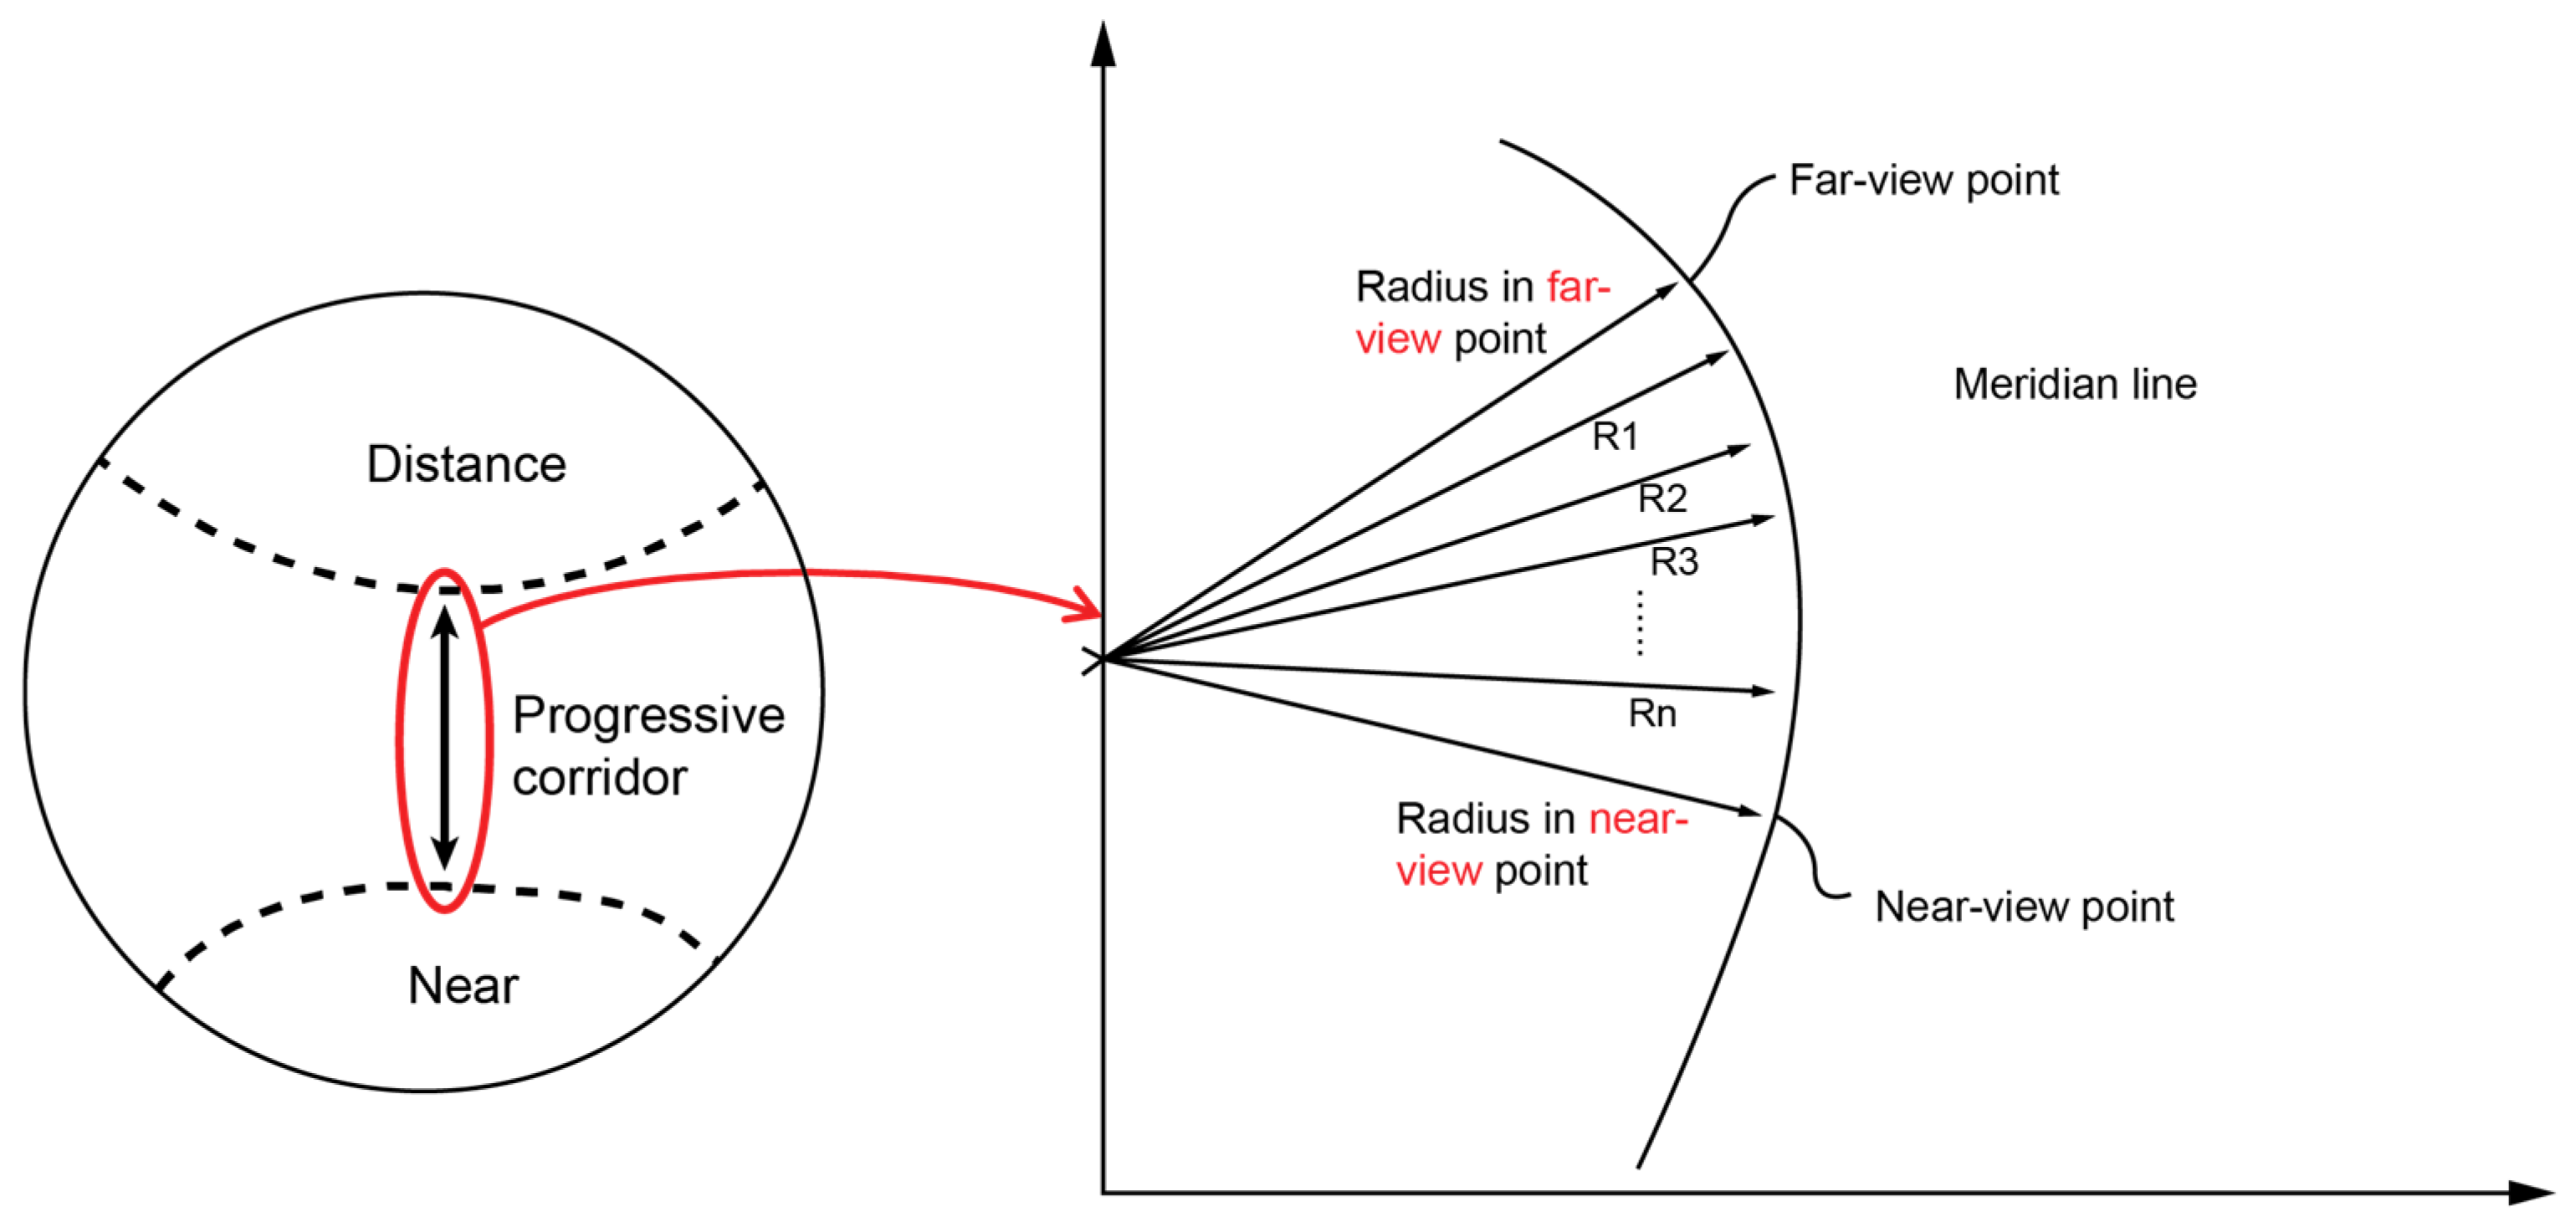
The characteristic of a varifocal lens is that its optical power progressively changes from the top zone to the bottom zone of the lens, with its surface features no axis of rotational invariance. Therefore, the varifocal lens surface could be identified as a freeform surface [26]. As shown in Figure 3, the upper part of the lens always is recognized as the distant-vision zone and the bottom part as the near-vision zone, with both parts having relatively constant powers. The progressive corridor contains the optic power which varies between the distant-vision zone and near-vision zone [27].

Figure 3.
The process of parameter management in the design process of the case study varifocal lens.
The computational modeling and analysis for lens surface generation are implemented once the customer submits their prescription. The algorithm behind the platform includes the necessary computations to generate the lens surface and produce the intended outputs. Specifically, the portal uses Winthrop’s [5] model functions to create the PAL freeform surface of the varifocal lens. The lens surface is defined by an eighth-order polynomial power law, as expressed in function (4) and further detailed in function (5).
where constant coefficients are shown below:
It should be mentioned that rD is considered as the distant power, whereas rR is the near power for the lens and is related to the refractive index, SPH, and ADD values, as shown in Equations (6) and (7).
The function essentially gives each point on the surface where its level curve crosses the x-axis. After detailed mathematical calculations and analysis of this relationship using the Winthrop method [5] were performed by Wei et al. in 2020 [7], Equations (8)–(10) are considered to calculate as follows:
The varifocal lens’s progressive surface, denoted as f(x,y), is defined by a specific set of mathematical equations. These equations determine the precise shape and properties of the surface, which are given as functions (11) to (14) [10]. Various designs of the surface are generated by different mathematical functions that define the meridional power law, represented as r(u). By changing this function, different embodiments of the surface can be created [1,6,10].
After defining the bipolar progressive surface z (x, y) through a list of mathematical equation codes written in R-Script language, the next step involves featuring the given results throughout the Shiny online portal to the user in the form of plots and diagrams.
4. Ray Tracing Simulation Assisted by Multiphysics Modelling and Analysis
Varifocal lenses, commonly marketed as ‘All-Purpose’ solutions, aim to provide a balanced visual experience for both distance and near vision. While this approach may seem convenient, it inherently limits the diversity and customization of viewing zones available to users. In contrast, progressive lenses produced using freeform surfacing technology offer greater adaptability, allowing for more personalized lens configurations. However, selecting lenses based solely on the customization of viewing zones also has its limitations. This method often depends on access to detailed evaluations of each lens’s optical performance, which may not be consistently available or straightforward to obtain. The lack of comprehensive and easily accessible performance data can hinder both eye care professionals and consumers from making fully informed decisions. As a result, identifying the optimal lens design for individual visual requirements becomes a challenging process, particularly when aiming for a truly tailored visual solution.
The advent of freeform technology in lens manufacturing has revolutionized the field by enabling the creation of customized progressive lenses tailored to specific visual requirements. This technology allows for more flexibility in designing viewing zones, offering a more personalized and effective vision solution than traditional varifocal lenses, which are limited in their configuration options. As a result, freeform technology has the potential to address the diverse visual needs and preferences of individuals more precisely. To validate the performance of these designed lenses, it is essential to conduct a thorough analysis. In this regard, the ray tracing method, facilitated by COMSOL Multiphysics modeling and analysis, was employed to assess the optical behavior of the previously designed lens surface through the Shiny portal.
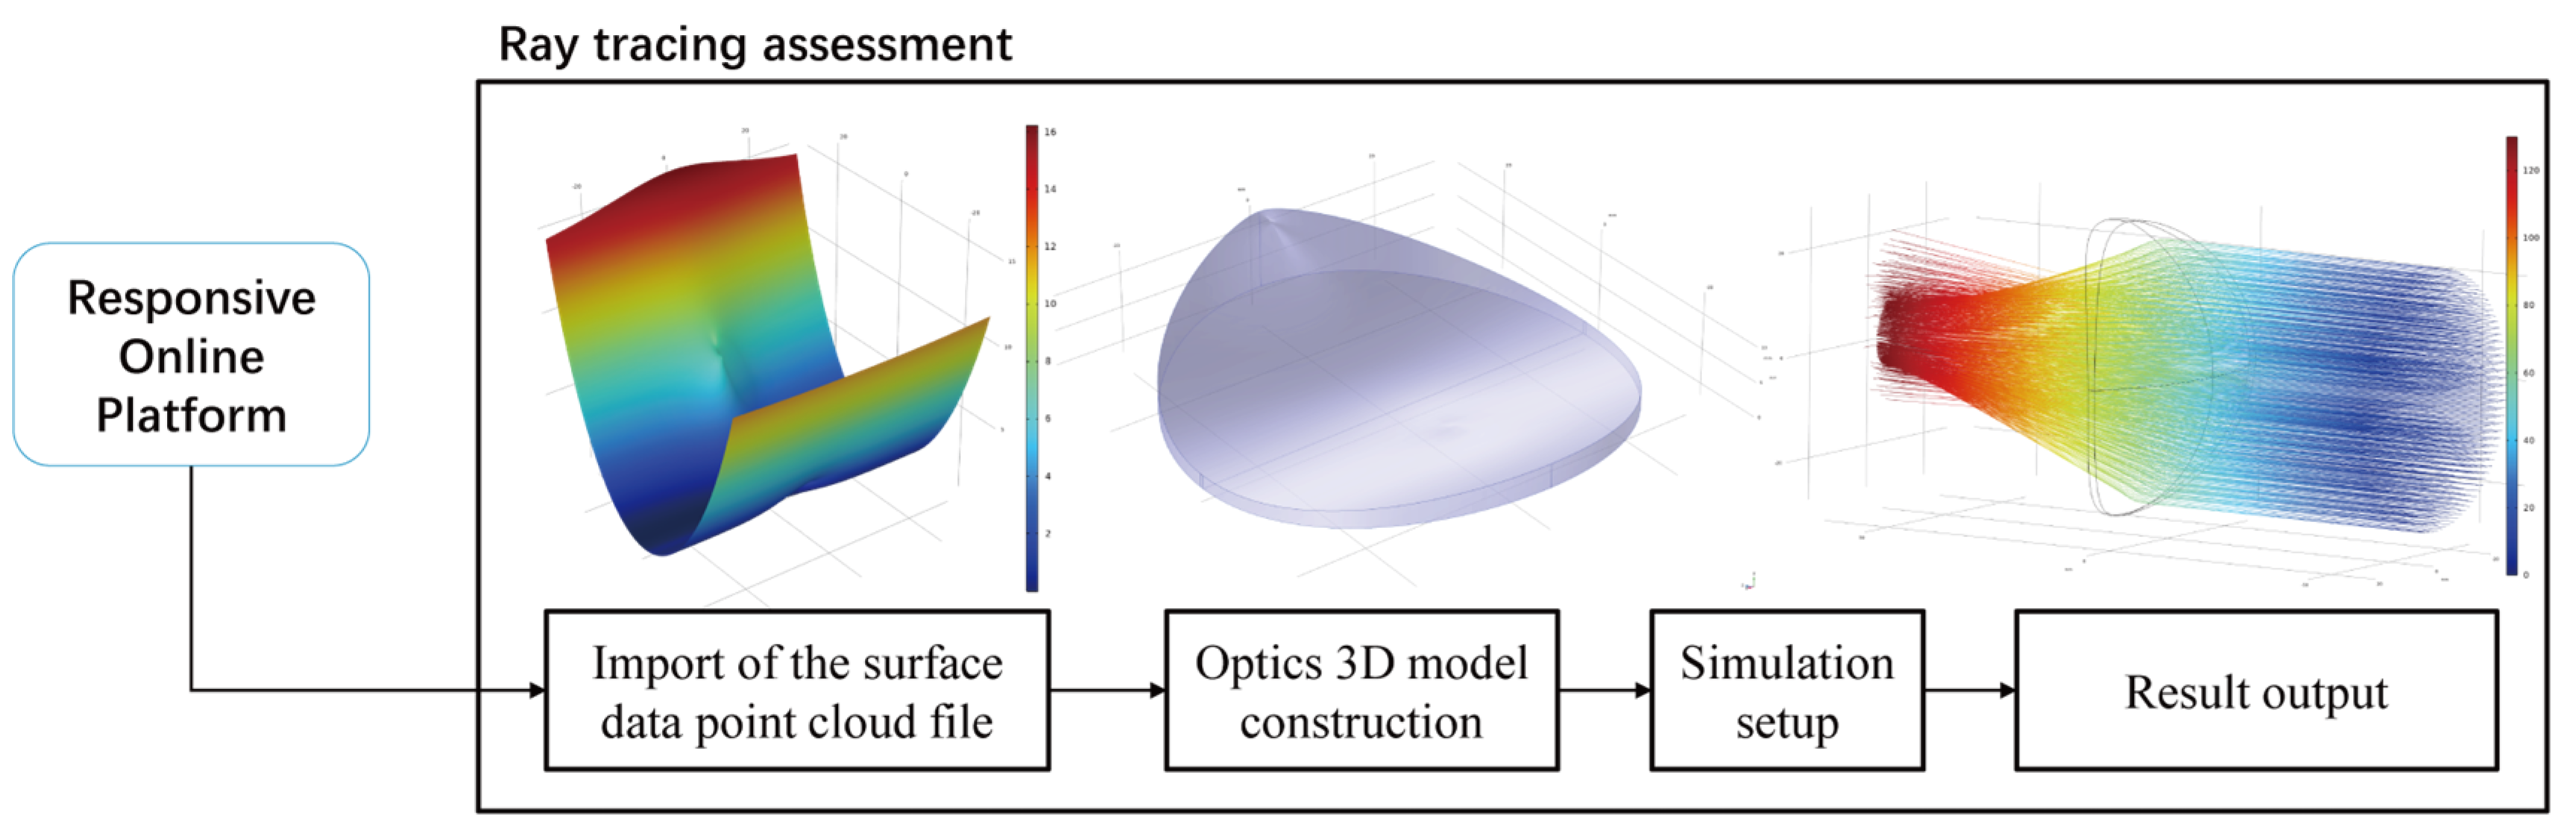
The ray tracing simulation was developed using COMSOL Multiphysics 6.0, following a structured workflow illustrated in Figure 4. The simulation process consists of four main steps. The first step involves importing the designed lens surface into the simulation environment. This is achieved by uploading the surface data point cloud, which provides the foundation for reconstructing the lens’s geometry. Once the surface data are imported, the second step focuses on building a 3D model of the desired lens. This model should accurately represent the lens’s physical characteristics, including its shape, material properties, and thickness, ensuring that it reflects the real-world behavior of the lens.
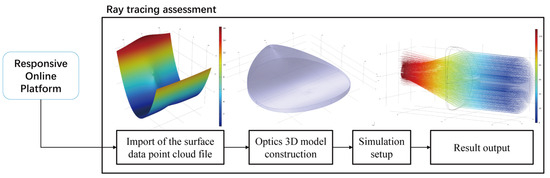
Figure 4.
Process of ray tracing simulation setup and result output with COMSOL Multiphysics.
After the 3D model is successfully constructed, the third step involves configuring the simulation environment. This includes defining the positions for ray generation and specifying the termination areas where the rays will be captured. These parameters are critical for simulating realistic optical conditions and obtaining meaningful results. The final step is the execution of the ray tracing simulation itself. Once the simulation environment is set up, the rays are traced through the lens, providing insights into the lens’s optical performance, including focal points, aberrations, and light distribution patterns.
The result output from the simulation helps in validating the designed lens’s optical quality, offering a detailed understanding of how the lens performs in practice. This approach provides valuable data that can inform further refinement of the lens design and contribute to the development of more advanced and personalized optical solutions.
4.1. Import of the Surface Data Point Cloud File
The surface data point cloud file is generated by the web-based portal based on the customer’s prescription. Multiple formats for data input can be selected, including file uploads, local tables, or Excel files. For ease of data collection and manipulation, the data have been standardized in Excel format. Once the data points are imported into the simulation model, the software utilizes this information to create a mesh for the point cloud. This mesh serves as the foundation for subsequent steps in the simulation process, including 3D model construction and ray tracing analysis. The accuracy of the point cloud data is critical for ensuring the precision of the lens model and, ultimately, the reliability of the ray tracing simulation results.
The algorithm behind the data imported into the simulation model uses a linear interpolation method to generate the defined surface based on the point cloud, with the aim of minimizing precision loss during the conversion process. Linear interpolation helps the model evaluate the behavior of the function both between the discrete points defined by the table or file, and in areas outside the domain covered by the provided data. The linear interpolation method employs linear polynomials to estimate the function values between the known data points, ensuring a smooth transition across the surface. This approach is particularly effective when dealing with data point clouds, as it allows for accurate surface modeling while maintaining computational efficiency. By minimizing potential precision loss, the interpolation method ensures that the reconstructed surface closely aligns with the original design parameters.
4.2. Simulation Setup
After the surface data points have been imported and the defined freeform optics surface has been successfully generated, the next step is to configure the simulation parameters. Table 3 lists all the parameters used in the simulation model, including their expressions, descriptions, and the current values applied. These parameters are crucial for accurately defining the optical characteristics of the model, ensuring that the simulation reflects the intended performance of the freeform surface. The careful selection and application of these parameters allow for a precise simulation environment, ultimately leading to more reliable and meaningful results.
Table 3.
Expression of each parameter that is calculated for the simulation setup.
The parameters listed in Table 3 summarize the key parameters used in the simulation model. Each parameter is carefully selected to reflect realistic conditions and ensure that the model accurately represents the intended lens design. Some critical parameters in the table that highly influence the practical optical performance of the optics are organized below:
- Center thickness (CT) and edge thickness (ET) define the lens geometry, directly affecting light propagation and optical performance;
- Diopter (D) determines the lens’s refractive power, influencing its ability to focus light and correct vision;
- Lens radius (h) impacts the curvature of the lens surface, affecting the field of view and power distribution;
- Wavelength (λ), set at 550 nm, represents standard visible light, allowing for typical optical performance assessments.
Together, these parameters ensure that the ray tracing simulation can accurately replicate real-world lens behavior. By optimizing these values, the model is capable of providing a detailed analysis of the lens’s optical performance, including its focal length, aberrations, and image clarity.
Figure 5 illustrates the setup principle of the ray tracing simulation based on ISO 8980-1 standards [28] for ophthalmic optics. This standard outlines a physical inspection system for quality testing of machined varifocal optics, serving as a reference for conducting digital optics inspections. Object 1 is a light source set to a brightness exceeding 400 lumens, while Object 2 is a diaphragm, which controls the direction and position of light from the source to the subject optics (Object 3). Object 5 represents a matte black background on which the inspection results are observed. Following this principle, our ray tracing inspection setup was implemented in a virtual environment, with the position and direction of the light source defined accordingly, without the need for a matte background cover.
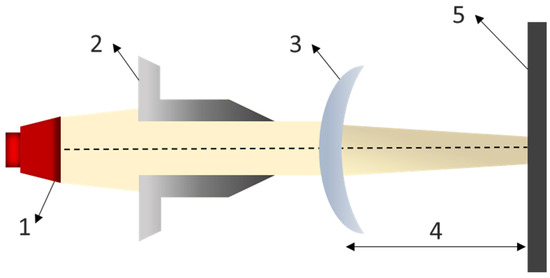
Figure 5.
Recommended system for visually inspecting a lens for defects: (1) light source; (2) light beam diaphragm; (3) designed freeform surface optics; (4) back focus length of the optics; and (5) black background for imaging.
4.3. Three-Dimensional Optics Model Construction and Its Material Selection
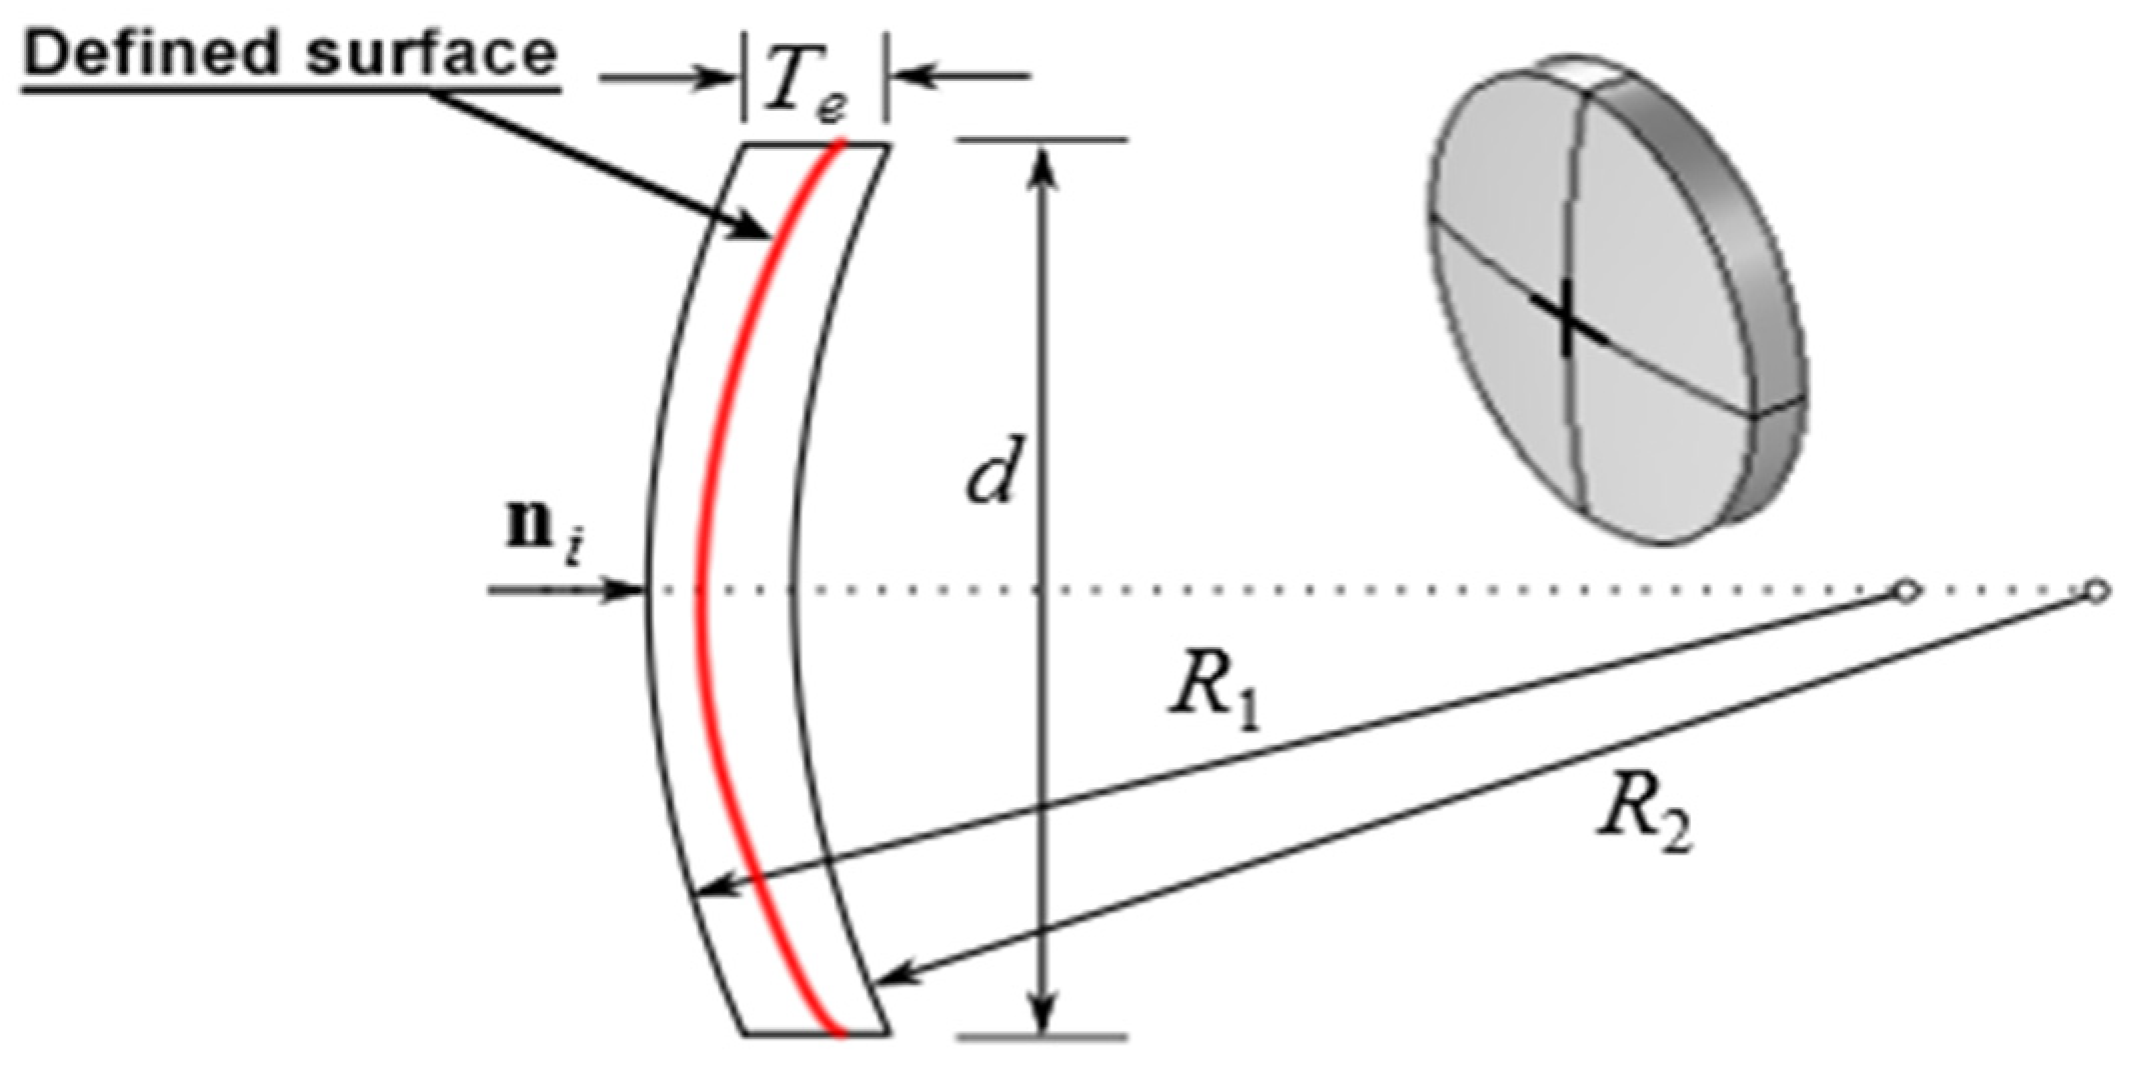
Once the simulation setup was complete, a 3D optics model was constructed based on imported surface data. This model includes all the essential elements of a well-machined optical lens. As shown in Figure 6, a spherical meniscus lens model was created, where d represents the lens diameter, R1 is the radius of the convex surface, and R2 is the radius of the concave surface. The red line between the convex and concave surfaces indicates the designed surface, with the distance between each point on the defined surface and its corresponding point on the convex surface representing the lens thickness.

Figure 6.
Spherical lens with a convex face and a defined surface combined as the concave face.
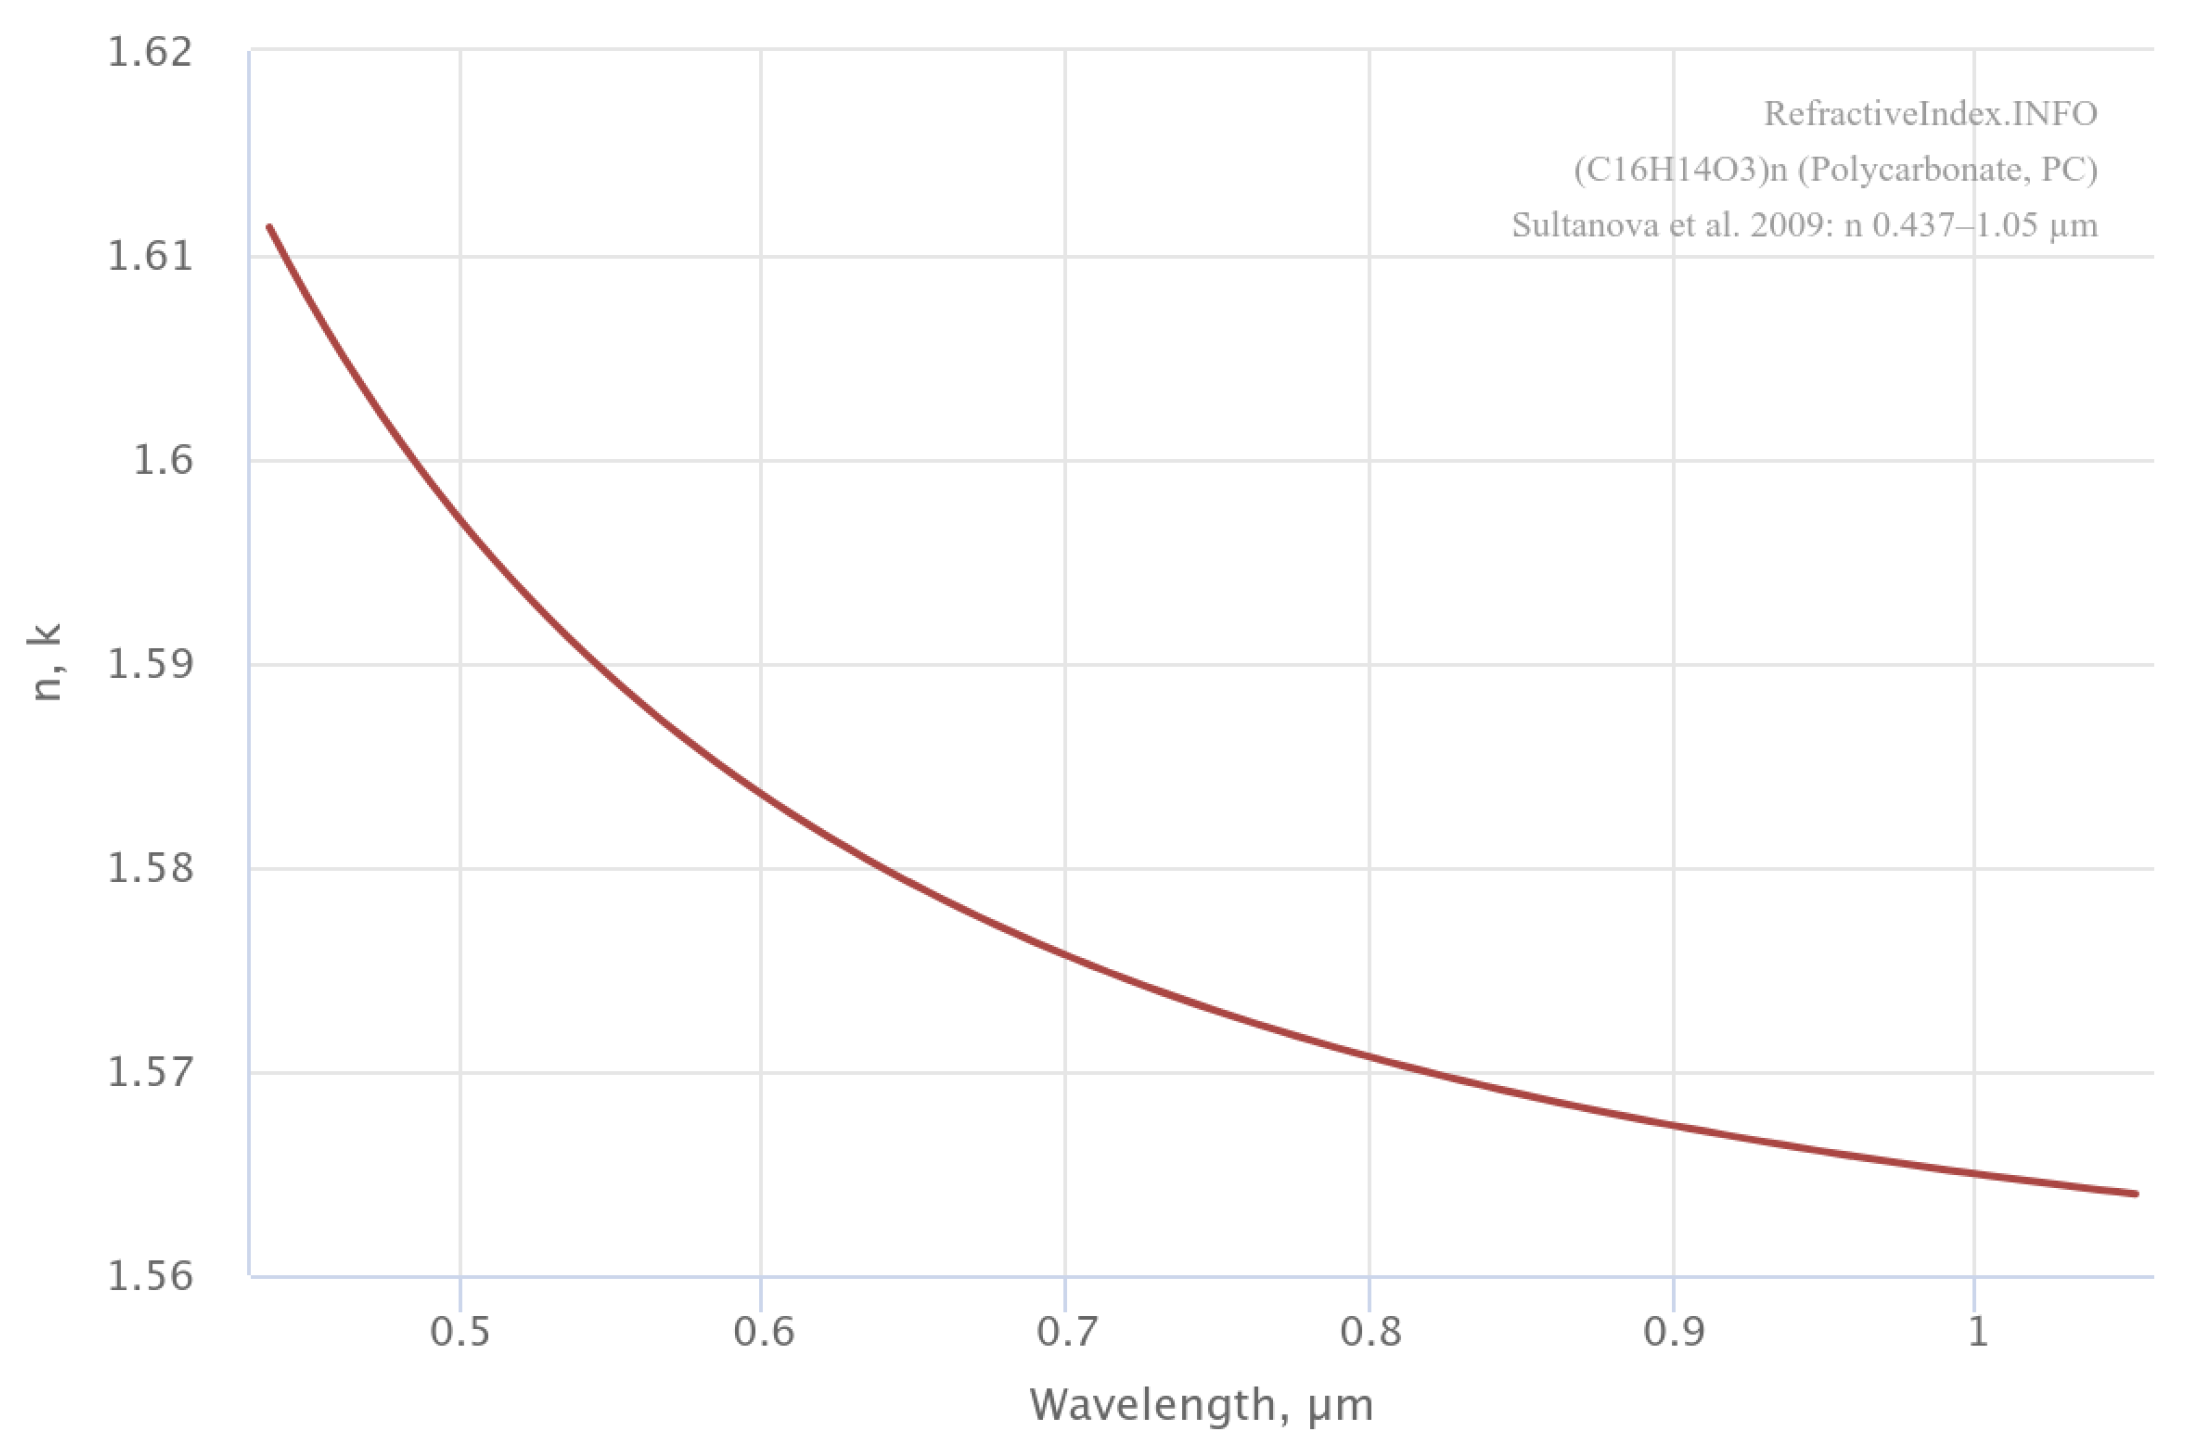
Material selection is a crucial step in the simulation process, following the construction of the 3D optics model. As discussed earlier, the refractive index is the primary property that differentiates various materials used in optics, significantly affecting the distribution of the designed surface and the resulting lens thickness. Figure 7 shows the refractive index plot of an optical material commonly used in progressive additional lenses—polycarbonate . The x-axis represents the wavelength of light interacting with the material, while the y-axis indicates the corresponding refractive index value. This material is widely selected by the optical industry due to its favorable properties for lens manufacturing.
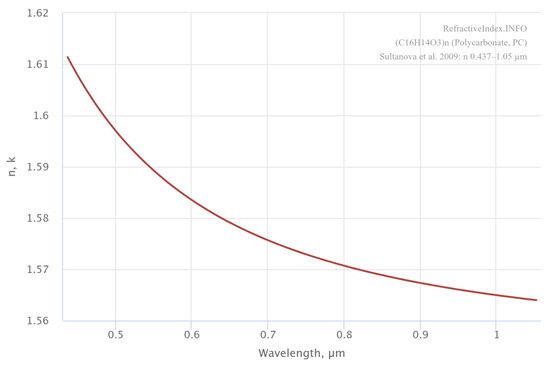
Figure 7.
Refractive index of (polycarbonate, PC) [29].
4.4. API Connection
To conduct the simulation through the portal, it was necessary to connect the platform to the simulation software. This was accomplished using the COMSOL API. The COMSOL Multiphysics 6.0 API is a software interface that includes all the algorithms and data structures needed to define and manipulate COMSOL models. Every time a model is created in COMSOL Desktop®, it is essentially interacting with the COMSOL API in the background. This connection allows for seamless integration between the simulation platform and the software, enabling the automatic transfer and execution of complex models.
5. Experiment Setup and Key Parameters
A typical case study of freeform surface varifocal optics constructed according to the above principles in accordance with this paper’s approach, and suitable for general use, will be presented in this subsection. The following case study demonstrates how the web-based platform could be applied to a varifocal lens prescription from a lens manufacture company, as the highly responsive portal for freeform surface evaluation either shows up the surface topography result or its optical performance. The case can be directly loaded into the web-based platform by visiting ‘https://liusha.shinyapps.io/3DPortal/’ (accessed on 17 August 2024), with the manual input of the provided prescription.
The experiments were performed on a UPL250 ultraprecision machine, renowned for its nano-level accuracy, high precision, and superior dynamic performance, which minimizes the dynamic effects of both the machine tool and cutting tool during machining. Given the high volume fraction of reinforced particles and their substantial abrasive properties, polycrystalline diamond tools have demonstrated superior performance compared to other tool types and are therefore widely used in SPDT machining. The experimental setup employed two polycrystalline diamond tools, each with a cutting edge radius of 0.35 mm and an included angle of 60 degrees.
To demonstrate the responsiveness of the web-based platform in evaluating the optical performance of the varifocal lens, in this section, we present several simulation results to demonstrate the functional performance of the designed surface. The computational domain has been set as Ω , containing the circular domain with the length unit mm according to the practice of varifocal lens manufacture.
The varifocal freeform optics surface defined by the power law of Equation (12) will now be evaluated for a lens with a reading addition of 2.00 diopter. The optical constants of the defined lens are assumed for a polycarbonate (PC) material with a refractive index of 1.5640. And the value of the vertical distance between the distance point to the reference point h is 37.71 mm and the distance between the distance point to the origin point O is 10.65 mm. For the customer’s optical prescription, Table 4 shows the customer optics parameter selection. The most vital parameters for optics design in this prescription has been highlighted in the table, sphere power (SPH), cylinder power (CYL), axis, and addition power (ADD).
Table 4.
Detailed prescription of the machined lens surface.
6. Results and Discussion
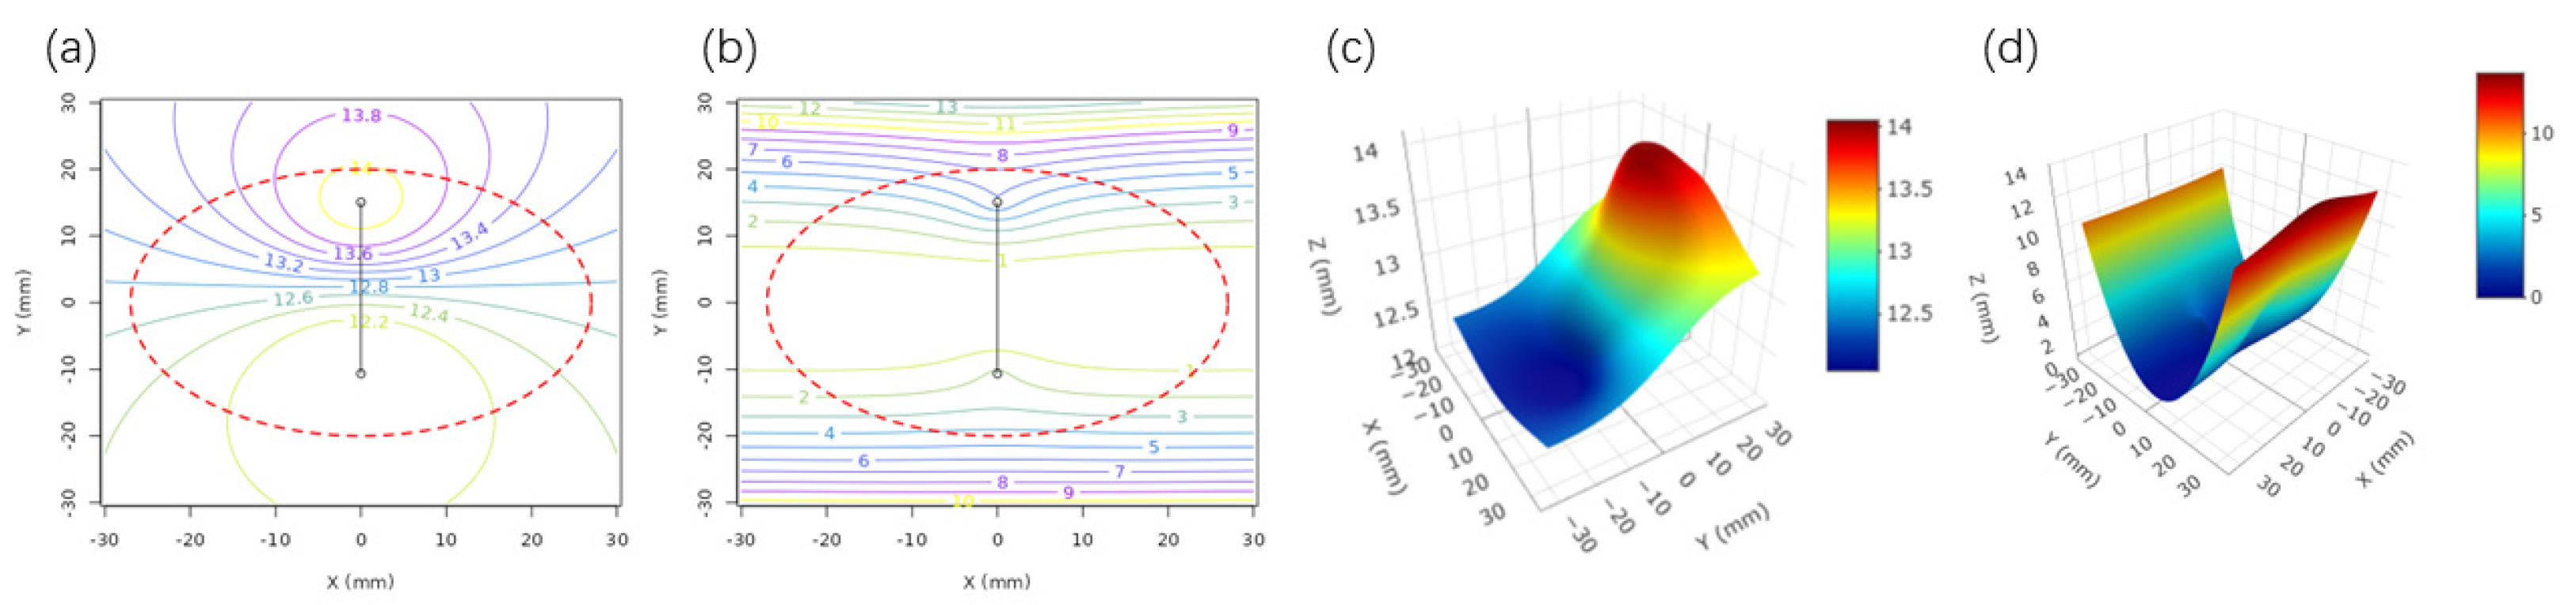
Figure 8 shows the results of a computer evaluation of the equations using the specified parameter values. Figure 8a presents the contours of the constant mean surface power distribution, while Figure 8b shows the contour of the Z point cloud distribution. Additionally, Figure 8c,d provides a 3D view of the distribution of surface mean power and Z point cloud values. Analyzing these figures reveals that the power and astigmatism characteristics of the lens are smooth and gradually varying, indicating a well-designed optical surface.
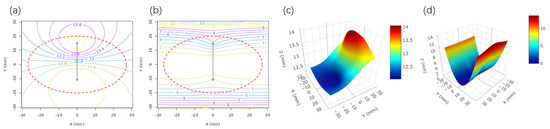
Figure 8.
The result plots from the portal evaluation using the provided parameter values: (a) contour plot of constant mean surface power, (b) contour plot of the calculated Z value distribution, (c) 3D visualization of the surface mean power distribution, and (d) 3D visualization of the calculated Z value point cloud distribution.
From Figure 8a, it can be observed that the resulting optical surface has an equivalent spherical power of 12.2 diopter in the near-vision area, closely matching the customer’s specified spherical power. The difference from the theoretical near-vision power of 12.04819 diopter is less than 0.08 diopter. In the upper part of Figure 8a, an elliptical region with an equivalent spherical power of 14 diopter corresponds to the far-vision zone. The mean optical power difference between the near and far vision areas is 1.8 d, which aligns with the provided additional parameter (ADD). Figure 8b shows the contour plot of the calculated Z value distribution, representing the resulting surface point cloud. This plot provides an intuitive visualization of the surface characteristics, allowing users to better understand the geometry of the optical surface.
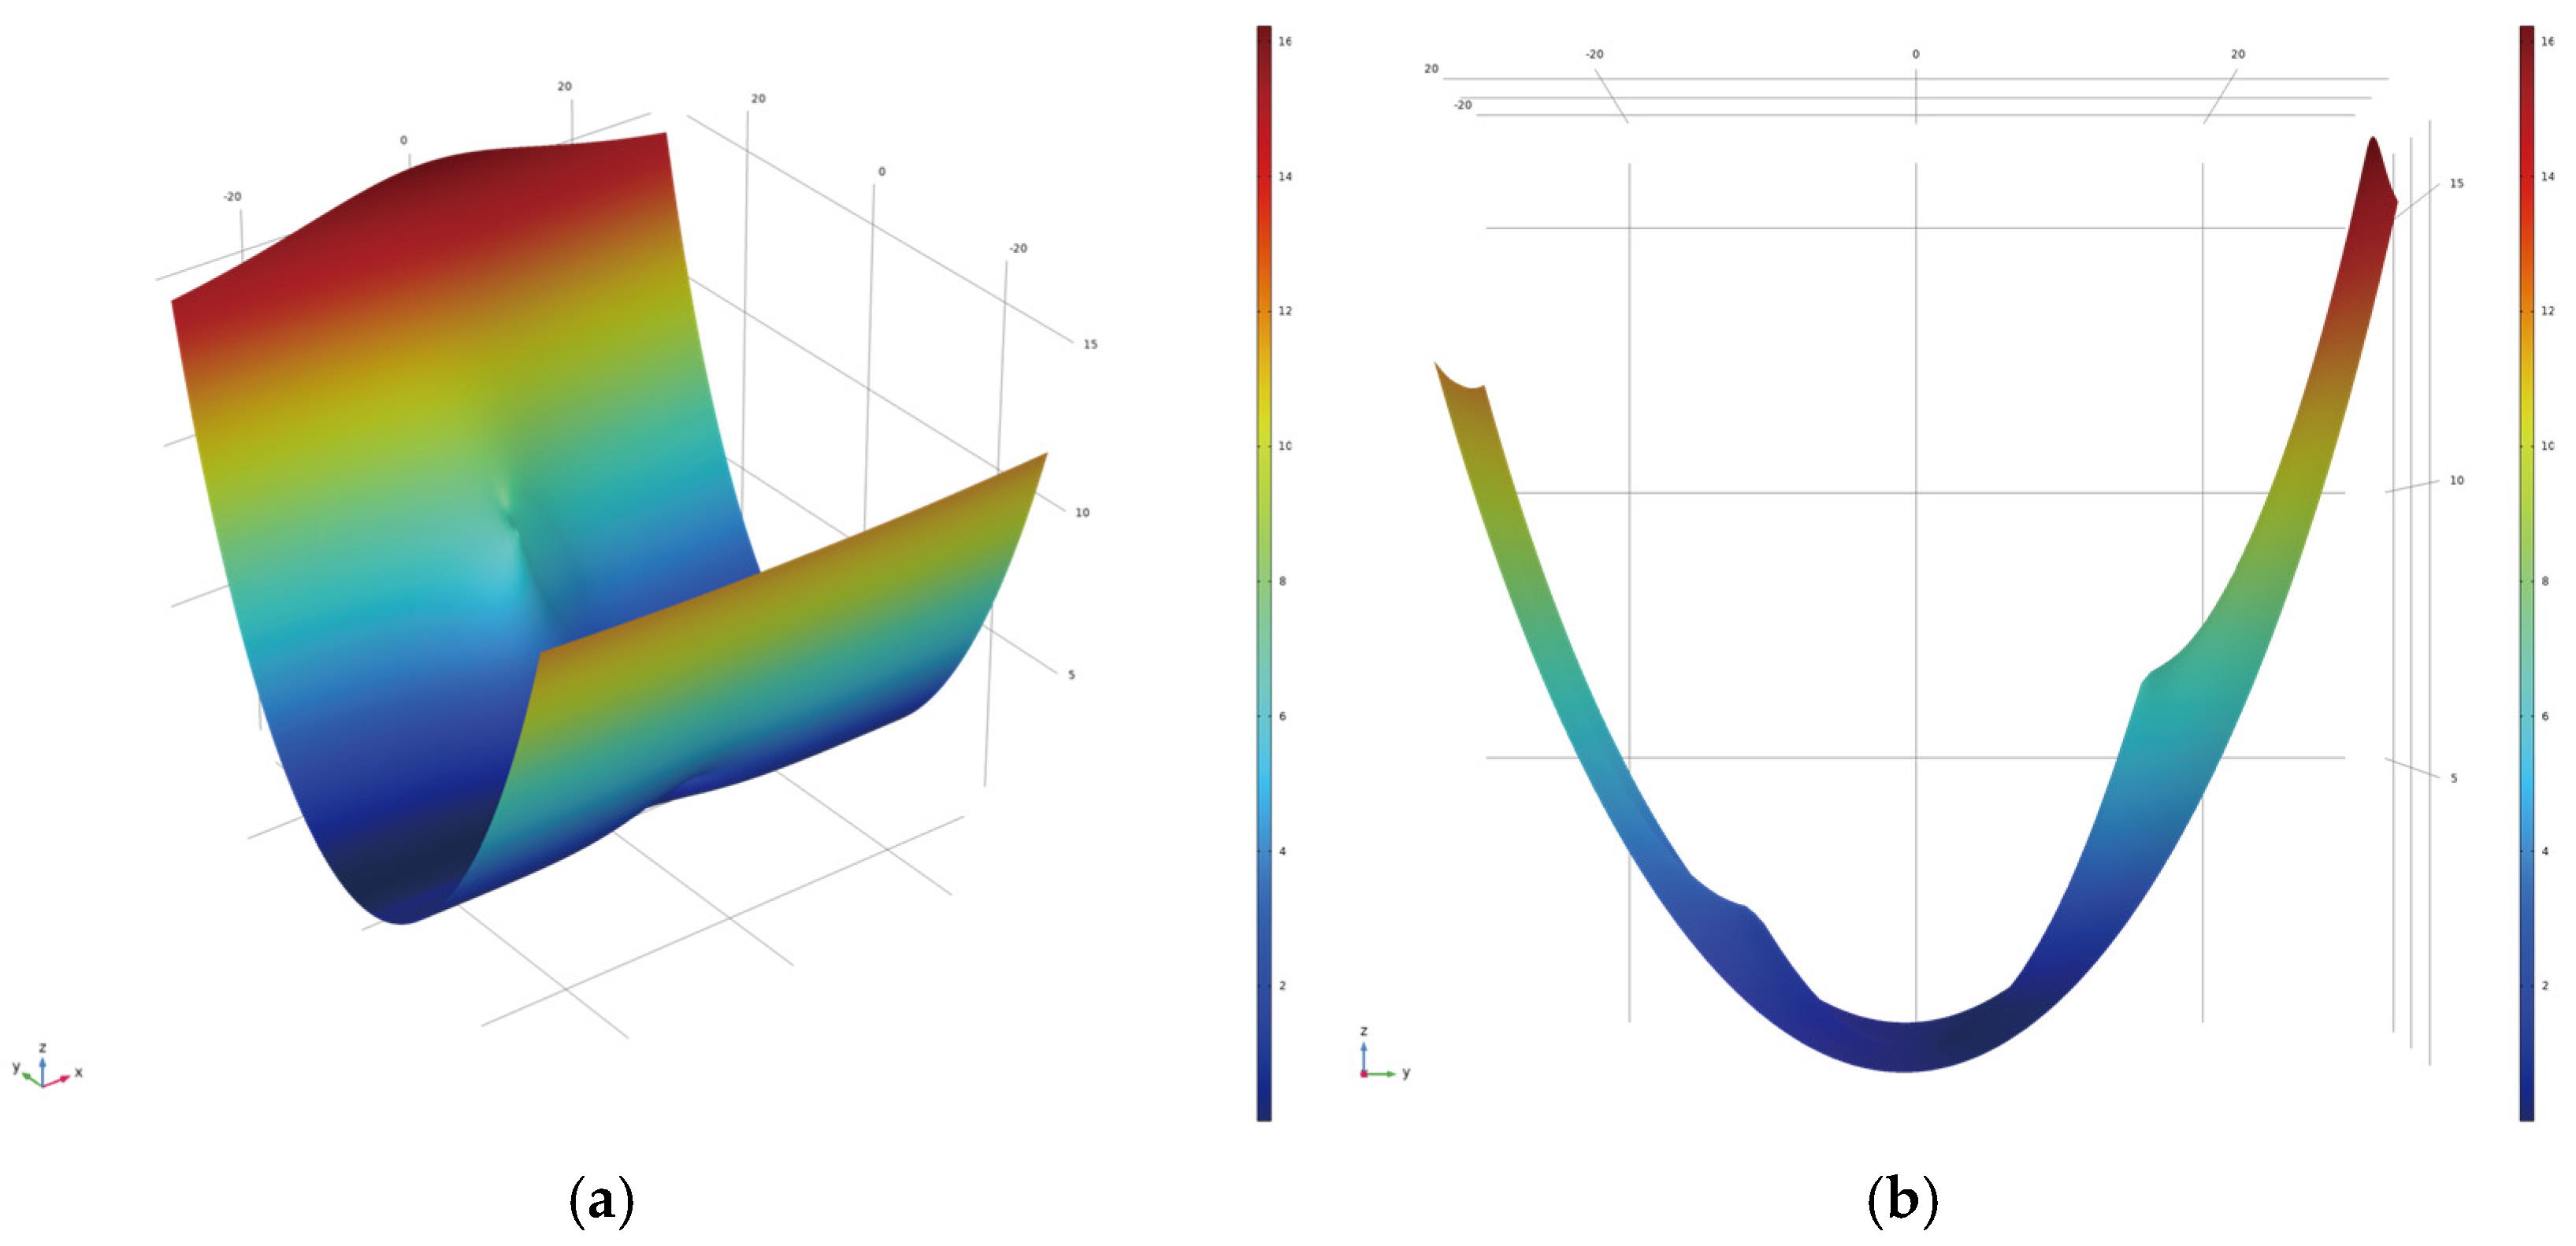
As previously discussed, an optical performance test was conducted using ray tracing simulations with the assistance of COMSOL Multiphysics. Figure 9a and Figure 10b illustrate the resulting plot of the freeform surface, which was generated by importing the platform’s designed surface data points. From these figures, it is evident that the imported surface has been constructed as a 30 × 30 × 20 3D freeform surface, with a peak-to-valley distance of 16 mm. With the observation in Figure 9b, the progressive corridor has been accurately constructed, and the characteristics of the surface in the plot align perfectly with the surface depicted in Figure 8d, the 3D visualization on the web platform.

Figure 9.
Three-dimensional freeform designed surface in COMSOL Multiphysics by importing data points from Shiny portal. (a) the resulting plot of the designed surface; (b) the plot with the observation of the ZOY direction of the same surface which provides a better view of the progressive corridor.
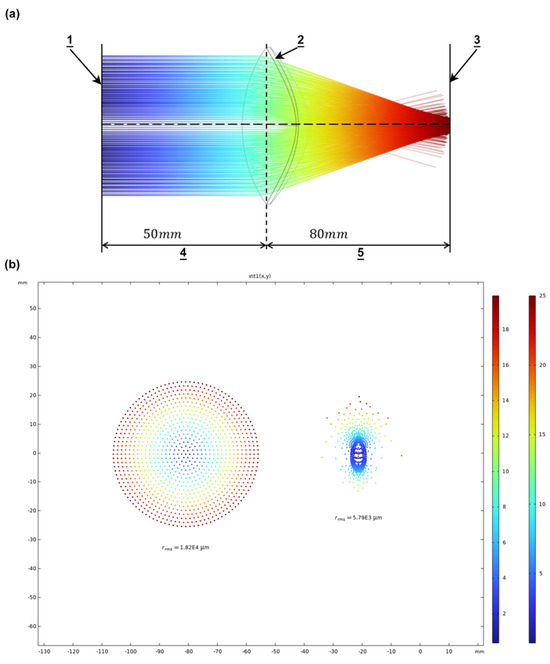
Figure 10.
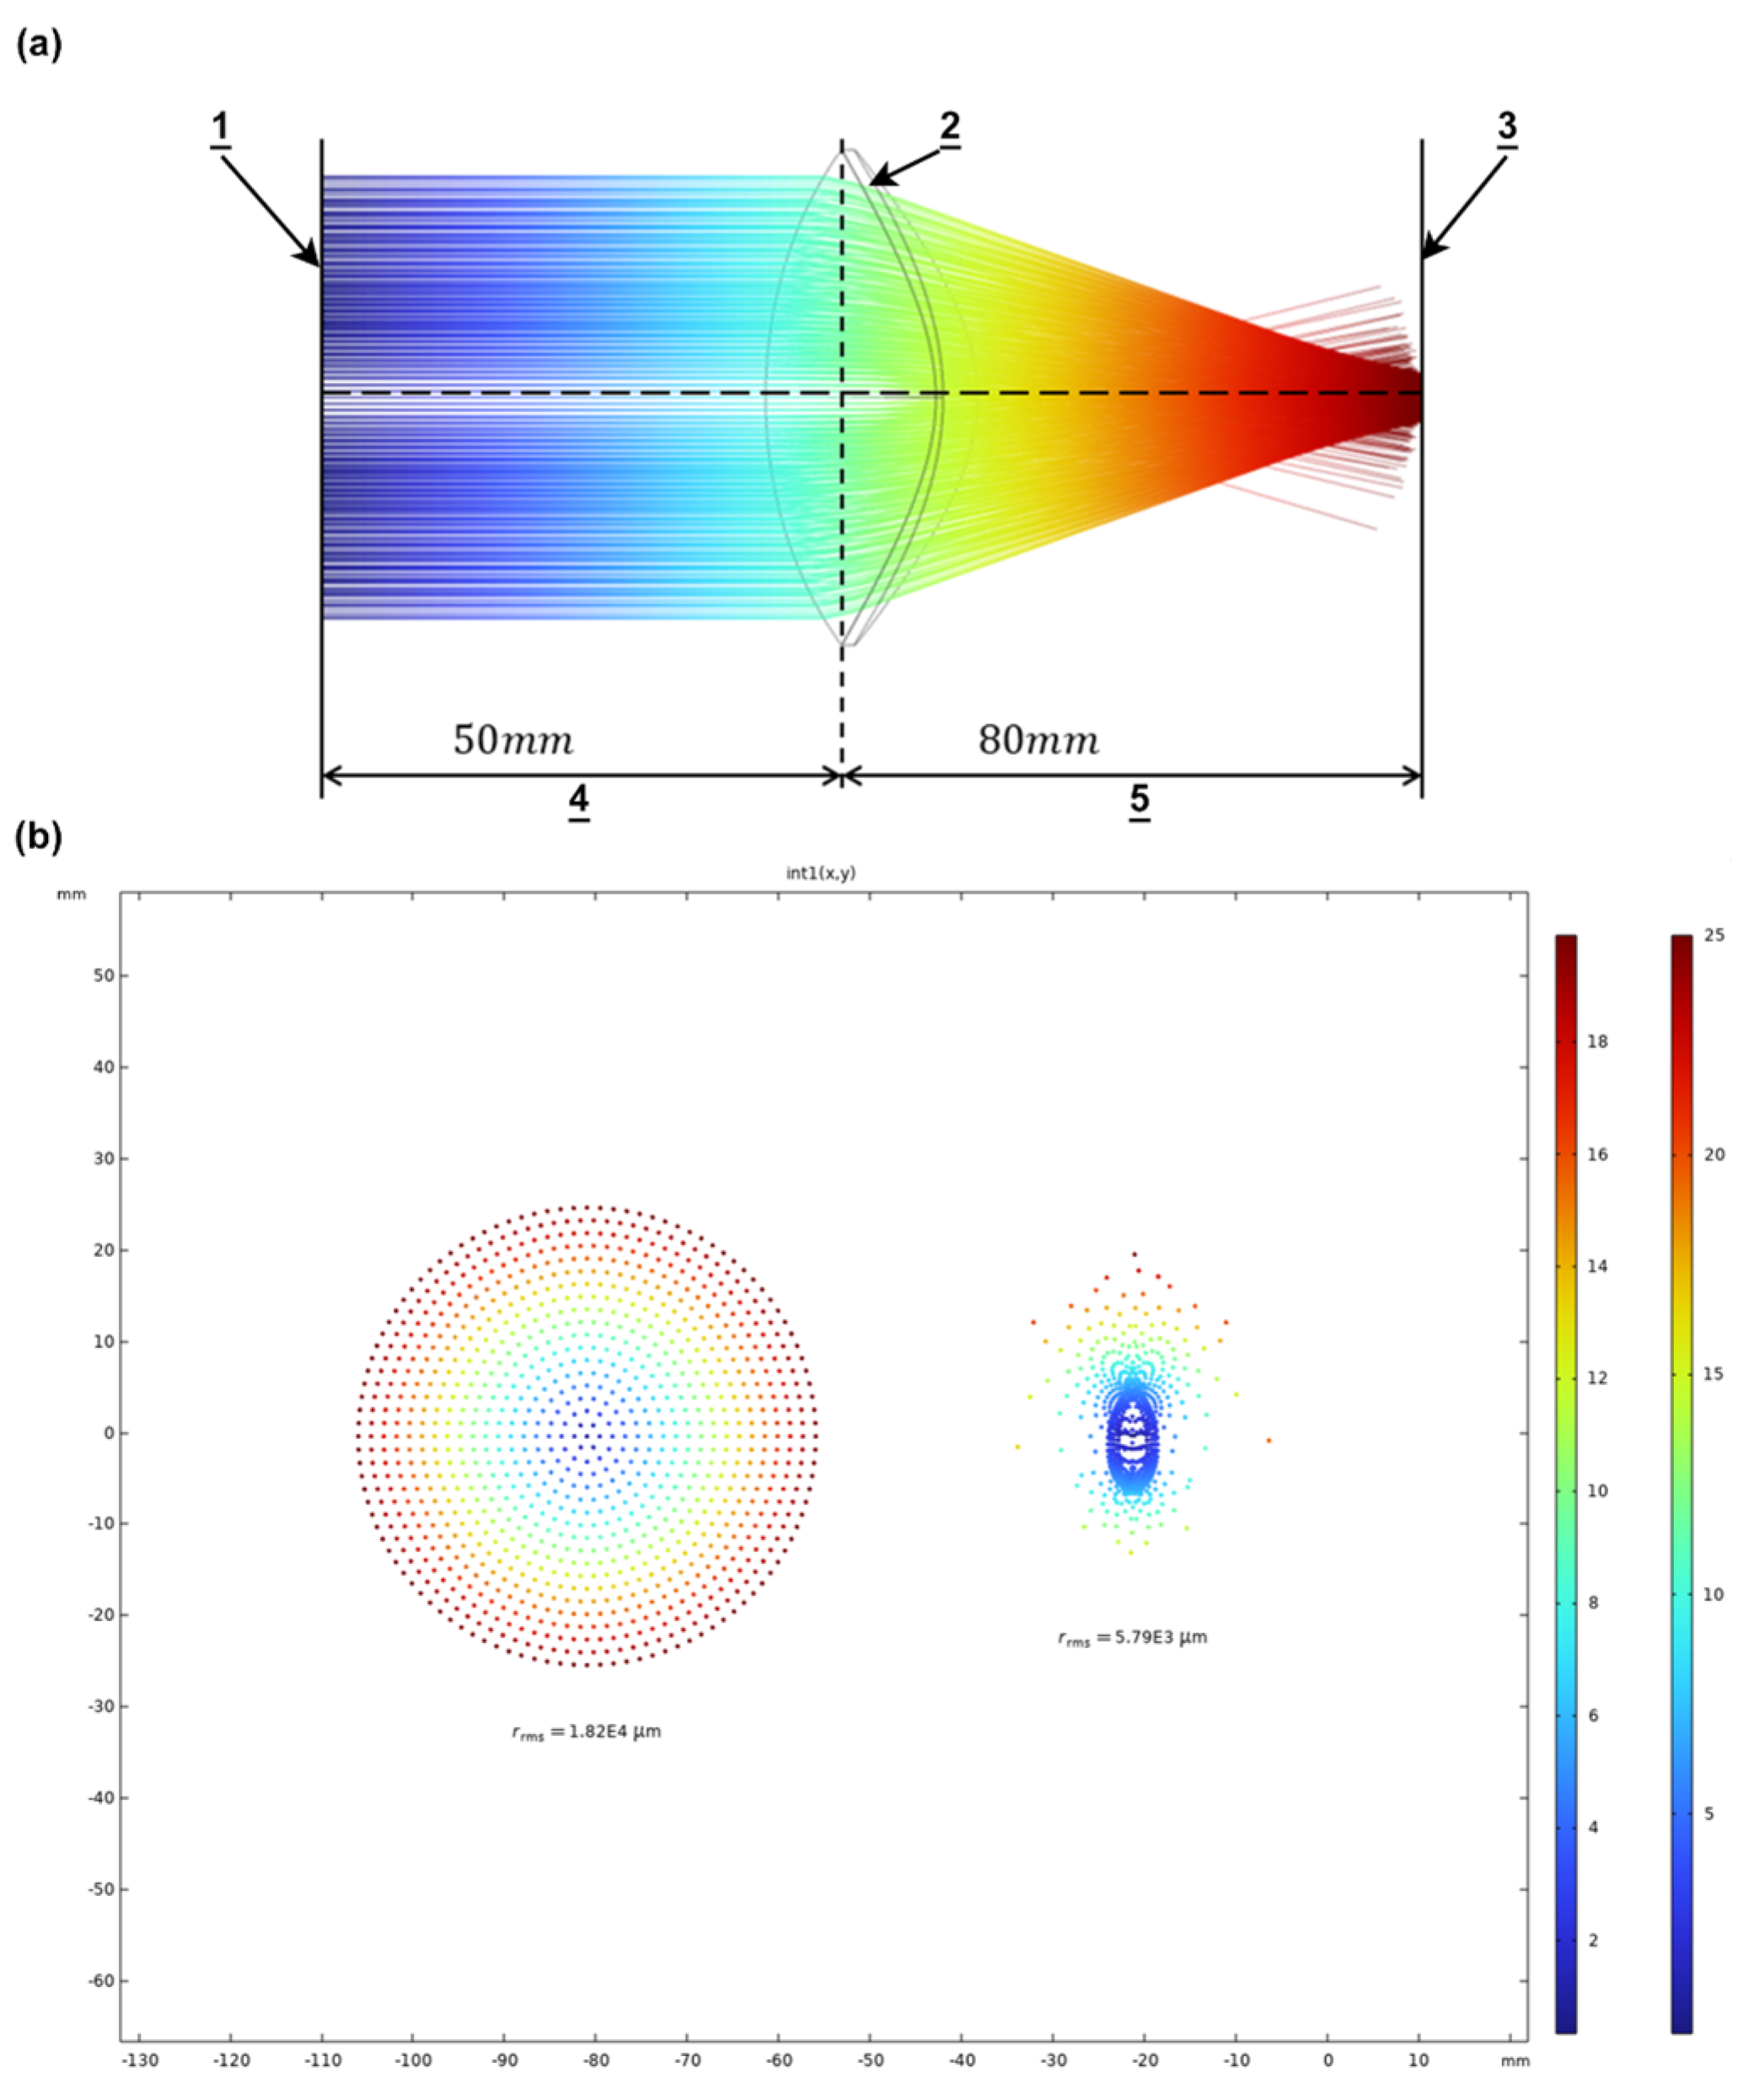
(a) The system layout of the ray tracing simulation: 1. light source, 2. optics model with the defined freeform surface on the concave side, 3. wall created to freeze and collect the rays, 4. The distance between the light source and the optics model, 5. The distance between the optics model and the image plane. (b) The 2D spot diagram illustrating the ray distribution before and after passing through the optics model.
After successfully importing the surface, the 3D optics model was constructed accordingly. The convex surface of the optics model features a spherical lens surface with zero spherical power and custom cylinder power, while the concave surface incorporates the imported surface with all of the customer’s specified spherical power. The material selected for the lens is polycarbonate , as introduced earlier, with a refractive index of n = 1.5848 and an Abbe number of .
Figure 10a illustrates the final simulation layout and the resulting optical performance of the subject optics model. The simulation system design closely references the recommended optical performance inspection system from ISO standard 8980-1. On the left side of the plot is the light source, followed by the optics model with the freeform surface applied to its concave side. A freeze wall has been created to collect rays passing through the optics, allowing for adjustable distances between the model and the collection wall. In this simulation, the distance between the light source and the optics is set to 50 mm, while the distance from the optics to the resulting wall is 80 mm.
Figure 10b presents a 2D spot diagram illustrating the ray distribution before and after passing through the optics model. The diagram on the left shows the ray distribution at the point of creation, while the diagram on the right shows the distribution on the freeze wall. The optical performance has improved significantly, reducing the RMS radius of the rays from to . Additionally, the rays are concentrated into two focal points: one at a y-value of 0 mm and another at a y-value of −10 mm.
7. Conclusions
In this paper, a web-based e-portal for freeform surfaced lens design and manufacturing is presented; while its development has the ideology of considering the highest responsiveness and agility in the personalized design and manufacturing of the lenses, the quality and customer satisfaction are well assured in the ‘earlier digital’ stage in a virtual manner. This innovative e-portal is presented by further considering the effects of the freeform surface design, its material selection, quality lost during the data point cloud file transfer from design to manufacturing, 2D and 3D visualization and inspection of the designed surface topography, real-time resulting surface data output, and the simulation of the lens optical performance assessment. The underlying implications of the web-based e-portal and its experimental evaluation and validation are also applicable to further develop the scientific understanding on freeform surfaced lens design, modeling, and analysis, and the continuous improvement in deterministic manufacturing via a well-connected digital virtual environment. The distinctive conclusion for this research work can be drawn from the following aspects:
- A theoretical analysis and development of a web-based portal for freeform surface optics design and modeling were conducted. The primary objective was to enhance responsiveness and agility in personalized freeform surface manufacturing.
- A holistic discussion of an integrated approach to freeform surface manufacturing was presented, combining freeform surface design, surface modeling, topography characteristic analysis, and optical performance simulation.
- A portal-driven method for the freeform surface optics industry was identified through multiscale mathematical analysis, experimental evaluation, and validation of the ultraprecision machining process. This method integrates surface design, modeling, analysis, assessment, and manufacturing. By incorporating detailed material selection and 2D/3D surface model representations, the simulation outcomes demonstrate the portal’s capability to design surfaces based on customer prescriptions, predict optical performance, and provide a reliable reference for optimizing freeform surface optics during the design and modeling process.
Author Contributions
Conceptualization, S.L., K.C. and N.D.; methodology, S.L.; software, S.L. and N.D.; validation, S.L.; formal analysis, S.L.; investigation, S.L. and K.C.; resources, S.L. and K.C.; data curation, S.L.; writing—original draft preparation, S.L.; writing—review and editing, K.C., S.L. and N.D.; visualization, S.L. and N.D.; supervision, K.C.; project administration, K.C. All authors have read and agreed to the published version of the manuscript.
Funding
This research received no external funding.
Data Availability Statement
The data presented in this study are available on request from the corresponding author due to the privacy concerns associated with the research.
Conflicts of Interest
The authors declare no conflicts of interest.
References
- Meister, D.J.; Fisher, S.W. Progress in the spectacle correction of presbyopia. Part 2: Modern progressive lens technologies. Clin. Exp. Optom. 2008, 91, 251–264. [Google Scholar] [CrossRef]
- Toussaint, J.; Cheng, K. Design agility and manufacturing responsiveness on the Web. Integr. Manuf. Syst. 2002, 13, 328–339. [Google Scholar] [CrossRef]
- Toussaint, J.; Cheng, K. Web-based CBR (case-based reasoning) as a tool with the application to tooling selection. Int. J. Adv. Manuf. Technol. 2006, 29, 24–34. [Google Scholar] [CrossRef]
- Loos, J.; Greiner, G.; Seidel, H.-P. A variational approach to progressive lens design. Comput.-Aided Des. 1998, 30, 595–602. [Google Scholar] [CrossRef]
- Winthrop, J.T.; Smith, S.W. Application of the Dirichlet Principle to the Design of Progressive-Addition Lenses. In Proceedings of the Ophthalmic and Visual Optics (1991), Santa Fe, NM, USA, 6–8 February 1991; p. FB3. [Google Scholar] [CrossRef]
- Wei, Y.; Zhai, P.; Chen, X.; He, L. Study on Design and Diamond Turning of Optical Freeform Surface for Progressive Addition Lenses. Math. Probl. Eng. 2020, 2850606. [Google Scholar] [CrossRef]
- Jiang, W.; Bao, W.; Tang, Q.; Wang, H. A variational-difference numerical method for designing progressive-addition lenses. Comput.-Aided Des. 2014, 48, 17–27. [Google Scholar] [CrossRef]
- Loos, J.; Slusallek, P.; Seidel, H.-P. Using Wavefront Tracing for the Visualization and Optimization of Progressive Lenses. Comput. Graph. Forum 1998, 17, 255–265. [Google Scholar] [CrossRef]
- Hsu, W.-Y.; Liu, Y.-L.; Cheng, Y.-C.; Su, G.-D. Design and Fabrication of the Progressive Addition Lens. In Proceedings of the Frontiers in Optics 2010/Laser Science XXVI (2010), Rochester, NY, USA, 24–28 October 2010; p. FThU8. [Google Scholar] [CrossRef]
- Cheung, C.F.; Kong, L.B.; Ho, L.T.; To, S.; Wang, B.; Lai, K.T. An integrated approach for design, ultraprecision polishing, and measurement of freeform progressive lenses. In Proceedings of the 6th International Symposium on Advanced Optical Manufacturing and Testing Technologies: Advanced Optical Manufacturing Technologies, Xiamen, China, 26–29 April 2012; pp. 88–94. [Google Scholar] [CrossRef]
- Liu, Q.; Zhou, X.; Xu, P. A new tool path for optical freeform surface fast tool servo diamond turning. Proc. Inst. Mech. Eng. Part B J. Eng. Manuf. 2014, 228, 1721–1726. [Google Scholar] [CrossRef]
- Manjunath, K.; Tewary, S.; Khatri, N.; Cheng, K. Monitoring and Predicting the Surface Generation and Surface Roughness in Ultraprecision Machining: A Critical Review. Machines 2021, 9, 369. [Google Scholar] [CrossRef]
- Zhang, S.J.; To, S.; Wang, S.J.; Zhu, Z.W. A review of surface roughness generation in ultra-precision machining. Int. J. Mach. Tools Manuf. 2015, 91, 76–95. [Google Scholar] [CrossRef]
- Sata, T. Surface finish in metal cutting. Ann. CIRP 1964, 12, 190–197. [Google Scholar]
- To, S.; Cheung, C.F.; Lee, W.B. Influence of material swelling on surface roughness in diamond turning of single crystals. Mater. Sci. Technol. 2001, 17, 102–108. [Google Scholar] [CrossRef]
- Kong, M.C.; Lee, W.B.; Cheung, C.F.; To, S. A study of materials swelling and recovery in single-point diamond turning of ductile materials. J. Mater. Process. Technol. 2006, 180, 210–215. [Google Scholar] [CrossRef]
- Lee, W.B.; To, S.; Chan, C.Y. Deformation band formation in metal cutting. Scr. Mater. 1999, 40, 439–443. [Google Scholar] [CrossRef]
- Cheung, C.F.; Chan, K.C.; To, S.; Lee, W.B. Effect of reinforcement in ultra-precision machining of Al6061/SiC metal matrix composites. Scr. Mater. 2002, 47, 77–82. [Google Scholar] [CrossRef]
- Simoneau, A.; Ng, E.; Elbestawi, M.A. Surface defects during microcutting. Int. J. Mach. Tools Manuf. 2006, 46, 1378–1387. Available online: https://www.sciencedirect.com/science/article/pii/S0890695505002725 (accessed on 9 September 2024). [CrossRef]
- Liu, K.; Melkote, S.N. Effect of plastic side flow on surface roughness in micro-turning process. Int. J. Mach. Tools Manuf. 2006, 46, 1778–1785. [Google Scholar] [CrossRef]
- Zhang, S.J.; To, S.; Wang, H.T. A theoretical and experimental investigation into five-DOF dynamic characteristics of an aerostatic bearing spindle in ultra-precision diamond turning. Int. J. Mach. Tools Manuf. 2013, 71, 1–10. [Google Scholar] [CrossRef]
- Groover, M.P.; Jayaprakash, G. Automation, Production Systems, and Computer-Integrated Manufacturing, 4th ed.; Pearson: London, UK, 2016; Available online: https://go.exlibris.link/nclTmZ3v (accessed on 9 September 2024).
- Cheng, K.; Bateman, R.J. e-Manufacturing: Characteristics, applications and potentials. Prog. Nat. Sci. 2008, 18, 1323–1328. [Google Scholar] [CrossRef]
- Li, P.; Cheng, K.; Jiang, P.; Katchasuwanmanee, K. Investigation on industrial dataspace for advanced machining workshops: Enabling machining operations control with domain knowledge and application case studies. J. Intell. Manuf. 2020, 33, 103–119. [Google Scholar] [CrossRef]
- Alonso, J.; Gómez-Pedrero, J.A.; Quiroga, J.A. Modern Ophthalmic Optics; Cambridge University Press: Cambridge, UK, 2019. [Google Scholar]
- Rolland, J.P.; Davies, M.A.; Suleski, T.J.; Evans, C.; Bauer, A.; Lambropoulos, J.C.; Falaggis, K. Freeform optics for imaging. Optica 2021, 8, 161–176. [Google Scholar] [CrossRef]
- Hsu, W.-Y.; Liu, Y.-L.; Cheng, Y.-C.; Kuo, C.-H.; Chen, C.-C.; Su, G.-D. Design, fabrication, and metrology of ultra-precision optical freeform surface for progressive addition lens with B-spline description. Int. J. Adv. Manuf. Technol. 2012, 63, 225–233. [Google Scholar] [CrossRef]
- ISO8980-1:2017; Ophthalmic Optics—Uncut Finished Spectacle Lenses. Part 1: Specifications for Single-Vision and Multifocal Lenses. International Organization for Standardization: Geneva, Switzerland, 2017.
- Sultanova, N.; Kasarova, S.; Nikolov, I. Dispersion Properties of Optical Polymers. Acta Phys. Pol. A 2009, 116, 585–587. [Google Scholar] [CrossRef]

Disclaimer/Publisher’s Note: The statements, opinions and data contained in all publications are solely those of the individual author(s) and contributor(s) and not of MDPI and/or the editor(s). MDPI and/or the editor(s) disclaim responsibility for any injury to people or property resulting from any ideas, methods, instructions or products referred to in the content. |
© 2025 by the authors. Licensee MDPI, Basel, Switzerland. This article is an open access article distributed under the terms and conditions of the Creative Commons Attribution (CC BY) license (https://creativecommons.org/licenses/by/4.0/).