Article

Non-Linear Hyperelastic Model Analysis and Numerical Validation of 3D Printed PLA+ Material Incorporating Various Infill Densities

by
Md Zisanul Haque Bhuiyan
1,
Khalil Khanafer
1,*,
Ehasanul Islam Rafi
2 and
Md Shadman Shihab
2
1
College of Innovation and Technology, Mechanical Engineering, University of Michigan, Flint, MI 48502, USA
2
Industrial and Production Engineering, Bangladesh University of Engineering & Technology (BUET), Dhaka 1000, Bangladesh
*
Author to whom correspondence should be addressed.
Machines 2025, 13(2), 91; https://doi.org/10.3390/machines13020091
Submission received: 19 December 2024 / Revised: 17 January 2025 / Accepted: 20 January 2025 / Published: 24 January 2025
(This article belongs to the Section Advanced Manufacturing)

Abstract

:
Additive manufacturing (AM) or 3D printing technology creates a tangible object by adding successive layers of materials. Nowadays, 3D printing is used for developing both metal and non-metal products. In the advancement of 3D printing technology, material specimen design, modification, and testing become very simple, especially for non-metal materials, such as hyperelastic, thermoplastic, or rubber-like materials. However, proper material modeling and validation are required for the analysis of these types of materials. In this study, 3D printed poly lactic acid (PLA+) material behavior is analyzed numerically for validation in the counterpart of experimental analysis to evaluate their behavior in both cases. The specimen was designed in SolidWorks by following ASTM D638 dimension standards with proper infill densities and raster angle or infill orientation angle. These infill layer densities and angles of orientation play an important role in the mechanical behavior of the specimen. This paper aims to present a numerical validation of five infill densities (20%, 40%, 60%, 80%, and 100%) for a ±45-degree infill angle orientation by incorporating a nonlinear hyperelastic model. Results indicate that infill densities affect the mechanical behavior of PLA+ material. The result also suggested that neo-Hookean and Mooney–Rivlin are the best-fitted hyperelastic material models for these five separate linear infill densities. However, neo-Hookean is easier to analyze, as it has only one parameter and a new equation is developed in this study for determining the parameter for different infill densities.

1. Introduction

Additive manufacturing (AM), commonly known as 3D printing, has transformed the manufacturing landscape by offering unparalleled flexibility in design and production. Unlike traditional subtractive manufacturing methods, which involve material removal to shape products, 3D printing constructs objects layer by layer using materials such as polymers, metals, and ceramics. This layer-by-layer approach enables complex geometries and customization, which are unattainable with traditional manufacturing techniques [1]. Applications span industries like aerospace, automotive, healthcare, and consumer goods, where the technology is valued for its ability to shorten lead times, reduce tooling costs, and enable rapid prototyping [2]. Moreover, 3D printing facilitates the creation of lightweight structures, such as lattice designs, which maintain strength while minimizing material usage, making it especially advantageous for industries prioritizing energy efficiency [3]. A wide array of materials is available for 3D printing, including polycarbonate (PC), acrylonitrile butadiene styrene (ABS), PC-ABS blends [4], polylactic acid (PLA), polystyrene (PS), polyamide (PA), and polyethylene terephthalate (PET) [5]. Among these, PLA+ (polylactic acid plus) has garnered attention for its enhanced mechanical properties compared to standard PLA. It is easier to print, more durable, and is highly versatile, making it suitable for a broad spectrum of applications [6]. PLA+’s improved toughness and flexibility, combined with its availability in various colors, have made it a popular choice among hobbyists and professionals [7]. Being a thermoplastic polymer [8], PLA+ exhibits significant deflection, making it suitable for hyperelastic material modeling. Its superior mechanical properties compared to standard PLA render it highly effective for producing durable, high-quality prints. Furthermore, research has extensively explored the effects of varying fused material orientation angles on the mechanical properties of 3D printed products [9].
The study of hyperelastic models for 3D printed materials, particularly PLA+ with varying infill densities, has become crucial due to its applications in additive manufacturing and materials science. These models, combined with material advancements, open new opportunities for designing lightweight and durable components [10]. Such innovations enable 3D printing to meet the demands of high-performance engineering solutions [11]. This research emphasizes optimizing 3D printed structures using materials like PLA+ while considering both mechanical performance and material efficiency. Infill patterns, orientations, and densities have been rigorously analyzed, with findings indicating that higher infill densities enhance mechanical strength and stiffness, whereas lower densities improve material flexibility [12,13]. These results align with studies like [14,15], which highlighted the role of linear infill densities in optimizing the mechanical performance of PLA+ under various loading conditions. Additionally, higher infill densities demonstrated better alignment between experimental data and FEA simulations, especially when employing the Gent model, which accounts for material stiffening at larger strains. Recent studies further underscore the need for refining hyperelastic models to capture the complexities of 3D printed materials like PLA+. Lin et al. [16] conducted an in-depth study of nine hyperelastic models, revealing that models such as Mooney–Rivlin and Gent outperform others in predicting the nonlinear mechanical behavior of 3D printed polymers. Khaniki et al. [15] reviewed the dynamic response of hyperelastic structures, emphasizing the critical role of accurate constitutive laws for modeling materials undergoing large deformations. To validate hyperelastic modeling, numerical analyses like finite element analysis (FEA) are frequently employed in recent research. The choice of element type, mesh density, and boundary conditions in FEA simulations significantly affects the accuracy of these models, necessitating rigorous numerical validation [16]. Studies by Lin et al. [16] and Khaniki et al. [17] demonstrated that models like Mooney–Rivlin and Yeoh are well-suited for large deformations, whereas the neo-Hookean model performs more effectively under small strain conditions. Their research has advanced the predictive capabilities of hyperelastic models by comparing experimental data with numerical predictions across various hyperelastic formulations.
Several recent studies have investigated the mechanical behavior of PLA+ materials under uniaxial tensile testing. Among them, Alhazmi and Backer [11] examined the mechanical behavior of PLA+ using five infill densities (20%, 40%, 60%, 80%, and 100%) and three infill angle orientations (0°, +45°, and ±45°). However, their study did not incorporate hyperelastic modeling or numerical analysis to validate the results. Furthermore, no subsequent research has attempted to validate their findings. This study seeks to address this gap by validating the experimental results from the literature [11] for the ±45° infill angle orientation and the five infill densities using hyperelastic curve fitting and finite element analysis (FEA). The ±45° infill angle orientation was selected for validation due to its greater complexity compared to the other two orientations and its stress–strain characteristics, which closely resemble those of a solid infill structure. This makes it particularly relevant for practical applications. Despite existing research on PLA+ materials, no study has simultaneously incorporated linear infill densities in dog bone specimens for both experimental uniaxial tensile testing and numerical validation using hyperelastic modeling.
This research aims to fill this critical gap to achieve the following objectives:
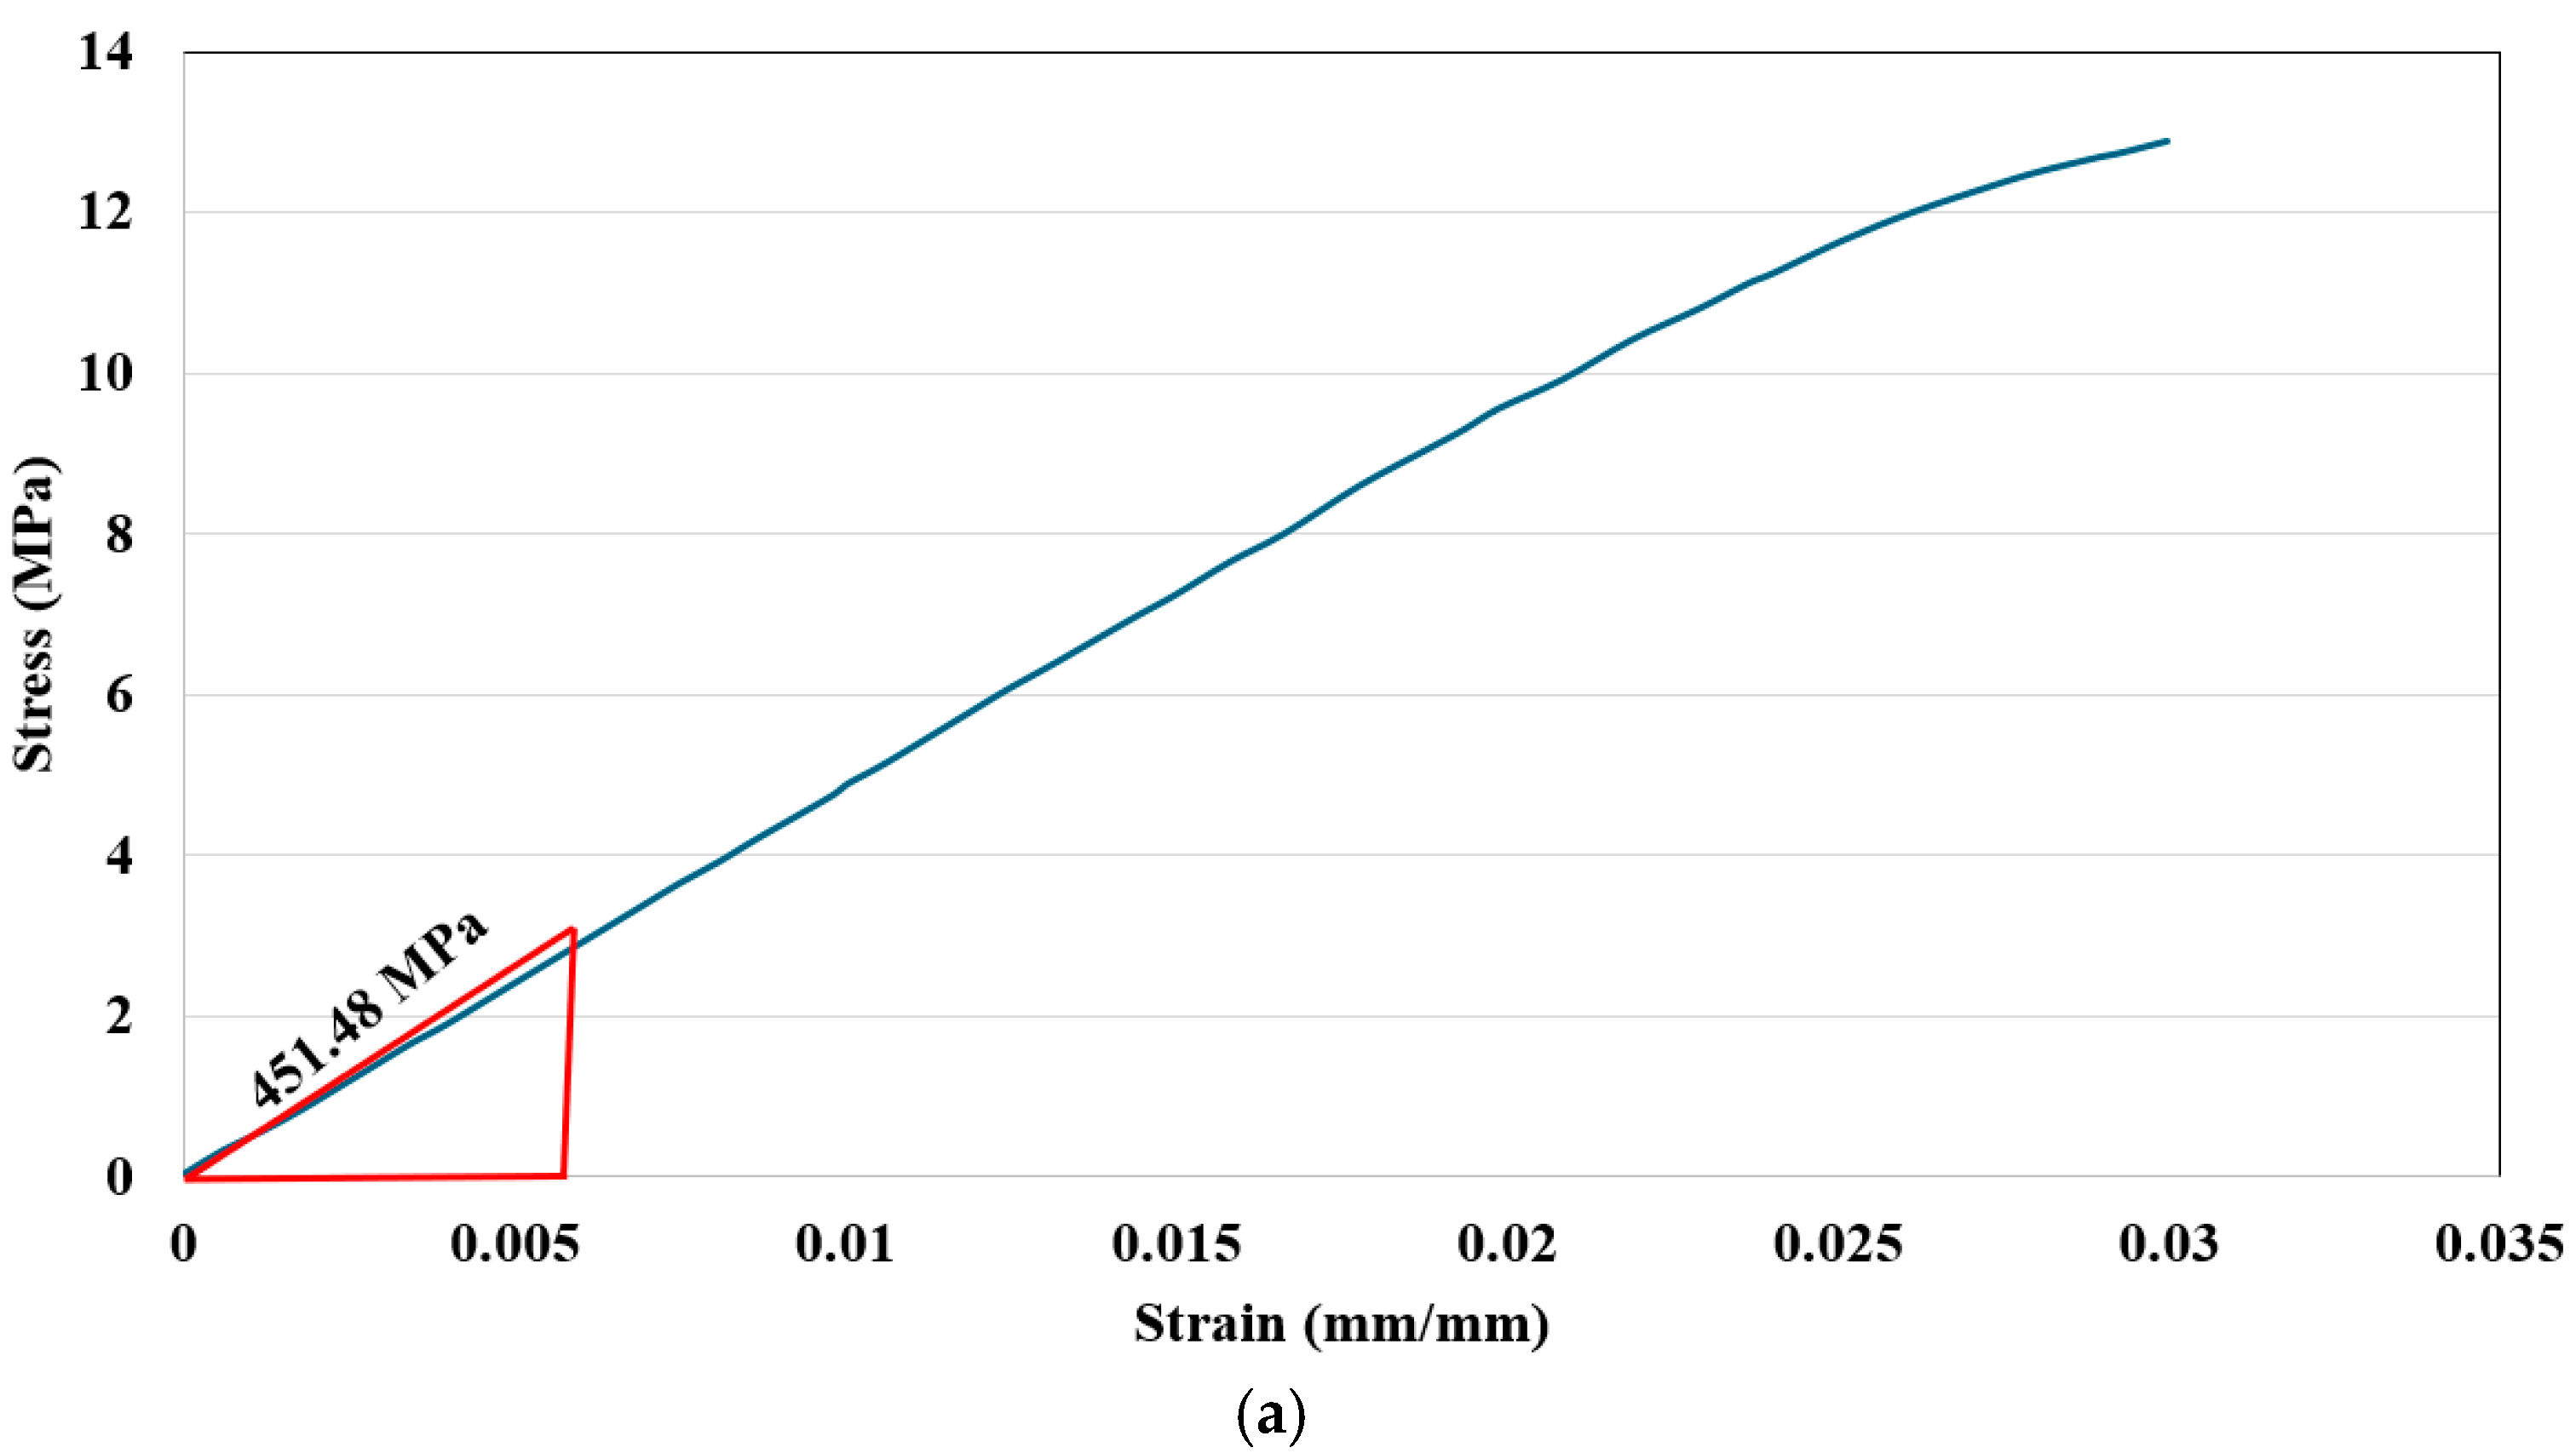
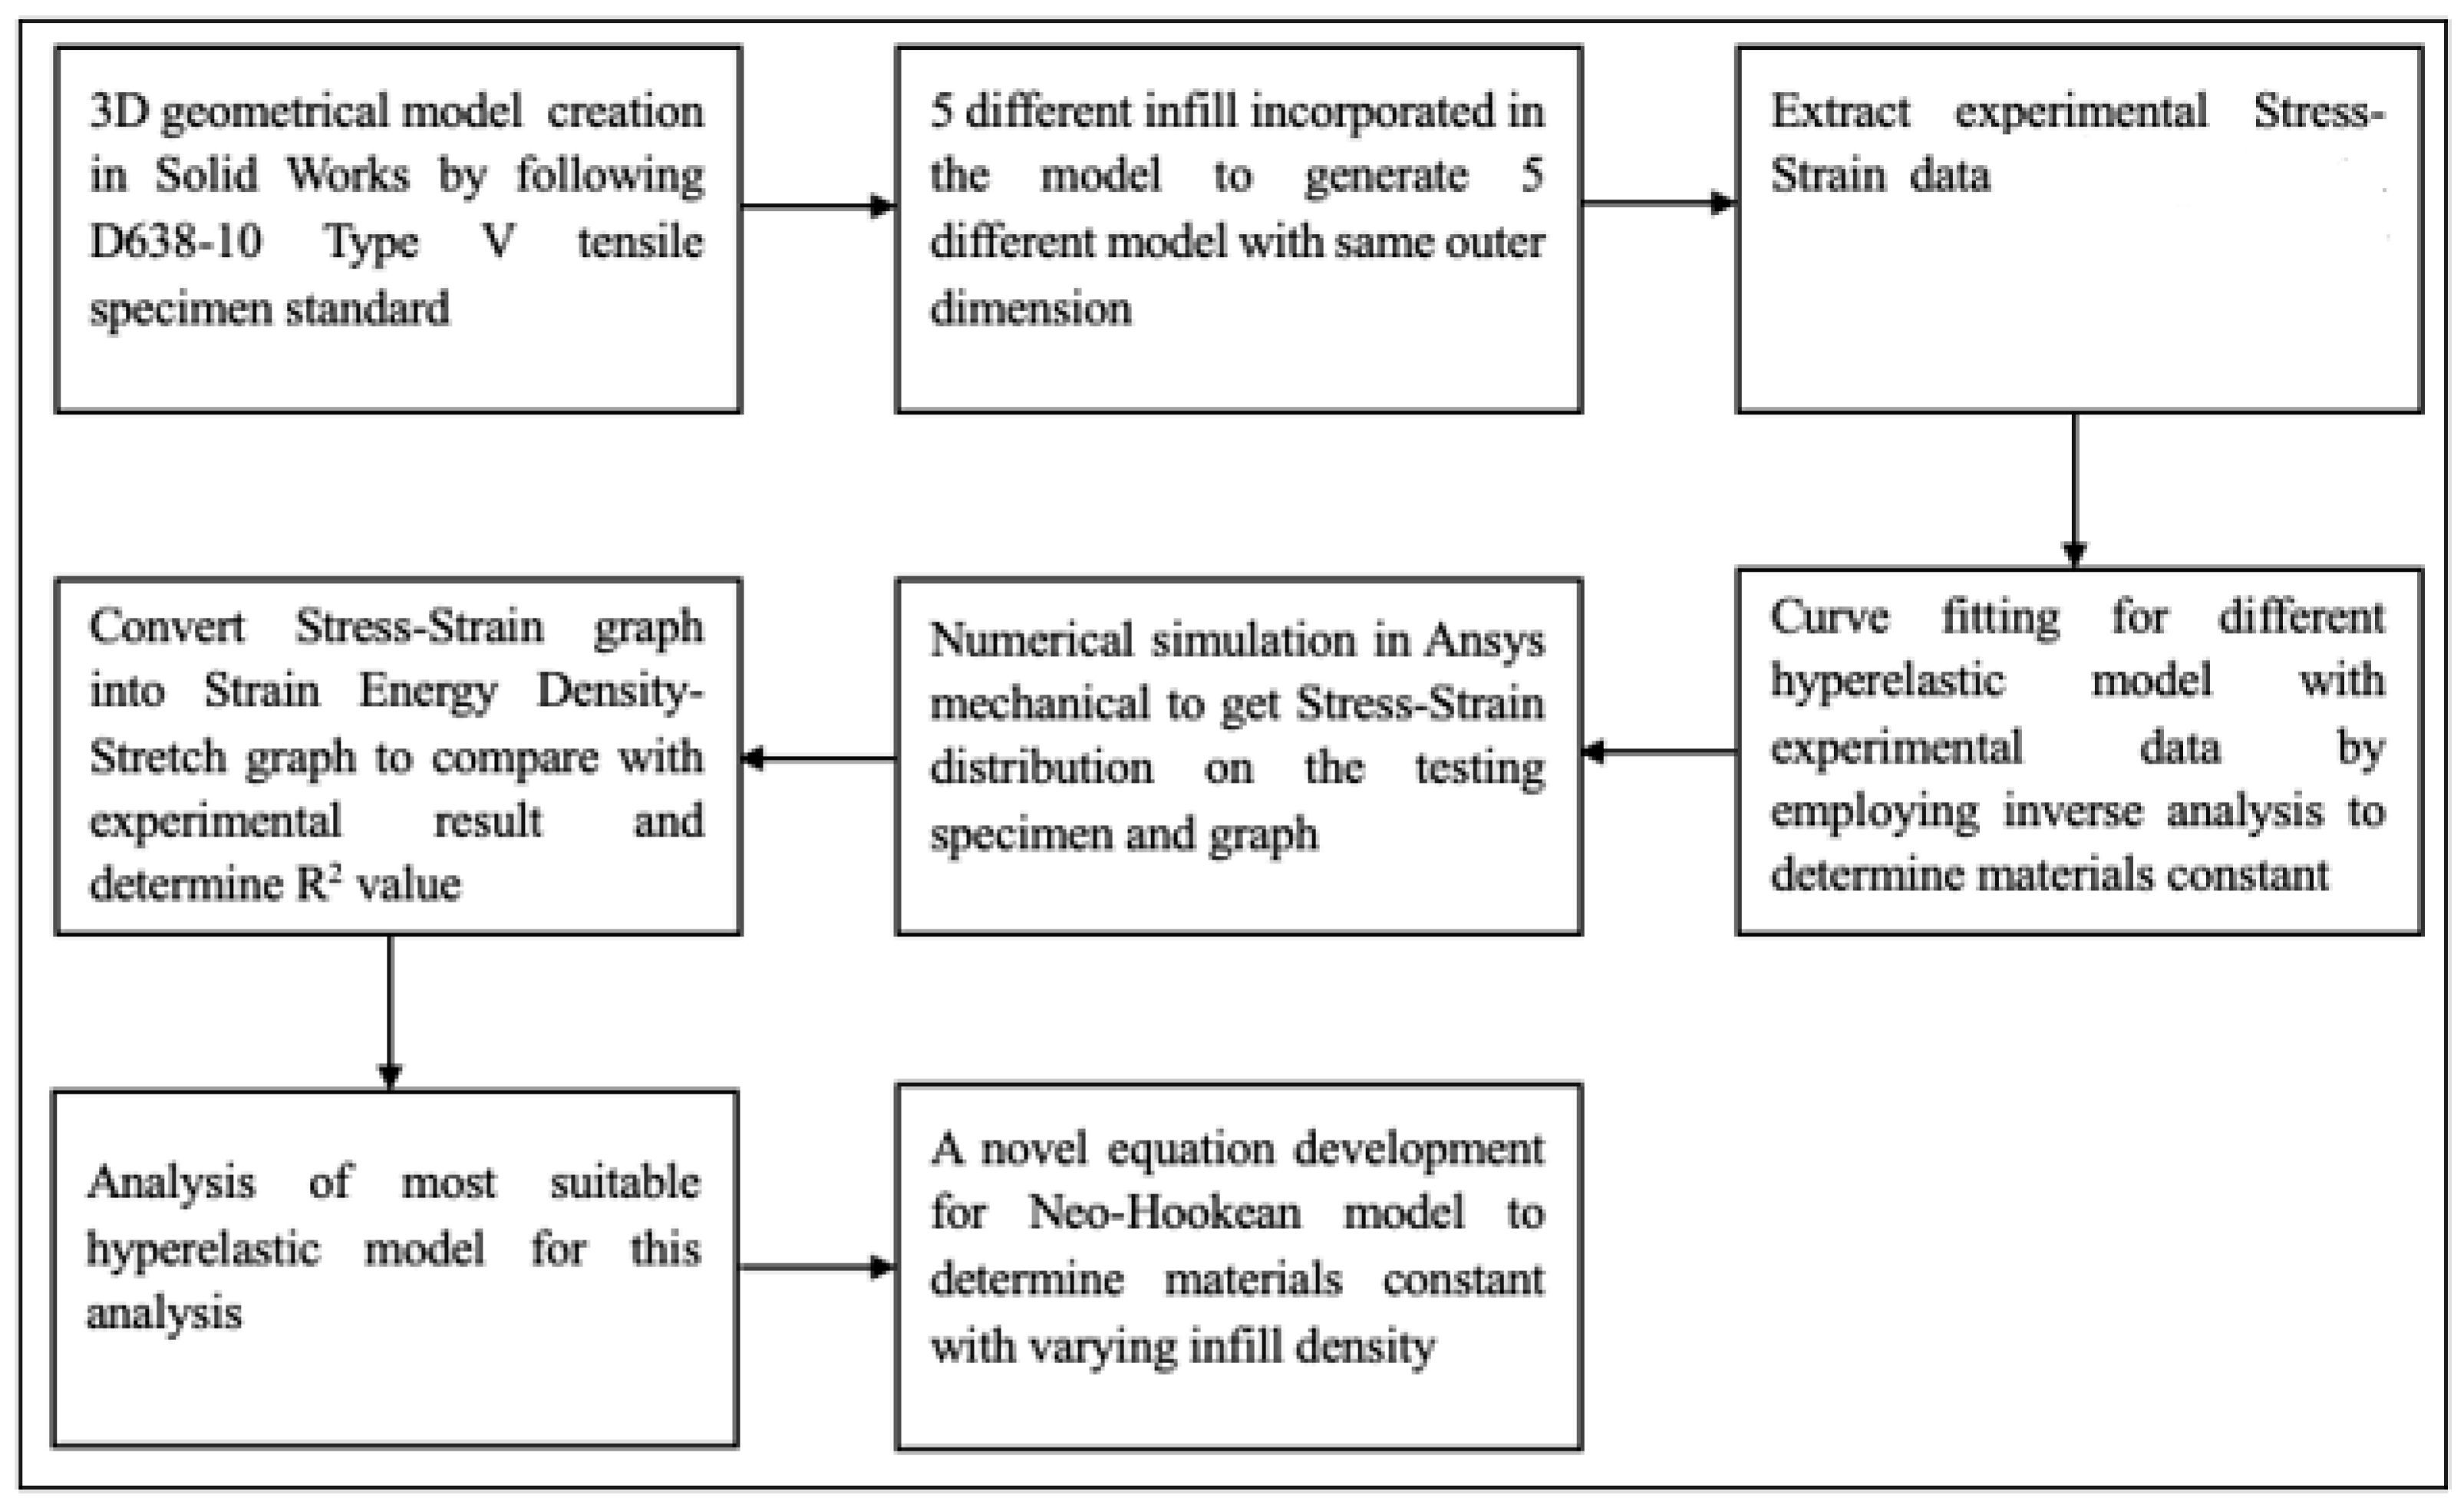
  • Determine the strain energy behavior from the stress–strain curve obtained through experimental analysis.
  • Identify the hyperelastic material constants for various hyperelastic models using curve fitting techniques.
  • Perform numerical simulations in Ansys Mechanical to generate the stress–strain curve and convert it into a strain energy density vs. stretch curve.
  • Compare the numerical strain energy density results with the experimental data to assess the model’s accuracy.
  • Identify the most suitable hyperelastic model for PLA+ material, incorporating linear infill densities, based on the uniaxial tensile test results.
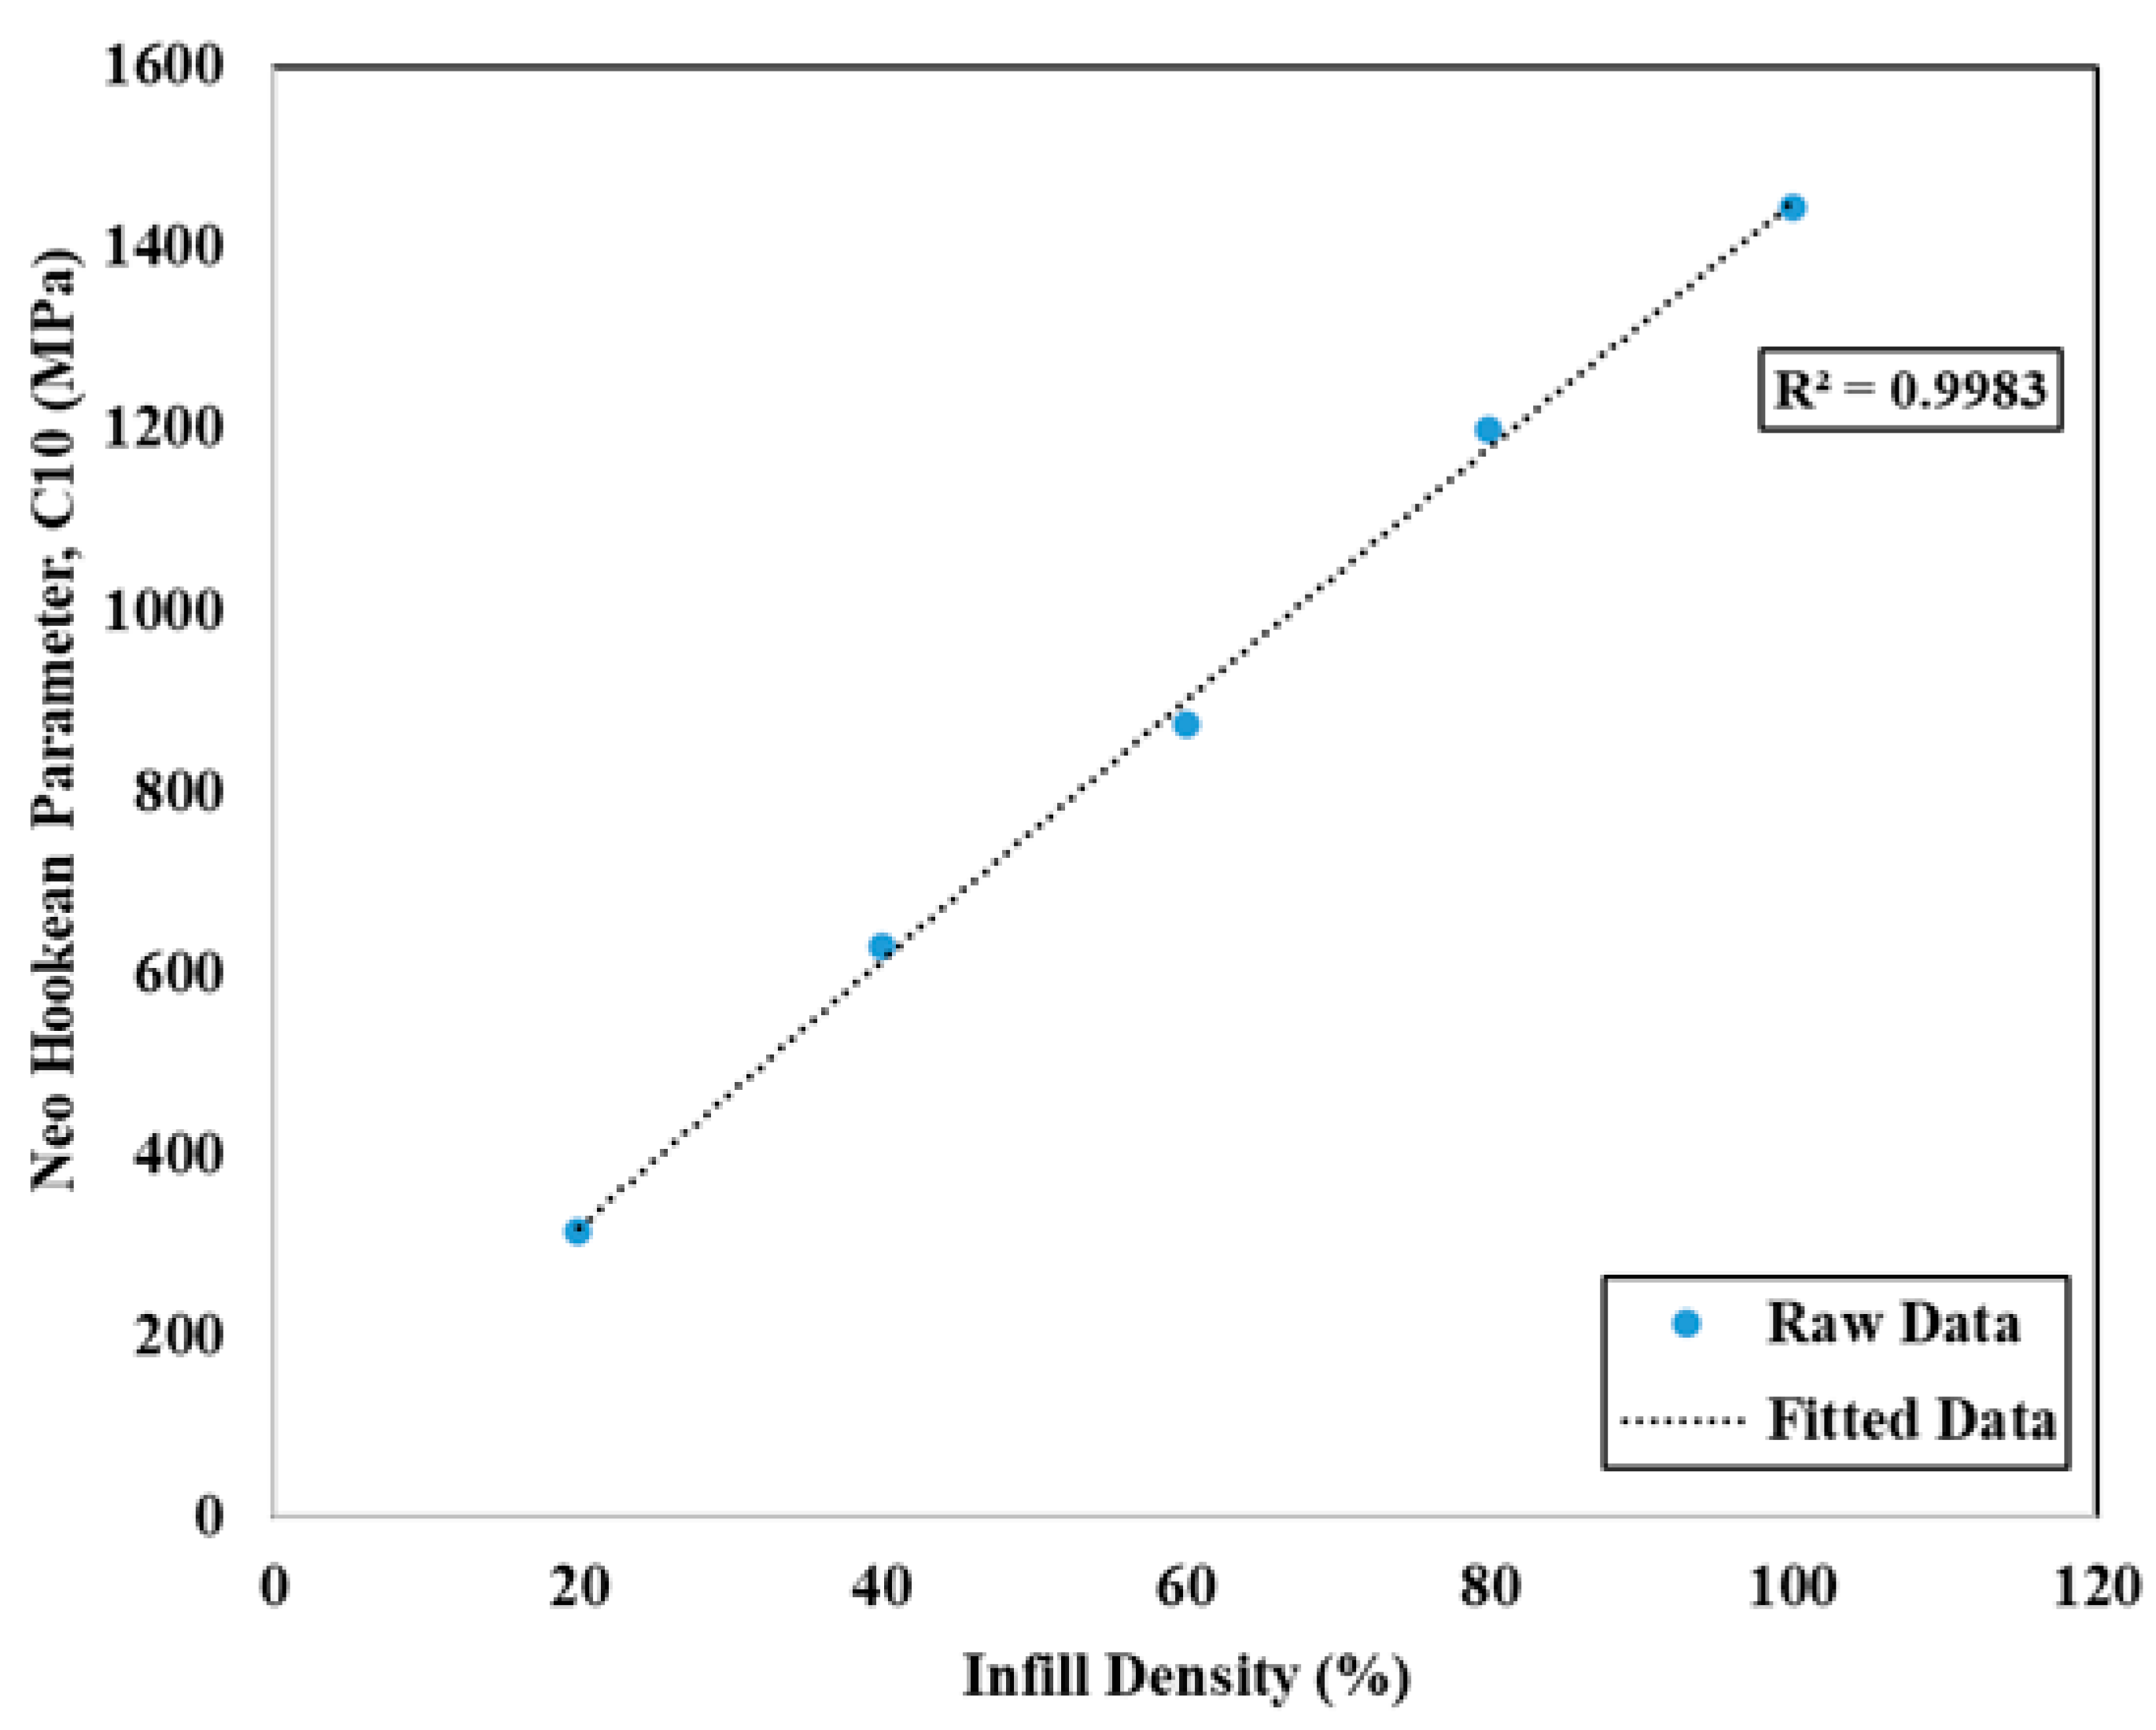
  • Develop a new equation to determine material constants for the neo-Hookean model.
  • Conclude with a discussion on the implications of the findings and provide recommendations for future research.
The research methodology and procedures are summarized in Figure 1 and are detailed in the next sections.

2. Model and Methodology

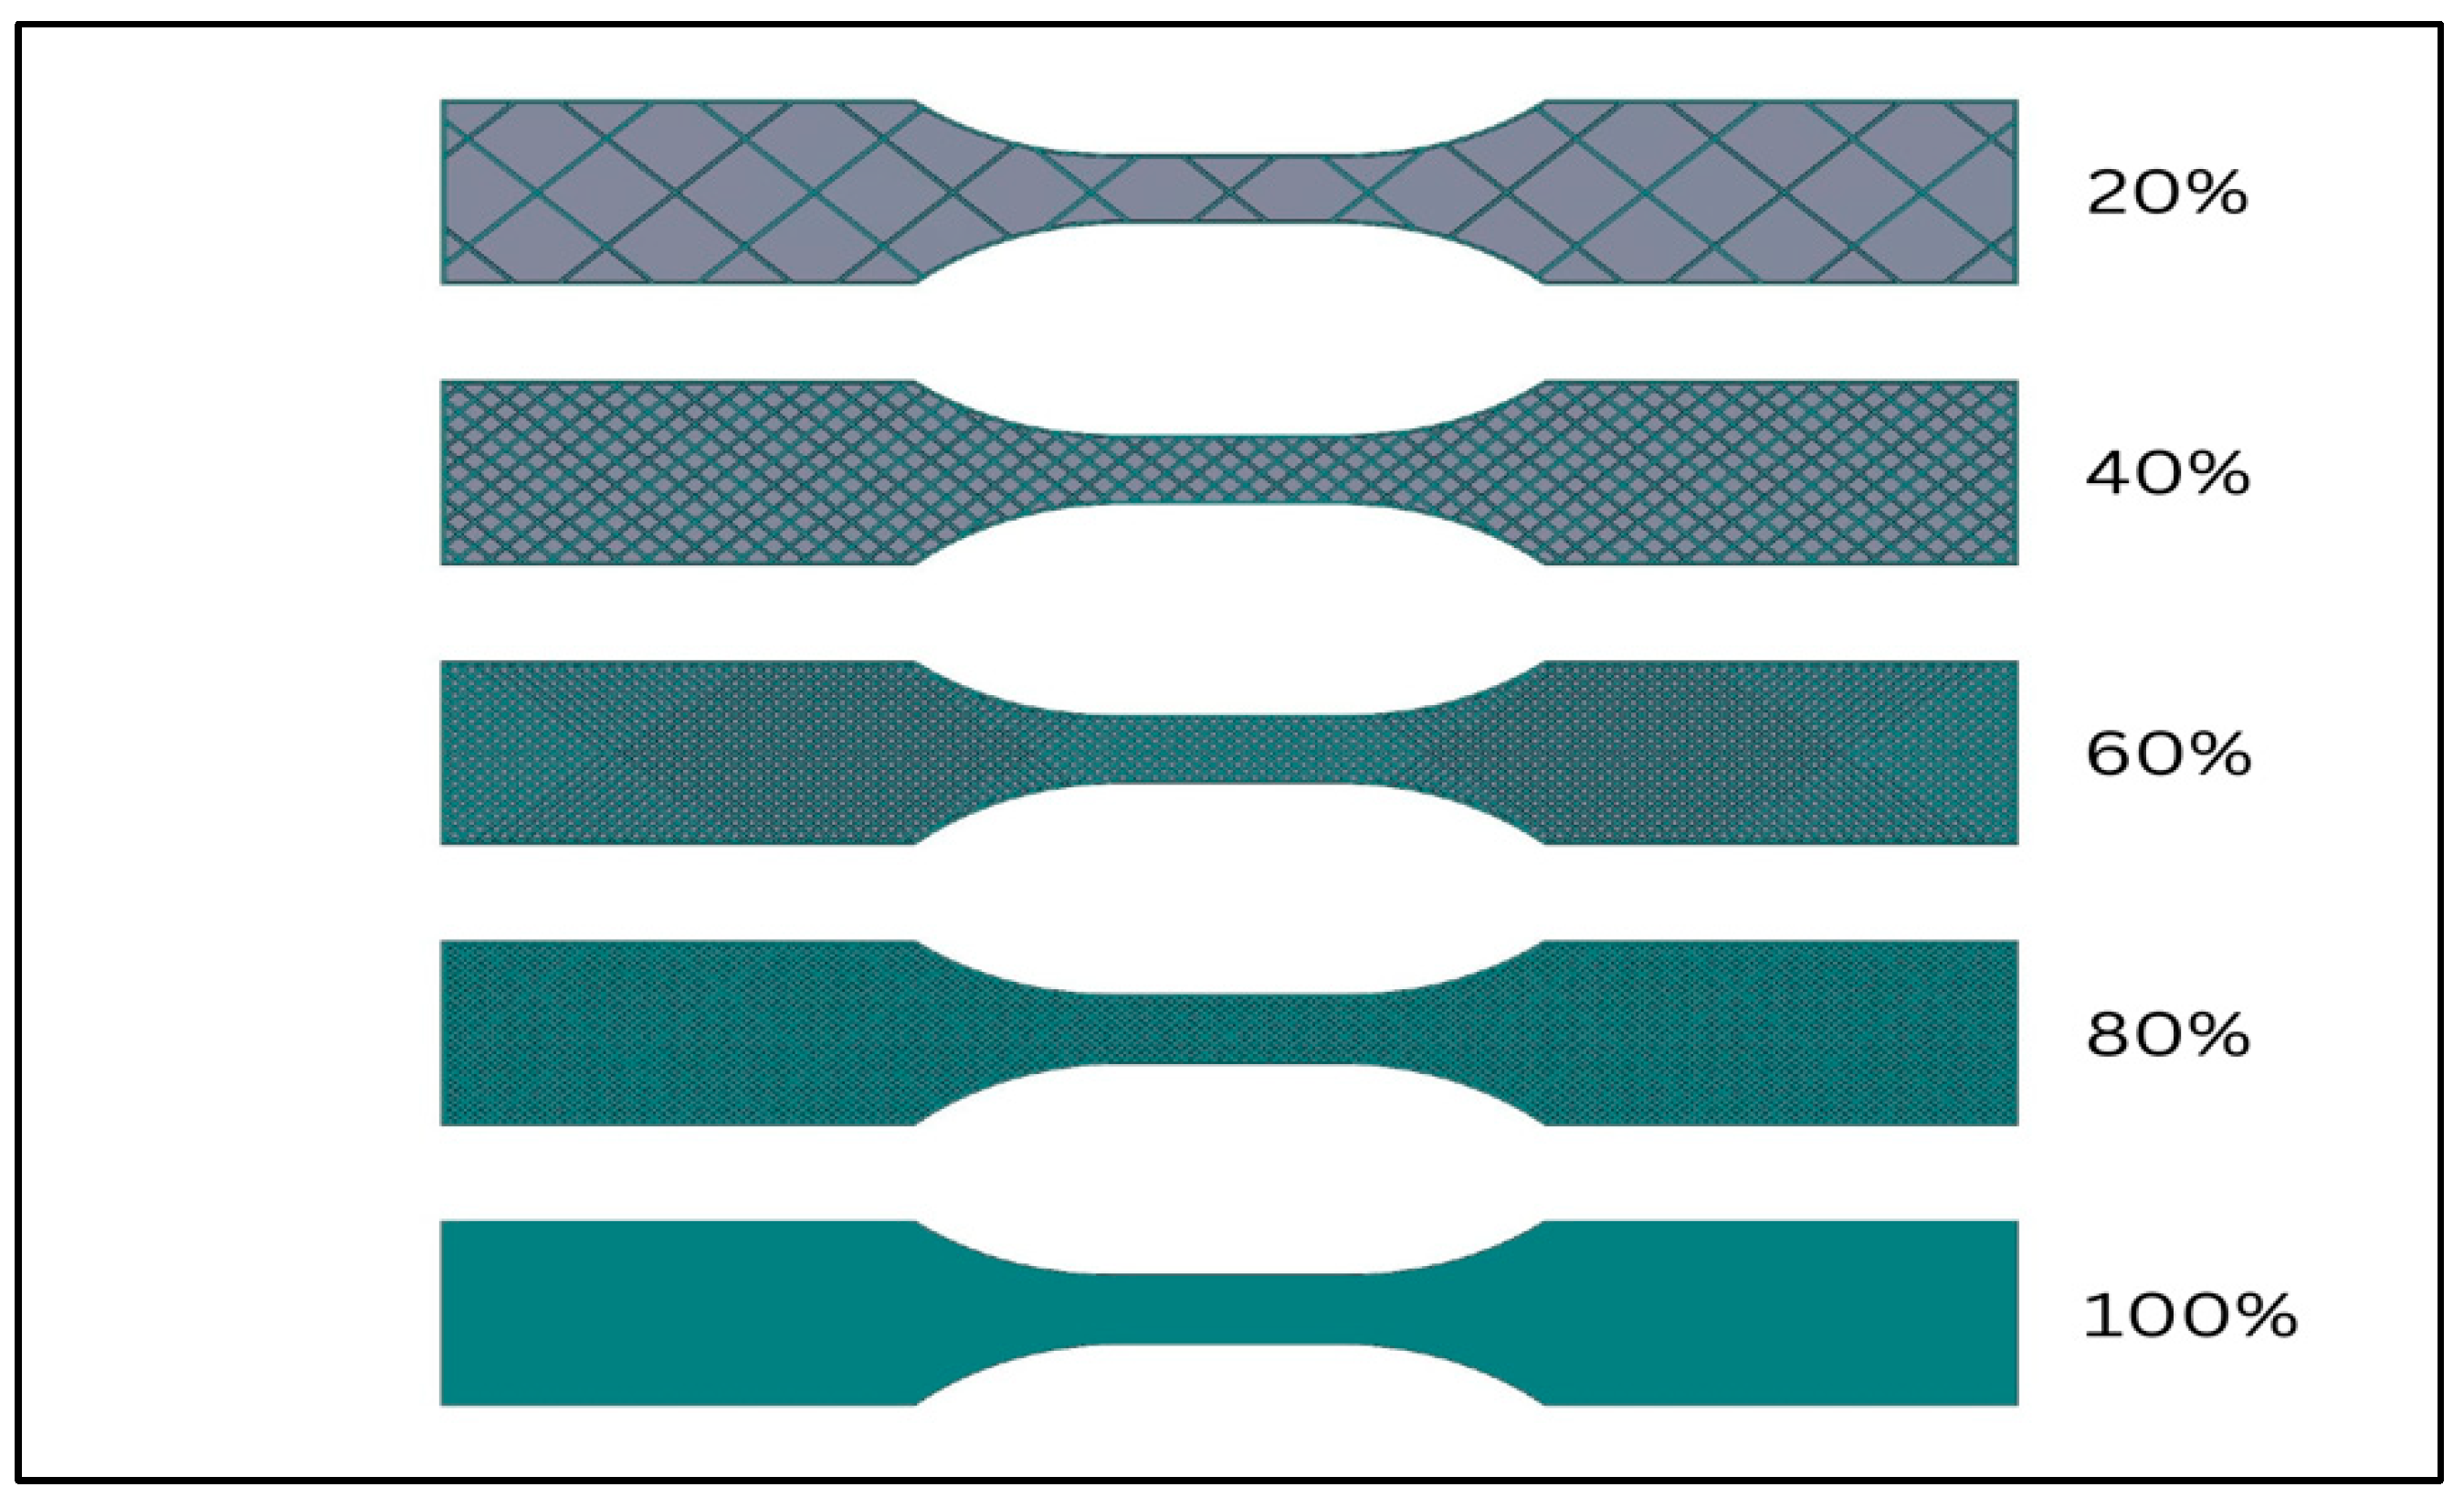
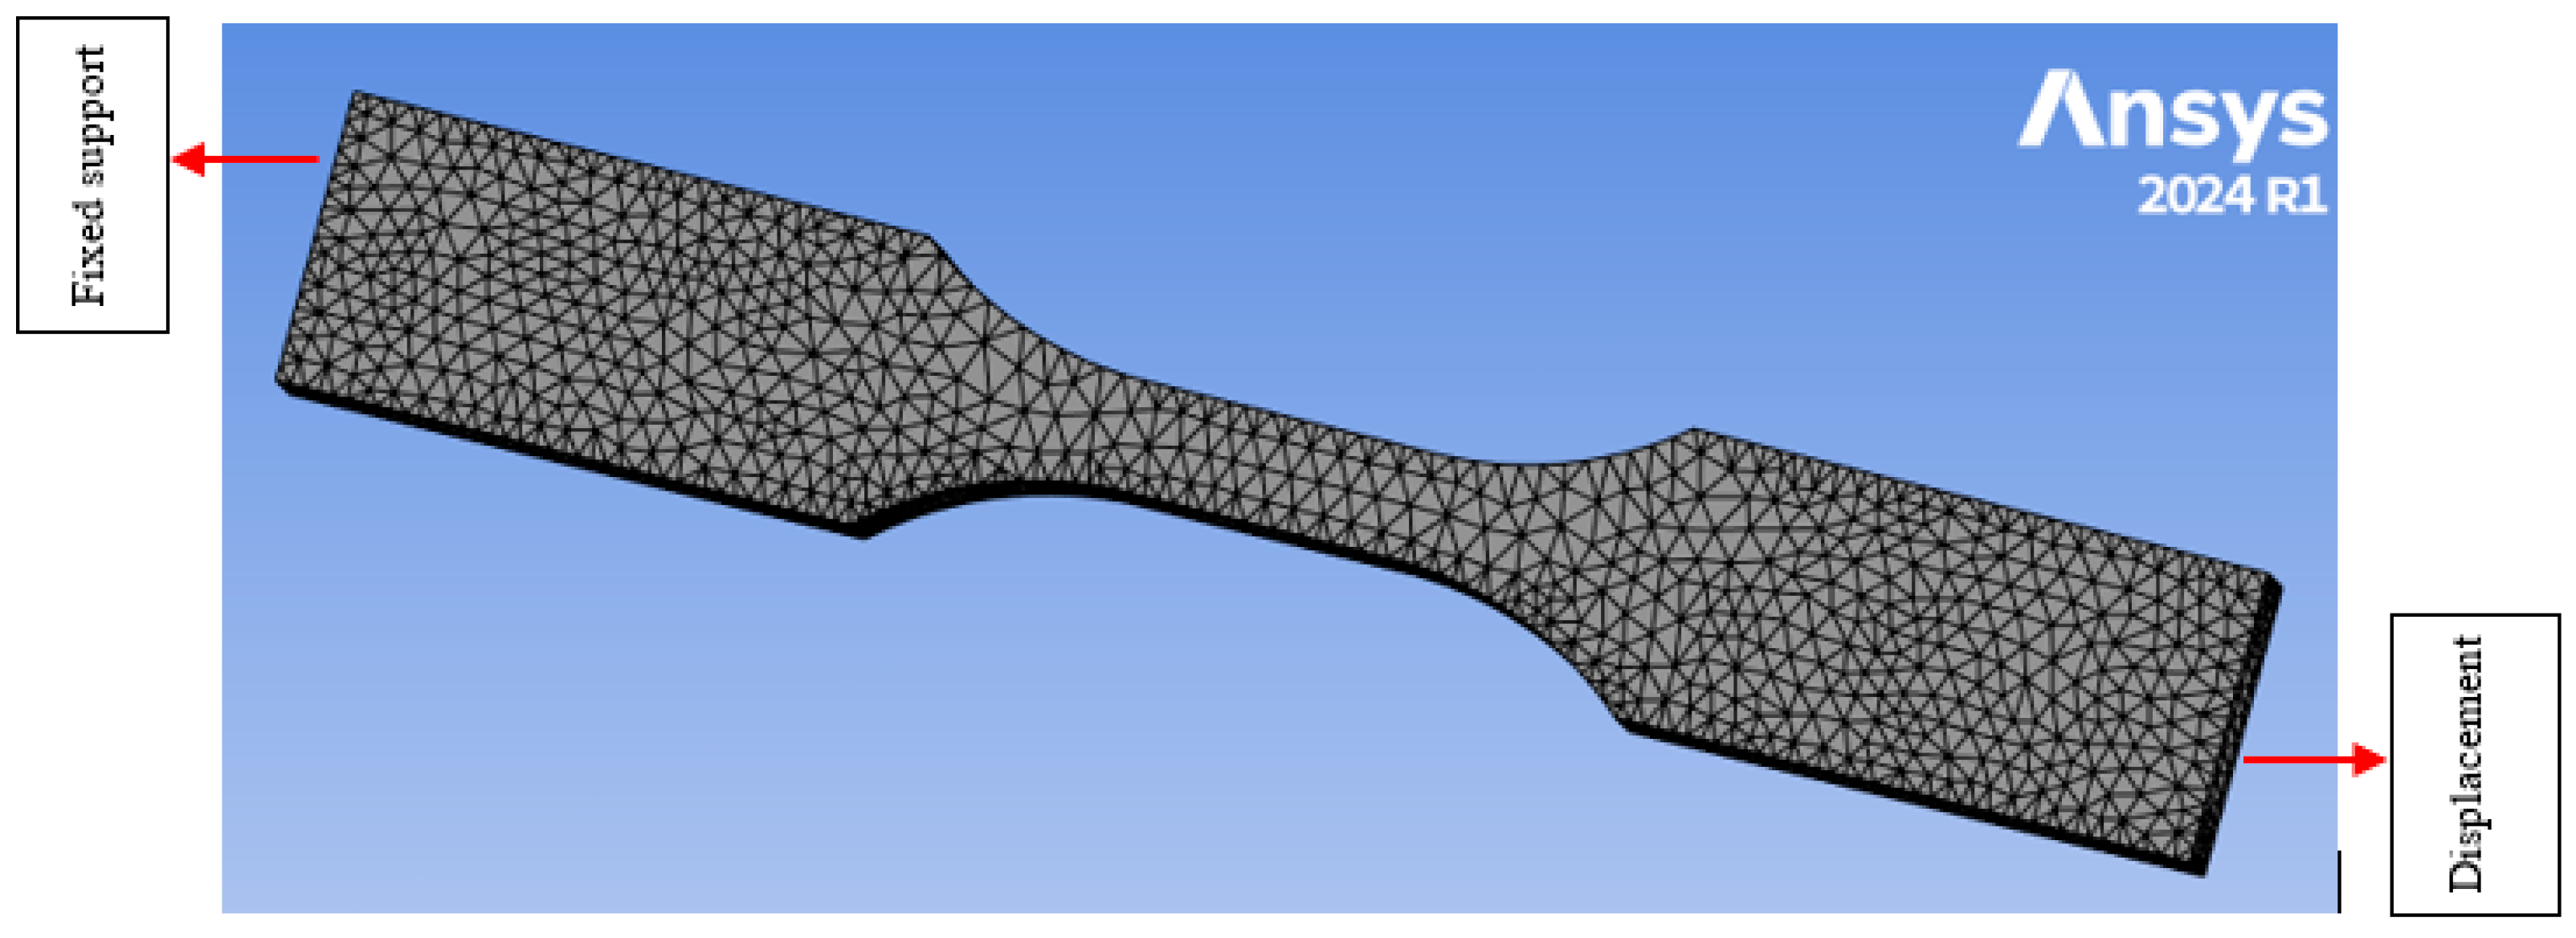
2.1. Three-Dimensional Geometrical Model

For uniaxial tensile testing numerical analysis in Ansys Mechanical, a tensile specimen dog bone geometry for the 3D printed tensile samples was designed using the SolidWorks 2024 version. Figure 2 illustrates the dimensions of the main specimens according to ASTM D638-10. As shown in Figure 3, infill orientation (±45°) was tested, along with five different infill densities of 20%, 40%, 60%, 80%, and 100%. All figures represent an infill line pattern and a width of 0.15 mm.

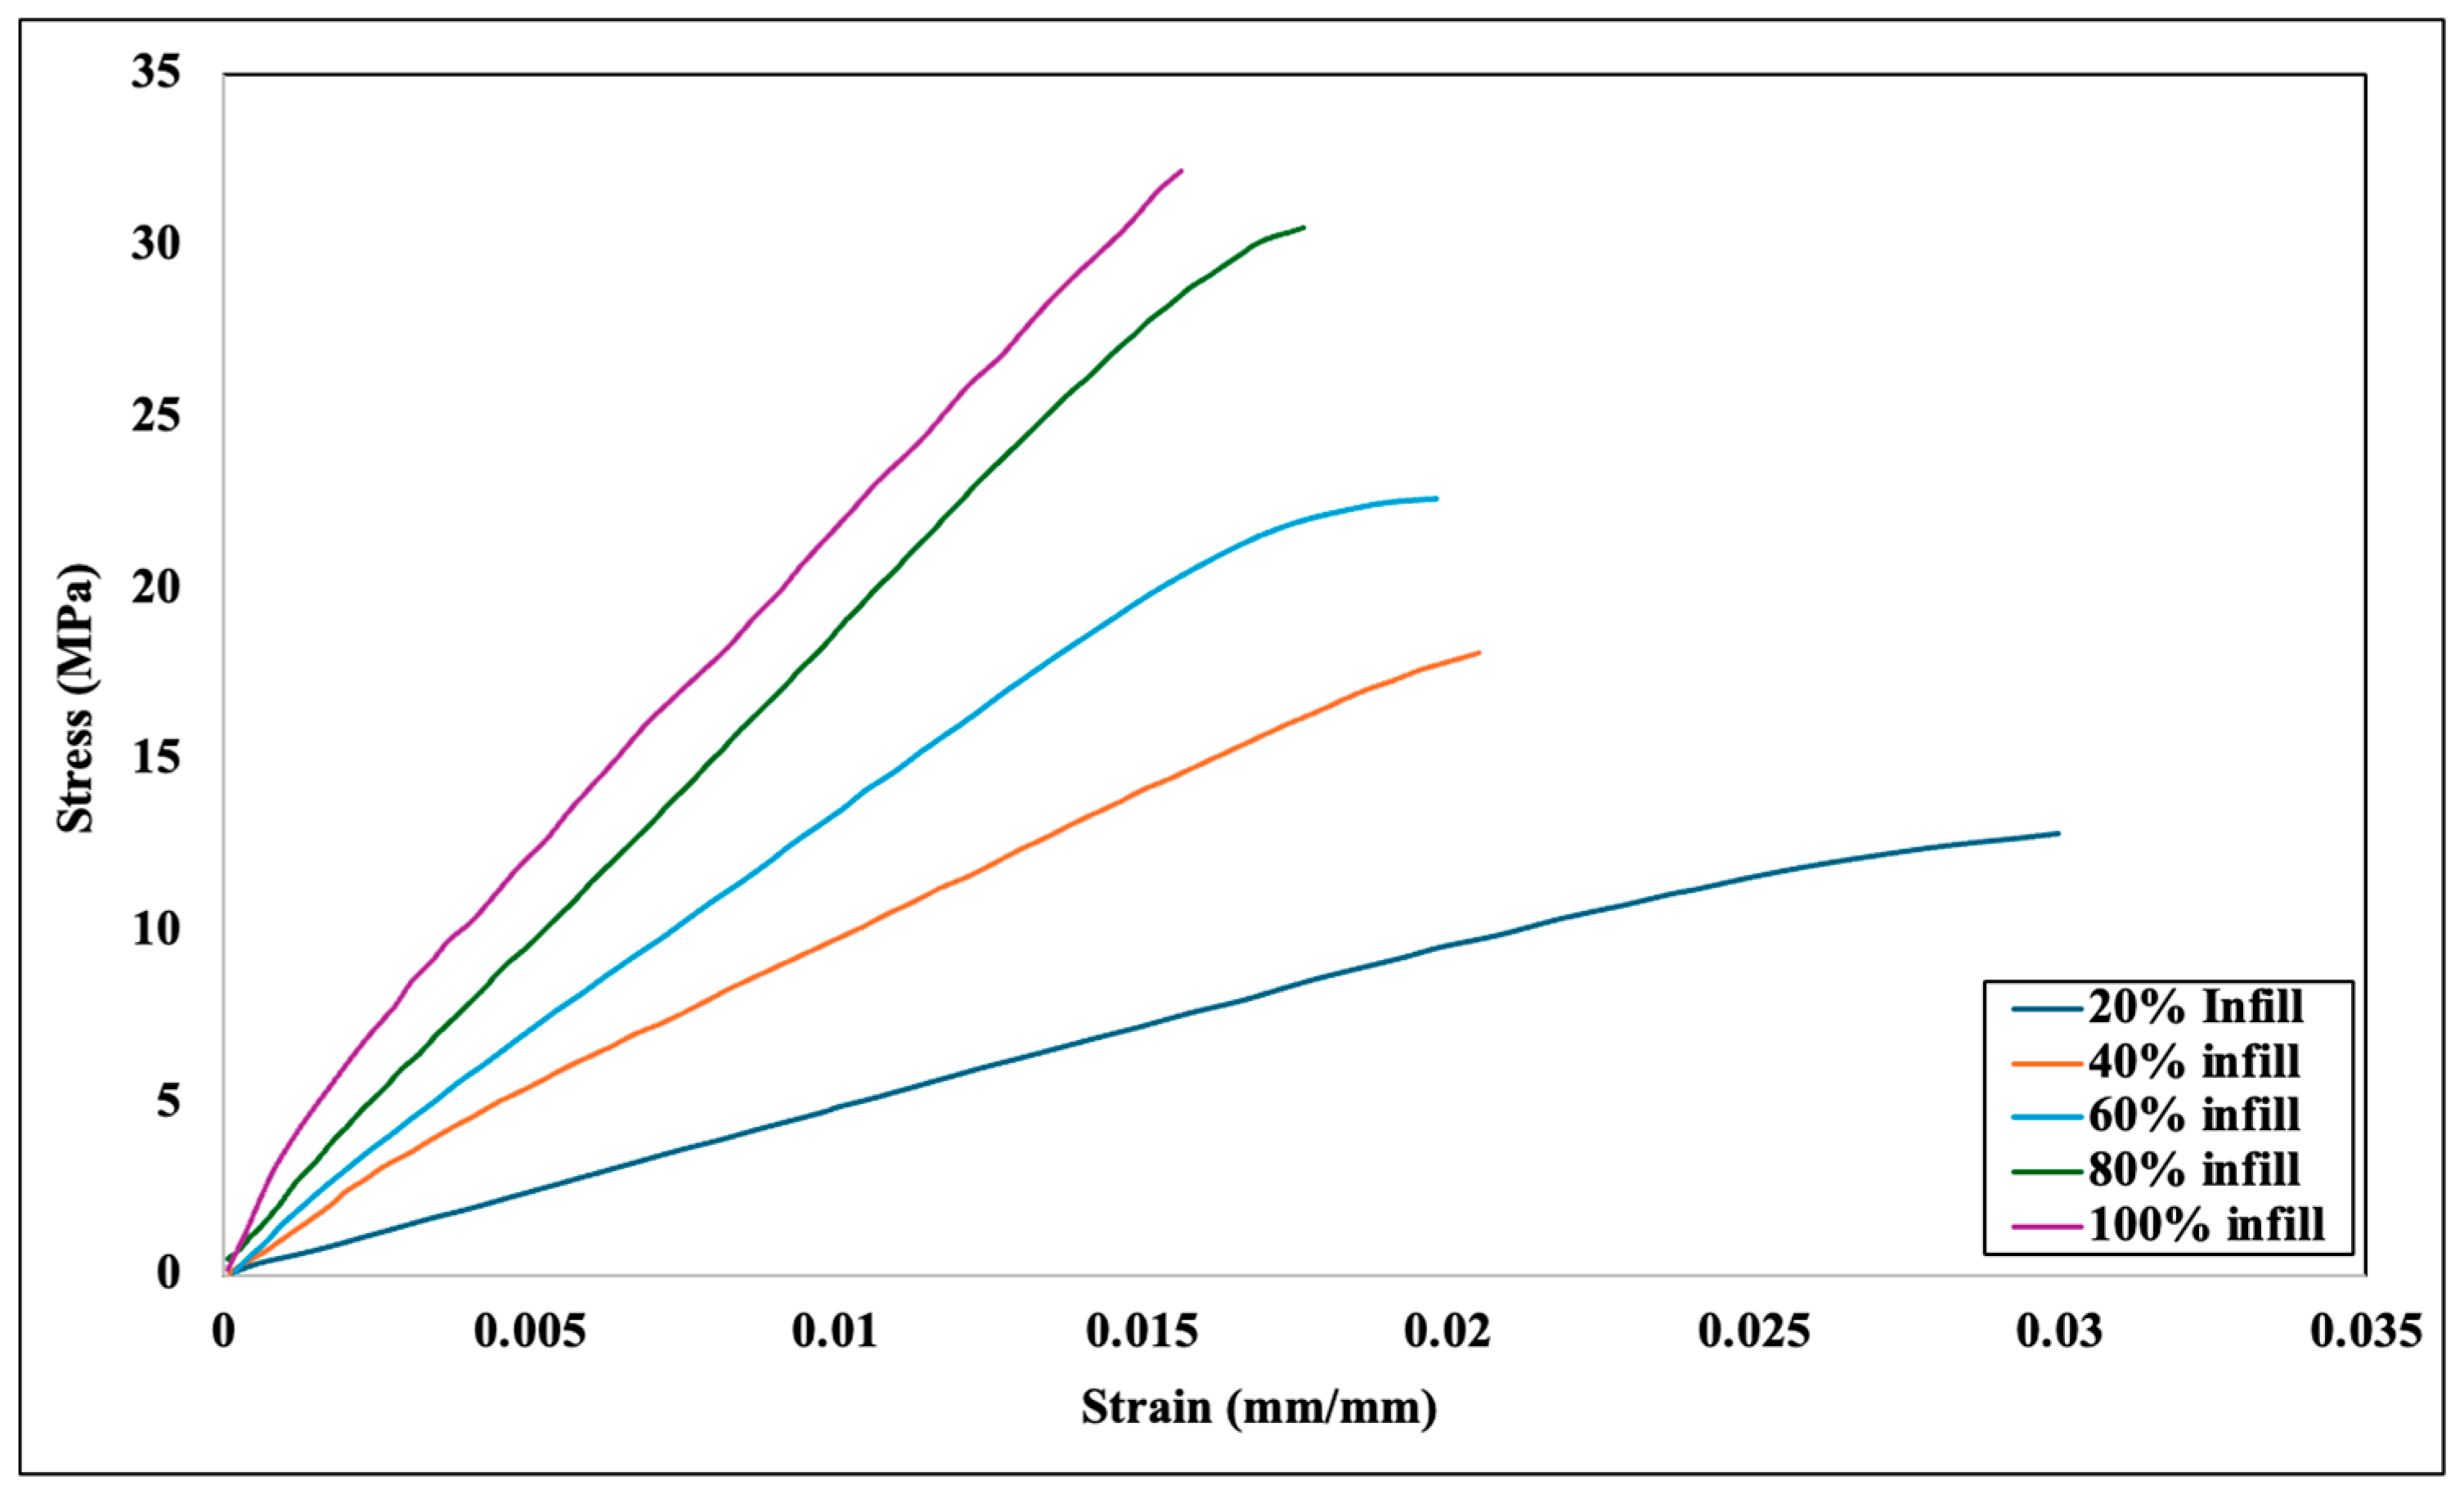
2.2. Experimental Data

In this study, the mechanical behavior and characterization of PLA+ are studied and validated numerically by using the experimental analysis available in the literature [11]. Figure 4 shows the experimental result for ±45-degree infill orientation with 5 infill densities (20%, 40%, 60%, 80%, and 100%). Furthermore, Figure 4 shows that the 100% infill density has the highest stress tolerance and the 20% infill density has the lowest.

2.3. Numerical Analysis Procedure

The numerical analysis was conducted in Ansys Mechanical and utilizes the finite element analysis (FEA) method. FEA usually breaks the whole structure into smaller pieces (such as triangles, squares, rectangles, etc.), solves the governing equations for each element, and at the end, combines all the outcomes to evaluate the overall behavior of the structure under several boundary and loading conditions. In this study, the designed model in Solidworks® 2024 was exported in Ansys Mechanical as an IGS file, and a triangular mesh was generated with a mesh size of 1 mm (Figure 5).
In Ansys Mechanical, one end of the dog bone was kept fixed, and another end was loaded with 100 mm/min, a similar crosshead speed used by Alhazmi and Backer [11]. Experimental data were incorporated in the engineering data section of Ansys Mechanical to fit the curve of four hyperelastic models (neo-Hookean, Mooney–Rivlin with 2 parameters, Yeoh 3rd-order, and the Gent model) for each infill density (Figure 3) before defining boundary conditions. Ansys Mechanical solves a bunch of equations to calculate stress and strain in different sections of the dog bone specimen, and the result is shown in Section 4.

2.4. Strain Energy Density Calculation Methodology from Experimental Data

In this uniaxial tensile test, stress and strain are the primary measured quantities. One sample graph of conducted tests is depicted in Figure 5 for 20% infill density for PLA+. The average modulus of elasticity is 451.48 MPa for 20% infill density [11], which is calculated in the elastic region. It is obvious from Figure 6 that the material response is nonlinear and, consequently, a hyperelastic constitutive equation is required for defining the material’s behavior. However, because of large deflection stress–strain, measurements should have some flaws, and instead of using this, stored energy density computation is needed [9]. According to Yang et al. [9], an inverse analysis (curve fitting procedure) is employed based on force, F, and displacement, s. The strain energy density W becomes
W = 1 V 0 F   d s = 1 A 0 F   d λ
where
  • Initial volume, V0;
  • Initial length, L0;
  • Stretch, λ = L L 0 and d λ = d u L 0 ;
  • Cross-sectional area, A0.
Figure 6. Uniaxial tensile test experimental graph for 20% infill density: (a) stress vs. strain; (b) force vs. stretch; (c) strain energy density vs. stretch.
Machines 13 00091 g006aMachines 13 00091 g006b
Herein, we assume that the material is isochoric, i.e., the volume remains the same throughout the deformation. In Figure 6c, the stored energy was calculated using the described method. Though in this section, the strain energy density and the W calculation graph was shown for 20% infill density of PLA+ as a sample; this method can also be employed for 40%, 60%, 80%, and 100% infill density.

2.5. Hyperelastic Model

From Hook’s law, we know that stress is proportional to strain within the elasticity limit. But this is not true for all materials. Rubber-like materials show large deformation during the tensile test and the stress–strain curve of those materials is nonlinear. The hyperelastic model helps to describe the behavior of materials that undergo large elastic deformation. Many models driven by phenomenology and micro-mechanics have been developed in the literature to describe the elastic and (roughly) incompressible mechanical behavior of such rubber-like materials [19,20].
The strain energy function (SEF) is the fundamental component of a hyperelastic material model and varies based on the material or class of materials being studied [21]. However, the strain energy function (SEF) depends on the strain invariants which are denoted by I1, I2, and I3. Thus, the SEF expressed by Yavari and Goriely [22] is
W = f (I1, I2, I3)
Here, I1, I2, and I3 are the function of λ1, λ2, and λ3. Thus, the function can also be written as
W = f (λ1, λ2, λ3)
In this study, four hyperelastic material models will be studied. They are neo-Hookean, Mooney–Rivlin (2 parameters), Yeoh (3rd-order), and the Ghent model. Details of these models are described below.

2.5.1. Neo-Hookean Model

One of the simplest models is the neo-Hookean model, which just relies on the first invariant I 1 . In the neo-Hookean model, the strain energy function (SEF) for incompressible materials is
W N e o = C 10 I 1 3
where C10 = μ 0 2 and μ 0 is the initial shear modulus. This model performed well when the material had small strains (30%) [23]. Additionally, the neo-Hookean model provides a reliable estimation [19].

2.5.2. Mooney–Rivlin Model

According to Mooney [24] and Rivlin [25], the Mooney–Rivlin model effectively predicts the nonlinear behavior of rubber-like materials. Its general energy density function for incompressible material is
W M R = i = 0 , j = 0   C i j ( I 1 3 ) i ( I 2 3 ) j
where Cij represents experimentally determined material properties. By truncating the series, the commonly used two-parameter Mooney–Rivlin model is obtained:
W M R 2 = C 10 I 1 3 + C 01 I 2 3
where C10 and C01 are material constants. This model demonstrates accuracy over a wide range of deformations. Zhang et al. [26] have shown that the Mooney–Rivlin model performs well in simulating thermoplastic deformation and provides excellent accuracy in predicting the nonlinear behavior of 3D printed components.

2.5.3. Yeoh (3rd-Order) Model

The polynomial-based Yeoh model depends only on the first invariant I1. The third-order Yeoh model is expressed as
W Y e o h = C 10 ( I 1 3 ) + C 20 ( I 1 3 ) 2 + C 30 ( I 1 3 ) 3
where C10, C20, and C30 are material constants. This model is widely used for materials experiencing moderate-to-large deformations. It provides a better fit than the neo-Hookean model, as shown by Barforooshi and Mohammadi [27], and it is also applied to modeling large deformation contact and impact problems [28].

2.5.4. Gent Model

In 1996, Gent introduced a simple two-parameter phenomenological model for hyperelastic isotropic incompressible materials. Based on limiting chain extensibility, the Gent model defines the strain energy density function to have a singularity at a limiting value Im of the first invariant. The strain energy function is
W G e n t = μ J m 2 l n 1 I 1 3 J m
where J m is a material parameter related to the limiting stretch and μ is the shear modulus. The Gent model accurately predicts large nonlinear deformations in soft biological tissues such as arteries and skin [29].

3. Parameter Determination in Hyperelastic Models

The main objective of this study is to evaluate various nonlinear hyperelastic models and perform numerical validation for 3D printed PLA+ material with different linear infill densities. The strain energy density function W , which defines the stored energy per unit volume as a function of deformation, reflects the nonlinear stress–strain relationship of these materials [30]. We follow the methodology outlined by Yang et al. [8] and briefly describe it here. The deformation gradient F is given by
F i j = u i X i + δ i j
as per Ogden [31], where X represents the reference (undeformed) configuration, U denotes the current (deformed) configuration, and δ is a Kroneckerdelta tensor.
δ i j = 1 ,   i = j 0 ,   i   j
The strain energy density function for isotropic hyperelastic materials is typically formulated in terms of the invariants of the right Cauchy–Green deformation tensor C = F T F or the left Cauchy–Green deformation tensor B = F F T . According to the Hamilton–Cayley theorem, a tensor in three-dimensional space has three invariants, namely I 1 , I 2 , and I 3 [32]. Both the left and right deformation tensors share these invariants. For incompressible materials, the first two invariants, I 1 and I 2 , are commonly used. In experiments such as uniaxial, biaxial, or triaxial tensile tests, the stretch ratios λ i (where i = 1 , 2 , 3 ) relate the invariants to the observed stretches as follows:
I 1 = t r C = t r B = λ 1 + λ 2 + λ 3
I 2 = 1 2 ( ( t r ( C ) ) 2 t r ( B 2 ) ) = 1 2 ( ( t r ( B ) ) 2 t r ( B 2 ) ) = λ 1 λ 2 + λ 2 λ 3 + λ 3 λ 1
I 3 = det C = det B = λ 1 λ 2 λ 3
Assuming incompressibility, we have I 3 = 1 . For a uniaxial tensile test, this becomes
λ 1 = λ , λ 2 = λ 3 = 1 λ
Hence, the deformation gradient and deformation tensor are
F = λ 0 0 0 1 λ 0 0 0 1 λ , B = λ 2 0 0 0 1 λ 0 0 0 1 λ
The resulting invariants are
I 1 = λ 2 + 2 λ , I 2 = 2 λ + 1 λ 2 , I 3 = 1
In this paper, PLA+ material is considered as incompressible. Thus, I3 can be ignored, as it shows a constant value. As a result, SEF depends on I1 and I2 only.

3.1. Inverse Analysis

Each model is analyzed by using inverse analysis and comparing their accuracy in fitting experimental data. The Levenberg–Marquardt approach, which is a nonlinear regression, is commonly used to determine the parameters due to the nonlinearity [33]. The linear regression findings are shown in Figure 7, where the experimental data are represented by the black dotted line and the fit curve by the red dotted line. R-squared (R2) is what we use to gauge how accurate the fit curve is. It is defined as a statistical measure as follows:
R 2 = 1 S r e s S t o t a l
Using the total sum of squares, Stotal, and the residual sum of squares, Sres, i.e.,
S t o t a l = i ( x i x ) 2 ; S r e s = i ( x i f i ) 2
where fi symbolizes the fitted data for a dataset with n values marked by x1… xi… xn, and the mean value is
x = 1 n i = 1 n x i
Figure 7. Experimental and numerical stress–strain comparison for different hyperelastic models: (a) 20%, (b) 40%, (c) 60%, (d) 80%, (e) 100% infill density.
Machines 13 00091 g007aMachines 13 00091 g007bMachines 13 00091 g007c

3.2. Curve Fitting for Hyperelastic Model

For linear elasticity, Young’s modulus is considered as the material property, and it defines the characteristics of the material. However, for the hyperelastic materials model, Young’s modulus cannot define the material’s properties; rather, materials constant of the hyperelastic model characterize the materials properties for rubber−like materials. These coefficients cannot be measured directly by any means, though they can be measured by fitting experimental data for different hyperelastic models. Figure 7 shows the curve fitting for different hyperelastic models for 20%, 40%, 60%, 80%, and 100% infill density, respectively. These curve fitting graphs were obtained from the engineering data section of Ansys Mechanical after incorporating experimental stress−strain data. After analyzing all the curve fitting, it can be assumed that all the curves have reasonable fitting against the experimental data, though neo−Hookean depicts slightly less fit at a higher infill density. Thus, all the numerical analyses can be performed for all the hyperelastic models. All the parameters of the four hyperelastic models were obtained based on the curve fitting shown in Figure 6 and are accumulated in Table 1.

4. Results and Discussion

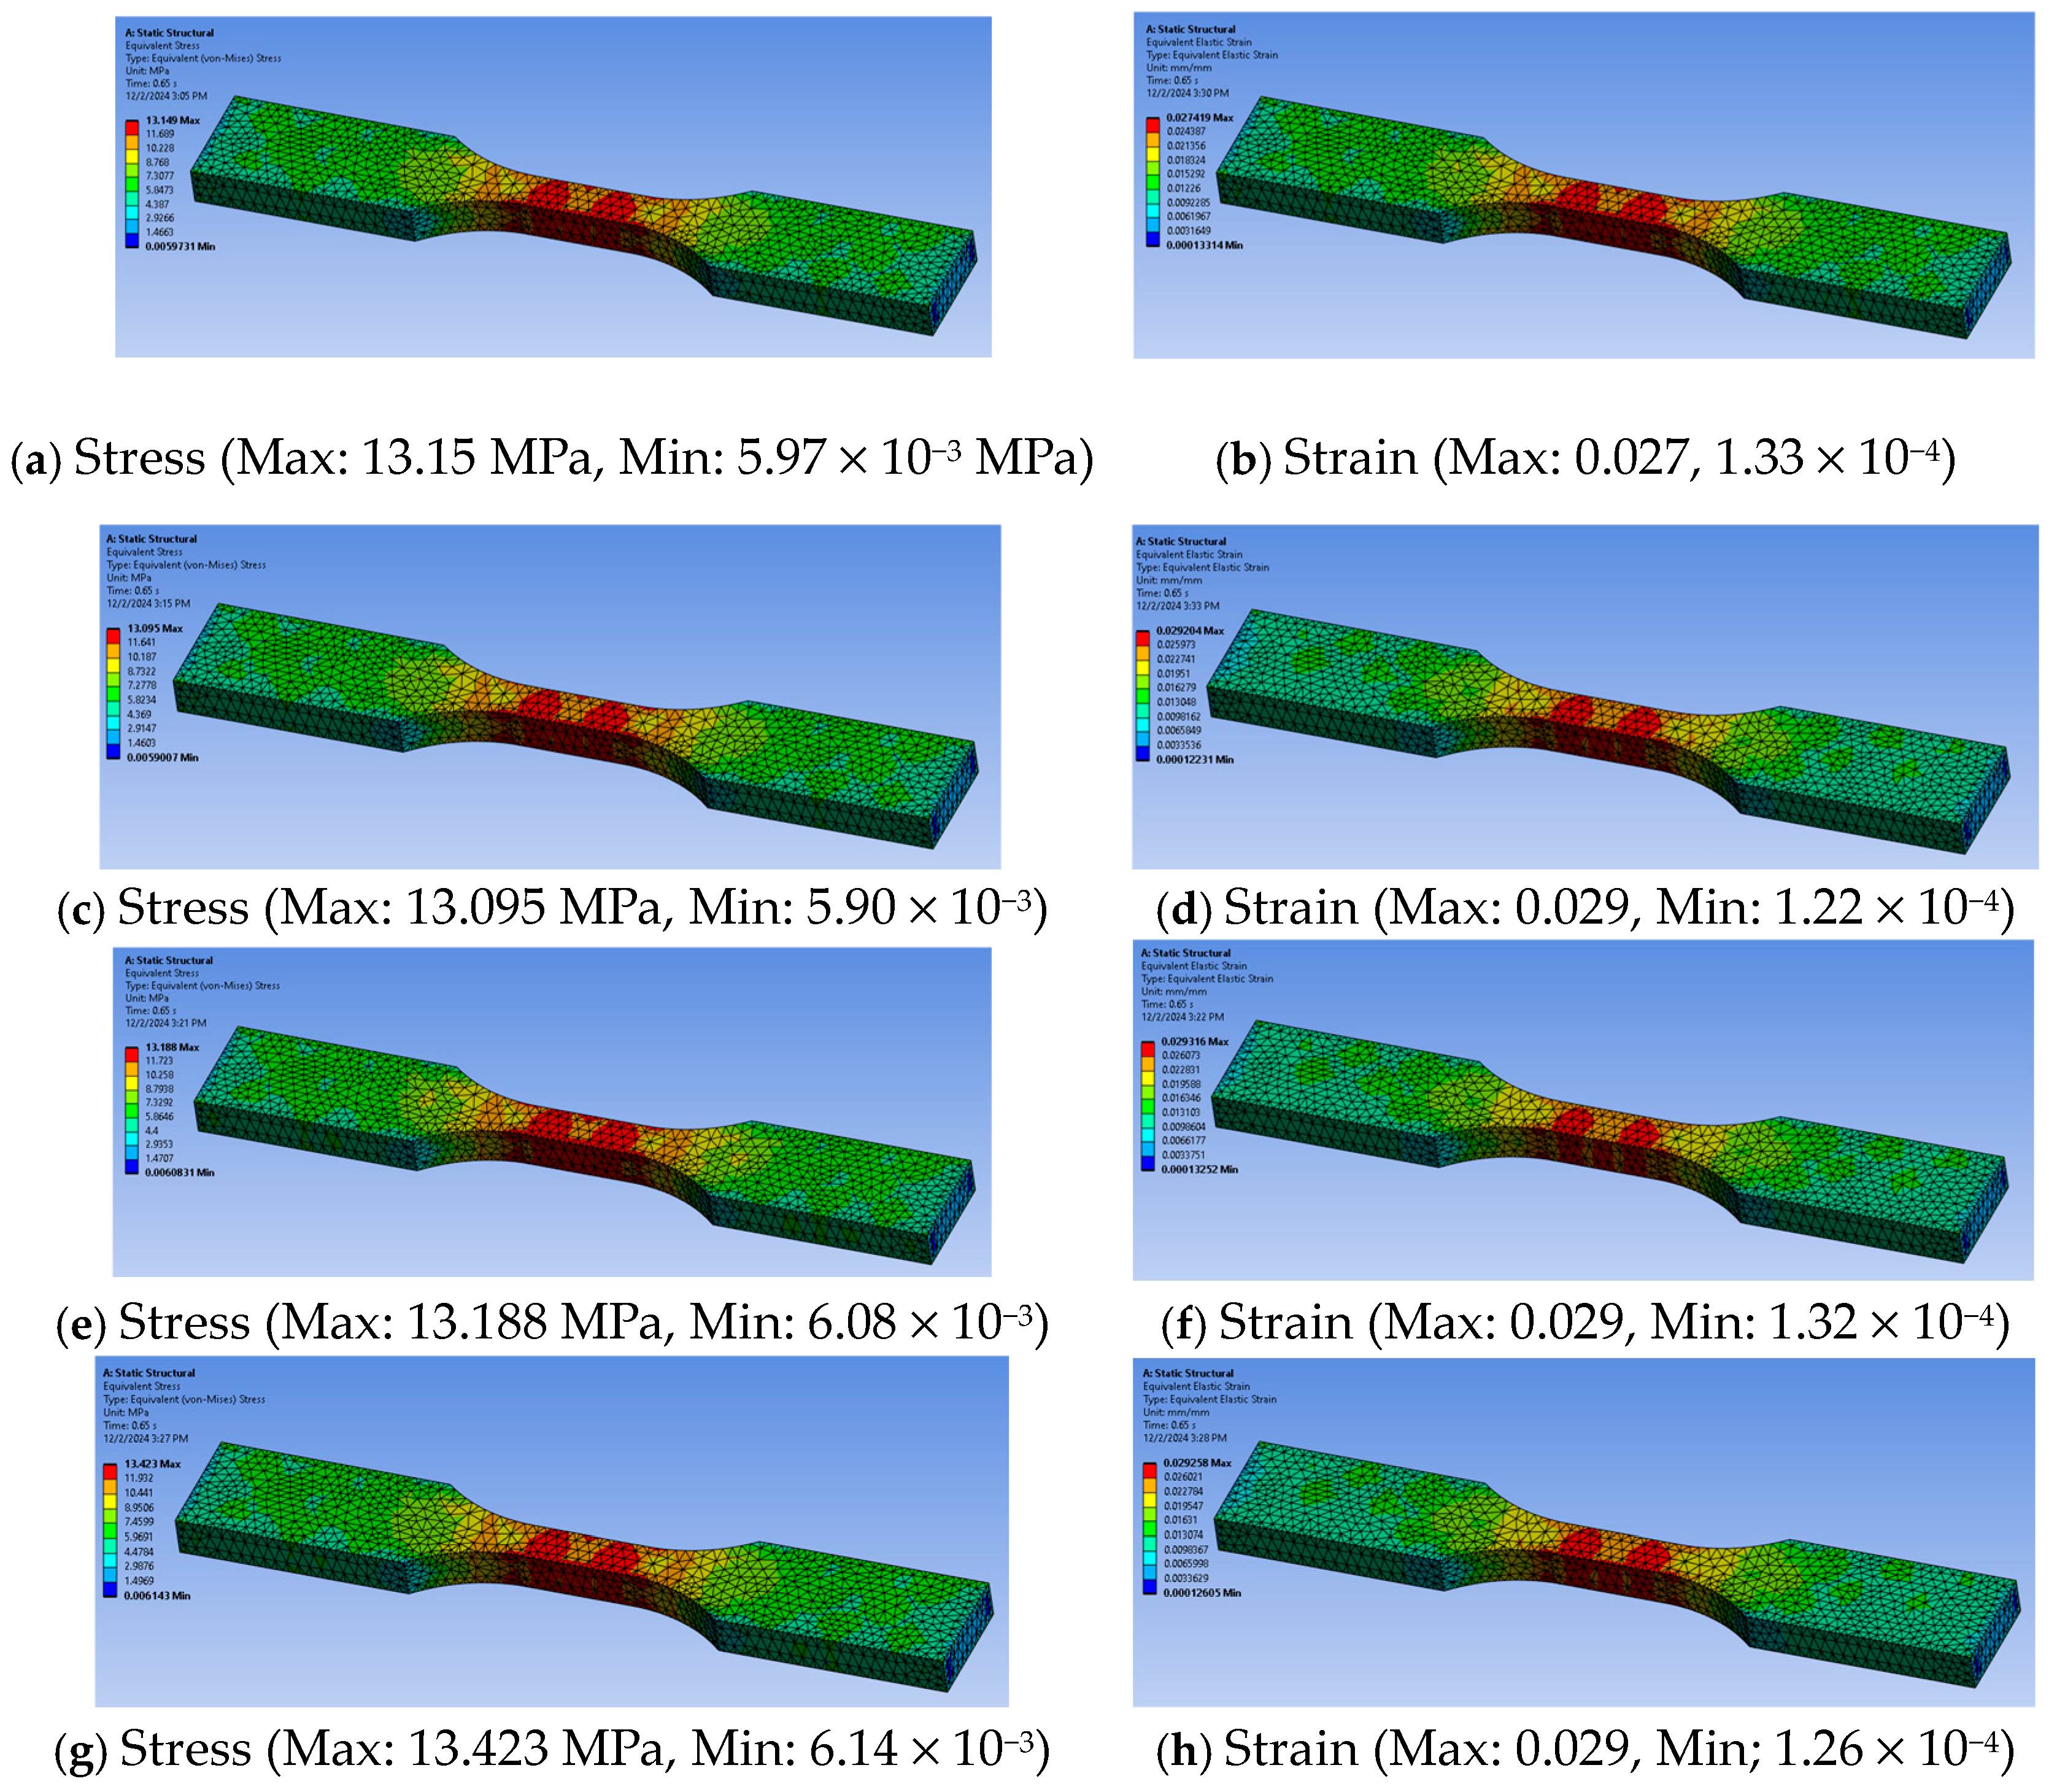
4.1. Finite Element Analysis (FEA)

The numerical analysis in the study was conducted using the commercial software program Ansys (R2024) as an FEA tool. Numerous engineering specialties can benefit from the usage of the robust, multifunctional Ansys application [34]. Ansys utilizes the finite element analysis (FEA) method, which essentially breaks down a complex structure into smaller, simpler elements (like tiny triangles or squares or other shapes) and solves the governing physics equations for each element, then assembles the results to determine the overall behavior of the structure under applied loads and boundary conditions. In this study, the designed dog bone specimen in SolidWorks was imported to Ansys Mechanical, and material properties were obtained from Section 3.2. After running the simulation, Ansys Mechanical solved a system of linear equations to calculate stresses and strains across the structure. For instance, Figure 8 shows the simulation result for the 20% infill density for four hyperelastic models.
After analyzing Figure 8, it can be said that all the stress is concentrated around the narrow section (gauge length) of the dog bone. However, more stress is found on the middle of the narrow section. Thus, it can be assumed that it broke down at the middle of the narrow section. In Figure 8, maximum stresses and strain are almost like experimental values (Figure 4) which validate the simulation result of four hyperelastic models. In this study, possible numerical validation was conducted by stress–strain comparison and strain energy density–stretch comparison for four hyperelastic models. Both analyses are described in the next section.

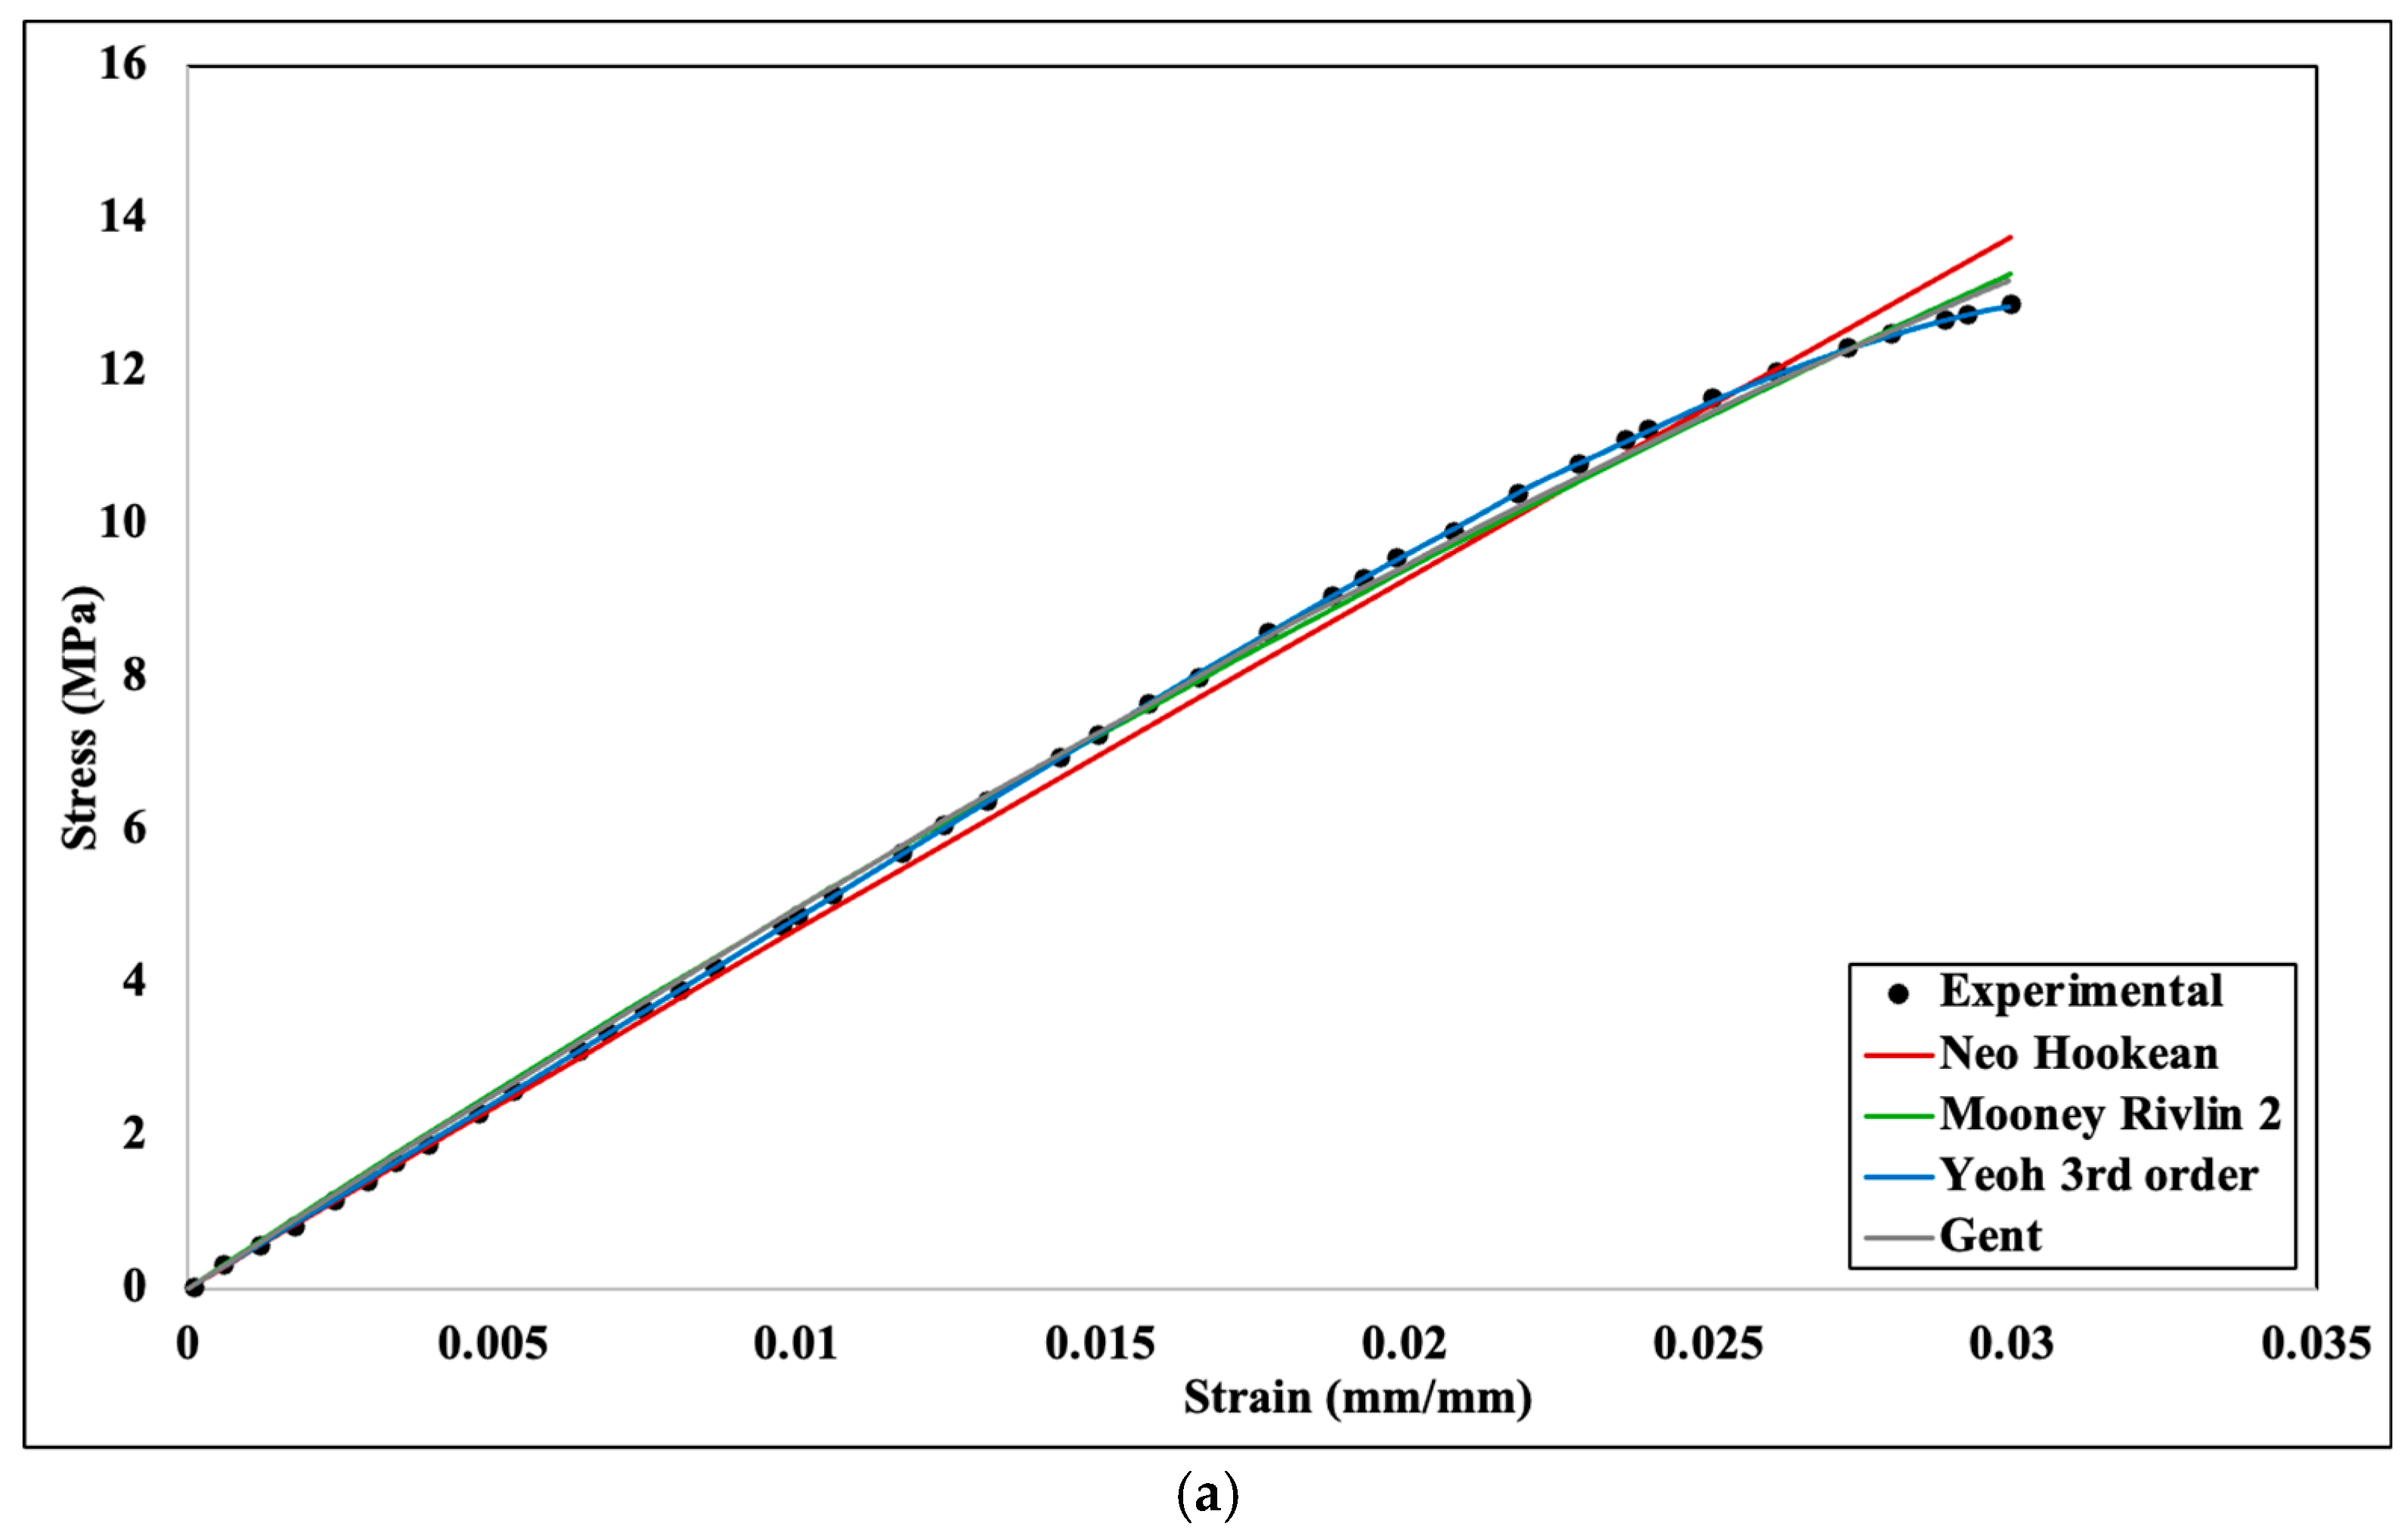
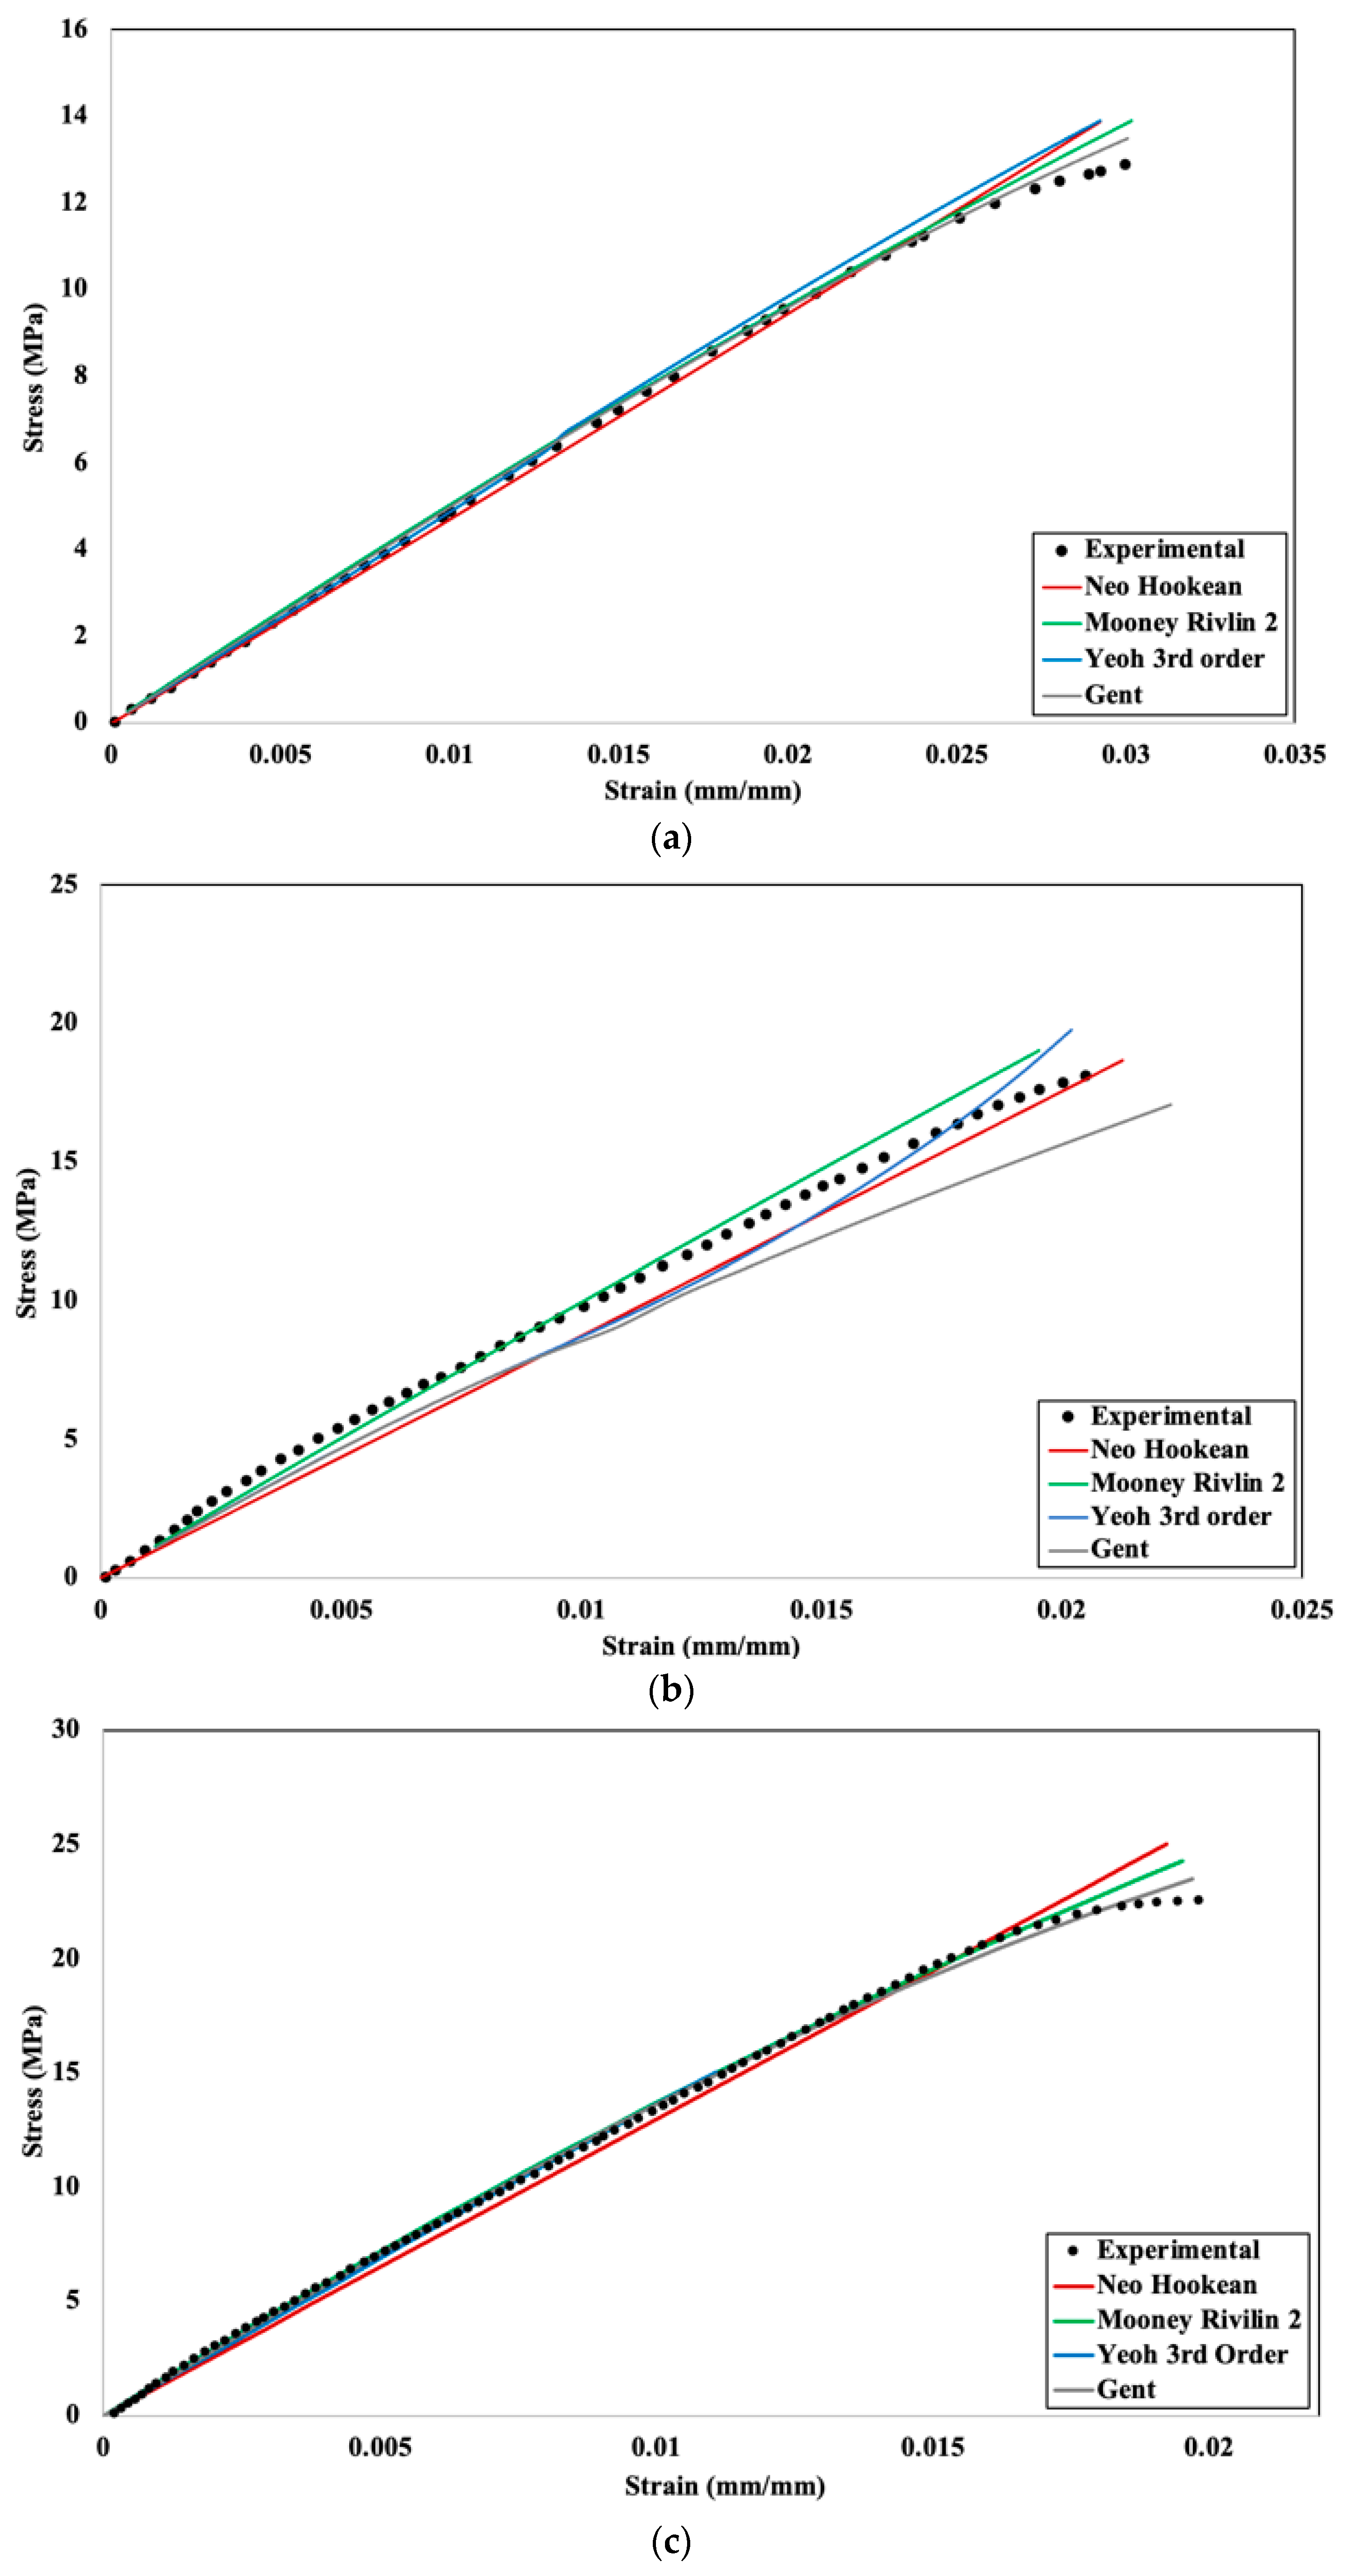
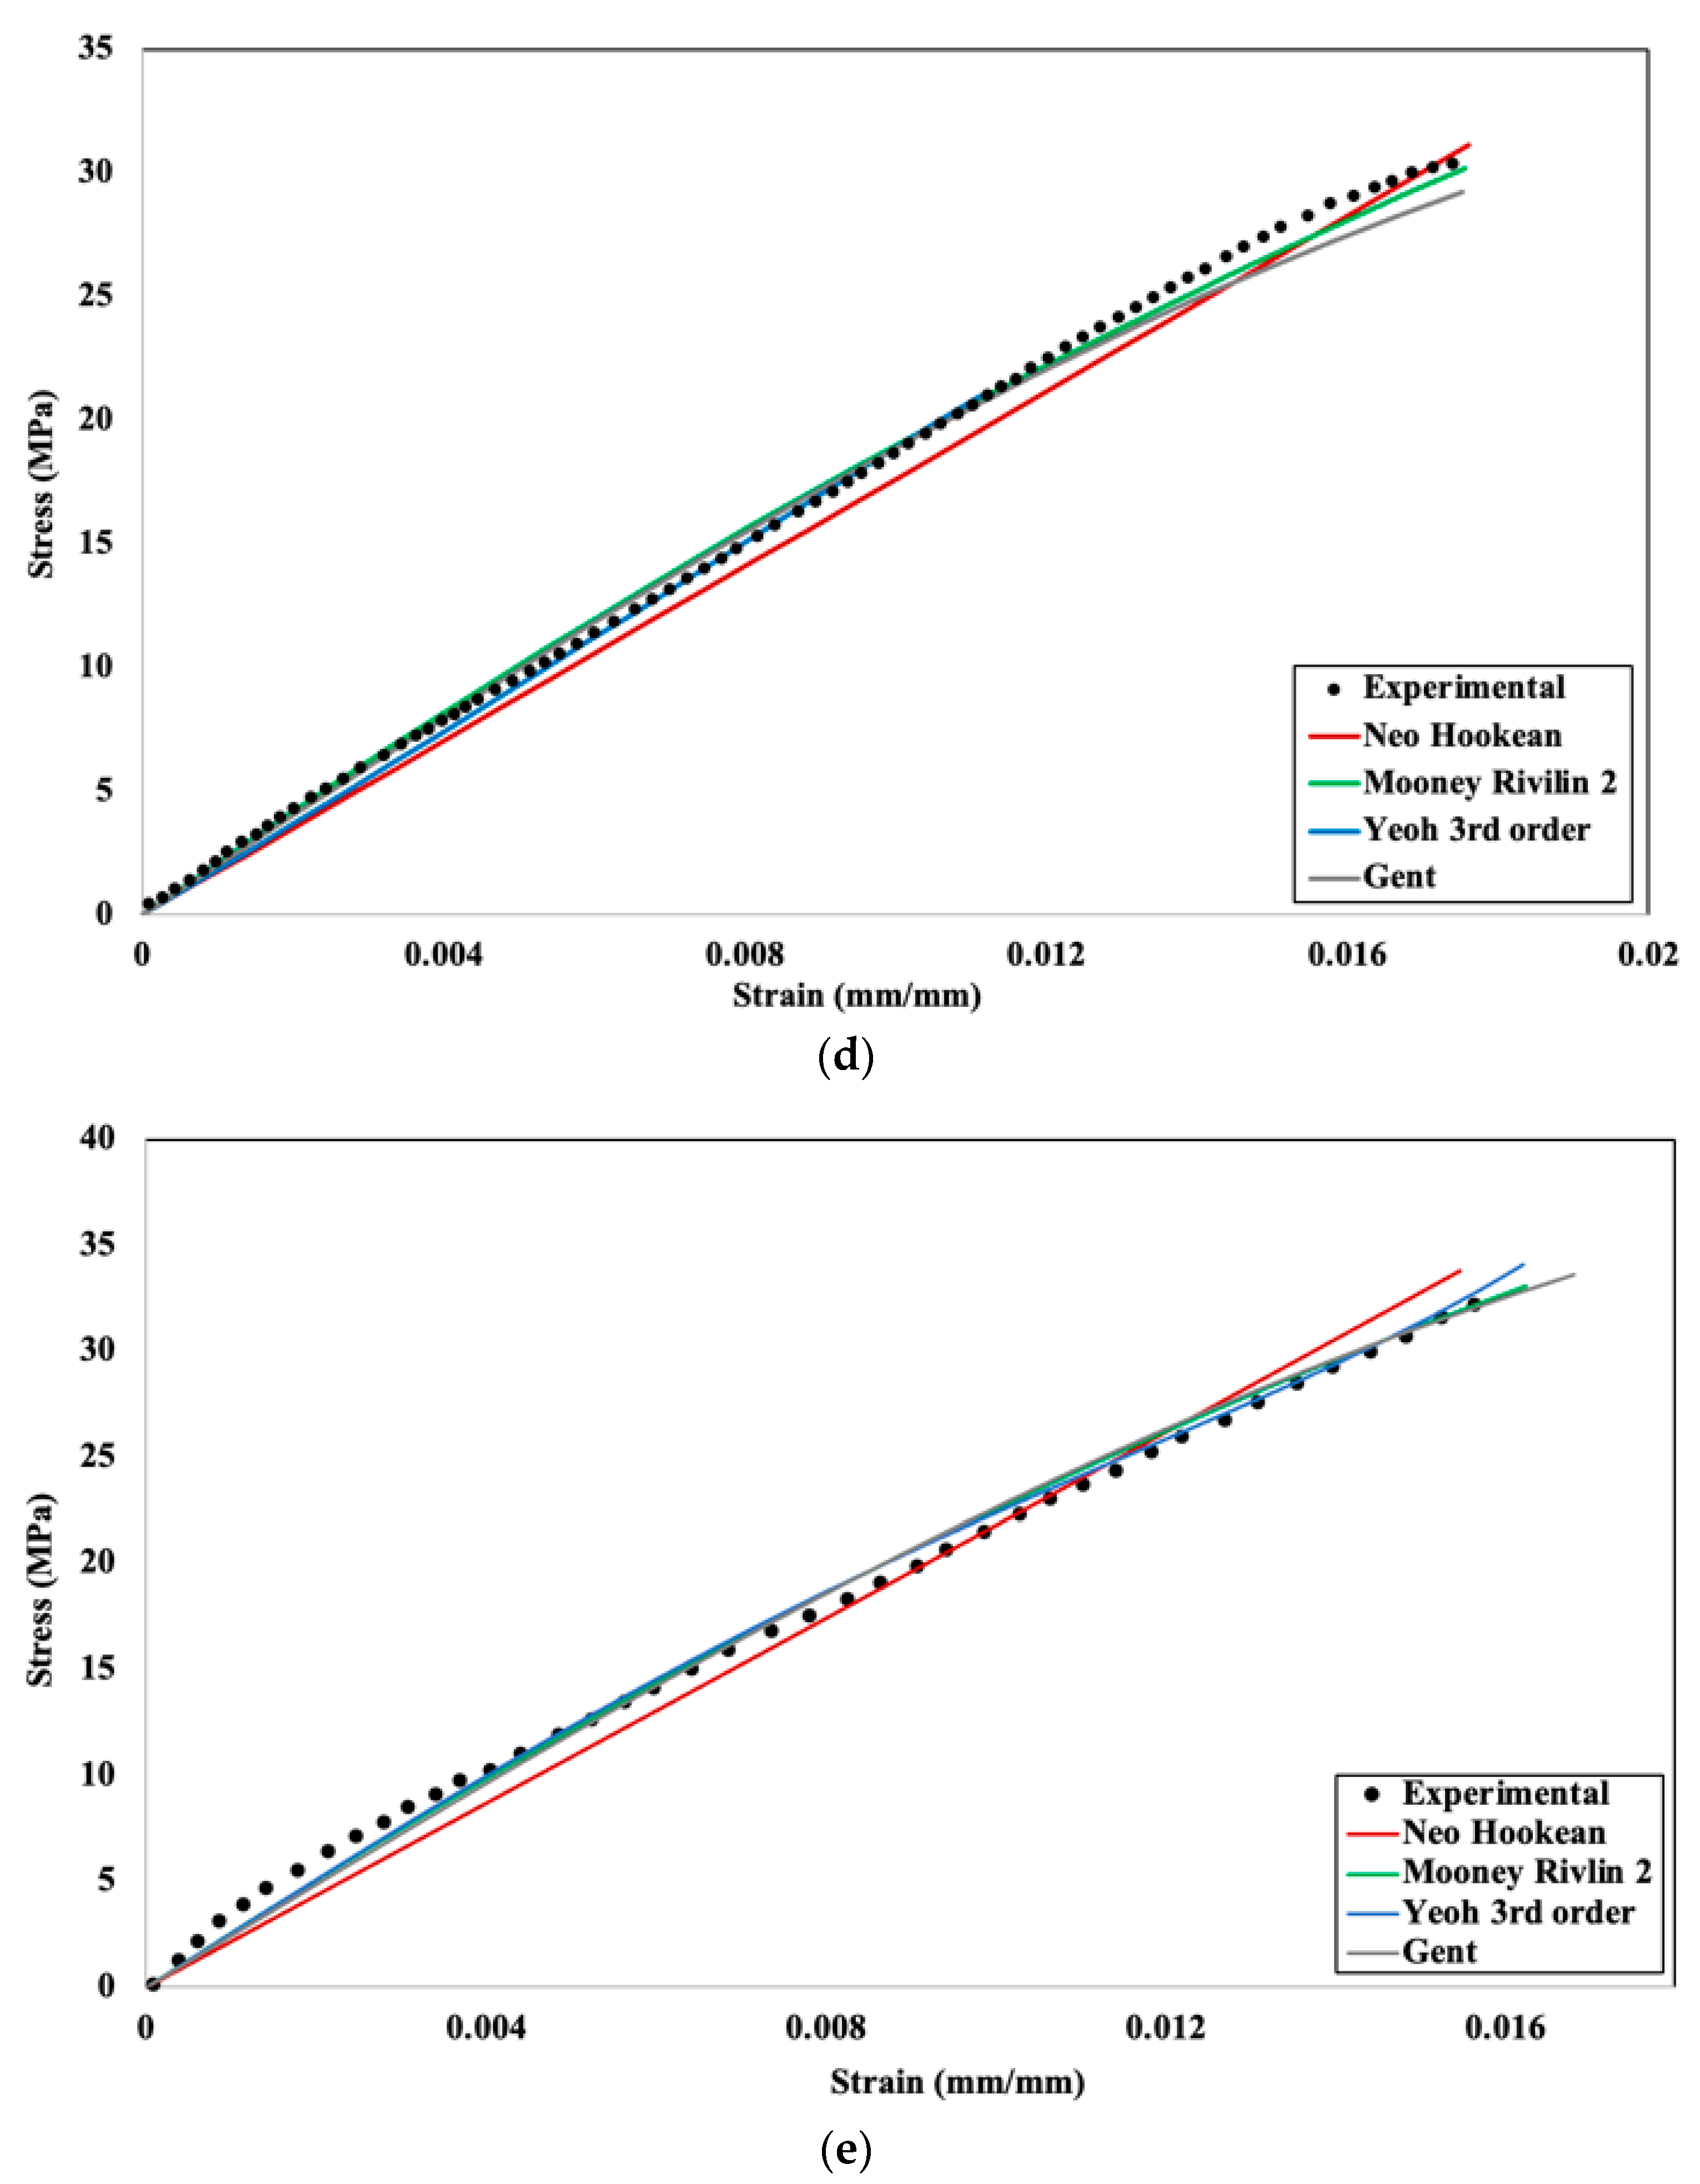
4.2. Numerical Validation with Stress–Strain Comparison

Numerical simulation was conducted using PLA+ material using different infill densities (20%, 40%, 60%, 80%, and 100%) with four different hyperplastic models, namely neo–Hookean, Mooney–Rivlin two–parameter, Yeoh third–order, and the Gent model, for comparison with the experimental results. Figure 9 shows the comparison of stress–strain with the hyperelastic model and experimental data.
From Figure 9, it can be concluded that all the hyperelastic models are generally a good fit for the numerical analysis of stress–strain behavior, with results closely aligning with experimental observations. At lower infill densities, the material exhibits a higher percentage of voids and a more open cellular structure, which deforms more uniformly under applied loads. This structure leads to a stress–strain response that is linear or only mildly nonlinear, making it easier for most models to approximate the behavior accurately. However, for 40% infill density (Figure 9b), noticeable variations are observed between simulation results and experimental data. The Mooney–Rivlin two-parameter model demonstrates superior performance under these conditions, as it is particularly suited for moderate-to-large deformations. This model offers improved accuracy over the neo-Hookean model, especially under uniaxial stress, due to its ability to account for more complex material behavior. In contrast, the Gent model shows significant deviation at this infill density. The deviation arises because the Gent model’s accuracy depends heavily on the precise determination of Jm, the material parameter representing the limiting chain extensibility. The experimental data for the 40% infill density lacks a consistent trend, making it challenging to accurately determine Jm. This limitation impacts the curve fitting process and, consequently, the simulation results. Additionally, the Gent model is less reliable for small deformations compared to the neo-Hookean and Mooney–Rivlin models, as its strain energy density formulation becomes less linear in this regime. The neo-Hookean and Mooney–Rivlin models, on the other hand, align better with the assumptions of linear elasticity and provide a more accurate representation of the material’s behavior for small strains. These findings highlight the importance of selecting appropriate hyperelastic models based on the deformation range and the accuracy of input parameters, particularly for materials with intermediate infill densities.

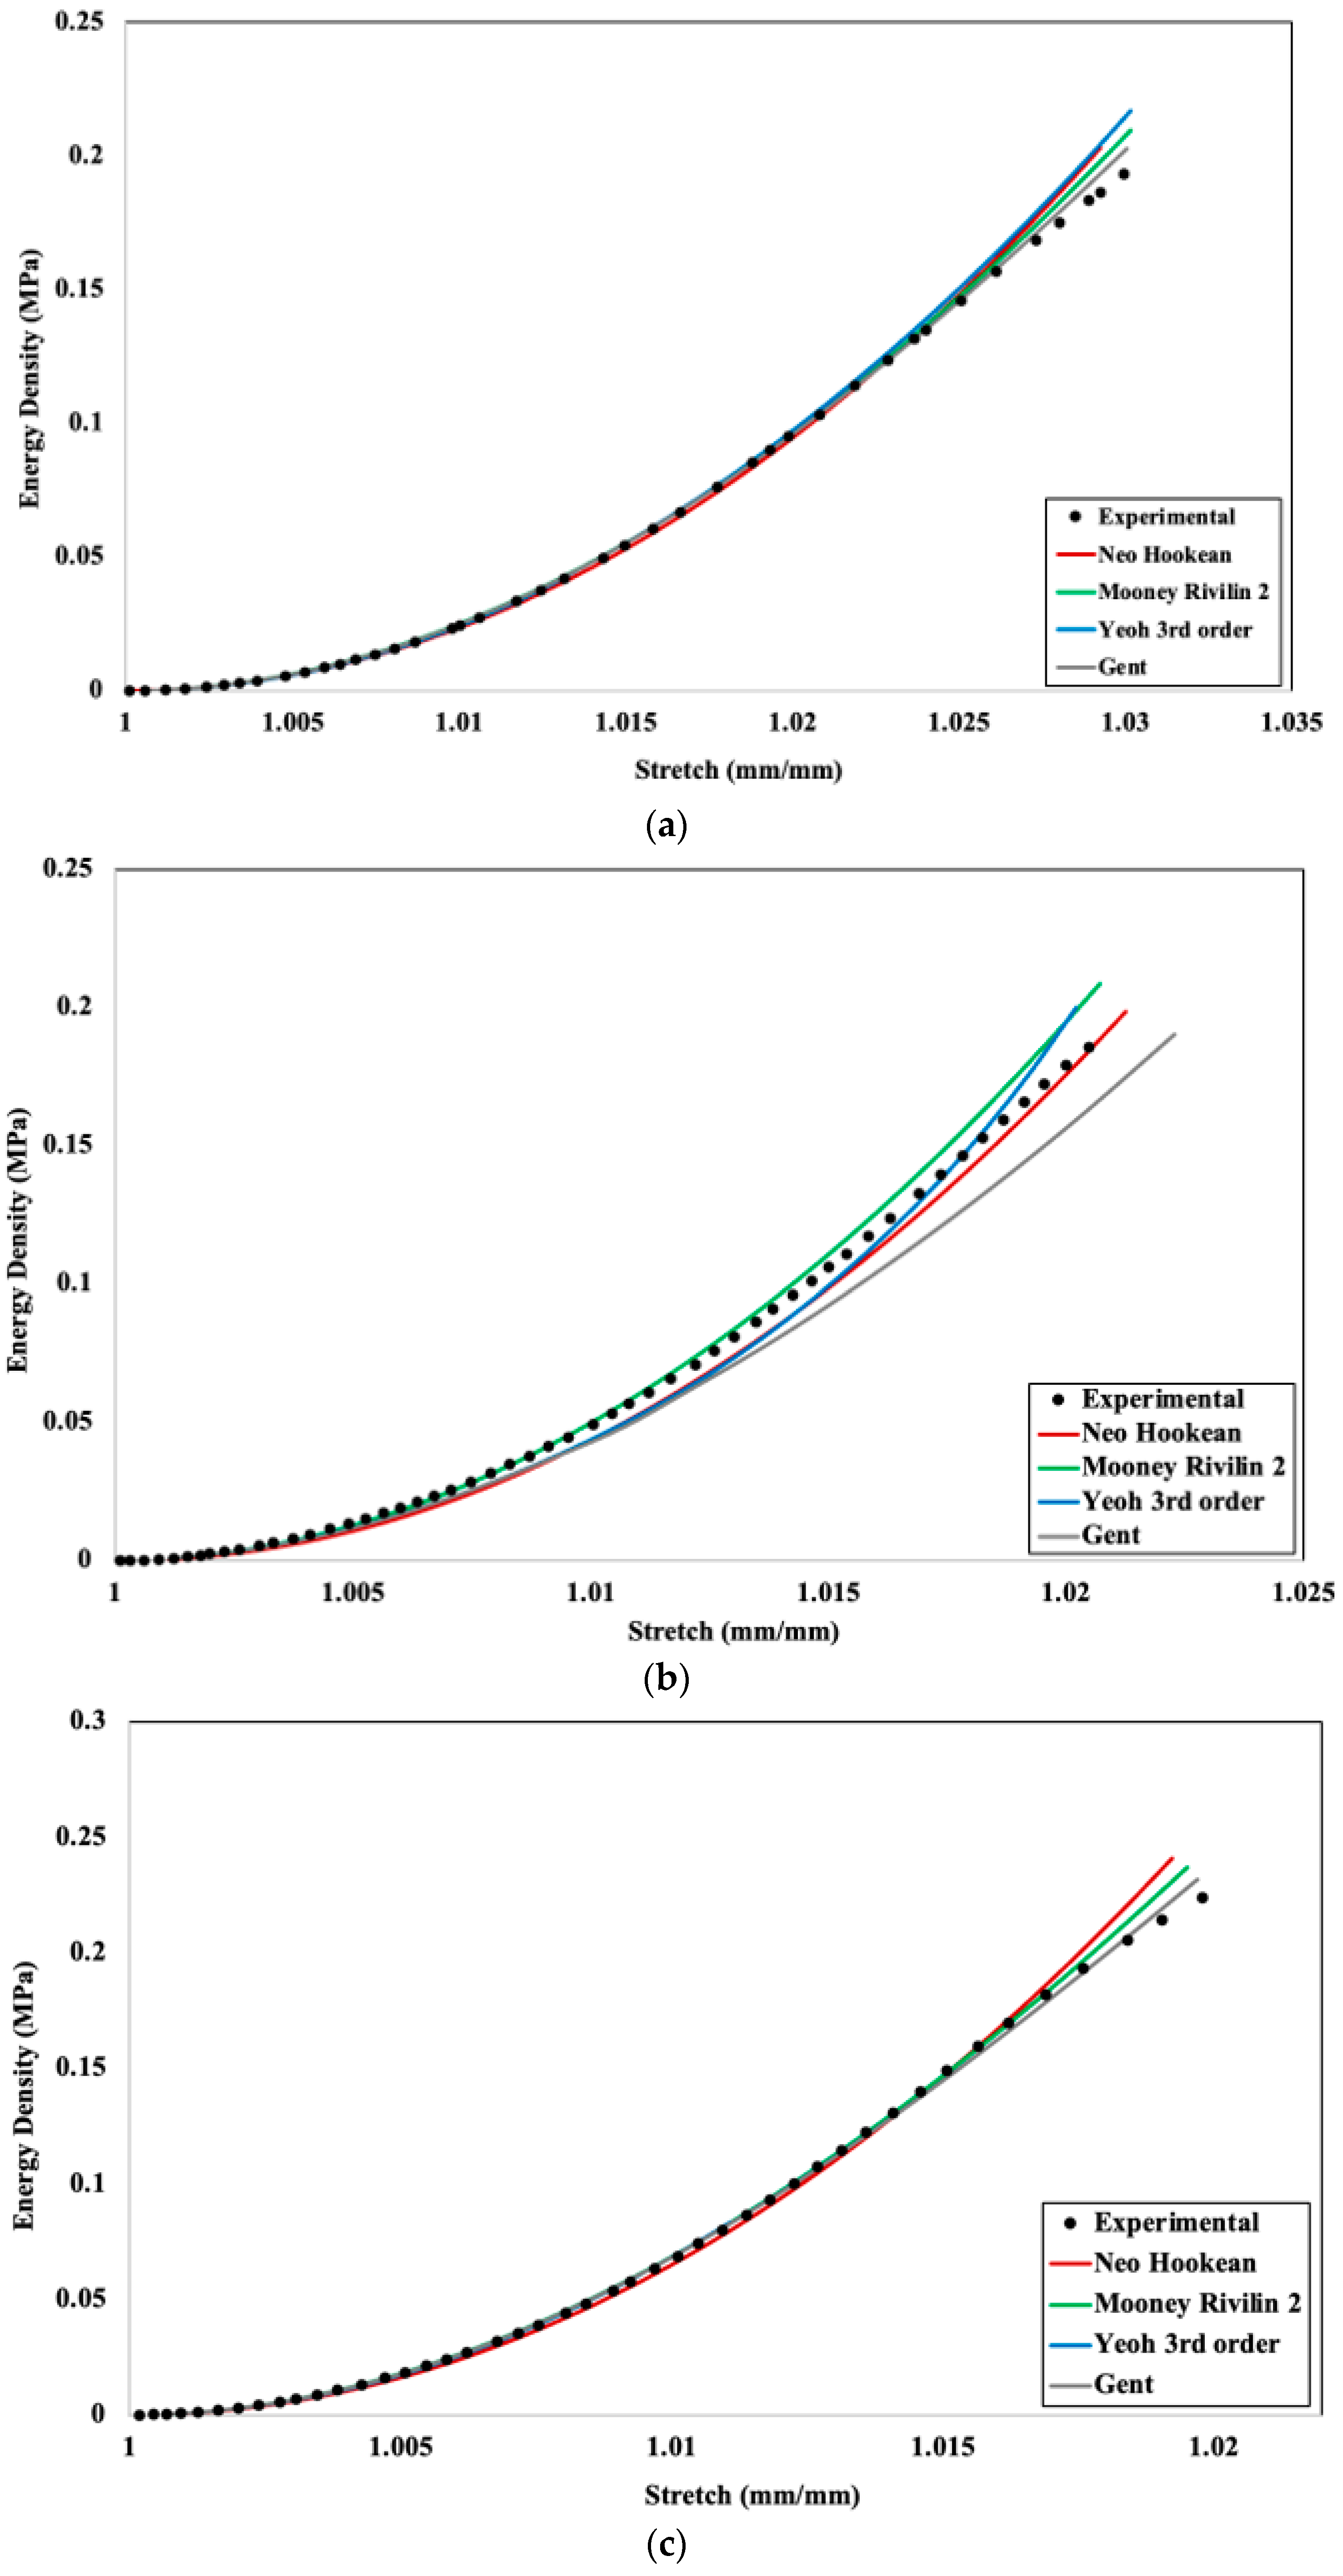
4.3. Numerical Validation with Strain Energy Density—Stretch Comparison

Strain energy density is defined as the energy stored in a body per unit volume due to deformation. Using the method described in Section 2.3, a strain energy density–stretch graph was obtained and is depicted in Figure 10 to compare experimental and numerical results.
Figure 10 depicts comparisons for different hyperelastic models fitting in correspondence to experimental data. All the results show a very good fit with experimental data, though 40% infill density (Figure 10b) has more variation in data compared to others. Using the method described in Section 3.1, R2 values were obtained from Figure 10 and shown in Table 2.
For the 20% infill density, all four hyperelastic models exhibit a very close fit to the experimental data, demonstrating their capability to accurately represent the material’s mechanical behavior under low-density conditions. However, slight deviations are observed at higher stretch levels, which are negligible and do not significantly impact the overall agreement between the models and experimental results. This alignment can be attributed to the relatively uniform and open cellular structure of the material at 20% infill density, which allows for a predictable and linear or mildly nonlinear stress–strain response. In the case of the 40% infill density, all models show a close fit to the experimental data at lower stretch levels, reflecting their ability to accurately capture the material’s behavior in the initial deformation range. However, deviations become more pronounced at higher stretch levels, with the Gent model showing the most significant divergence. Specifically, after a stretch of approximately 1.01 mm/mm, the Gent model begins to deviate noticeably from the experimental data. The model predicts a stretch of up to 1.023 mm/mm, whereas the experimental data indicate a stretch of 1.021 mm/mm. This discrepancy arises because the Gent model is inherently designed to capture strain-stiffening effects that occur at significant deformations by incorporating the limiting stretch parameter (Jm), which represents the material’s finite extensibility. At smaller deformations, where the material is far from its limiting stretch, Jm holds limited physical relevance. As a result, the Gent model tends to be less precise in this range compared to the neo-Hookean or Mooney–Rivlin models. These latter models are better suited for small deformations due to their simpler strain energy formulations, which align more closely with the assumptions of linear elasticity. At 60% infill density, all models closely match with the experimental values. The neo-Hookean and Mooney–Rivlin models continue to exhibit strong performance, accurately modeling the energy density without significant deviations. Good predictions were also shown by the Yeoh and Gent models, which are commonly used to capture nonlinear elastic behavior. These models suggest that at higher infill densities, the material’s reaction is more uniform and simpler to mimic using standard hyperelastic models.
However, all models continue to show a good fit with the experimental data at 80% infill density. The neo-Hookean model though predicts the energy density well; it deviates with a small amount after a stretch value of 1.008. After this, the neo-Hookean model underestimates the experimental values by a small amount. For 100% infill density, the performance of all four models was nearly identical, with each model closely matching the experimental data throughout the stretch range. This consistency suggests that at full density, the material behaves in a more predictable and uniform manner, making it feasible to use any of the four models for high-density PLA+ samples.
The Yeoh model relies solely on the first invariant (I1) of the deformation tensor, which represents the primary deformation while avoiding more intricate interactions. The inclusion of higher-order terms, such as (I1 − 3)2 and (I1 − 3)3, enables the Yeoh model to accommodate mild nonlinearities. This flexibility allows it to perform well across a wide range of conditions, including low-density infills under moderate deformations and high-density infills under significant deformations. As a result, the Yeoh third-order model demonstrates superior performance irrespective of infill density. However, the addition of higher-order terms increases the complexity of the model, making parameter determination more challenging. The neo-Hookean model assumes that the strain energy is a function of only the first invariant (I1) of the deformation tensor. This simplification makes it particularly effective for materials with uniform deformation, such as those with low-density infill, where the material’s structure is more open and less constrained. However, at higher infill densities, the material exhibits a more rigid network and nonlinear interactions under tensile loading. These characteristics limit the neo-Hookean model’s ability to account for strain-stiffening and localized effects, reducing its performance. Despite this, the neo-Hookean model still shows reasonable agreement with experimental results in the current analysis, particularly for scenarios involving smaller deformations. The Mooney–Rivlin two-parameter model extends the capabilities of the neo-Hookean model by incorporating both the first (I1) and second (I2) invariants of the deformation tensor. This inclusion enables the model to capture a broader range of deformations, making it well-suited for moderate to large deformations. Its two-parameter formulation provides improved accuracy over the neo-Hookean model, particularly under uniaxial stress, as it better accounts for the complex interactions present in materials with higher infill densities.
The findings show the simplicity of the neo-Hookean and Mooney–Rivlin models, which effectively capture the mechanical behavior of PLA+ across a variety of infill densities. These findings highlight the importance of considering infill density when selecting hyperelastic models for tensile test simulations of PLA+. According to the analysis, at 40% and 80% infill density, the choice of model can impact the accuracy of the results, with neo-Hookean and Mooney–Rivlin being more reliable. However, 20%, 60%, and 100% infill densities do not show any variation and the material’s response becomes more uniform, allowing for greater flexibility in model selection. Moreover, between neo-Hookean and Mooney–Rivlin models, neo-Hookean is more reliable for easier analysis, as it has only one parameter I1 and one materials constant C10. According to this study, the materials constant (C10) of the neo-Hookean model can be determined from Equation (20). Equation (20) was obtained from the curve fitting of Figure 11 with an R2 value of 0.9983, which shows a very close approximation.
By using a simple second-order polynomial, the fit function for C10 parameter regarding infill ratio is
C10(x) = −0.0026x2 + 3.8403x + 3.951
Here, x is the percentage (%) of infill densities. This function can be used to determine a functional gradient infill ratio hyperelastic material. This equation can be used to determine the C10 value for the neo-Hookean model under varying infill densities. This equation significantly reduces computational efforts, like extracting experimental data, curve fitting, neo-Hookean equation solving, etc., for every infill density, as materials constant C10 can be directly determined from Equation (20), which is crucial for large-scale model fitting.

5. Conclusions and Future Work

PLA+ dominates the 3D printing raw materials in the market because of its non-toxic and relatively low-temperature manufacturing capability. In this study, earlier experimental research available in the literature was validated by stress–strain comparison and strain energy density–stretch comparison with numerical analysis for ±45-degree infill orientation. The numerical validation result shows that experimental and numerical analysis depict almost the same result with ignorable variation. Both experimental analysis and numerical analysis helped to understand the effects of built direction and infill density on different mechanical properties. For successful material modeling, uniaxial tensile test data were collected from the literature, leading to the necessity of a nonlinear material behavior. In this study, four hyperelastic material models are discussed, as well as a novel method for determining the material parameters. Specifically, a hyperelastic material model of the PLA is used to fit the nonlinear material relation. Namely, neo-Hookean, Mooney–Rivlin, Yeoh third-order, and Gent models have been used for different infill densities. All four models are adequate and show a very good fit for all infill densities. On the other hand, the Gent model at 40% infill densities showed a very large deviation from experimental data. Thus, it is advised to use the neo-Hookean model or the Mooney–Rivlin model because both showed a good fit with experimental data, and they have a smaller number of parameters compared to the other two. However, neo-Hookean is simpler and easier to analyze, as it has only one parameter. A new equation was also developed at the end of the analysis to determine the neo-Hookean parameter for different infill densities. This equation can be implemented to determine the material’s constant irrespective of density.
Moreover, one of the advantages of 3D printing is that different types of hollow structures can be created with different infill densities. Thus, materials waste can be reduced based on special applications. For instance, 60% and 80% infill densities showed almost similar strain energy density and maximum stress. So, 60% infill can be used in a similar application to 80% infill with less materials. There are many scopes to enhance and extend the current research. Additional hyperelastic models can be included, such as Ogden or Arruda–Boyce, to determine if they offer improved predictions for PLA+ with varying infill densities. Viscoelastic or thermomechanical effects can also be investigated in the material models to account for time-dependent or temperature-related behaviors of PLA+. Our study did not include any printing parameters such as layer height, nozzle temperature, and printing speed effect. So, the influence of printing parameters has an impact on the performance of PLA+. Multiaxial loading conditions or fatigue tests can also be incorporated to understand the material behavior under real-world applications.

Author Contributions

Conceptualization, K.K. and M.Z.H.B.; methodology, K.K. and M.Z.H.B.; software, M.Z.H.B., E.I.R. and M.S.S.; validation, K.K. and M.Z.H.B.; formal analysis, K.K. and M.Z.H.B.; investigation, K.K. and M.Z.H.B.; resources; data curation, M.Z.H.B., E.I.R. and M.S.S.; writing—original draft preparation, K.K. and M.Z.H.B.; writing—review and editing, K.K. and M.Z.H.B.; visualization, M.Z.H.B., E.I.R. and M.S.S.; supervision, K.K.; project administration, K.K. All authors have read and agreed to the published version of the manuscript.

Funding

This research received no external funding.

Data Availability Statement

Data are contained within the article.

Conflicts of Interest

The authors declare no conflicts of interest.

References

  1. Afshar, R.; Jeanne, S.; Abali, B.E. Nonlinear material modeling for mechanical characterization of 3-D printed PLA polymer with different infill densities. Appl. Compos. Mater. 2023, 30, 987–1001. [Google Scholar] [CrossRef]
  2. Gibson, I.; Rosen, D.; Stucker, B. Additive Manufacturing Technologies; Springer: Berlin/Heidelberg, Germany, 2014. [Google Scholar] [CrossRef]
  3. Ngo, T.D.; Kashani, A.; Imbalzano, G.; Nguyen, K.T.Q.; Hui, D. Additive manufacturing (3D printing): A review of materials, methods, applications and challenges. Compos. Part B Eng. 2018, 143, 172–196. [Google Scholar] [CrossRef]
  4. Ford, S.; Despeisse, M. Additive manufacturing and sustainability: An exploratory study of the advantages and challenges. J. Clean. Prod. 2016, 137, 1573–1587. [Google Scholar] [CrossRef]
  5. Mohammed, L.; Ansari, M.N.M.; Pua, G.; Jawaid, M.; Islam, M.S. A review on natural fiber reinforced polymer composite and its applications. Int. J. Polym. Sci. 2015, 2015, 243947. [Google Scholar] [CrossRef]
  6. Mohan, N.; Senthil, P.; Vinodh, S.; Jayanth, N. A review on composite materials and process parameters optimisation for the fused deposition modelling process. Virtual Phys. Prototyp. 2017, 12, 47–59. [Google Scholar] [CrossRef]
  7. Attaran, M. The rise of 3-D printing: The advantages of additive manufacturing over traditional manufacturing. Bus. Horiz. 2017, 60, 677–688. [Google Scholar] [CrossRef]
  8. Yang, H.; Ganzosch, G.; Giorgio, I.; Abali, B.E. Material characterization and computations of a polymeric metamaterial with a pantographic substructure. Z. Für Angew. Math. Und Phys. 2018, 69, 105. [Google Scholar] [CrossRef]
  9. McKeen, L.W. Introduction to plastics and polymers. In Film Properties of Plastics and Elastomers; Elsevier: Amsterdam, The Netherlands, 2012; pp. 1–18. [Google Scholar] [CrossRef]
  10. Lee, H.M.; Sung, J.; Ko, B.; Lee, H.; Park, S.; So, H.; Yoon, G.H. Modeling and application of anisotropic hyperelasticity of PDMS polymers with surface patterns obtained by additive manufacturing technology. J. Mech. Behav. Biomed. Mater. 2021, 118, 104412. [Google Scholar] [CrossRef]
  11. Alhazmi, M.W.; Backar, A. Influence of Infill density and Orientation on the Mechanical Response of PLA+ Specimens Produced using FDM 3D Printing. Int. J. Adv. Sci. Technol. 2020, 29, 3362–3371. [Google Scholar]
  12. Lee, H.; Chae, H.; Kim, Y.S.; Song, M.J.; Lim, S.; Prasad, K.; Krishnaswamy, H.; Jain, J.; An, K.; Lee, S.Y. Viscoplastic lattice strain during repeated relaxation of age-hardened Al alloy. Mech. Mater. 2021, 158, 103899. [Google Scholar] [CrossRef]
  13. Popescu, D.; Zapciu, A.; Amza, C.; Baciu, F.; Marinescu, R. FDM process parameters influence over the mechanical properties of polymer specimens: A review. Polym. Test. 2018, 69, 157–166. [Google Scholar] [CrossRef]
  14. Ziemian, C.W.; Ziemian, R.D. Steel benchmark frames for structural analysis and validation studies: Finite element models and numerical simulation data. Data Brief 2021, 39, 107564. [Google Scholar] [CrossRef]
  15. Arrieta, S.; Cicero, S.; Sánchez, M.; Castanon-Jano, L. Estimation of fracture loads in 3D printed PLA notched specimens using the ASED criterion. Procedia Struct. Integr. 2023, 47, 13–21. [Google Scholar] [CrossRef]
  16. Lin, P.-S.; De Bretagne, O.L.R.; Grasso, M.; Brighton, J.; StLeger-Harris, C.; Carless, O. Comparative analysis of various hyperelastic models and element types for finite element analysis. Designs 2023, 7, 135. [Google Scholar] [CrossRef]
  17. Khaniki, H.B.; Ghayesh, M.H.; Chin, R.; Amabili, M. Hyperelastic structures: A review on the mechanics and biomechanics. Int. J. Non-Linear Mech. 2022, 148, 104275. [Google Scholar] [CrossRef]
  18. ASTME D638-10; Standard Test Method for Tensile Properties of Plastics. ASTM International: West Conshohocken, PA, USA, 2015.
  19. Dal, H.; Açıkgöz, K.; Badienia, Y. On the Performance of Isotropic Hyperelastic Constitutive Models for Rubber-Like Materials: A State of the Art Review. Appl. Mech. Rev. 2021, 73, 020802. [Google Scholar] [CrossRef]
  20. Steinmann, H.H.; Dickeduisberg, M.; Theuvsen, L. Uses and benefits of glyphosate in German arable farming. Crop Prot. 2012, 42, 164–169. [Google Scholar] [CrossRef]
  21. Martins, P.A.L.S.; Jorge, R.M.N.; Ferreira, A.J.M. A comparative study of several material models for prediction of hyperelastic properties: Application to Silicone-Rubber and soft tissues. Strain 2006, 42, 135–147. [Google Scholar] [CrossRef]
  22. Yavari, A.; Goriely, A. Universal deformations in anisotropic nonlinear elastic solids. J. Mech. Phys. Solids 2021, 156, 104598. [Google Scholar] [CrossRef]
  23. Timbrell, C.; Wiehahn, M.; Cook, G.; Muhr, A.H. Simulation of Crack Propagation in Rubber. In Constitutive Models for Rubber III; Busfield, J., Muhr, A., Eds.; A A Balkema Publishers: Batsford, UK, 2003; pp. 11–20. [Google Scholar]
  24. Mooney, M. A theory of large elastic deformation. J. Appl. Phys. 1940, 11, 582–592. [Google Scholar] [CrossRef]
  25. Rivlin, R.S. Large elastic deformations of isotropic materials IV. further developments of the general theory. Philos. Trans. R. Soc. Lond. Ser. A Math. Phys. Sci. 1948, 241, 379–397. [Google Scholar] [CrossRef]
  26. Zheng, F.; Zhang, W.; Yuan, X.G.; Zhang, Y.F. Radial nonlinear vibrations of thin-walled hyperelastic cylindrical shell composed of Mooney–Rivlin materials under radial harmonic excitation. Nonlinear Dyn. 2023, 111, 19791–19815. [Google Scholar] [CrossRef]
  27. Barforooshi, S.D.; Mohammadi, A.K. Study Neo-Hookean and Yeoh Hyper-Elastic models in dielectric Elastomer-Based Micro-Beam resonators. Lat. Am. J. Solids Struct. 2016, 13, 1823–1837. [Google Scholar] [CrossRef]
  28. Renaud, C.; Cros, J.-M.; Feng, Z.-Q.; Yang, B. The Yeoh model applied to the modeling of large deformation contact/impact problems. Int. J. Impact Eng. 2008, 36, 659–666. [Google Scholar] [CrossRef]
  29. Fung, Y.-C. Biomechanics; Springer: Berlin/Heidelberg, Germany, 1993. [Google Scholar] [CrossRef]
  30. Holzapfel, G.A. Nonlinear Solid Mechanics—A continuum approach for engineering. Meccanica 2002, 37, 489–490. [Google Scholar] [CrossRef]
  31. Ogden, R.W. Non-Linear Elastic Deformations; Dover Publications: New York, NY, USA, 1997. [Google Scholar]
  32. Hamilton, W.R. Theory of conjugate functions, or algebraic couples.; with a preliminary and elementary essay on algebra as the science of pure time. Trans. R. Ir. Acad. 2000, 17, 293–422. [Google Scholar]
  33. Hudgins, R.G. Development of a constitutive relation for elastomers exhibiting self-reinforcement. Polym. Eng. Sci. 2006, 46, 919–929. [Google Scholar] [CrossRef]
  34. Madenci, E.; Guven, I. The Finite Element Method and Applications in Engineering Using ANSYS®; Springer: Berlin/Heidelberg, Germany, 2015. [Google Scholar] [CrossRef]
Figure 1. A summary of the research procedure and methodology.
Machines 13 00091 g001
Figure 2. Schematic representation of standard specimens for mechanical testing (ASTM D638-10 [18] Type V tensile specimen) with relevant dimensions in mm.
Machines 13 00091 g002
Figure 3. Different infill densities with ±45-degree infill orientation.
Machines 13 00091 g003
Figure 4. Experimental analysis graph for ±45-degree angle orientation and different infill densities [11].
Machines 13 00091 g004
Figure 5. Generated mesh 3D designed tensile test dog bone specimen.
Machines 13 00091 g005
Figure 8. Numerical simulation for 20% infill density for four different hyperelastic models. (a,b) Neo–Hookean; (c,d) Mooney–Rivlin 2–parameter; (e,f) Yeoh 3rd–order; (g,h) Gent model.
Machines 13 00091 g008
Figure 9. Experimental and numerical stress–strain comparison for different hyperelastic models: (a) 20%, (b) 40%, (c) 60%, (d) 80%, (e) 100% infill density.
Machines 13 00091 g009aMachines 13 00091 g009b
Figure 10. Experimental and numerical strain energy density–stretch comparison for different hyperelastic models for (a) 20%, (b) 40%, (c) 60%, (d) 80%, and (e) 100% infill density.
Machines 13 00091 g010aMachines 13 00091 g010b
Figure 11. Neo-Hookean model’s parameter (C10) for different infill densities.
Machines 13 00091 g011
Table 1. Materials constant for different hyperelastic models.
Material ModelParameterInfill Ratio
20%40%60%80%100%
Neo HookeanInitial shear modulus, μ
(mpa)
157.96314.32437.28599.67722
C10 (mpa)78.98157.16218.64299.84361
Mooney-Rivlin
(2 parameters)
C10 (mpa)−331.51−1597.57−2274.6−4079.45617.5
C01 (mpa)419.69258,5992528.34443.16051.5
Yeoh
(3rd order)
C10 (mpa)80.75176.54232.18310.03425.79
C20 (mpa)1667.94−15,306.7−720.6331,615−116,085
C30 (mpa)0.76 ×   1 0 6 2.4 ×   1 0 6 −8.3 ×   1 0 6 −3.2 ×   1 0 7 5.61 ×   1 0 7
GentInitial shear modulus, μ
(mpa)
169.92349.19481.35682.87811.14
Limiting value−0.0208−0.00728−0.00618−0.00478−0.00376
Table 2. R2 values for different hyperelastic materials model.
Infill
Density
Neo-HookeanMooney Rivlin 2 ParameterYeoh 3rd OrderGent
20%0.9900.9900.9950.999
40%0.9650.970.960.90
60%0.990.9950.9990.999
80%0.970.9990.9990.98
100%0.97111
Disclaimer/Publisher’s Note: The statements, opinions and data contained in all publications are solely those of the individual author(s) and contributor(s) and not of MDPI and/or the editor(s). MDPI and/or the editor(s) disclaim responsibility for any injury to people or property resulting from any ideas, methods, instructions or products referred to in the content.

