Article

Intelligent Casting Quality Inspection Method Integrating Anomaly Detection and Semantic Segmentation

1
Department of Mechanical Engineering, National Chin-Yi University of Technology, Taichung 411030, Taiwan
2
Department of Mechanical Engineering, Lunghwa University of Science and Technology, Taoyuan 33326, Taiwan
*
Author to whom correspondence should be addressed.
Machines 2025, 13(4), 317; https://doi.org/10.3390/machines13040317
Submission received: 13 March 2025 / Revised: 5 April 2025 / Accepted: 10 April 2025 / Published: 13 April 2025

Abstract

:
Wind power generation plays an important role in renewable energy, and the core casting components have extremely high requirements for precision and quality. In actual practice, we found that an insufficient workforce limits traditional manual inspection methods and often creates difficulty in unifying quality judgment standards. Customized optical path design is often required, especially when conducting internal and external defect inspections, which increases overall operational complexity and reduces inspection efficiency. We developed an automated optical inspection (AOI) system to address these challenges. The system integrates a semantic segmentation neural network to handle external surface detection and an anomaly detection model to detect internal defects. In terms of internal defect detection, the GC-AD-Local model we tested achieved 100% accuracy on experimental images, and the results were relatively stable. In the external detection part, we compared five different semantic segmentation models and found that MobileNetV2 performed the best in terms of average accuracy (65.8%). It was incredibly stable when dealing with surface defects with significant shape variations, and the prediction results were more consistent, making it more suitable for introduction into actual production line applications. Overall, this AOI system boosts inspection efficiency and quality consistency, reduces reliance on manual experience, and is of great assistance in quality control and process intelligence for wind power castings. We look forward to further expanding the amount of data and improving the generalization capabilities of the model in the future, making the system more complete and suitable for practical applications.

1. Introduction

1.1. Key Benefits of AI in Quality Control

In recent years, artificial intelligence (AI) technology has developed rapidly in the field of smart manufacturing and has become the core driving force for promoting industrial digital transformation and improving manufacturing efficiency. Ding et al. pointed out that industrial artificial intelligence (IAI) integrates AI algorithms and industry knowledge and is widely used in fields such as equipment fault diagnosis, life prediction, and quality inspection. It has the ability of self-learning and optimization, laying a solid foundation for the establishment of smart factories [1]. In terms of quality management, Ghelani’s research shows that AI technology combined with machine learning and computer vision can significantly elevate defect detection rates and quality control efficiency in the printed circuit board (PCB) manufacturing process [2]. Giancarlo et al. pointed out that although AI technology can help small- and medium-sized enterprises optimize quality processes, the introduction process still faces multiple challenges, such as talent shortages, high introduction costs, and difficulties in system integration [3]. From the perspective of manufacturing systems, Arinez et al. explored the multiple applications of AI in quality monitoring, human–machine collaboration, process prediction, and material modeling. They pointed out that the lack of model migration and poor data quality are the main bottlenecks of current development [4]. Rakholia et al. further emphasized that AI technology can promote predictive maintenance, process optimization, and decision support, which is of key significance to improving the sustainability and overall competitiveness of the manufacturing industry [5]. Lodhi et al. added that through real-time data analysis and prediction mechanisms, AI can effectively advance process flexibility and cost-effectiveness and further promote the transformation of modern manufacturing models [6]. In the field of medical devices, which is subject to strict regulatory requirements, Roy and Srivastava believe that AI technology can help optimize product design, control quality consistency, and assist companies in complying with regulatory standards [7]. Patel also pointed out that although the introduction of AI can optimize quality control processes and streamline regulatory compliance, data credibility and ethical compliance issues still need to be carefully addressed [8]. In addition, Ejjami discussed the potential of AI in predictive maintenance, quality control, and supply chain resilience management from the perspective of Industry 5.0 and suggested the establishment of functional systems such as AIMOO (AI-based Maintenance Operation Optimization), AIMCO (AI-based Manufacturing Control Optimization), and AIMQAO (AI-based Manufacturing Quality Assurance Optimization) to implement a responsibility-oriented smart manufacturing strategy [9]. Finally, Lin pointed out that AI, under the Industry 4.0 framework, can significantly improve the flexibility and intelligence of manufacturing processes through predictive analysis, real-time computing, and human–machine collaboration, and it has become an indispensable technical foundation in modern industrial engineering [10]. In general, the application of AI in smart manufacturing has covered multiple aspects, such as quality management, equipment maintenance, logistics control, and decision support, demonstrating high technical potential. However, in the process of practical introduction, it is still necessary to properly respond to challenges such as data quality, technology integration, talent development, and ethical standards in order to realize their full value.

1.2. Defect Detection in Metal Castings Using AI and Imaging Technologies

With the rapid development of smart manufacturing technology and the improvement of product quality requirements, the demand for defect detection of key components, such as aluminum alloy castings and composite materials, has increased. Traditional manual inspection methods are unable to meet the requirements of modern industry for high precision and high reliability in terms of efficiency and stability. Therefore, automated defect inspection systems that integrate image processing technology and deep learning methods have gradually become the mainstream research direction. In terms of casting inspection, Wang et al. pointed out that nondestructive testing (NDT) is an important part of the quality control of cast aluminum parts. Their team used a feature pyramid network (FPN) combined with RoIAlign technology to effectively refine the recognition accuracy and positioning capability of small-sized defects in X-ray images [11]. Another study reviewed the evolution of system architecture since the early ENIAC period, explored the implications of contemporary reliable design for system-level detection strategies, and provided a macro perspective on the architectural planning of the overall detection system [12]. The introduction of deep learning models also brings new opportunities for industrial image analysis. Wu et al. proposed a modified version of the YOLOv3 structure (YOLOv3_134), which integrates guided filtering and data augmentation techniques to effectively strengthen the detection capability of tiny defects in industrial digital radiography (DR). The model achieved a more than 26% increase in mean average precision (mAP) compared to the original version, demonstrating strong potential for deployment in production line applications [13]. Xie et al. focused on system-side optimization, processing binary images through connected component analysis and applying CUDA acceleration on the Jetson TK1 platform, achieving nearly three times the computing efficiency, which is helpful for real-time detection and edge device deployment [14]. In terms of model design, Zhao used the CenterNet architecture for end-to-end defect localization and classification and combined it with data augmentation (such as image cropping and brightness adjustment) to strengthen the model’s generalization ability. The method achieved an mAP of more than 0.9 on the authors’ own dataset, and it was successfully integrated into the complete inspection process [15]. Chen proposed a multi-task learning model based on Mask R-CNN, combining classification and instance segmentation and reducing the dependence on large amounts of labeled data through transfer learning. The method demonstrated excellent performance on the GDXray public dataset, covering the fields of castings and welding defects [16]. In response to the need for defect detection caused by different material properties, relevant research continues to expand. Yu et al. focused on the common problems of internal pores and voids during the cooling process of castings, proposed an object detection process that integrates X-ray CT imaging and deep learning, and used image preprocessing techniques to assist in contour recognition, refine defect location accuracy, and mitigate the problem of insufficient consistency in manual inspection [17]. Li et al. applied a CNN to carbon-fiber-reinforced plastic (CFRP) ultrasonic phased-array imaging and designed a self-encoding classifier to distinguish between manufacturing and impact defects, effectively improving the recognition deficiencies of traditional algorithms in composite material inspection [18]. Sharma et al. integrated YOLOv4 with a graphical user interface (GUI) to develop an automated system for casting defect classification, achieving a classification accuracy of 99% on the test set and demonstrating good recognition capabilities for minor defects [19]. Based on current research trends, defect detection technology that combines X-ray and ultrasonic imaging with deep learning algorithms has gradually become the mainstream solution for casting and composite material quality control. The design of related systems in the future will place greater emphasis on model accuracy, inference efficiency, and explainability while also considering data adaptability and deployment flexibility to meet the strict requirements of intelligent manufacturing sites for immediacy and high quality.

1.3. Impact of AI on Casting Quality Inspection Methods

In the context of Industry 4.0, the intelligence of casting process quality inspection has become one of the core directions of industrial upgrading. In recent years, many scholars have introduced deep learning technology to improve the accuracy and automation of defect identification. Sundaram and Zeid [20] proposed a detection architecture combined with a convolutional neural network (CNN), achieving a high accuracy of 99.86% even in non-ideal environments such as unstable light sources and showing potential to replace manual visual inspection. For defect detection in X-ray images, Oh et al. [21] used a CNN and a convolutional autoencoder (CAE) for surface defect detection. Their method maintains detection performance in cases with insufficient sample numbers and is particularly suitable for the initial stage of intelligent factory implementation. Jaśkowiec et al. [22] evaluated the application performance of various machine learning and deep neural network models in predicting casting microstructure quality and emphasized the importance of model interpretability and deployment efficiency for production line applications. The two-stage convolutional architecture proposed by Nguyen et al. [23] combined with DenseNet achieved an F1 score of 99.54% and an efficient inference speed using only the CPU without GPU resources, showing good potential for edge deployment. Hu et al. [24] adopted the Xception architecture and combined it with data enhancement technology to effectively identify surface defects such as pores and pinholes, further overcoming the blind spots of traditional manual inspection. Regarding the die-casting process, Lin et al. [25] embedded high-temperature sensors in the mold to collect pressure information and performed defect prediction analysis using the XGBoost model. Their method helps stabilize warning sensitivity and yields. Sharma et al. [26] developed a surface defect classification model based on ResNet152V2 combined with transfer learning. The model can be directly deployed on edge computing devices, achieving an accuracy of 99.65% and showing potential for immediate application. In the context of technological evolution, Maheswari and Brintha [27] systematically reviewed the typical applications and key challenges of CNNs in casting surface defect detection and believed that future research should focus on improving the models’ generalization ability and boundary recognition ability. Bolla et al. [28] compared the application performance of pre-trained and customized lightweight models on IoT and edge devices, pointing out that the latter exhibits higher performance and deployment flexibility in resource-constrained scenarios. Overall, deep learning technology, especially the CNN architecture, has been widely used in casting defect detection. Its advantages in accuracy, performance, and deployment flexibility strongly support high-quality automatic inspection in innovative manufacturing environments and lay an important foundation for the digital transformation of the foundry industry in the future.
In summary, the existing literature has proposed a variety of technologies for detecting casting defects, including technologies based on X-ray imaging, ultrasonic phased-array imaging, and traditional machine vision and deep learning methods, which have significantly boosted the accuracy and automation of detection. However, there are currently relatively few dedicated inspection methods for fan castings, and most studies focus on single appearance or internal inspection tasks, with little consideration for the system integration design required due to differences in casting materials and processes. In addition, there is still a lack of in-depth discussion of practical application scenarios in the performance comparison of multi-model semantic segmentation. Therefore, to address the shortcomings of existing methods in terms of accuracy in determining abnormal areas and application flexibility, this study develops a comprehensive automatic optical inspection system for fan castings, integrates anomaly detection and semantic segmentation technologies, and proposes an intelligent inspection solution suitable for practical production environments through multi-model comparison and performance evaluation to advance the accuracy of defect classification and positioning and further support the development needs of smart manufacturing and standardized quality monitoring.

2. Materials and Methods

2.1. Hardware System for Internal Defect Detection in Castings Based on Machine Vision

2.1.1. System Overview

As casting products become more complex in structure and have higher quality requirements, the effective detection of internal defects has become an important issue in process quality control. This study constructs an automated inspection system based on machine vision technology, designed specifically for internal defect detection in castings. The overall system integrates high-resolution cameras, industrial endoscopes, ring-lighting sources, adjustable detection platforms, dimming modules, and computing hosts (PC systems) that can effectively support the high-precision inspection needs of various aluminum alloy castings with different morphologies and dimensions. As shown in Figure 1A, the shooting assembly method of the inspection system can be flexibly adjusted according to the geometry of the workpiece, and, combined with a high-performance image processing process, it can achieve rapid identification and visual marking of internal defects. The overall hardware architecture is shown in Figure 1B, showing the configuration and signal flow between the main modules of the system.

2.1.2. Hardware Configuration

To ensure system stability and detection quality, the hardware configuration used in this study is as follows:
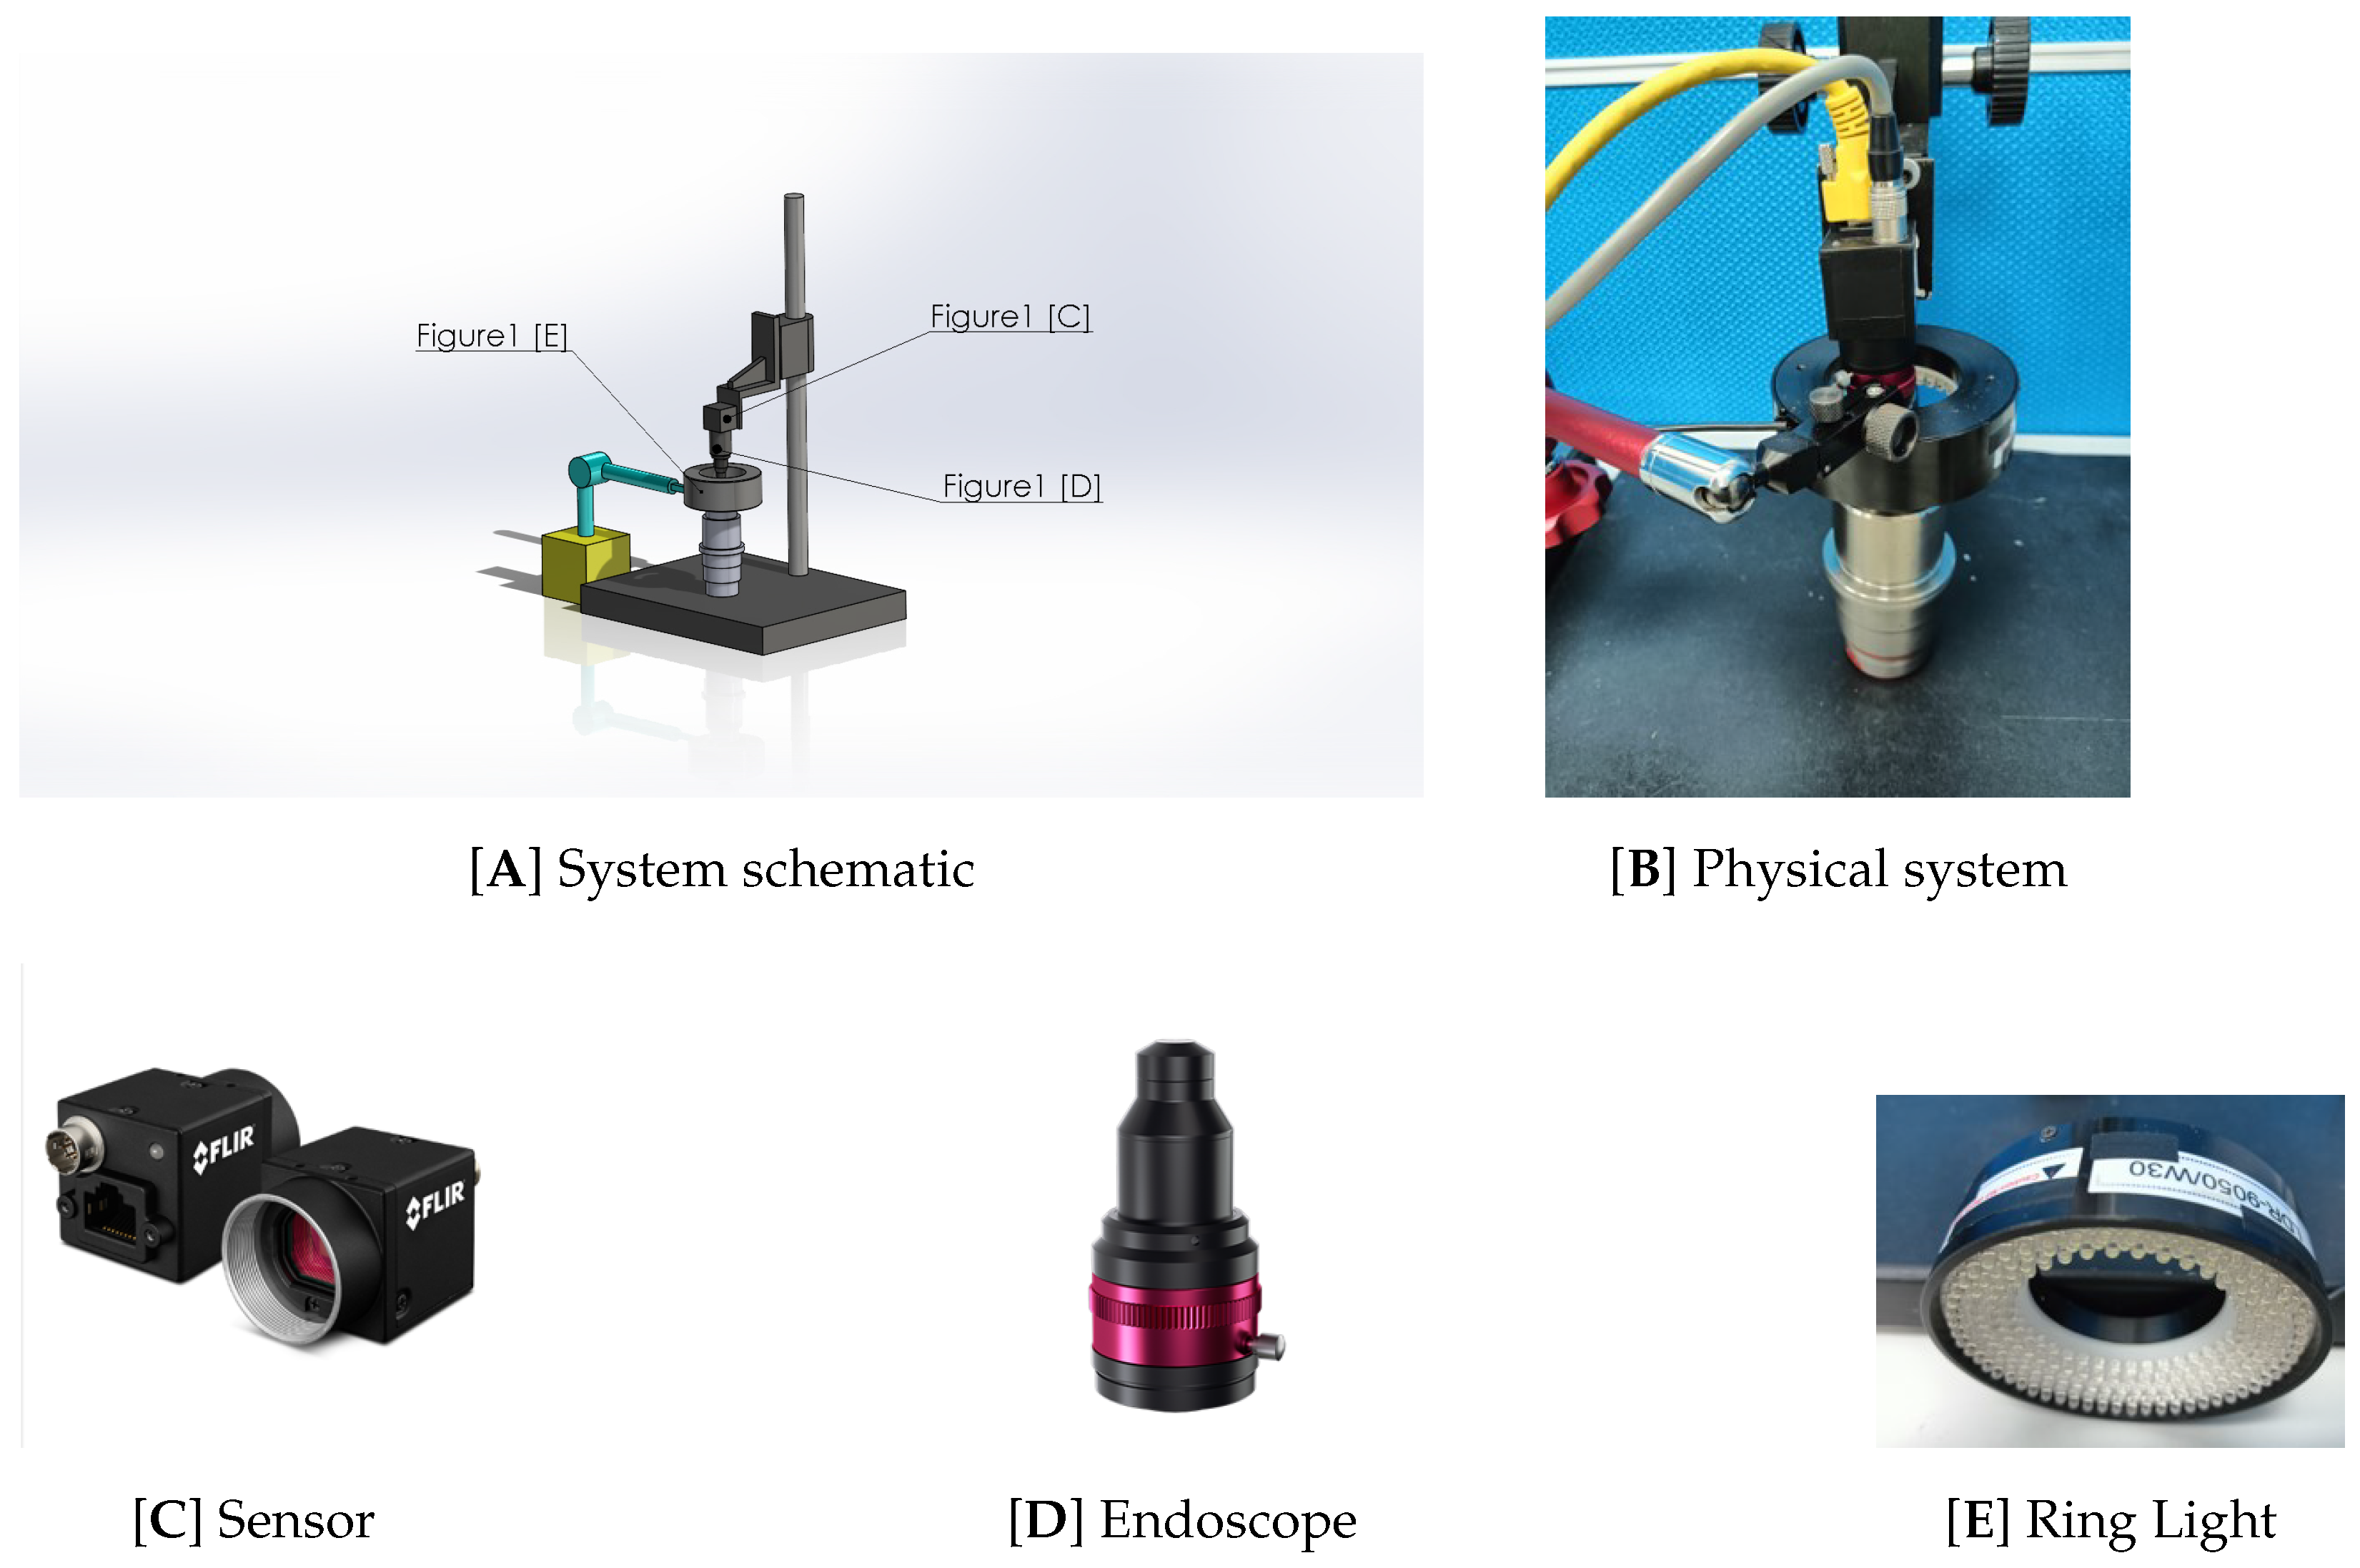
  • Camera module: A PGE-200S6M-Cindustrial-grade camera is used for high-resolution image capture. With its high resolution and sensitive photosensitivity, it can capture the internal details of the casting and strengthen the reliability of image recognition (see Figure 1C).
  • Endoscope module: This module is paired with the PRHI230-82 industrial endoscope. It has a slender body and high imaging capability. It can penetrate complex cavities for local magnification inspections and is suitable for observing subtle defects (see Figure 1D).
  • Light source module: An LDR_9050_W30-type ring LED white light source is used to provide a uniform and stable lighting environment. It can effectively reduce shadow and reflection interference and augment image contrast and defect boundary clarity (see Figure 1E).
  • Platform and dimming control: The inspection platform has position fine-tuning and angle-correction mechanisms. Together with the dimming module, the lighting intensity can be adjusted according to the brightness requirements of the inspection area, ensuring optimal image quality under different materials and surface conditions.
  • PC computing system: The core control system uses a high-performance computer equipped with a Windows 10 64-bit operating system. It integrates image acquisition control, data processing, defect classification, and reporting modules and can be used with subsequent algorithm modules for real-time interpretation and report generation.

2.2. Machine Vision-Based External Defect Detection System for Castings

2.2.1. System Overview

To improve the automation and accuracy of casting surface quality inspection, this study establishes an external defect detection system based on machine vision technology. The system is mainly composed of industrial cameras, high-resolution lenses, striped white light sources, and computer control systems. It is designed to perform high-precision, non-contact surface defect detections. The system can effectively identify possible appearance abnormalities such as cracks, pores, dents, and scratches on the casting surface, reducing the burden of manual inspection and improving detection consistency. The shooting structure is shown in Figure 2A, and the overall hardware architecture and system operation flow are shown in Figure 2B, covering the complete inspection process from image capture to image processing and defect analysis.

2.2.2. Hardware Configuration

The hardware components used in the system are as follows:
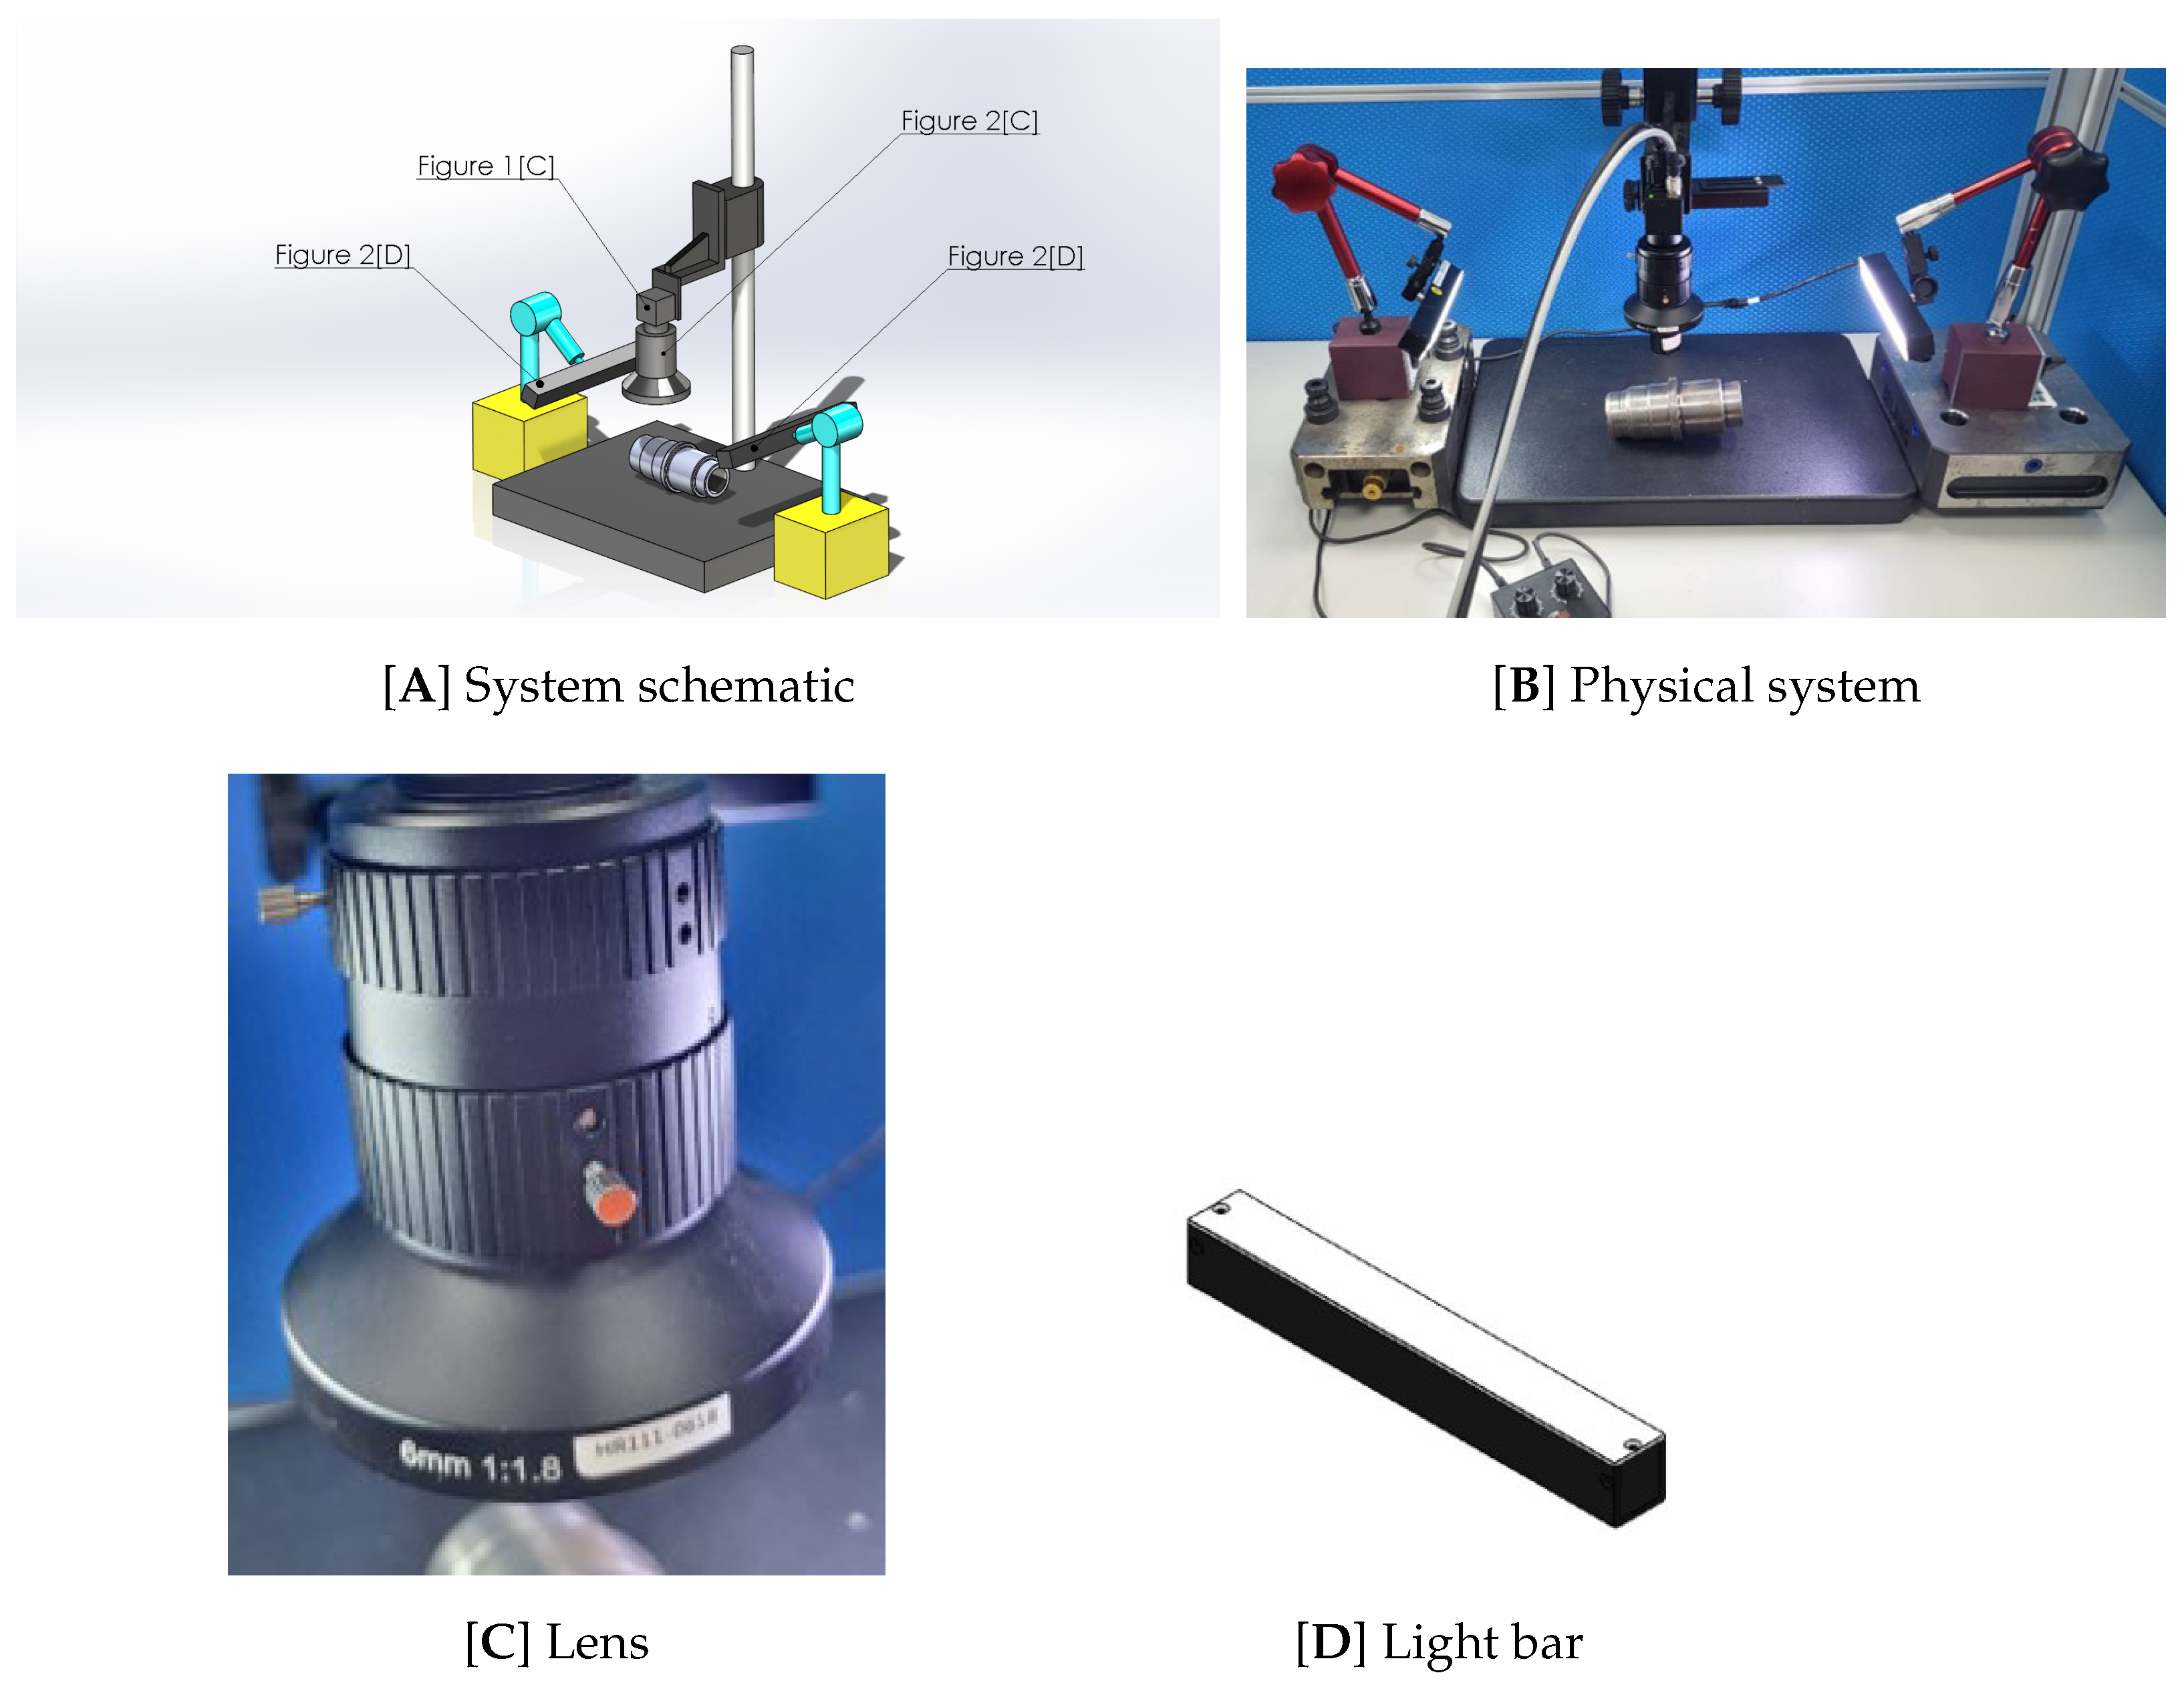
  • Industrial camera: This system uses a BES-PGE-200S6M-C industrial camera, which has a resolution of 5472 × 3468, that can capture small surface defects and texture details, thereby improving overall inspection accuracy (see Figure 1C).
  • Lens module: Equipped with an HR111-0618 high-precision lens, this module provides excellent imaging clarity and edge contrast, ensuring that defect information can be clearly presented in the captured image (see Figure 2C).
  • Lighting module: This module uses a CHD-BA1510 15W strip LED white light source, which has stable and uniform lighting characteristics, reduces shadow and reflection interference, increases the contrast performance of defective areas, and boosts overall image quality (see Figure 2D).
  • PC control system: The integrated control platform is equipped with a Windows 10 64-bit operating system, responsible for performing image acquisition, image preprocessing, defect location, and feature classification functions. It can also adjust model parameters and output report records for different types of castings.
The overall system component configuration and operation process design emphasize modularity, immediacy, and high-resolution visual recognition capabilities, which can effectively support the rapid inspection and quality monitoring of casting products of different batches and models. Figure 2 shows the overall visual display of the hardware composition and operation flow of the system, providing a clear and easy-to-understand description of the system’s operational architecture.

2.3. System Flow

The optical inspection system constructed by this institute integrates deep learning technology to simultaneously perform defect detection on the external surfaces and internal cavities of castings. The overall operational process is shown in Figure 3. The initial stage of the process involves the setup of the optical system, including components such as the camera, light source, and lens, to ensure that high-quality image data can be obtained later. The system simultaneously captures the exterior and interior, and the captured images are used as input into the deep learning model for subsequent processing. After the image data are input into the deep learning framework, key information is first captured through the feature extraction module. The classification model then determines whether there are abnormal areas and employs semantic segmentation to accurately mark the defect locations. The overall inspection process can be divided into two core tasks: the first is “anomaly detection”, which uses classification algorithms to determine whether there are defect features in the image, and the second is “semantic segmentation”, which assigns each pixel to a specific category to achieve refined area positioning and defect shape recognition.

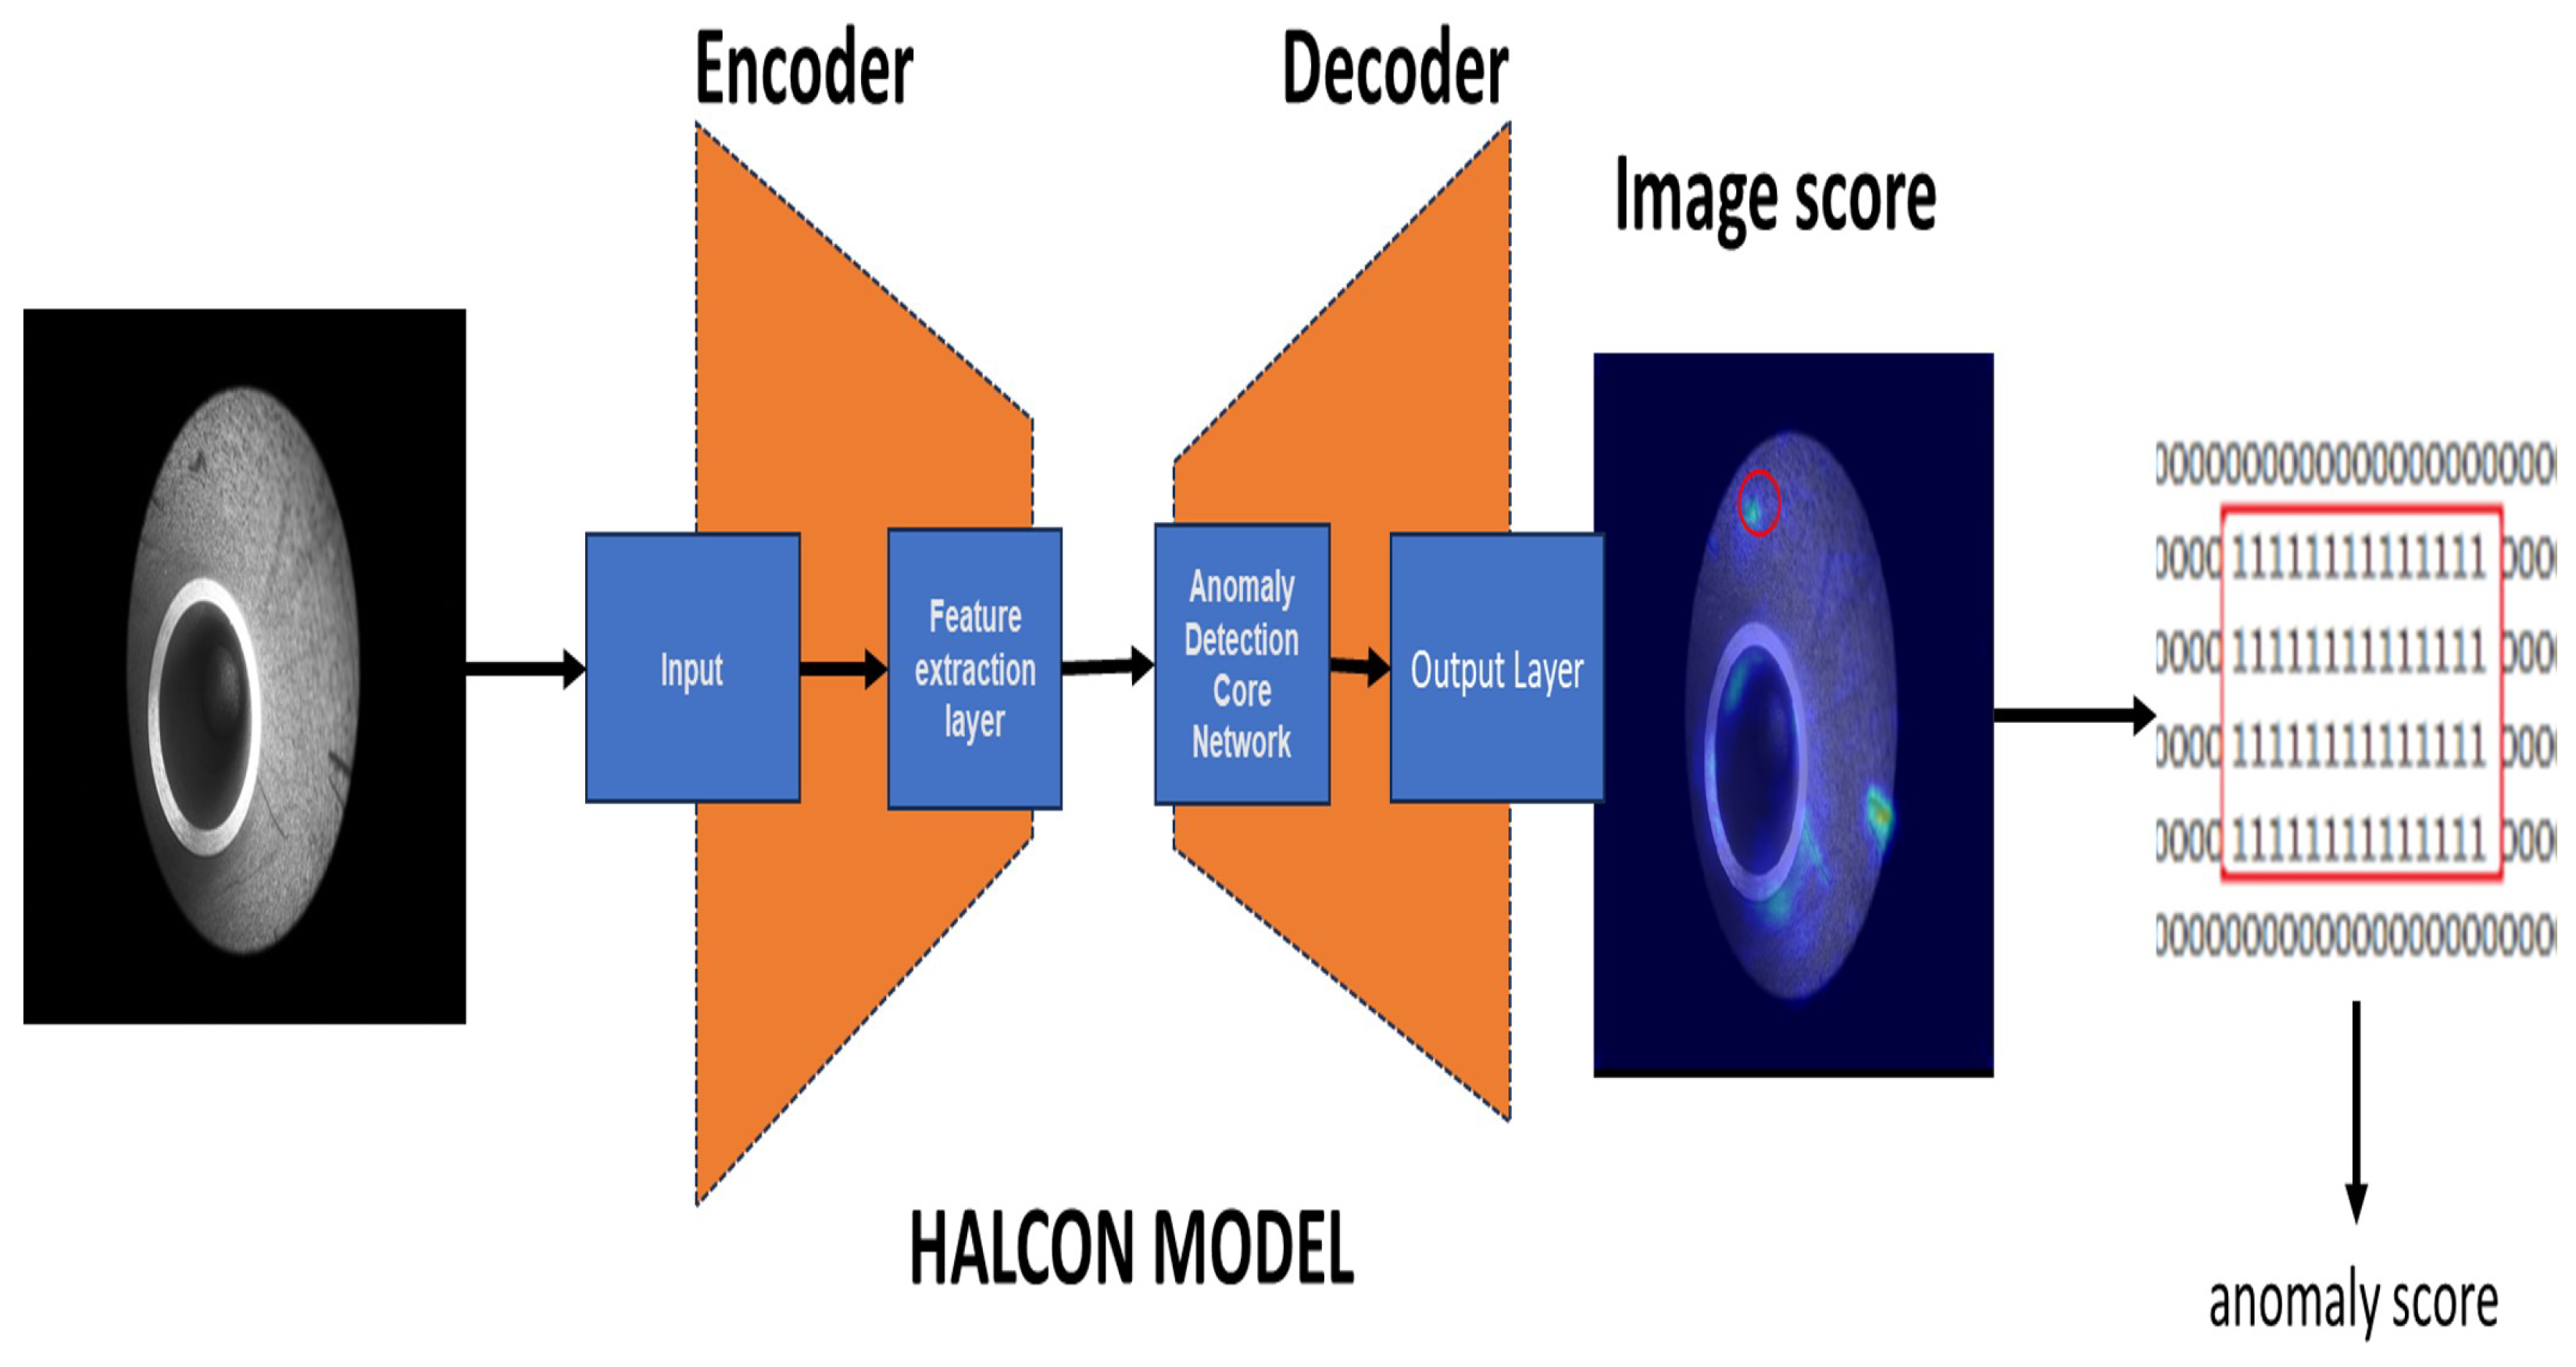
2.4. HALCON-Based Anomaly Detection Architecture Design

The anomaly detection architecture designed by this institute is based on the HALCON anomaly detection core module (MVTec Anomaly Detection, or MVTec AD for short). The overall architecture consists of four main modules: an input layer, a feature extraction layer, an anomaly detection core network, and an output layer. To enhance anomaly detection performance, the system further introduces convolutional autoencoder (CAE) technology and integrates the GC-AD (Global Context Anomaly Detection) framework to optimize detection accuracy and system flexibility through multi-model fusion. The overall structure of the anomaly detection framework is shown in Figure 4.

2.4.1. Input Layer

The input layer mainly processes images from industrial cameras or datasets. The input resolution is 256 × 256, which can be adjusted to 512 × 512 according to needs. To increase the stability and generalization of the model, the input image undergoes a series of preprocessing operations before entering the model, including random rotation (±15%), to simulate image variations under different shooting angles, mirror processing to augment the model’s ability to recognize the directionality of materials and textures, adding Gaussian noise to strengthen the model’s robustness to image noise, brightness change adjustment to support the system’s adaptability to different lighting conditions, and normalization processing to scale pixel values to the [0, 1] range to improve the consistency and stability of model training.

2.4.2. Feature Extraction Layer

In this stage, a convolutional neural network (CNN) is used to extract image features. Through multi-layer convolution and pooling operations, the input image is reduced from the original resolution of 256 × 256 to a feature map of 32 × 32 × 64, retaining the spatial and texture information in the image that is relevant to defect judgment.

2.4.3. Anomaly Detection Core Network

The core of the system uses a convolutional autoencoder (CAE) structure to perform reconstruction error analysis. The CAE reconstructs the input image and compares the differences between the original image and the reconstructed result (i.e., reconstruction error) to determine whether an abnormality exists in the area. A larger reconstruction error indicates a higher probability of an abnormality, making it suitable for application in unsupervised defect detection scenarios.

2.4.4. Output Layer and Evaluation Metrics

The output layer contains the following two results:
  • Anomaly Mask: Presents the abnormal area in the form of a heatmap or binary mask to visualize the location and shape of the defect;
  • Anomaly Score: Provides an anomaly score for each image or each area as a basis for judging the severity of the defect.
In the context of image quality evaluation, the Mean Squared Error (MSE) is one of the most widely used and straightforward quantitative metrics. The MSE measures the average squared difference between the corresponding pixels of two images, typically the original and the reconstructed or predicted versions. The formula is defined as follows:
MSE = 1 n i = 1 n ( x i x ^ i ) 2
where x i denotes the i-th pixel value of the original image, x ^ i represents the corresponding pixel value of the reconstructed image, and n is the total number of pixels. A lower MSE value indicates higher similarity between the two images, with a value of zero representing perfect correspondence. However, it is important to note that the MSE operates purely on pixel-level intensity differences and does not account for perceptual or structural information. As a result, it may not fully reflect visual quality as perceived by human observers, especially in applications such as image reconstruction, compression, or generation.
To address the limitations of pixel-wise metrics like the MSE in capturing perceptual quality, the Structural Similarity Index (SSIM) is widely used as a more human-aligned approach to image quality assessment. Unlike traditional metrics that focus solely on numerical differences, the SSIM evaluates the similarity between two images by simultaneously considering three perceptual components: luminance, contrast, and structural information. The SSIM formula is defined as follows:
SSIM ( x , y ) = ( 2 μ x μ y + C 1 ) ( 2 σ x y + C 2 ) ( μ x 2 + μ y 2 + C 1 ) ( σ x 2 + σ y 2 + C 2 )
In this expression, μ x and μ y represent the mean intensities of images x and y, σ x 2 and σ y 2 denote their variances, and σ x y is the covariance between them. The constants C 1 and C 2 are introduced to stabilize the division, particularly when the denominators are close to zero. SSIM values range from −1 to 1, where a value closer to 1 indicates higher structural and perceptual similarity. Due to its robustness and ability to capture image characteristics in line with human visual perception, the SSIM is now a standard metric in tasks such as image restoration, generation, compression evaluation, and overall visual quality assessment.

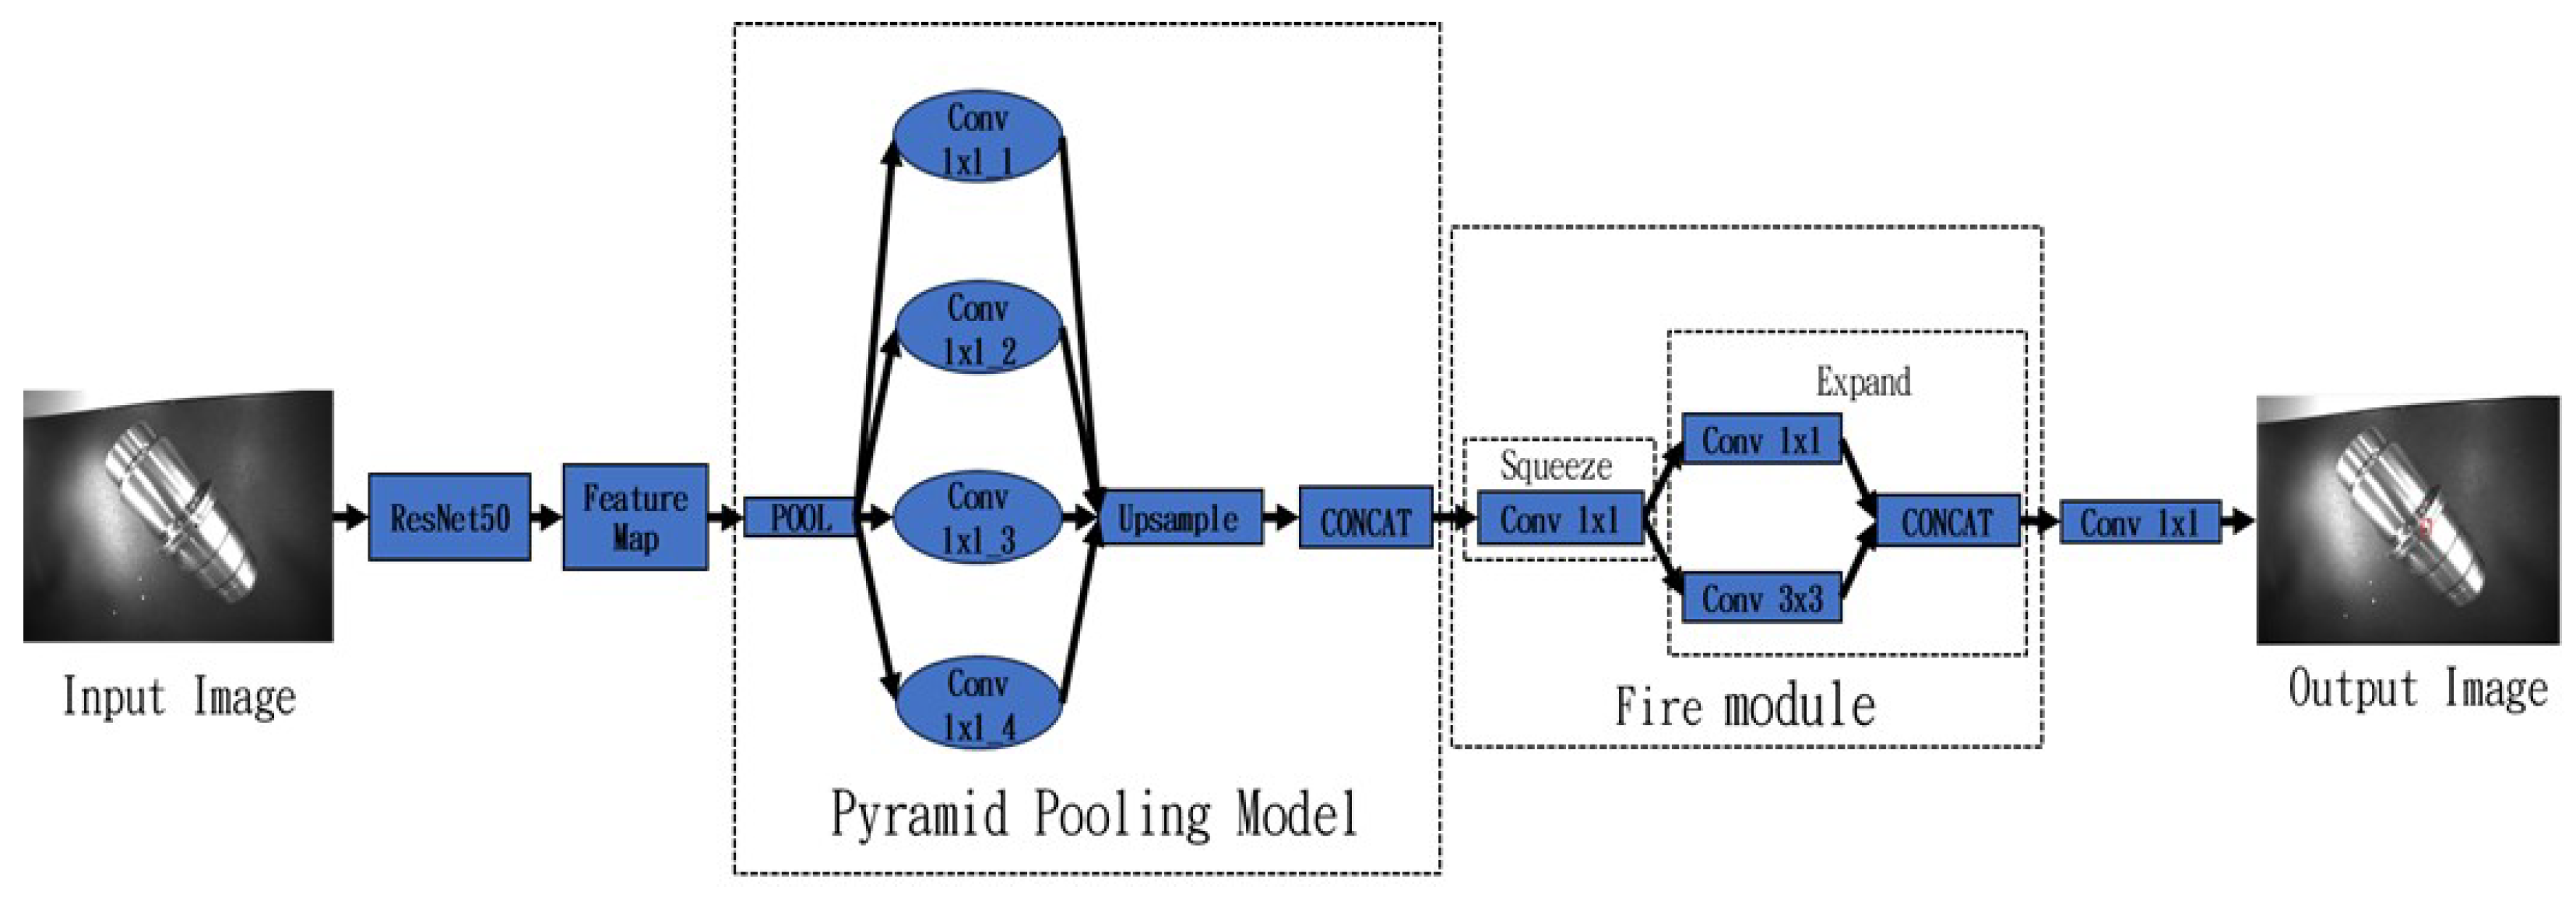
2.5. Semantic Segmentation Model for Industrial Inspection

This study uses the enhanced semantic segmentation model provided by HALCON as the core algorithm architecture in industrial image analysis. The model mainly consists of three functional modules: the ResNet-50 feature extraction module, the pyramid pooling module, and the Fire module. The overall process takes a tungsten coil image with a resolution of 512 × 512 as input and gradually extracts and compresses the image features through a series of convolution, batch normalization, and pooling operations, eventually reducing the size to 128 × 128 while retaining semantic information that is highly relevant to defect identification. The overall architecture is shown in Figure 5, and it has been optimized for industrial application scenarios.

2.5.1. Feature Extraction Phase

In the feature extraction stage, the model uses ResNet-50 as the basic network (backbone) and introduces two residual structures: BottleNeck1 and BottleNeck2. Among these, BottleNeck1 adds a 1 × 1 convolutional layer and integrates it into the skip connection to deal with the problem of an inconsistent number of input and output channels, ensuring the dimensional consistency of the feature map during the network flow. Next, multi-scale feature extraction is performed through the pyramid pooling module. The module is designed with four sets of receptive fields of different sizes (6 × 6, 3 × 3, 2 × 2, and 1 × 1) that can capture semantic information of different scales, helping facilitate the model’s ability to identify complex defect patterns. Subsequent convolutional layers further compress the number of channels, simplify the calculation process, and accelerate reasoning efficiency. Finally, the Fire module outputs a contour mask of the same size as the input image. This design can effectively reduce redundant information and model parameters and significantly shorten the time required for training and inference, making it particularly suitable for real-time industrial inspection scenarios.

2.5.2. Pretrained Deep Learning Models

HALCON provides a variety of pretrained deep learning models for different industrial application scenarios and image classification tasks, covering different levels of requirements from lightweight to high precision, including Compact, AlexNet, Enhanced, and ResNet-50, which are summarized as follows:
  • The Compact model is based on the SqueezeNet architecture. It has low memory usage and high computational efficiency, making it particularly suitable for resource-limited embedded devices and classification tasks that require instant responses.
  • AlexNet has a larger first-layer convolution kernel, which can boost feature extraction capabilities but also requires relatively more computing resources.
  • The Enhanced model has a deeper structural design and more substantial classification capabilities. It is suitable for complex or diverse classification scenarios, but it also comes with higher training and inference costs. For large input images, the model can automatically adjust the weight initialization method of the fully connected layer to extend its versatility.
  • ResNet-50 uses a residual network architecture, has high training stability and good generalization ability, and is suitable for industrial inspection and medical image analysis tasks with high-precision requirements. It is worth mentioning that when the input image size is adjusted, the weights of the fully connected layer are not affected, which makes the model highly adaptable under various application conditions.

2.5.3. Model Selection and Application

In practical applications, the selection of models often requires a balance between performance and resources. When the application scenario is limited by hardware or computing resources, it is recommended to first use the Compact model. The model architecture is lightweight and efficient, making it particularly suitable for deployment on edge devices or systems with high demands for immediate responses. When the task requires higher classification accuracy or the application scenario is more complex, it is more appropriate to choose the Enhanced model or the ResNet-50 model. Both have deeper network structures and stronger feature extraction capabilities and provide better recognition performance when handling subtle or diverse defect patterns. In general, the various deep learning models provided by HALCON have good flexibility and scalability. Users can configure them flexibly according to actual needs, ranging from low-resource applications to high-precision tasks, further helping production lines optimize defect detection efficiency and quality stability. Such flexible design also paves a broader development path for smart manufacturing applications.

2.6. Model Performance Evaluation

In order to comprehensively evaluate the performance of the model in defect detection tasks, this study adopted a number of common and representative indicators, including Precision, Sensitivity (Recall), F1 Score, Mean Pixel Accuracy (mPA), and Intersection over Union (IoU). These indicators reflect the comprehensive performance of the model in terms of prediction accuracy, error type, and regional positioning ability from different angles.

2.6.1. Precision

Precision measures the proportion of areas predicted by the model as defects that are actually real defects. The formula is as follows:
Precision = T P T P + F P
Here, T P (true positive) represents the number of pixels correctly predicted as defects, and F P (false positive) represents the number of pixels misjudged as defects.

2.6.2. Sensitivity/Recall

Sensitivity (or recall) measures the model’s ability to detect real defects, that is, the proportion of all real defects correctly predicted by the model:
Recall = T P T P + F N
Here, F N (false negative) represents the number of defective pixels missed by the model.

2.6.3. F 1 Score

The F 1 score is the harmonic mean of precision and recall, making it suitable for the overall evaluation of classification performance, especially when precision and recall are unbalanced:
F 1 = 2 × Precision × Recall Precision + Recall
The F 1 score ranges from 0 to 1, with higher values indicating better overall model performance.

2.6.4. Mean Pixel Accuracy (mPA)

The mean pixel accuracy measures the proportion of correctly predicted pixels in each class, averaged over all classes:
mPA = 1 N i = 1 N T P i T P i + F N i
where N is the total number of categories and T P i and F N i are the correctly predicted pixels and missed pixels for the ith category, respectively.

2.6.5. Intersection over Union (IoU)

IoU is a commonly used evaluation metric for regional overlap in semantic segmentation tasks used to measure the intersection and union ratio between the predicted and true labeled areas:
IoU = T P T P + F P + F N
The higher the IoU value, the more accurate the predicted area. It is particularly suitable for assessing the accuracy of defect boundaries and shapes.

3. Discussion

This section analyzes and discusses the overall effectiveness of the in-hole defect detection model and the surface anomaly detection model established in this study. We used experimental data and various evaluation metrics to compare the performance of different deep learning architectures in actual tasks and explain the performance of each model in terms of applicability, accuracy, and potential limitations. In the in-hole detection phase, this study adopted the GC-AD series architecture for modeling and tested three models: GC-AD-Combined, GC-AD-Global, and GC-AD-Local. These models are mainly used for learning and identifying logical and structural anomalies. The experimental results showed that the GC-AD-Local model was the most accurate in identifying small-scale internal defects, especially in terms of F1 score and accuracy, which were almost perfect, demonstrating that its ability to capture internal abnormal features is extremely stable and reliable. Regarding appearance detection, we initially tried to use unsupervised anomaly detection methods for classification, but this easily resulted in a high misjudgment rate in the NG area. To address this problem, we introduced the semantic segmentation architecture and selected five mainstream models (ResNet-50, MobileNetV2, Enhanced, ResNet-18, and Compact) for comparative analysis. The experimental results showed that ResNet-50 achieved stable and excellent performance in both classification accuracy and mask boundary judgment (IoU), while MobileNetV2 performed outstandingly in balancing accuracy and model efficiency, making it a suitable option for practical deployment. The following content explains the data performance of each model individually and further analyzes its stability during training, possible misjudgments, feasibility in practical applications, and future development potential.

3.1. Internal Anomaly Detection

In order to evaluate the application potential of anomaly detection technology in internal casting defect identification, this study collected and constructed a dataset containing 600 images, corresponding to 300 normal (OK) samples and 300 abnormal (NG) samples. To ensure the objectivity and consistency of model training and testing, the dataset was divided into training, validation, and test sets in a ratio of 7:1.5:1.5, corresponding to 210, 45, and 45 images, respectively.

3.1.1. Training Process

During the model training phase, we selected three anomaly detection architectures for comparison: GC-AD Combined, GC-AD Global, and GC-AD Local. The input image size of all models was uniformly set to 512 × 512 pixels, the number of epochs was 300, and the total number of iterations was about 63,000. To strengthen the adaptability of the model to actual industrial applications, we introduced a number of data augmentation strategies during the training phase to simulate the lighting and visual variations that can occur in real scenes. Specifically, the training images were randomly adjusted in brightness (±20), contrast, and saturation (±20%) before being input into the model, and a rotation change within ±3 degrees was added. These perturbations can effectively improve the robustness of the model to different photography conditions, enhancing its potential for practical deployment.

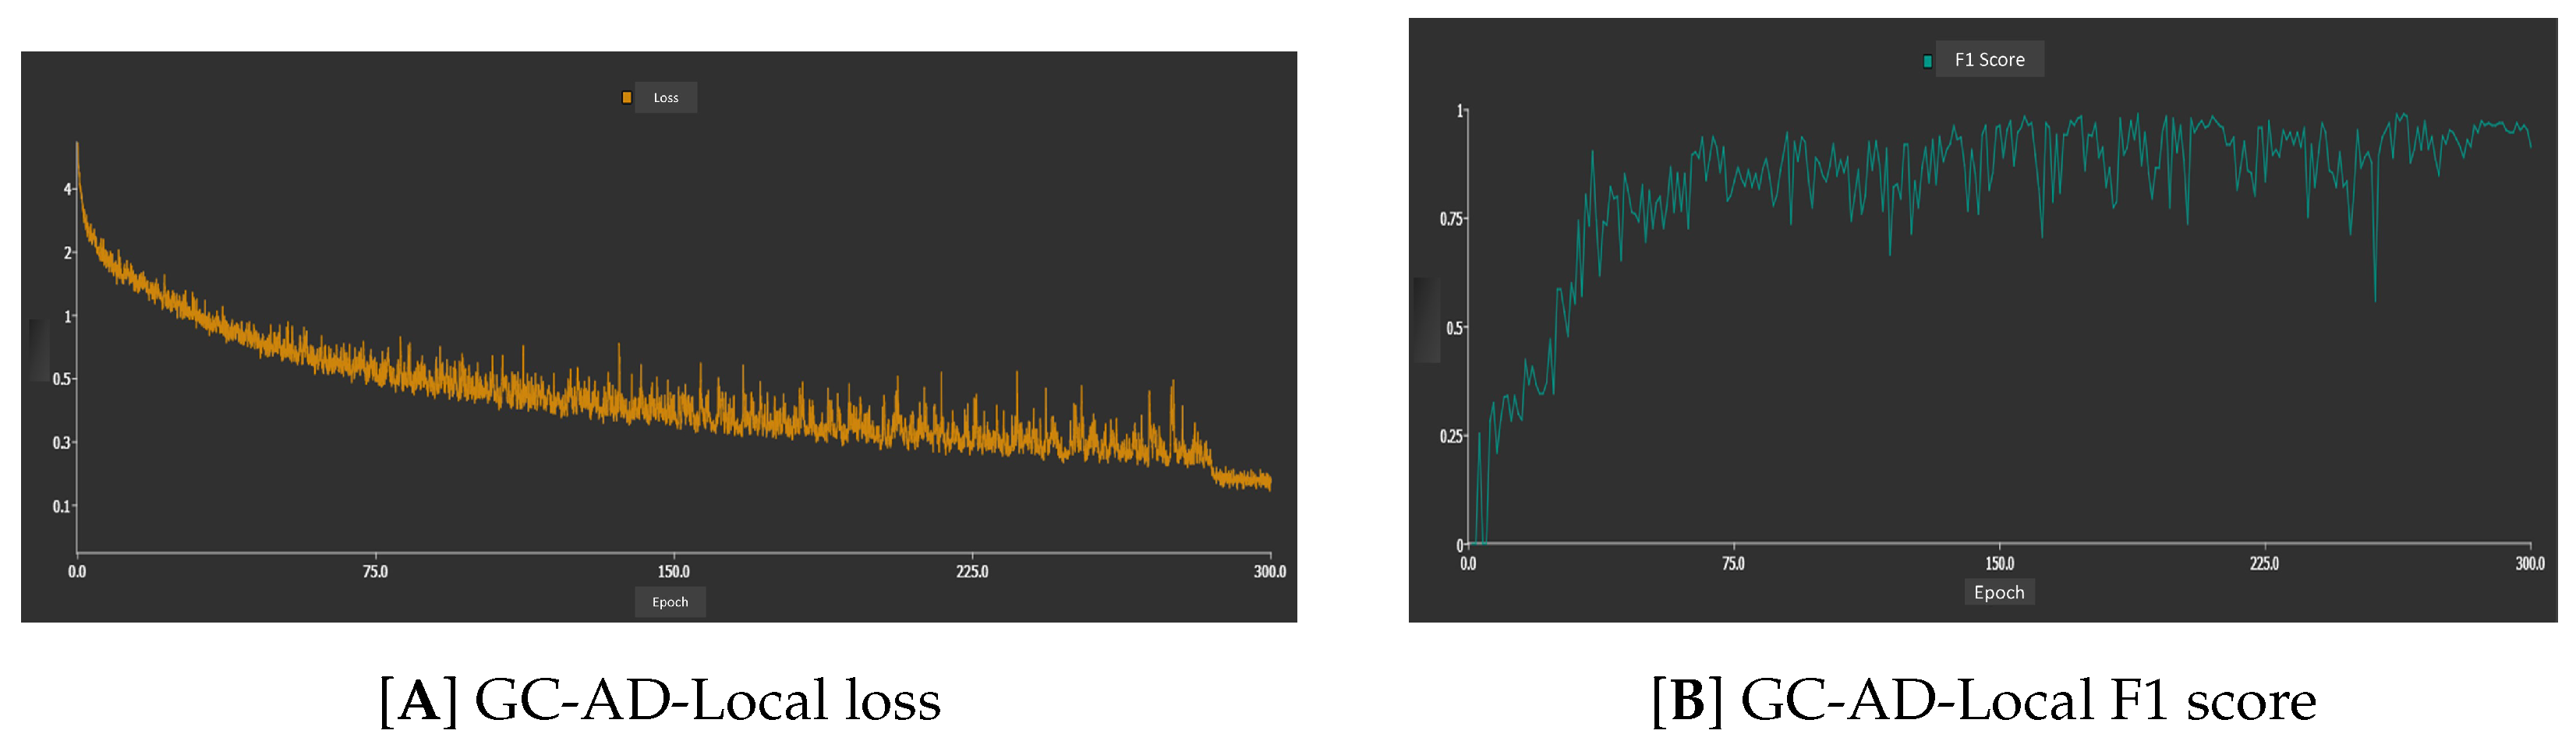
3.1.2. Loss Curve Analysis

During the training process, it was observed that the model’s loss value was about 4.5 in the early stage and gradually decreased as the training progressed, indicating that it stably learned the feature information in the images. By about the 75th epoch, the loss function converged significantly and finally stabilized at around 0.1, indicating that the model had good feature extraction capabilities and learning effects. The complete loss trend is illustrated in Figure 6.

3.2. Experimental Comparison of Anomaly Detection Models

To further analyze the performance of each model in the internal defect identification task, we conducted comparative experiments on the three architectures. Overall, the GC-AD-Local model performed the best, achieving the highest F1 score of 97.96 and 100% accuracy. It only required a small amount of training data to achieve excellent results, showing that it strikes an excellent balance between efficiency and accuracy. The GC-AD-Combined model demonstrated a good compromise between precision and recall, and its data requirements were medium to high, making it a general-purpose choice with stable performance. Although the GC-AD-Global model had the highest recall rate of 90, its accuracy was relatively low, and it was highly dependent on large amounts of training data. The results are presented in Table 1 and can be used as a reference for subsequent model deployment and resource allocation.

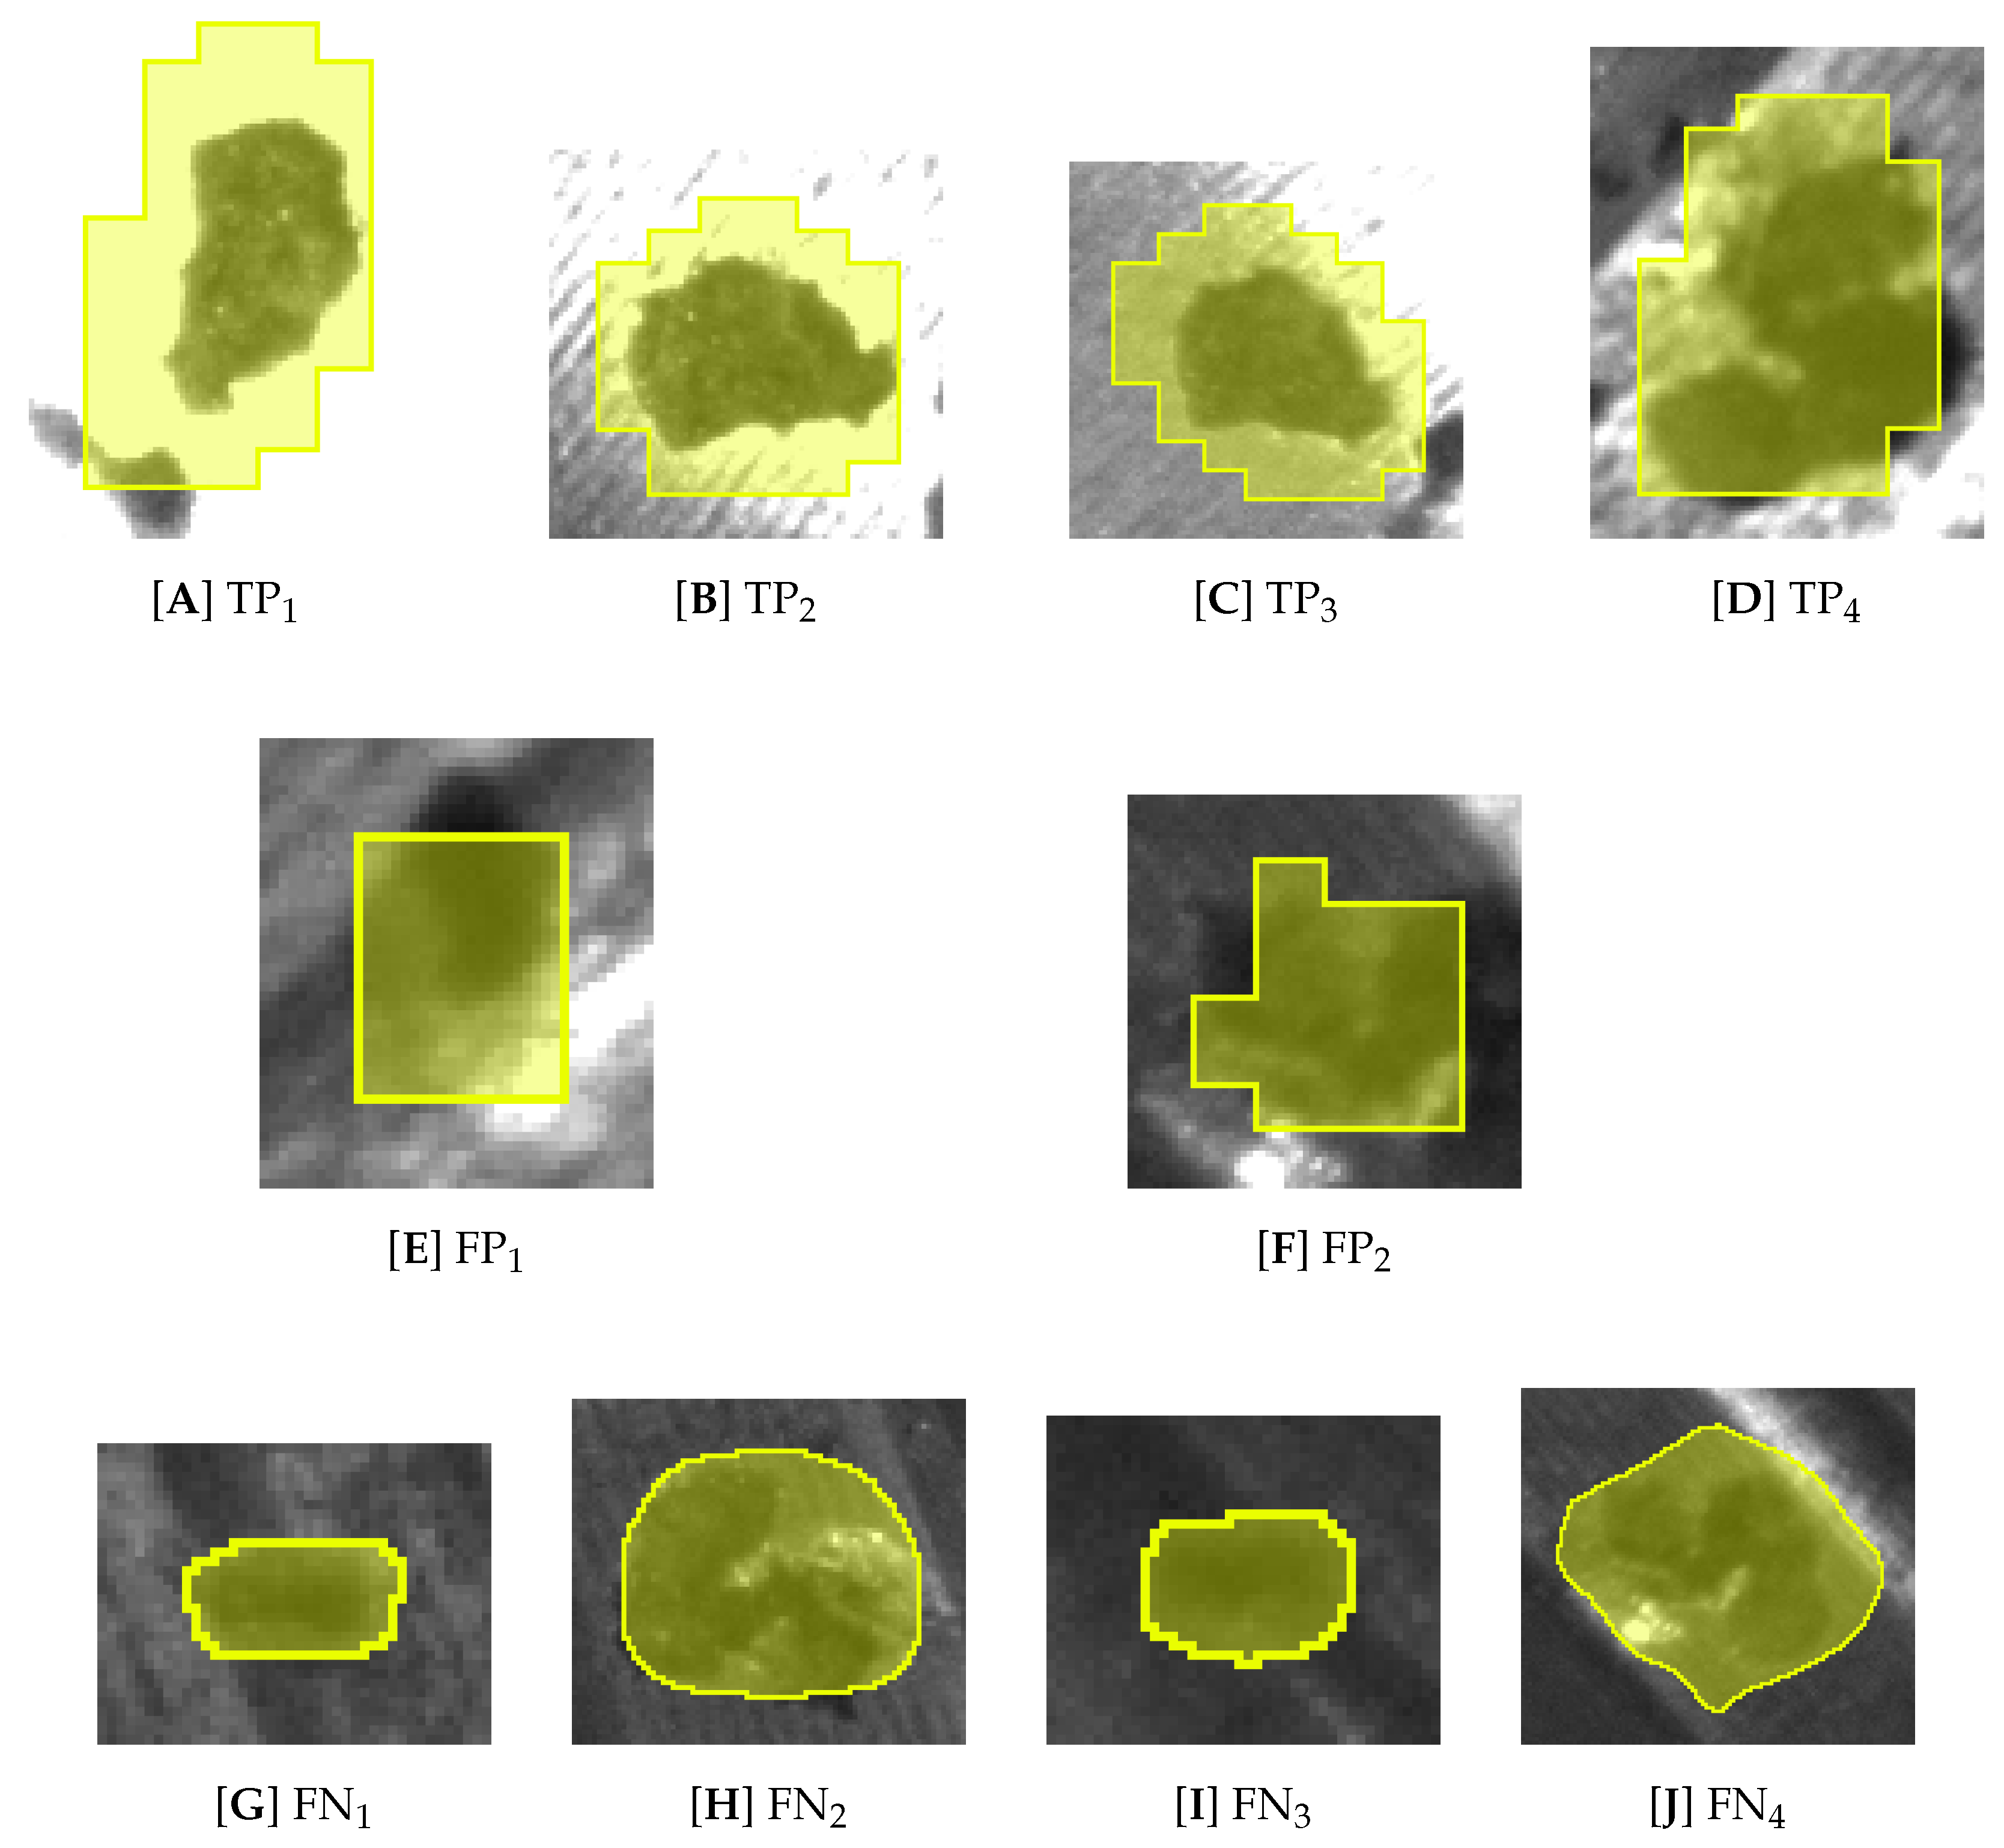
3.3. Detected Anomalies and Classification

For representative abnormal samples, the system successfully marked the anomaly in the area of the image. Its red outline was mainly concentrated on the edge of the inner wall and some interior areas. These areas may have undesirable features such as bruises, impurities, or contamination. This study first used bruises as the research object. Further analysis showed that the abnormal score of the sample was 0.607, which was significantly higher than the system preset classification threshold of 0.244. Therefore, it was finally judged as unqualified (NOK). The corresponding heat map shows the spatial distribution of abnormal areas, where warm colors (such as red and yellow) indicate a high degree of abnormality, and the abnormal area is concentrated in the internal structure. The visual results are shown in Figure 7A.

3.4. Normal Object Detection Case

In contrast, a sample determined to be normal by the model presented a completely different test result. The original image was in grayscale format and contained a part with a regular ring-like structure; it was likely obtained using endoscope equipment. The system did not detect any abnormal area in the image and clearly classified it as a normal (OK) sample. The anomaly score for this image was 0.193, which was below the classification threshold of 0.244, and it did not produce any anomaly mask regions. This result further confirms that the model can accurately distinguish abnormal and normal samples and has stable recognition capabilities. The corresponding image is shown in Figure 7B.

3.5. Performance Analysis of the Appearance Inspection Anomaly Detection Model

In the appearance anomaly detection experiment, we observed a noteworthy phenomenon: although three models (GC-AD Combined, GC-AD Global, and GC-AD Local) were used for testing, none of them accurately and completely marked all the unqualified (NG) areas. There was an obvious deviation between the abnormal area predicted by the model and the actual location of the defect. The main reason for this phenomenon was speculated to be related to the unsupervised learning strategy used by the current model architecture. Although this type of method can reduce the reliance on manual labeling, it is more difficult to accurately distinguish the semantic boundaries and specific locations of anomalies, which, in turn, affects the accuracy and interpretability of the detection result. However, in actual industrial scenarios, appearance inspection is often an indispensable key link in the quality control process. How to strengthen the model’s recognition ability at this stage becomes the focus of the next optimization. Therefore, this study introduced semantic segmentation technology to try to refine the model’s positioning accuracy and detail grasp of NG areas to increase the stability and reliability of the model in practical applications. The specific experimental results are shown in Figure 8.

3.6. Performance Analysis of the Semantic Segmentation Model for Appearance Inspection

To evaluate the learning process and actual performance of the semantic segmentation model in the appearance detection task, this study presents the change in the loss function (loss curve) and mean average precision (mAP) during training in Figure 8A,B. According to the loss curve, the loss value of the model in the initial training stage was relatively high (about 10 or more), but as training continued, the loss value exhibited a steady downward trend. After about the 125th epoch, the curve flattened out and finally stabilized in the range of 0.01 to 0.1, indicating that the model effectively converged and mastered the key features. The mAP of the training data increased significantly after 125 epochs and finally stabilized at a level of about 0.75. The overall performance was consistent and the model showed good recognition ability. For the validation data, although the mAP curve also showed an upward trend, the highest value was only about 0.4, indicating that there is still room for further strengthening of the model for unseen samples. Overall, the semantic segmentation model demonstrated its stability and learning ability on the training set. If it can be combined with more diverse data and optimized for NG area features in the future, it has the potential to further improve its recognition ability in actual application scenarios.

3.7. Performance Evaluation of Semantic Segmentation Models

This section evaluates the overall performance of the semantic segmentation models in the defect detection task using four common classification indicators as benchmarks, including precision, recall, F1 score, and mean precision. These indicators comprehensively reflect the performance of the models in accurately classifying defect areas and maintaining prediction stability.
From the experimental results, it can be observed that the MobileNetV2 and Enhanced models achieved the best overall classification performance. Among them, the accuracy of MobileNetV2 was as high as 83.33%, and the F1 score was 74.07%, demonstrating its excellent defect recognition ability and classification stability. In addition, its average precision reached 65.8%, the highest among all tested models, showing that it has good consistency and generalization ability when facing different sample conditions. The results are shown in Table 2. To help understand the model prediction behavior, Figure 9 shows the typical prediction results of the semantic segmentation models in the abnormal area detection task. The overall prediction performance can be divided into three types according to the degree of consistency with the actual defect area. First, Figure 9A–D shows the true positives (TPs), which means that the model successfully identified and accurately marked the area with defects, and its predicted mask almost overlaps with the actual defect location. Second, Figure 9E,F shows false positives (FPs), which means that although the model marked the abnormal area, there was actually no defect in the area, which is a misjudgment of detection. Finally, Figure 9G–J shows the false negatives (FNs), which means that there was indeed a defect in the image but the model failed to successfully detect it, indicating that there are still omissions in the prediction.

4. Conclusions

This study designed and developed an automatic optical inspection (AOI) system for fan casting components, integrating artificial intelligence algorithms to simultaneously perform internal hole inspection and external surface inspection in the hope of increasing the automation and accuracy of defect detection. In terms of internal defect detection, the GC-AD-Local model developed by this institute showed excellent performance, achieving 100% accuracy in the testing phase, demonstrating its excellent anomaly identification ability and stability, and verifying its practicality and reliability in internal defect detection in castings.
For external surface inspection, the traditional anomaly detection method was initially used for classification but resulted in a high misjudgment rate in NG (failed) area classification. To address this problem, this study further introduced a semantic segmentation neural network architecture and evaluated and compared the performance of five different models to improve the model’s accuracy in positioning and recognition of surface defects.
The experimental results showed that ResNet-50 and MobileNetV2 were the most stable in overall classification and mask positioning. Among them, the ResNet-50 model achieved the highest classification accuracy (79.6%), and MobileNetV2 also exhibited a well-balanced performance. Although Enhanced (76.5%) and ResNet-18 (70.4%) demonstrated relatively good classification capabilities, they were prone to misjudging defective areas or detecting inaccurate boundaries due to their low mask positioning (IOU) performance. The overall performance of the Compact model was relatively poor, with an accuracy of only 51.6%, accompanied by a large number of NG misclassifications and mask errors, indicating that it is unsuitable for semantic segmentation tasks.
Overall, this study proves that the AOI system combined with a deep learning architecture not only effectively reduces the burden of manual inspection but also reinforces the accuracy of casting defect classification and positioning, helping establish an intelligent and standardized process quality monitoring mechanism. Future research can further develop in the direction of algorithm efficiency, mask boundary optimization, and multi-process cross-domain applications and continue to promote the practical implementation and application expansion of smart manufacturing and automatic anomaly detection technology. The AOI system described in this study has completed its prototype development. Relevant industry partners are currently in the process of scheduling and planning its integration into a mass production project.

Author Contributions

Methodology, T.-H.C. and M.-C.C.; investigation, M.-C.C. and S.-Y.Y.; writing—original draft preparation, T.-H.C. and M.-C.C.; validation, Y.-F.L.; writing—review and editing, T.-H.C.; supervision, Y.-F.L. and M.-Y.T. All authors have read and agreed to the published version of the manuscript.

Funding

This research received no external funding.

Data Availability Statement

The data supporting this study are not publicly available as they are intended for internal research use only.

Acknowledgments

During the preparation of this manuscript/study, the author(s) used - MVTec HALCON HDevelop 24.05 Progress for DeepLearning System build. The authors have reviewed and edited the output and take full responsibility for the content of this publication.

Conflicts of Interest

The authors declare no conflicts of interest.

References

  1. Ding, H.; Gao, R.; Isaksson, A.; Landers, R.; Parisini, T.; Yuan, Y. State of AI-Based Monitoring in Smart Manufacturing and Introduction to Focused Section. IEEE/ASME Trans. Mechatron. 2020, 25, 2143–2154. [Google Scholar] [CrossRef]
  2. Ghelani, H. AI-Driven Quality Control in PCB Manufacturing: Enhancing Production Efficiency and Precision. Int. J. Sci. Res. Manag. (IJSRM) 2024, 12, 1549–1564. [Google Scholar] [CrossRef]
  3. Cevallos, M.G.O.; Jaramillo, G.A.L.; Vélez, J.L.B.; Zambrano, M.I.U.; Montesdeoca, L.D.Z.; Palomeque, M.A.B. Implementation of Artificial Intelligence in Quality Management in SMEs: Benefits and Challenges. Evol. Stud. Imaginative Cult. 2024, 1489–1500. [Google Scholar] [CrossRef]
  4. Arinez, J.; Chang, Q.; Gao, R.; Xu, C.; Zhang, J. Artificial Intelligence in Advanced Manufacturing: Current Status and Future Outlook. J. Manuf. Sci. Eng. 2020, 142, 110804. [Google Scholar] [CrossRef]
  5. Rakholia, R.M.; Suárez-Cetrulo, A.L.; Singh, M.; Carbajo, R.S. Advancing Manufacturing Through Artificial Intelligence: Current Landscape, Perspectives, Best Practices, Challenges, and Future Direction. IEEE Access 2024, 12, 131621–131637. [Google Scholar] [CrossRef]
  6. Lodhi, S.K.; Gill, A.Y.; Hussain, I. AI-Powered Innovations in Contemporary Manufacturing Procedures: An Extensive Analysis. Int. J. Multidiscip. Sci. Arts 2024, 3, 15–25. [Google Scholar] [CrossRef]
  7. Roy, R.; Srivastava, A. Role of Artificial Intelligence (AI) in Enhancing Operational Efficiency in Manufacturing Medical Devices. J. Multidiscip. Res. 2024, 4, 35–40. [Google Scholar] [CrossRef]
  8. Patel, P. Impact of AI on Manufacturing and Quality Assurance in Medical Device and Pharmaceuticals Industry. Int. J. Innov. Technol. Explor. Eng. 2024, 13, 9–21. [Google Scholar] [CrossRef]
  9. Ejjami, R.; Boussalham, K. Industry 5.0 in Manufacturing: Enhancing Resilience and Responsibility through AI-Driven Predictive Maintenance, Quality Control, and Supply Chain Optimization. Int. J. Multidiscip. Res. 2024, 6, 1–31. [Google Scholar] [CrossRef]
  10. Lin, X. Artificial Intelligence in the Industrial Engineering. Adv. Oper. Res. Prod. Manag. 2024, 1, 1–6. [Google Scholar] [CrossRef]
  11. Du, W.; Shen, H.; Fu, J.; Zhang, G.; He, Q. Approaches for improvement of the X-ray image defect detection of automobile casting aluminum parts based on deep learning. NDT E Int. 2019, 107, 102144. [Google Scholar] [CrossRef]
  12. Li, X.; Tso, S.; Guan, X.; Huang, Q. Improving Automatic Detection of Defects in Castings by Applying Wavelet Technique. IEEE Trans. Ind. Electron. 2006, 53, 1927–1934. [Google Scholar] [CrossRef]
  13. Duan, L.; Yang, K.; Ruan, L. Research on Automatic Recognition of Casting Defects Based on Deep Learning. IEEE Access 2021, 9, 12209–12216. [Google Scholar] [CrossRef]
  14. Galan, U.; Orta, P.; Kurfess, T.; Ahuett-Garza, H. Surface defect identification and measurement for metal castings by vision system. Manuf. Lett. 2018, 15, 5–8. [Google Scholar] [CrossRef]
  15. Li, Y.; Jiang, H.; Zhao, H.; Li, X.; Wang, Q. Surface defect detection of metal castings based on Centernet. In Proceedings of the International Conference on Optical and Photonic Engineering (icOPEN 2022), Online, China, 24–27 November 2022; Volume 12550, p. 125501K. [Google Scholar] [CrossRef]
  16. Ferguson, M.; Ronay, A.; Lee, Y.T.; Law, K. Detection and Segmentation of Manufacturing Defects with Convolutional Neural Networks and Transfer Learning. Smart Sustain. Manuf. Syst. 2018, 2, 137–164. [Google Scholar] [CrossRef]
  17. Lin, C.H.; Ho, C.W.; Hu, G.H.; Kuo, P.C.; Hu, C.Y. Alloy Cast Product Defect Detection Based on Object Detection. In Proceedings of the 2021 International Symposium on Intelligent Signal Processing and Communication Systems (ISPACS), Hualien City, Taiwan, 16–19 November 2021; pp. 1–2. [Google Scholar] [CrossRef]
  18. Hossain, S.; Krenek, R.; Taheri, H.; Dababneh, F. Ultrasonic Phased Array Technique for Defect Detection and Sizing in Heavy-Walled Cast Components. In Proceedings of the ASME 2020 International Mechanical Engineering Congress and Exposition, Virtual, 16–19 November 2020; Volume 2B: Advanced Manufacturing. [Google Scholar] [CrossRef]
  19. Raj, V.; Srihari, M.; Mohan, D.A. Casting defect detection using YOLO V4. Int. Res. J. Mod. Eng. Technol. Sci. 2021, 3, 1581–1585. [Google Scholar]
  20. Sundaram, S.; Zeid, A. Artificial Intelligence-Based Smart Quality Inspection for Manufacturing. Micromachines 2023, 14, 570. [Google Scholar] [CrossRef]
  21. Oh, S.; Cha, J.M.; Kim, D.; Jeong, J. Quality Inspection of Casting Product Using CAE and CNN. In Proceedings of the 2020 4th International Conference on Imaging, Signal Processing and Communications (ICISPC), Kumamoto, Japan, 23–25 October 2020; pp. 34–38. [Google Scholar] [CrossRef]
  22. Jaśkowiec, K.; Wilk-Kołodziejczyk, D.; Bartłomiej, Ś.; Reczek, W.; Bitka, A.; Małysza, M.; Doroszewski, M.; Pirowski, Z.; Boroń, Ł. Assessment of the Quality and Mechanical Parameters of Castings Using Machine Learning Methods. Materials 2022, 15, 2884. [Google Scholar] [CrossRef]
  23. Nguyen, T.; Choi, S.; Park, S.J.; Park, S.H.; Yoon, J. Inspecting Method for Defective Casting Products with Convolutional Neural Network (CNN). Int. J. Precis. Eng. Manuf.-Green Technol. 2020, 8, 583–594. [Google Scholar] [CrossRef]
  24. Hu, H.; Li, S.; Huang, J.; Liu, B.; Che, C. Casting Product Image Data for Quality Inspection with Xception and Data Augmentation. J. Theory Pract. Eng. Sci. 2023, 3, 42–46. [Google Scholar] [CrossRef]
  25. Lin, C.H.; Hu, G.H.; Ho, C.W.; Hu, C.Y. Press Casting Quality Prediction and Analysis Based on Machine Learning. Electronics 2022, 11, 2204. [Google Scholar] [CrossRef]
  26. Sharma, G.; Anand, V.; Chauhan, R.; Pokhariya, H.; Gupta, S.; Sunil, G. Advanced Deep Learning Methods for Comprehensive Quality Inspection and Fault Detection in Casting Processes. In Proceedings of the 2024 2nd International Conference on Advancement in Computation & Computer Technologies (InCACCT), Gharuan, India, 2–3 May 2024; pp. 602–606. [Google Scholar] [CrossRef]
  27. Maheswari, M.; Brintha, N.C. A Survey on Detection of Various Casting Defects Using Deep Learning Techniques. In Proceedings of the 2024 2nd International Conference on Intelligent Data Communication Technologies and Internet of Things (IDCIoT), Bengaluru, India, 4–6 January 2024; pp. 1436–1440. [Google Scholar] [CrossRef]
  28. Bolla, B.; Kingam, M.; Ethiraj, S. Efficient Deep Learning Methods for Identification of Defective Casting Products. arXiv 2022, arXiv:2205.07118. [Google Scholar] [CrossRef]
Figure 1. Internal defect detection system.
Machines 13 00317 g001
Figure 2. Appearance defect detection system.
Machines 13 00317 g002
Figure 3. Flowchart of the optical inspection system.
Machines 13 00317 g003
Figure 4. Architectureof the anomaly detection model.
Machines 13 00317 g004
Figure 5. Architecture of the semantic segmentation model.
Machines 13 00317 g005
Figure 6. GC-AD-Local loss and F1 score.
Machines 13 00317 g006
Figure 7. GC-AD-Local results.
Machines 13 00317 g007
Figure 8. Semantic Segmentation Loss and F1 and Score.
Machines 13 00317 g008
Figure 9. Evaluation of semantic segmentation models.
Machines 13 00317 g009
Table 1. Performance comparison of anomaly detection models.
ModelLoss ValueF1 ScoreAccuracy (%)Recall
GC-AD-Combined0.53984696.1596.352
GC-AD-Global0.19308496.1583.3390
GC-AD-Local0.41071597.9610096
Table 2. Performance evaluation of semantic segmentation models.
ModelPrecision (%)Recall (%)F1 Score (%)Mean Precision (%)
Compact69.2360.0064.2947.97
Enhanced83.3366.6774.0759.31
MobileNetV283.3366.6774.0765.80
ResNet-1866.6753.3359.2649.97
ResNet-5069.2360.0064.2955.05
Disclaimer/Publisher’s Note: The statements, opinions and data contained in all publications are solely those of the individual author(s) and contributor(s) and not of MDPI and/or the editor(s). MDPI and/or the editor(s) disclaim responsibility for any injury to people or property resulting from any ideas, methods, instructions or products referred to in the content.

