Abstract
Bridge cranes generally have a significant disparity between their actual service life and design life. If they are scrapped according to the design life, it is likely to result in resource wastage or pose potential safety hazards due to extended service. Existing studies have not thoroughly examined the coupling relationship among actual working conditions, structural damage, and load-matching strategies. It is difficult to achieve real-time and accurate adaptation between loads and the carrying capacity of equipment, and thus cannot effectively narrow this life gap. To this end, this paper defines a digital twin system framework for crane load adaptive matching, constructs a load adaptive matching optimization model, proposes a method for developing a digital twin system for bridge crane load adaptive matching, and builds a digital twin system platform centered on virtual-real mapping, IoT connectivity, and data interaction. Detailed experimental verification was conducted using the DQ40 kg-1.8 m-1.3 m light-duty bridge crane. The results demonstrate that this method and system can effectively achieve dynamic matching between the load and real-time carrying capacity. While ensuring the service life exceeds the design life, the difference between the two is controlled at around 3467 cycles, accounting for approximately 0.000462% of the design life. This significantly improves the equipment’s operational safety and resource utilization efficiency, breaks through the limitations of load reduction schemes formulated based on human experience under the traditional regular inspection mode, and provides a scientific load-matching decision-making basis and technical support for special equipment inspection institutions and users.
1. Introduction
With the acceleration of industrialization, cranes play an indispensable role in key sectors such as industrial production, logistics transportation, and building construction. Ensuring its safe operation is critical [1]. Currently, the design life of a crane is determined during the design stage by selecting a ‘work level’ based on user requirements and designers’ subjective experience. This ‘work level’ aims to characterize equipment workload through rough estimations of usage intensity and load state, a method fraught with ambiguity and uncertainty [2,3]. In terms of fatigue life, crane metal structures inevitably accumulate diverse damage during long-term service due to combined internal and external factors, resulting in heterogeneous degradation patterns across crane models and even different cranes within the same model [4]. Consequently, a significant gap exists between the design life and the actual service life (fatigue life) of cranes in real-world scenarios.
Currently, this gap has become the focus of industry attention. According to crane design specifications of various countries, the theoretical design life of bridge cranes commonly ranges from 30 to 50 years. However, two extreme scenarios exist in practical engineering applications. On one hand, a large number of cranes suffer from serious structural damages (such as cracks, deformation, corrosion, etc.) after being in service for only about 20 years or even a shorter period. Some of these cases have even led to safety accidents. On the other hand, a small number of cranes, due to long-term idleness or low-load operation, have been in service for well over 50 years. In such scenarios, if the scrapping decision is strictly made in accordance with the design life, it may lead to two extreme consequences: first, major safety accidents caused by ‘over-service’. Second, resource waste resulting from ‘early retirement’. Therefore, resolving the discrepancy between the design life and fatigue life of cranes is extremely important. Currently, although there are no direct studies focusing on this life discrepancy, scholars at home and abroad have conducted extensive research over the years on topics such as the safe service of cranes and the efficient utilization of resources and energy. Their findings can provide ideas and scheme support for narrowing the aforementioned discrepancy.
In terms of the safe service of cranes, Wei et al. [5] revealed the stiffness degradation law of main girders, residual carrying capacity, and evolutionary characteristics of fatigue damage by analyzing data from scrapped cranes, and clarified the correlation between static stiffness and fatigue damage. Moi et al. [6] proposed an inverse method based on strain gauges and real-time nonlinear simulation and developed a digital twin system for condition monitoring of small folding-arm cranes, which improves safety and reliability. Szpytko et al. [7] improved the maintenance strategy for bridge cranes by utilizing historical degradation data and the Monte Carlo model and incorporating the copula method to capture the multi-machine degradation dependency relationships. Huang et al. [8] established a wind force coefficient prediction model based on a convolutional neural network and optimized the cross-sectional design of main girders in combination with a genetic algorithm, which significantly enhanced wind resistance performance and computational efficiency. The aforementioned studies primarily revolve around aspects including safety monitoring, usage and maintenance, and fatigue assessment of cranes, and have enhanced the safety of hoisting machinery during its service from a preventive perspective.
In terms of the efficient utilization of resources and energy for cranes, Palanisamy et al. [9] applied an improved hybrid particle swarm optimization algorithm (Harris Hawk Optimization) to optimize wire rope characteristics (such as hardness and wear). This approach enhanced the carrying capacity of tower cranes without increasing the specifications of wire ropes. Zhou et al. [10] adopted the continuum topology optimization method (SKO method) to establish periodic plate-beam models for the jib for optimization. The effectiveness was verified through analyses of strength, stiffness, and stability. Jiang et al. [11] proposed an intelligent stacker structural optimization scheme to meet the requirements of heavy-load and high-precision handling. The comprehensive stiffness was calculated through the contact force of V-shaped rollers, and it has been verified to meet the practical engineering requirements. Tang et al. [12] used a parallel layout method to solve the problem of integrated scheduling of multiple resources (cranes) in container terminals. With energy conservation as the goal, they optimized task allocation and operation sequences, providing comprehensive decision-making support. Alasali et al. [13] developed a genetic algorithm-based stochastic optimal management system for controlling energy storage networks equipped with gantry cranes. Case studies show that it outperforms standard controllers in terms of electricity cost savings and peak demand reduction. The aforementioned studies mainly focus on structural optimization, integrated scheduling, and energy storage management to improve the resource and energy utilization efficiency of cranes.
The aforementioned achievements can provide ideas and scheme support for research on crane load adaptive matching methods. However, they mostly focus on optimization in a single link (such as analysis only based on monitoring data or isolated fatigue assessment models) and lack systematic consideration of the dynamic changes in actual working conditions and the coupling relationship between structural damage and load matching strategies. Therefore, it is difficult to narrow the gap between the design life and the actual service life from the perspective of real-time and accurate adaptation between loads and equipment status. However, with the rapid development of digital twin technology, a virtual model of a physical entity can be constructed digitally to simulate the real-world behavior of the physical entity through data. Moreover, by virtue of virtual-real interaction, data fusion, and decision iteration, it can provide a new technical path for solving this problem.
In terms of Digital Twin (DT) technology, Tao et al. [14] proposed the conceptual connotation and reference architecture of aero-engine digital twin engineering. They analyzed its value in improving the intelligence, initiative, and predictability of aero-engine design, manufacturing, and testing, as well as operation and maintenance, and clarified the key technologies involved. Liu et al. [15] reviewed the application status of this technology in logistics and supply chain management and provided references for subsequent research and application development through a systematic literature review. Hussain et al. [16] developed a digital twin-driven framework and model for predicting the decline in lifting capacity of aging tower cranes based on real-time load and deflection data, enabling dynamic and real-time monitoring of their service safety. Zhu et al. [17] constructed a milling process simulation and tool wear prediction system, which simulates material removal through symbiotic interaction and control between physical and virtual spaces, meeting the intelligent and digital requirements of milling robots. Hoskere et al. [18] proposed a unified development framework for bridge digital twins, providing a structured method for constructing effective systems and enhancing bridge management decision-making. Wang et al. [19] designed a digital twin system for deep-sea mining hoses, which realizes real-time response prediction and early hazard warning by integrating mechanical parameter prediction models. Lin et al. [20] proposed a digital twin-based safety monitoring method, which achieves seamless human-robot collaboration on construction sites by integrating spatial information of workers, materials, and robots to improve efficiency. Shao et al. [21] developed a visual system for dam safety monitoring based on a digital twin platform, which integrates functions such as monitoring data to accurately reflect the dam’s status and real-time information.
Although DT technology has proven its value in multiple fields, for cranes, the challenge of how to construct a crane digital twin system oriented towards dynamic and adaptive load matching to proactively narrow the gap between design life and fatigue life while simultaneously maximizing safety and resource utilization efficiency remains unsolved effectively.
To this end, starting from the phenomenon of crane carrying capacity degradation, this paper takes the digital twin system framework for load-adaptive matching as the foundation and the load-adaptive matching method as the support. Focusing on virtual-physical space construction, IoT connectivity, and load-adaptive matching services, a digital twin model for load-adaptive matching is constructed through virtual-physical mapping, data transmission, and interaction. Combining functional module design and system development processes, a digital twin system platform is built. While monitoring the service status of cranes, it realizes dynamic and adaptive adjustment of lifting loads.
2. Problem Description
The design personnel determine the crane’s design life as T0 based on user requirements. However, during actual service operations, the crane may encounter complex working conditions and defects exceeding design assumptions, resulting in significant disparity between the design life and actual service life (defined as the fatigue life required for crack propagation from initial length a0 to critical length ac).
In the traditional scheduled inspection mode, when inspections reveal that the evaluated actual fatigue life of a crane’s metal structure is less than its design life T0 and has approached or reached the early-warning threshold requiring intervention measures, a load reduction scheme for the crane is typically formulated by experts or operators based on their past experience. In terms of practical application effects, this method can extend the service life of cranes to a certain extent. However, its limitation lies in the fact that due to the lack of in-depth analysis and accurate calculation of factors such as the actual working conditions, structural characteristics, and material properties of cranes, the load reduction schemes formulated accordingly may result in either excessive or insufficient load reduction (see Figure 1), making it difficult to achieve accurate and reasonable effects.
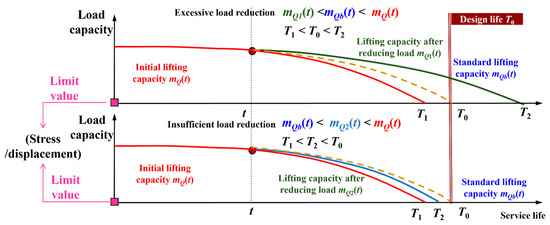
Figure 1.
Load reduction phenomenon under the traditional fixed inspection mode.
As shown in Figure 1, after the crane has been operating with an actual lifting weight of mQ(t) for a certain period, a load reduction scheme is formulated based on experience at time t, adjusting the lifting weight to mQ1(t). If mQ1(t) is lower than mQb(t), the standard lifting weight for the crane under normal and reasonable operation, it will cause the service life after load reduction T2 to exceed the design life T0. In such cases, scrapping the crane in accordance with T0 would lead to resource waste, which is classified as excessive load reduction. If mQ1(t) is higher than mQb(t), the service life after load reduction T2 will be shorter than the design life T0. In such cases, scrapping the crane in accordance with T0 will lead to over-service operation, which may cause major safety accidents and is classified as insufficient load reduction.
To address the aforementioned issues, this paper proposes a load adaptive matching method, the principle of which is shown in Figure 2. ① During the 0~t1 period, when operating with lifting capacity mQ(t1), the crack propagates from a0 to a1. Predictive analysis reveals that continuing this load would result in a predicted service life T1 (when carrying capacity degrades to a critical level) substantially shorter than T0. Consequently, load recommends reduced capacity mQ(t1)’ < mQ(t1). ② Throughout the t1~t2 period, though users reference the recommended value mQ(t1)’, they adopt an overly conservative mQ(t2). Subsequent crack growth to a2 yields predicted service life T2 > T0, necessitating reloading optimization to suggest increased capacity mQ(t2)’ > mQ(t2). ③ Iteratively, during the tn−1 ~ tn period (n = 3 in Figure 2), when users adopt the lifting capacity mQ(tn), and it is determined that the actual service life is Tn = T0 as the crack propagates from an−1 to an, it indicates that mQ(tn)’ = mQ(tn) = mQ(tn−1)’.

Figure 2.
Principle of load adaptive matching.
In summary, compared with the crane load reduction schemes formulated based on human experience in the traditional scheduled inspection mode, the load adaptive matching method can explicitly provide recommended load values and offer users accurate load matching schemes. In addition, the application of a digital twin system for bridge crane load adaptive matching can minimize the discrepancy between the design life and the actual service life, thereby avoiding safety issues caused by over-service operation or resource waste resulting from premature scrapping.
3. Digital Twin Framework for Adaptive Matching of Crane Loads
Supported by the crane load adaptive matching method (see Section 4), the 5-dimensional Digital Twin (DT) model [22] (see Equation (1)) is introduced. Aiming at aspects such as virtual-physical mapping, data fusion and interaction, and information visualization, a method for developing a digital twin system for load adaptive matching is proposed (see Section 5). Through the digital twin system platform, the operating status of physical entities is presented in real time. Combined with algorithms, strategies, pre-accumulated knowledge, information, data, and structural carrying capacity, it realizes real-time adaptive load matching. The specific framework is shown in Figure 3.
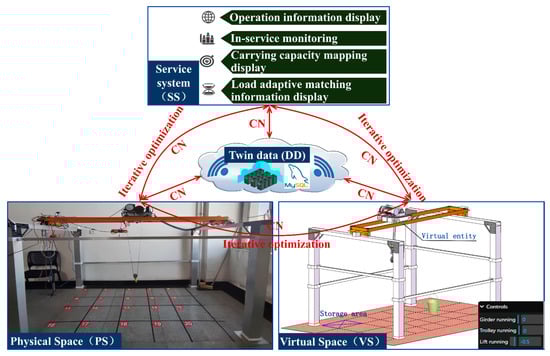
Figure 3.
Digital twin system framework for load-adaptive matching of bridge cranes.
DT = (PS, VS, SS, DD, CN)
Physical Space (PS) encompasses the operational scenarios and physical activities of cranes related to load-carrying capacity degradation. Its primary functions include operational control and real-time data acquisition. Networked sensors are installed at critical components to collect multi-source heterogeneous data, with implementation details provided in Section 5.1, ‘(1) Physical space’.
Virtual Space (VS) serves not only as a three-dimensional mirror of the physical space (PS) of the crane but also as a carrier for simulation analyses of the operational conditions, structural load-bearing capacity, and load-matching strategies of cranes. The virtual model within the VS is an equal-proportion simulation model established based on the inherent structure, interrelationships, behaviors, and functional characteristics of the crane’s physical entity. It accurately replicates the operational status of the physical entity, enabling dynamic simulation and portrayal in terms of operational states and performance characteristics. The specific construction and mapping schemes are detailed in Section 5.1, ‘(2) Virtual space’.
Internet of Things Connectivity (CN) facilitates data transmission and communication among the five-dimensional model components, enabling seamless data transfer and real-time state synchronization between the physical crane and its digital twin. In accordance with the ISO/OSI communication standards, the communication system of the digital twin model can be implemented using wired or wireless technologies. The detailed construction schemes and procedures are provided in Section 5.2, ‘(1) Hardware connection’.
Digital Twin Data (DD) represents the most fundamental concept within the digital twin model framework and serves as the driving force behind it. The multi-source heterogeneous data of the crane can be classified into three categories based on their types and properties: Physical Entity Data (PED), Virtual Entity Data (VED), and Fused Derived Data (FDD) (see Table 1). Specific construction methods are provided in Section 5.2, ‘(2) Data Transmission and Interaction’.

Table 1.
Structure of twin databases.
Service System (SS) enables the service-oriented encapsulation of various types of information generated during the digital twin application process, such as models, data, algorithms, simulations, and results. This includes functional services that support the internal operation of the twin system in the forms of tool components, middleware, and module engines, as well as business services that meet user needs in software form. For specific implementation methods, see Section 5.3.
4. Load Adaptive Matching Method
Based on the principle of load adaptive matching (see Figure 2), a load adaptive matching method for bridge traveling cranes is proposed from three aspects: acquisition of fatigue life sample data, construction of a fatigue life prediction model, and construction of a load adaptive matching optimization model.
4.1. Fatigue Life Sample Data Acquisition
(1) Fatigue life sample construction
The handling path Pb of the bridge crane is determined by the moving distance of the crane Ld and the moving distance of the trolley Lx. Taking the handling path Pb, lifting capacity mQ, and crack length al as inputs, and the corresponding fatigue life (for specific calculation, see (2)) Fatigue life assessment method) as the output, a sample dataset for subsequent fatigue life prediction is constructed.
(2) Fatigue life assessment method
Data collection is performed on the service information of the crane’s physical entity, including the crane moving distance Ld, trolley moving distance Lx, lifting height h, lifting capacity mQ, as well as the corresponding bridge structure deformation fs and measuring point strain data (the measurement positions are shown in Figure 4). The detailed collection scheme and process are provided in ‘Section 5.2 Crane operation information collection module’.
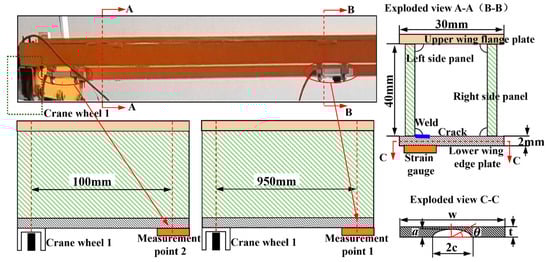
Figure 4.
Crack location and detailed diagram.
During the data collection process, it is inevitable for the sensing system to encounter issues such as missing data, anomalies, and duplicates due to environmental, equipment, or human factors. Additionally, differences in sampling frequencies may lead to problems like data mismatch, massive data volume, and increased storage costs. To address these issues, based on the collected multi-source information data, data preprocessing technologies [23] (including data cleaning, integration, and reduction) are utilized to convert them into a basic dataset that can be used for the construction of fatigue life sample data.
Meanwhile, according to the basic provisions of GB/T 30024-2020 ‘Verification of Metal Structure Capacity of Cranes’ [24], the material of the crane is within the linear elastic range, and the stress calculation shall comply with Hooke’s Law. Thus, strain data can be converted into stress data by Equation (2):
where E is the elastic modulus of the material, with E = 2.06 × 10⁵ MPa. represents the microstrain, in με, and denotes the stress time history, in MPa.
Based on the preprocessed stress time histories at measurement points, the 8-level stress amplitude spectra and mean stress spectra for corresponding points are extracted using the Stepwise Rainflow Counting Method (SRCM) [25]. Combining with the Goodman line [26], the stress amplitude spectra at each level are converted to obtain the stress ranges, eliminating mean stress effects (i.e., stress ratio r = 0). This conversion can be calculated using the following expression:
where, represents the stress range at the i-th level after eliminating the mean stress effect, where i = 1,2, …,8, in MPa. denotes the stress amplitude at the i-th level, in MPa. is the mean stress at the i-th level, in MPa. is the fatigue strength of the material when the stress cycle characteristic r = −1, in MPa. stands for the ultimate strength of the material, in MPa. For the material of bridge cranes, Q235B is usually selected, with an ultimate strength = 400 MPa and a fatigue strength = 180 MPa.
On this basis, the equivalent stress method is adopted, and the variable-amplitude spectrum is converted into a constant-amplitude spectrum using Equation (4), thereby achieving the equivalent conversion of stress ranges at all levels.
where, is the equivalent stress range with the unit of MPa. represents the number of cycles corresponding to the stress amplitude at the i-th level. is the damage equivalent parameter, which is usually set to 2.
As a typical welded structural component, the bridge structure of a crane inevitably has initial defects such as blowholes, slag inclusions, and poor welds during the welding process. These initial defect locations are highly likely to become crack initiation sources, and under the continuous action of variable loads, the cracks will gradually propagate until fracture occurs. To address this issue, the Paris model [27] can be used to evaluate the fatigue life at the measuring points of the bridge structure when an initial crack a0 propagates to any crack length al (or critical crack ac) under the action of the equivalent stress range. Its calculation formula is as follows:
where, denotes the number of stress cycles at the measuring point of the bridge structure when a crack propagates from a0 to al under the action of the equivalent stress range . C and m are material parameters for Q235B [28]; C = 2.61 × 10⁻¹³ and m = 3.07 in general. F is the geometric correction factor, which can be calculated using Equation (6).
where, c and a are the major semi-axis and minor semi-axis of the surface crack, respectively, in mm, and the specific details are shown in Figure 4. is the crack included angle. Mc is the elastic correction coefficient, which can be calculated using Equation (7).
where, w is the width of the plate with a crack, in mm.
In accordance with GB/T 41510-2020 ‘Safety Assessment Specification for Lifting Appliances General Requirements’ [29] and GB/T 25196-2018 ‘Monitoring of Crane Design Engineering Cycle’ [30], uncertainties in the recording and estimation of crane working loads should be considered when evaluating the fatigue life of the bridge structure. Meanwhile, it can be known from GB/T 20863.1-2021 ‘Cranes Classification Part 1: General Principles’ [3] that the degree of heavy loading during the operation of the equipment should also be taken into account in the fatigue life assessment process. Therefore, an amplification factor and a stress spectrum coefficient are introduced into Equation (8) to correct the damage degree during crack propagation, and the modified formula is as follows:
where, represents the corrected number of stress cycles at the measuring point of the bridge structure when a crack propagates from a0 to al under the action of the equivalent stress range . fQ is the amplification factor, which is used to account for the uncertainty in working stress records. The value of this factor is related to the recording method of operation data: if it is based on an automatic recording system or a counter, fQ = 1. If it is based on specialized recorded process data, fQ = 1.1. ks is the stress spectrum coefficient, which can be calculated using Equation (9).
where, is the stress amplitude at the i-th level, in MPa. is the maximum value in the stress amplitude spectrum, in MPa.
4.2. Fatigue Life Prediction Based on the BO-CNN Model
To achieve accurate and rapid prediction of the fatigue life of bridge cranes, a Convolutional Neural Network (CNN) model [31], which features high computational efficiency, good scalability, and flexibility, is introduced to train and test the crane fatigue life sample dataset. In combination with the Bayesian Optimization (BO) algorithm [32], the key hyperparameters of the CNN model are solved. The construction process of the prediction model is as follows:
Step 1: Dataset Partitioning. The fatigue life sample dataset is divided into training and testing subsets using a 7:3 ratio.
Step 2: CNN Architecture Construction. The CNN network includes an input layer, a convolutional layer, a pooling layer, a fully connected layer, and an output layer. The input layer serves as a base layer for receiving raw data and delivering it to the hidden layer after preliminary preprocessing. The convolution operations are the core of the convolutional layer and can be performed on the data and the filter matrix (convolution kernel or filter). The pooling layer can further filter the features of the convolutional layer, thus extracting more representative feature information.
The maximum pooling method is used to select the maximum value in the local region as the output value, which can retain the most significant features. The fully connected layer comes after the convolutional and pooling layers, and the extracted features are weighted and summed by the set weights and biases, then added to the bias term. The optimizer SGDM (namely Stochastic Gradient Descent with Momentum [33]) is applied to perform exponential weighted averaging on the existing gradients. The output layer is responsible for receiving the feature vector from the fully connected layer and delivering it to the activation function (ReLU [34]). Ultimately, the fatigue life prediction is generated. The specific models of each layer are shown in Table A1 of Appendix A.
Step 3: Hyperparameter Optimization. The Bayesian Optimization (BO) algorithm is employed to optimize and solve key hyperparameters such as the regularization coefficient, number of hidden nodes, and initial learning rate during the training of the CNN model. By leveraging probabilistic models and acquisition functions, it can iteratively learn the relationship between parameters and performance with limited resources, quickly find the optimal values, and efficiently optimize the model performance.
Step 4: BO-CNN Model Performance Evaluation. The determination coefficient R2 and the mean absolute percentage error MAPE are chosen as indicators for model evaluation. R2 is used to react to the degree of fit between the model-predicted value and the real value of the sample, usually taken as 0 to 1. The value being closer to 1 indicates that the fitting performance of the model is better. MAPE is utilized to measure the degree of difference between the predicted values of the model and the true values of the sample. The average percentage of absolute error is taken, and the closer it is to 0, the higher the prediction accuracy of the model. The specific expressions for the above indexes are:
where, is the true value of sample data. is the predicted value of the regression model. is the average of true values of sample data. n is the number of samples.
4.3. Building a Load-Adaptive Matching Optimization Model
The load adaptive matching problem of cranes is essentially a constrained dynamic combinatorial optimization problem, with its focus on the construction of the objective function. If the difference between the design life and the sum of the already served life and the remaining life is closer to 0, it indicates a better matching between the actual service life of the crane and its design life. Therefore, the design variable is set as follows: when the crack propagates from the initial crack length a0 to the current crack length at, determine the lifting weight mQ(t) that should be matched in subsequent operations. The objective function is set to minimize the difference between the design life and the sum of the already used life and the service life achievable after load matching, which can be expressed as Equation (11).
where, mQ(t) is the lifting capacity, i.e., the design variable, in kg. is the minimum difference in life. T0 is the design life of the crane bridge structure. Ty(t) refers to the service life that the bridge structure has already consumed by the judgment time t when the crack propagates from the initial crack length a0 to the equivalent crack length at which can be obtained using the fatigue life prediction model (see Section 4.2). Tf(mQ(t)) denotes the fatigue life that the bridge structure can still sustain after calculating with the newly matched load when the crack propagates from at to the critical crack ac at the judgment time t, and it can be specifically calculated according to Equation (12).
where, and respectively represent the fatigue lives obtained using the fatigue life prediction model (see Section 4.2) when the crack propagates from the initial crack length a0 to the critical crack length ac and to the equivalent crack length at.
The constraint conditions refer to the limitations on lifting capacity, lifting position, and carrying capacity, which can be expressed as Equation (13).
where, is the measuring point stress of the bridge structure under the lifting capacity , in MPa. is the ultimate stress of the structure, in MPa. is the deformation of the bridge structure under , in mm. is the ultimate deformation of the bridge structure, in mm. is the rated lifting capacity, in kg. is the lifting position of the trolley when the lifting capacity is . and are the left limit position and right limit position of the trolley’s lifting position, respectively.
For the above optimization model, the sparrow search algorithm (SSA) [35] is employed to make an iterative optimization search for it, and finally the best configured load is found within the load range of the rated lifting load.
5. Method for Developing a Digital Twin System with Load Adaptive Matching
5.1. Virtual and Real Space Construction
(1) Physical space
The physical space is a crucial aspect of the digital twin system, supplying the fundamental data and physical laws required for the virtual space. As shown in Figure 5, the lifting and handling system (i.e., the physical space) comprises the lifted cargo, the bracket, and the bridge cranes (i.e., the physical entities). The specific functional relationships are illustrated in Figure 6. The physical entities encompass components such as an extracting device, lifting mechanism, trolley running mechanism, trolley frame, crane running mechanism, bridge structure, sensory system, communication system, electrical control system, and safety device. These constituent elements (i.e., nodal elements) are interconnected through both direct and indirect relationships. These varied connections result in mutual dependence, interaction, and constraint among the components. To clarify the inherent structure and interrelationships within the physical entities, the Interpretative Structural Modeling (ISM) approach [36] is introduced. This method employs directed graphs to disclose the underlying structure and relationships, with detailed information presented in Figure A1 and Table A1 of Appendix A.
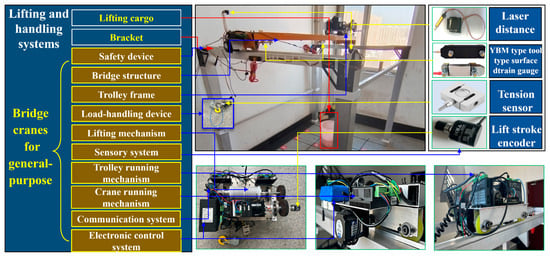
Figure 5.
Components and functional relationship of lifting.
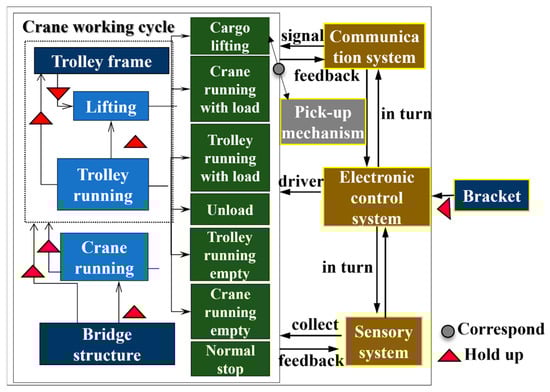
Figure 6.
Components and functional relationship of handling system.
As displayed in Figure 6, the electronic control system is used for the independent drive of the stepper motors, which enable the lifting mechanism, crane running mechanism, and trolley running mechanism to achieve the cargo lifting and lowering as well as the horizontal and vertical translation of the crane and trolley. The trolley frame, bridge structure, and bracket play the role of load-carrying and transferring. The sensor system consists of a tension sensor, a tool-type surface strain gauge, a laser distance sensor, and a photoelectric rotary incremental encoder, which are applied to collect information such as the weight of cargo (lifting capacity), strain at the measuring points of the bridge structure, displacement of the crane and trolley, deformation of the bridge structure, and lifting height. The communication system takes care of signal generation, reception, and processing. The safety device is employed to ensure that the crane and trolley run to the safety limitation of the limit position.
(2) Virtual space
For the virtual entities in the Virtual Space (VS), geometric models, physical models, behavioral models, and rule models are established corresponding to the internal structure, relevant relationships, behaviors, and functions of the physical entities. These models interact and integrate through data and information transmission. The specific construction scheme is shown in Figure 7.
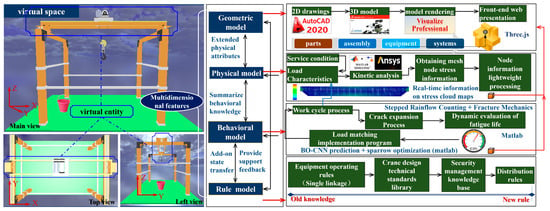
Figure 7.
Virtual space construction plan.
In terms of geometric model construction, bridge cranes are a highly complex type of special crane. The virtual entity and its service scenarios need to be built according to the operation type in different service environments and the directed graphs (see Figure A1 in Appendix A) representing the relationships among the constituent elements of the physical entity. The specific programs are as follows: ① Based on CAD drawings, the SolidWorks software is used to build and assemble the parts or components of the bridge crane through 2D to 3D operations. The Visualize Professional plug-in is employed to render the assembled model in color and material and save it as an OBJ file. ② The service scenario for the crane is built in the Three.js environment. The WebGL renderer is created to render the 3D content of the lifting and handling system to a web page. The DOM elements of the renderer (i.e., the WebGL canvas) are embedded into the page, and anti-aliasing is enabled to improve rendering clarity. ③ The track controller of the camera is set to provide user interaction. Then the loader is instantiated, and the mtlLoader is utilized to import the obj file. The parent-child relationships among parts/components are collated to ensure their true trajectory. ④ Parallel and environmental lighting are added to make the overall scene more natural and realistic. The above steps ensure that the geometric model of the virtual entity is structurally and visually consistent with the physical entity.
In terms of physical model construction, the physical model has high-fidelity simulation and analysis capabilities and can reflect the physical properties of the bridge crane, such as its shape characteristics, running characteristics, and carrying capacity, etc. The construction process is: ① According to the service condition of cranes, the work cycle process, and load characteristics (see Figure A2 in Appendix A), the Simulink module of MATLAB is applied to simulate the motion process to obtain the dynamic load effect factor during the crane’s normal operation (see Table A3 in Appendix A). ② Based on the load combination tables specified in ISO 8686-5-2017, ‘Cranes—Design principles for loads and load combinations—Part 5: Overhead travelling and portal bridge cranes’ [37,38], and in conjunction with the operational rules of bridge cranes, the loads borne by the crane are combined using the dynamic load effect coefficients φ throughout the working cycle. ③ The Ansys simulation software is utilized to simulate the dynamic stress change process of the bridge structure to obtain the dynamic stress information of the mesh nodes of the bridge structure. After lightweight processing of the node information, the real-time information of the stress cloud map of the bridge structure can be obtained. Specific methods can be found in Ref. [4].
In terms of behavioral model construction, by adding descriptions of the state transition behaviors of physical entities under external environments, operational effects, and internal factors, and combining them with the crane load adaptive matching method (see Section 4), the dynamic evaluation of fatigue life under crack propagation and the load matching implementation plan during the working cycle of physical entities are determined.
In terms of rule model construction, it relies on crane operating rules (i.e., only one of the lifting mechanism, trolley running mechanism, or crane running mechanism is activated, while the others are prohibited from operating), crane design technical standards, and safety management knowledge to formulate new load adaptive matching rules by mining existing knowledge.
(3) Virtual and real interaction
For the mapping of real-virtual interactions (PS-VS), the sensor system of the physical entity converts the entity data collected by each sensor into historical data after the server stores them in the twin databases. This data is also transmitted to the virtual space to drive the virtual model, thus realizing ‘real driving virtual’. The canvas component in Three.js is utilized to set up sliders and buttons that control the crane, the trolley, and the lifting mechanism. The slider is used to control the forward and backward movement of the crane, the forward and backward movement of the trolley, and the raising or lowering of the lifting mechanism. Buttons are used to control the physical-to-virtual control, virtual-to-physical control, transmission information activation, running information observation, carrying capacity mapping, fatigue life monitoring, adaptive load matching, information data management, and system exit. On this basis, the results from the virtual space are fed back to the physical space using a logic control script written in Python to realize ‘adjusting the real with the virtual’.
5.2. IoT Connectivity
(1) Hardware Connection
The IoT connection scheme in the digital twin system for load-adaptive matching of bridge cranes is shown in Figure 8. It includes four parts: a crane operation data collection module, a remote wireless communication transmission module, a cloud server storage module, and an information data application module.
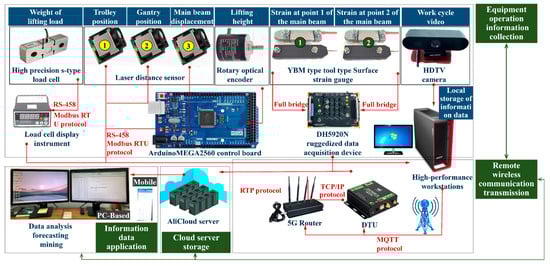
Figure 8.
IoT Connection Scheme for Bridge Cranes.
The main function of the crane operation data collection module is to collect the operation information and the strain and displacement information of the bridge structure generated by the crane during normal operation. The hardware components include lifting weight sensors and display instruments used to collect the lifting load. Rotary optical encoders are applied to collect lifting heights. Laser distance sensors 1 and 2 are utilized to collect the running positions of the trolley and crane, respectively. YBM-type tool-type surface strain gauges and laser distance sensor 3 are used to collect the strains and displacements of the bridge structure, and an HD camera is employed to record the work cycle process of the crane. The DH5920N rugged data acquisition device converts analog signals collected by YBM-type tool-type surface strain gauges into digital signals through full-bridge connection and stores them in the local workstation. The ArduinoMEGA2560 control board converts the electrical signals of the rotary optical encoder into data that are then stored on a local workstation. The Modbus RTU protocol is used for data transmission via the RS-485 physical interface.
For the remote wireless communication transmission and cloud server storage module, the main functions are to upload the collected crane operation information, structural strain and displacement information, and video information of the crane working cycle to the storage space of the Ali Cloud server. During the transmission process from the local end to the cloud, the DTU module receives the local data information and then converts it via the TCP/IP protocol, and the converted data is finally uploaded to the cloud server via the 5G router. The cloud server is mainly responsible for storing, processing, and transmitting information and videos of crane operation. Users (e.g., staff) can utilize it for data analysis, prediction, and mining.
Problems such as missing, abnormal, or duplicate collected information and data caused by measurement errors or signal drift of IoT hardware during actual operation can be resolved through data preprocessing techniques, with specific descriptions provided in Section 4.1.
(2) Data transfer and interaction
In terms of data transfer and interaction, the essence of the IoT connectivity module is to utilize the IoT communication capabilities to establish the necessary links between the modules, which can realize the interaction and integration of all elements, processes, and services related to the adaptive matching process of crane loads. To achieve fast, convenient, and efficient storage and querying of data, the MySQL database is chosen as the storage tool to establish the physical entity database PED, the virtual entity database VED, and the fusion-derived database FDD. Based on this, the parent-child hierarchical structure is applied to establish data tables within the database. Details are provided in Table 1.
In terms of data interaction, when the sensor system senses changes in the running state of the crane, it uploads the sensor information to the server through Ethernet communication. Using the Socket communication method over the TCP/IP protocol, the currently collected data of the physical entity will be transferred to the twin databases and stored as historical data. This data is used to drive the virtual space for simulation, prediction, and evaluation, while presenting the data in a visual way on the visualization interface of the digital twin system platform (see Section 5.4). The virtual space communicates with the server via Socket communication. The server stores the simulation, prediction, and evaluation results into the twin databases using Socket communication. The results are presented in the visualization interface of the digital twin while being called back into the physical space. The load-adaptive matching digital twin system stores fused derived data in the database at the server, which is then called and fed back to the physical space. Details are shown in Figure 9.
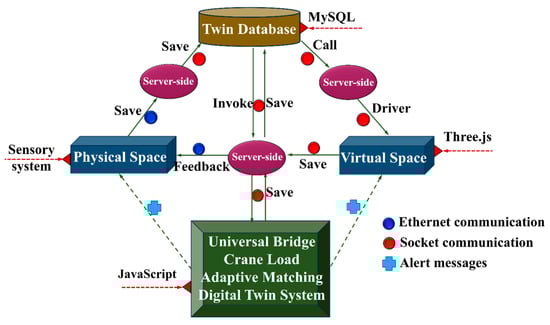
Figure 9.
Ways of data interaction.
5.3. Load Adaptive Matching Service
The load adaptive matching service is grounded in the phenomenon of crane load-bearing capacity degradation and is theoretically supported by the load adaptive matching method (see Section 4). Through joint simulations using various software and leveraging the connectivity of the Internet of Things, a digital twin system for load adaptive matching of cranes is constructed to visualize and display various models, data, and results generated during the virtual-real mapping process, as well as to implement load matching schemes. It includes two categories: functional service and business service.
The functional service is the basic support for the realization and operation of business services. It includes: ① model management processes provided by the virtual entity, such as virtual scene building, 3D modeling and rendering, and presentation of mapping results. ② data management and processing provided by twin data. ③ pushing relevant predictions and matching results to operators and technicians to ensure safety during equipment operation. The business service refers to scenario monitoring services for operators and technicians and visual mapping of results related to load matching, such as the presentation of running data, crack extension dimensions, fatigue remaining life, strength margins, stiffness margins, and load adaptive matching schemes, among other data.
5.4. Digital Twin System Platform Development
Based on the framework of the digital twin system for crane load adaptive matching and taking the load adaptive matching method as the theoretical foundation, a digital twin system platform is developed through virtual and real space construction, IoT connection, and load adaptive matching services. Combined with the functional module design and in accordance with the system development process, this platform provides a digital twin system interface for macroscopic visualization.
In terms of functional module design, the digital twin system platform for bridge crane load adaptive matching includes the following modules: ① Service Process Monitoring Module: This module monitors the operation status of the crane and the virtual-physical interaction in real-time through a virtual-real synchronization approach. Meanwhile, it leverages the 3D scene roaming capabilities of three.js to enable panning, zooming, and rotation of the scene perspective. ② Monitoring Information Visualization Module: By continuously monitoring the operational state characteristics of the crane during its service life, this module promptly evaluates the fatigue life of the crane and determines the appropriate load size to match. Subsequently, it presents the quantitative results of relevant information (as shown in Table 2). ③ Load Adaptive Matching Module: This module fully utilizes physical entity data, virtual entity data, and fused derivative data from the twin database. Combined with the load adaptive matching method for cranes (see Section 3), it obtains adaptive load matching results for the crane during its service life from the perspective of load-bearing capacity degradation and pushes these results to the visualization interface. ④ Information and Data Management Module: Firstly, it parses and processes the data collected by the sensing system, feeds the processed data back to the logical scripts in response to these requests, and stores this data in the twin database. Secondly, it is responsible for the classification and management of physical entity data, virtual entity data, and derivative data. Thirdly, it supports querying, adding, modifying, and deleting information within the database.
Table 2.
Crane monitoring-related information.
In terms of the development process, the digital twin system for crane load adaptive matching needs to integrate multiple functions such as service process monitoring, carrying capacity information acquisition, fatigue life prediction, and load adaptive matching. It involves the joint development and invocation of multiple software systems and platforms. The specific development process is shown in Figure 10, and the relevant application software programs and their versions are detailed in Table A4 of Appendix A.
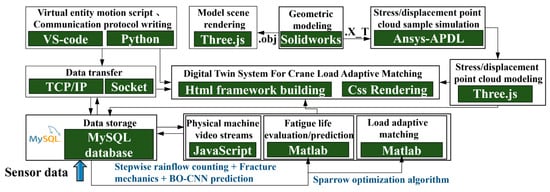
Figure 10.
Development process of load-adaptive matching digital twin system.
As described in Figure 10, SolidWorks is used to construct 3D models of virtual entities and scenes. These models are then combined with Three.js for rendering. The rendered models are loaded into the twin system interface to form a visualized virtual space. The virtual entity movement script is written using VS code, and the Python language is used in conjunction with other tools to write the communication protocol. Virtual reality linkage and other operations are implemented in the main interface of the system. The constructed 3D model is imported into Ansys-APDL for simulation and analysis of crane structural mechanics, extracting sample data of the stress/displacement point cloud. This sample data is then imported into Three.js to generate a point cloud map, which is displayed in the system interface. By combining the TCP/IP protocol and Socket communication, the information data stored in the twin databases is pushed to the system interface for real-time display. Additionally, the data is loaded into Matlab software for fatigue life assessment/prediction, load adaptive matching optimization, etc. The resultant data obtained is then transferred back to the databases for storage. Furthermore, the video screen information flow is connected to the system interface via serial communication through JavaScript scripts, enabling users to monitor the physical machine in real time.
In terms of the system platform, a system platform was established by integrating the functional module design and following the system development process. The corresponding system interface is shown in Figure 11. This interface is structured around four major modules, featuring a functional button area and a visualization chart area. The former includes nine buttons: physical-to-virtual control (A1), virtual-to-physical control (A2), transmission communication activation (B), running data observation (C), carrying capacity mapping (D), fatigue life monitoring (E), adaptive load matching (F), information data management (G), and system exit (H). The latter includes the overall performance parameter table, cyber-physical interaction display, overall operation information table/data stream, stress/displacement mapping contour diagram, and load adaptive matching information table. Regarding the functional buttons, A is for controlling physical entities, B is for transmission communication between the virtual model and physical entities, G is for managing information data related to virtual models and physical entities, and the rest are for controlling the virtual model.
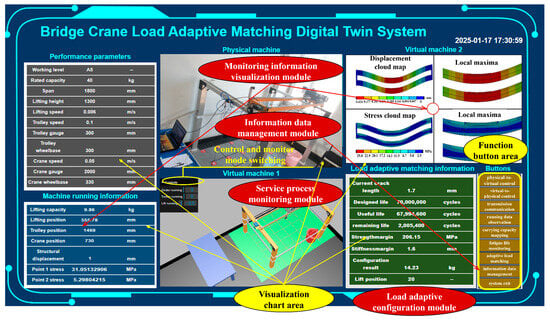
Figure 11.
Digital twin system interface.
6. Experimental Case
The DQ40 kg-1.8 m-1.3 m small bridge crane is selected as the research object. It has a rated lifting capacity of 40 kg, an overall operational classification of A5, a span of 2 m, and a maximum lifting height of 1.3 m. The hardware composition of the crane is detailed in Table A2 of Appendix A. During its service, the picking areas are distributed from Q2 to Q20, while the storage area is located at Q1 (see Figure 12A). By utilizing the digital twin system platform for crane load adaptive matching (see Section 5.4), functions such as service process monitoring of the crane, visualization of monitoring information, load adaptive matching, and information data management are realized. This serves to verify the feasibility and applicability of the crane load adaptive matching method and the construction method of the digital twin system, as well as the effectiveness and correctness of the system platform and its development process.
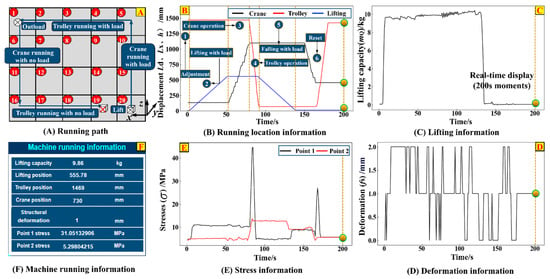
Figure 12.
Monitoring information.
The specific verification process starts with the specific linkage process of each module as follows: ① Turn on the buttons in the sequence ‘A1 → A2 → B → G → C → D’ to enter the service process monitoring module, the information data management module, and the monitoring information visualization module. The virtual and real synchronization presentation is realized, and the operational information and cloud map information of carrying capacity are displayed in the visualization chart area. ② Turn on the buttons in the sequential order ‘E→F’ to enter the monitoring information visualization module and the load adaptive matching module. Characteristic life (design life, useful life, and remaining fatigue life), strength margins, stiffness margins, and results of load matching are given in the visualization chart area. Then, return to step ① to display the running information, stress mapping information, and displacement mapping information after load-matching.
(1) Service process monitoring
After the crane is started, when button A1 is pressed, the twin system first switches to monitoring mode. It displays the operation screen of the physical entity in real-time and uses the sensing system to acquire operation information to drive the synchronous operation of the virtual entity. When button A2 is pressed, the twin system switches to control mode. It controls the real-time operation of the virtual entity through the interface slider and drives the physical entity to maintain synchronization with the virtual entity by means of a Python logic control script. The virtual-real linkage monitoring screen is shown in Figure 11.
(2) Monitoring information visualization
Taking the handling path Q20~Q1~Q15 (see Figure 12A) as an example, the monitoring information during its handling process is presented in Figure 12B–F. Figure 12B,C show the work cycle process: ① Adjust the lifting operation in the picking area (including loosening the wire rope to hang the load and resetting the perception system for balance). ② The lifting mechanism ascends 557 mm along the z-axis with the load and then stops. ③ The crane travels 970 mm along the y-axis. ④ The trolley travels 1400 mm along the x-axis to reach the storage area Q1. ⑤ The lifting mechanism descends 557 mm along the z-axis with the load to unload it. ⑥ The crane and trolley reverse their travel directions to return to Q15, completing one working cycle. Figure 12D,E, respectively show the changes in deformation of the crane bridge structure and stress at measuring points during the above-mentioned working cycle. Figure 12F describes the characteristics of the running information at the moment t = 200 s.
In addition, for the above-mentioned working cycle process, the carrying capacity mapping was completed through finite element simulation (with Q235 steel as the material and a mesh element size of 4 mm), and the overall structural stress cloud diagram (Figure 13A) and deformation cloud diagram (Figure 13B) were obtained. As can be seen from the cloud diagram information, both the maximum stress and maximum deformation are less than the ultimate stress of 213.63 MPa and the ultimate deformation of 1.5 mm. This cloud diagram information intuitively reflects the carrying characteristics of the bridge structure.
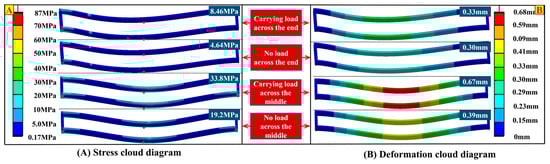
Figure 13.
Stress cloud diagram and deformation cloud diagram of bridge structure.
(3) Load adaptive matching
Taking the handling path Q20~Q1~Q15 as an example, the ‘E → F’ buttons are clicked in sequence via the twin system to perform adaptive matching of the lifting load during the crane’s service. The relevant results are shown in Figure 14.
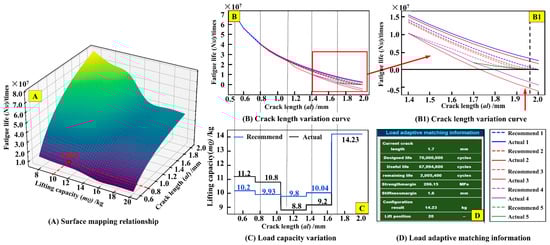
Figure 14.
Load adaptive matching results.
The surface mapping relationship among the lifted load, crack length, and the number of fatigue life cycles can be observed from the fatigue sample data, as illustrated in Figure 14A. Upon clicking the ‘E’ button, the system automatically predicts the consumed service life under the handling path from Q20~Q1~Q15. As shown in Figure 14B,C, when the lifted load is 10 kg and the crack propagates from 0.5 mm to 0.8 mm, the predicted consumed service life is 2.002 × 10⁷ cycles, and then the remaining fatigue life (4.998 × 10⁷ cycles) is equal to the difference of design life (7 × 10⁷ cycles) and useful life (2.002 × 10⁷ cycles). Based on the calculated remaining fatigue life of 4.998 × 10⁷ cycles, the initial recommended load is determined as P1 = 10.2 kg, However, the user’s actual applied load P1* = 11.2 kg exceeds P1. Under P1*, the fatigue crack propagates to a length of 0.8 mm, at which point the updated remaining fatigue life is recalculated as 4.075 × 10⁷ cycles. A second load recommendation, P2 = 9.93 kg, is generated based on this revised lifespan. The user applies P2* = 10.8 kg, again exceeding P2. Continued loading under P2* until the crack extends to 1.1 mm results in a further reduced remaining fatigue life of 2.508 × 10⁷ cycles. For the third iteration, the recommended load is adjusted to P3 = 9.8 kg. In this case, the user’s applied load P3 = 9.8 kg falls below P3. Subsequent crack propagation analysis under P3* is performed iteratively. When the crack length reaches 1.7 mm, the cumulative service life reaches 6.799 × 10⁷ cycles, with a remaining fatigue life of 2.005 × 10⁶ cycles. At this stage, the fourth load recommendation, P4 = 14.23 kg, is derived and transmitted to the system interface (Figure 14D) for operational guidance.
(4) Information data management
During crane operation, sensor data from the physical environment is transmitted via serial port communication to a local server and subsequently uploaded to the database. Taking the material handling path Q20~Q1~Q15 as an example, clicking the ‘Information Data Management’ button initiates a connection between the system platform and the database. Upon successful authentication, sensor data is retrieved and displayed in real time (Figure 12F). Furthermore, the sensor data is fed into logic scripts to drive the motion of the virtual entity within the digital twin framework. Both the virtual entity’s operational data and derived data are pushed to the system platform for visualization (Figure 14D). Concurrently, these two categories of data are transmitted back to the database for categorized storage and management. This enables comprehensive data operations, including creation, deletion, modification, and querying (Figure 15).
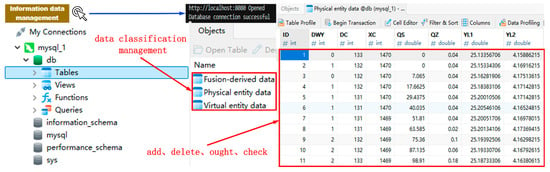
Figure 15.
Information data management.
After the step-by-step verification throughout the above four modules, the results show that: the crane load adaptive matching method and the digital twin system development method are feasible and applicable, and the effectiveness and correctness of the system platform as well as the development process have also been effectively verified.
7. Analysis and Discussion of Results
To further verify the scientificity and feasibility of the digital twin system development method for load adaptive matching under the condition of crane load-carrying capacity degradation, further result analysis and discussion are conducted, focusing on three aspects: sample data construction, fatigue life prediction, and load matching scheme.
7.1. Sample Data Construction
Taking one work cycle data collected under the handling path Q20~Q1~Q15 as an example, the raw and processed data are given as displayed in Figure 16, and the rest are similar.
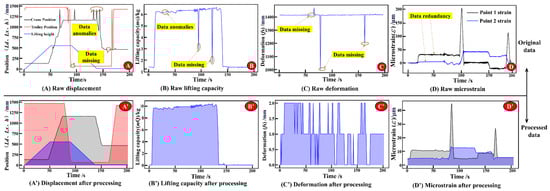
Figure 16.
Raw data and data preprocessing results.
Illustrated in Figure 16A–C, for the raw data, the sampling frequency of the crane position, trolley position, lifting height, mass of lifting load, and structural dynamic displacement are all 10 Hz. At different moments, because of data anomalies, missing data, and other phenomena, the raw data needs to be corrected and filled by using the interpolation method. And the results are presented in Figure 16A’–C’. The main girder of the crane’s bridge structure, designed as a simply supported welded beam, is prone to fatigue fractures and plastic deformation at the mid-span, while the support regions endure maximum shear stresses. Consequently, stress monitoring is prioritized at critical cross-sections of the mid-span and support areas, as depicted in Figure 16D. The raw strain data with the sampling frequency of 100 Hz is processed by data compression, and Figure 16D’ displays the outcome. This ensures the matching of data from multiple sources and the consistency of data volumes. From the strain history data (Figure 16D’), it can be seen that the strain data of point 1 is larger and more fluctuating than that of point 2. Therefore, point 1 plays a decisive role in determining the fatigue life of the structure.
On this basis, a fatigue life sample dataset for measuring point 1 was constructed in accordance with the ‘(1) Fatigue Life Sample Data Construction Method’ in Section 4.1, and the results are shown in Figure 17.
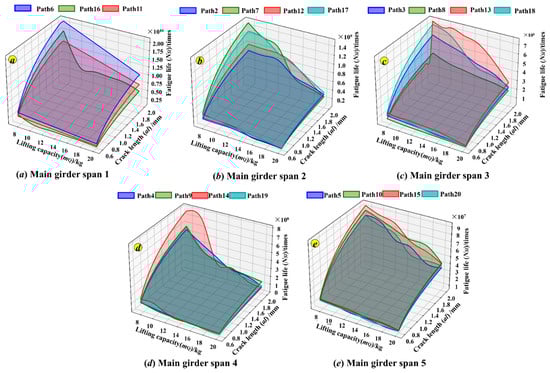
Figure 17.
Sample dataset of fatigue life under different paths.
As given in Figure 17a–e, according to the span direction of the main girder of the crane, the different handling paths under the same lifting position are classified as the same group. The lifting positions of the trolleys under each path in Figure 17a are in the areas Q6, Q11, and Q16 on the left side of the main beam, and the crane only needs to be moved to complete the handling of the cargos. Compared to the other paths in Figure 17b–e, path 6 (Q6~Q1~Q20), path 11 (Q11~Q1~Q6), and path 16 (Q16~Q1~Q11) experience the higher fatigue life cycles at the same load under the same initiation crack length extended to the critical crack. Further, in Figure 17a, compared to paths 11 and 16, the cargo lifting position of path 6 is closest to the stacking area, and the distance moved by the crane is shorter. Therefore, the fatigue life surface values of path 6 are higher than those of path 11 and path 16 under the same lifting weight and crack length.
Taking path 6 in Figure 17 as an example, when the load is 20 kg, the relationship between the fatigue life cycles and crack length is presented in Figure 18A. As the crack length propagates, the fatigue life gradually increases. With the critical crack length being 2 mm, the fatigue life cycles are 1.07 × 10¹⁰. The relationship between the fatigue life cycles and the mass of lifting load under the crack length being 2 mm is given in Figure 18B. The maximum fatigue life cycles are 2.13 × 10¹⁰ cycles under the mass of lifting load of 8 kg, and the fatigue life cycles decrease with increasing the mass of lifting load.
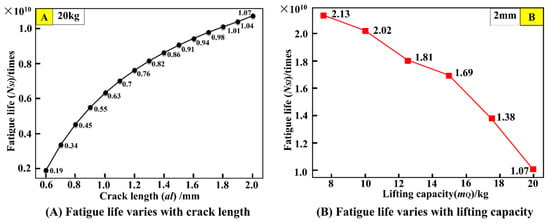
Figure 18.
Crane fatigue life curve under path 6.
7.2. Fatigue Life Prediction
Taking the fatigue life prediction method in Section 4.2 as a theoretical support and the handling path Q20~Q1~Q15 as an example, the 90 groups of fatigue life sample datasets of point 1 are randomly divided into training and testing sets in the ratio of 7:3 to train and test the BO-CNN model. The results are illustrated in Figure 19 and Table 3. The fatigue life prediction results under the remaining paths are similar.
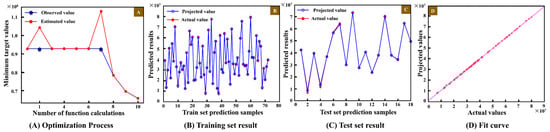
Figure 19.
Training and test results of BO-CNN model.
Table 3.
Evaluation results of BO-CNN model.
As shown in Figure 19, the BO algorithm is used to optimize the hyperparameters of the CNN model, yielding a set of optimal hyperparameters: the number of hidden nodes is 16, the initial learning rate is 0.0429, and the regularization coefficient is 4.996 × 10⁻⁶. The optimization process is shown in Figure 19A. On this basis, the constructed BO-CNN model is used for training and testing. Combined with the model evaluation index calculation Formula (10), the relevant sample comparison results are presented in Figure 19B,C and Table 3. Among them, the coefficient of determination () of the training set is 0.9938, and the MAPE 1 is 0.0413. The coefficient of determination () of the test set is 0.9916, and the MAPE 2 is 0.0591, both of which meet the accuracy requirements. Moreover, in the data linear prediction fitting graph (Figure 19D), both the true values and predicted values of the prediction model are close to the optimal linear fitting line. It is therefore judged that the BO-CNN model has a good fitting degree and high prediction accuracy.
7.3. Load Matching Scheme
According to the method for establishing the load adaptive matching optimization model in Section 4.3, the load matching optimization model is constructed using the objective function (Equation (11)) and constraints (Equation (13)). The SSA algorithm (with the population size of 30 and maximum iterations of 20) is applied to solve the optimization model. The BO-CNN model is used to predictively search the fatigue life Tf of the crane when the crack extends from any size al to the critical crack ac in the mass range of rated lifting load me = 40 kg. The configured mass of lifting load corresponding to Tf is obtained when the objective function minΔT is closest to 0, thus ensuring that the fatigue life of the crane is as close as possible to the given design life.
As observed in the fatigue life sample data in Figure 17, the fatigue life of the crane varies in different paths and loads. Therefore, the different design life needs to be set for the different paths, and load-adaptive matching needs to be performed independently for each path setting. The results of load adaptive matching are presented in Figure 20.
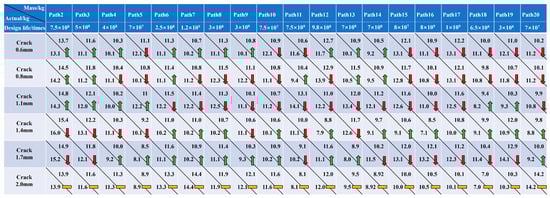
Figure 20.
Results of load adaptive matching for different paths.
In Figure 20, during the process of load adaptive matching, if the actual mass of the lifting load used is less than the recommended mass, it indicates the safe use of the crane (indicated by the green upward arrow), and the next loading result will be greater than the previous loading result. If the actual mass of the lifting load used is greater than the recommended load, it reveals the overloaded use of cranes (indicated by the red downward arrow). The next loading result will be less than the previous loading result. The last loading result is the same as the actual mass of the lifting load (indicated by the yellow horizontal line) to ensure that the fatigue life of the crane can reach the design life.
As demonstrated in Figure 21, the load adaptive matching results derived from Figure 20 are illustrated with Path 2 (Q2~Q1~Q16). For a design lifespan of 7.5 × 10⁸ cycles, the initial recommended load is P1 = 13.7 kg, while the user’s actual load P1* = 13.1 kg falls below P1. Under P1*, the crack propagates to 0.6 mm, prompting a second load recommendation, P2 = 14.5 kg, based on the updated remaining life of 6.1 × 10⁸ cycles. The user’s applied load P2* = 14.2 kg again remains below P2. Continued loading with P2* until the crack reaches 0.8 mm leads to a third load adjustment to P3 = 14.8 kg, calculated from the remaining lifespan of 4.6 × 10⁸ cycles. The user’s load P3* = 14.3 kg still undershoots P3. This iterative process continues until the crack attains 2.0 mm, at which point the remaining lifespan is reduced to 3467 cycles (accounting for 0.000462% of the design life), and the cumulative service life reaches 7.50 × 10⁸ cycles (accounting for 0.999538% of the design life), closely approaching the design lifespan threshold.
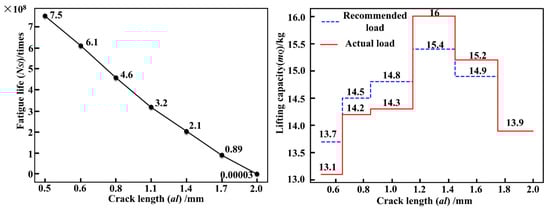
Figure 21.
Load adaptive matching curves under path 2.
8. Conclusions
(1) A method for constructing a digital twin system oriented toward load-adaptive matching of bridge cranes is proposed, which can dynamically and adaptively adjust the mass of the lifting load while monitoring the service state of the cranes. The gap between the fatigue life and the design life of the crane is eliminated or minimized to avoid the phenomenon of ‘early retirement’ or ‘over-service’. Compared with the load reduction program of cranes under the traditional fixed-inspection mode, the method clearly gives the recommended mass of lifting load, which provides users with a more accurate load matching. This also provides a new method and strategy for the continued use of damaged cranes in terms of load reduction.
(2) A load adaptive matching optimization model is constructed, and a corresponding digital twin system is built simultaneously. Taking the DQ40 kg-1.8 m-1.3 m bridge crane as the experimental object, based on the path independence principle, the design life parameters corresponding to different paths are set. With the help of the proposed digital twin system, the experimental process verification of load adaptive matching is realized.
This method has achieved significant results in addressing cranes’ ‘early retirement’ or ‘over-service’ issues. It also shows broad prospects in fields like safety management and resource utilization improvement, with substantial theoretical significance and practical value for inspection and monitoring institutions as well as users. Its core lies in digital technology, which enables dynamic matching between actual service life and design life throughout the full life cycle. However, there is still room for further improvement and upgrading in terms of technical precision, targeting, quantitative basis, and applicability of this method. Future efforts can focus on three aspects: First, relying on multi-physics field theoretical modeling and high-precision mechanical property analysis, key components and core structural parts are accurately identified. Data mining algorithms are used to extract features from full-life-cycle operation data, and combined with deep learning, a dynamically updated life prediction model is built to precisely locate critical components requiring focused attention. Second, by deepening the integration of prediction technologies, in-depth integration of multi-scale prediction technologies is realized in the digital twin system. The simulation accuracy and response timeliness of the digital twin environment are continuously iterated and upgraded, thereby achieving refined upgrading of the system. Third, reliability assessment methods serve as the quantitative basis for narrowing the gap between design life and actual service life. Through multi-field expansion, multi-factor coupling, long-term monitoring, and big data analysis, broader propositions regarding eliminating fatigue and the gap between designed and actual life are further explored and verified.
The core achievement of this study is the realization of real-time monitoring of service status and dynamic adaptive adjustment of loads, providing a digital solution to eliminate the gap between cranes’ actual service life and design life. Since monitoring changes in crane crack length is a lengthy process, this paper uses the DQ40 kg-1.8 m-1.3 m overhead crane to verify the method’s feasibility. However, the method’s architecture (digital twin system and load adaptive matching method) has the potential to be migrated to industrial-grade bridge cranes (e.g., large-tonnage bridge cranes commonly used in ports and factories). Currently, we plan to collaborate with industrial enterprises and port terminals to conduct engineering verification in actual scenarios such as 100-ton industrial bridge cranes. The focus will be on evaluating its effect on extending crane life (compared with traditional fixed load schemes) and economic benefits, while continuously optimizing the system. The versatility of this technical framework lies in that the digital twin system can adapt to structural models and sensor configurations of different cranes, and the adaptive algorithm can handle various load spectra. Thus, its applicability is not limited to overhead cranes. For mobile cranes, tower cranes, and jib cranes that also face fatigue life management challenges, popularization and application can be achieved simply by adjusting model parameters according to their structural characteristics and working conditions, showing broad prospects.
Author Contributions
J.L.: Data curation, Formal analysis, Software, Methodology, Validation, Writing-original draft. Q.D.: Conceptualization, Investigation, Methodology, Supervision, Writing-original draft. G.X.: Methodology, Supervision. Y.Z.: Data curation, Project administration. L.J.: Data curation, Project administration. All authors have read and agreed to the published version of the manuscript.
Funding
This work is supported by the National Natural Science Foundation of China [grant numbers 52105269]. It is conducted in the Key Laboratory of Lifting Equipment’s Safety Technology, State Administration for Market Regulation [grant numbers 20231204]. We would like to express our sincere gratitude to these two organizations.
Data Availability Statement
The crane service data and core algorithm code used in this study will be provided upon request.
Conflicts of Interest
The authors declare that they have no known competing financial interests or personal relationships that could have appeared to influence the work reported in this paper.
Appendix A
Table A1.
Layer models of the CNN network.
Table A1.
Layer models of the CNN network.
| Details | Expression | Symbolic Meaning |
|---|---|---|
| Convolutional layer | output is the output feature after convolution. input is the input feature. kernel is the convolution kernel size. padding is the number of zero turns. stride is the step length. | |
| Pooling layer | is the input value of neuron in layer k+1. is the value of i-th feature at t-th neuron in k-th layer. | |
| Full connectivity layer | is the output value of the j-th neuron at layer k+1. is the ReLU activation function. is the weight between the t-th neuron in the i-th layer of features and the j-th neuron in the k+1-th layer. is the output value of the t-th neuron in the i-th feature of the previous layer. is the total network bias. | |
| Activation function | is the output value of convolution operation. is the ReLU activation function. is the goal value obtained by activation function. |

Figure A1.
Directed graph of constituent elements of physical entities.
Figure A1.
Directed graph of constituent elements of physical entities.

Table A2.
Constituent elements of physical entity.
Table A2.
Constituent elements of physical entity.
| Serial No. | Units | Model | Quantities | Serial No. | Units | Model | Quantities |
|---|---|---|---|---|---|---|---|
| S1 | Lifting hook | 45 steel | 1 | S26 | Trolley track | Grooved aluminum 2000 × 1 | 2 |
| S2 | Wire rope | 304 stainless steel | 1 | S27 | Main girder | 20 × 30 × 2000 | 2 |
| S3 | Reel | 3d print | 1 | S28 | End girder | 30 × 40 × 270 | 2 |
| S4 | Flange | Sthpr20 | 2 | S29 | Connection plate | Carbon plate | 20 |
| S5 | Flanged shaft | 40 × 20 | 2 | S30 | Angle aluminum | 50 × 20 × 2 | 4 |
| S6 | Vertical diamond seat 1-2 | Kp004 | 2 | S31 | Crane driving wheel | Rubber wheel | 2 |
| S7 | Expansion sleeve | Z21-20 × 38 × 21 | 2 | S32 | Crane follower wheel | Rubber wheel | 6 |
| S8 | Gear | 2 m × 50 z | 2 | S33 | Crane driving wheel axle | 70 × 8 | 2 |
| S9 | Vertical diamond seat 3 | Kp004 | 1 | S34 | Crane follower wheel axle | 70 × 8 | 2 |
| S10 | Gear shaft | 130 × 20 | 1 | S35 | Crane driving wheel diamond seat | Kfl08 | 4 |
| S11 | Lift motor coupling | 40 × 40 × 6-22 | 1 | S36 | Crane follower wheel diamond seat | Kfl08 | 4 |
| S12 | Lifting reducer motor | 86 steps 6n/stage | 1 | S37 | Crane drive motor coupling | 20 × 25 × 3-10 | 2 |
| S13 | Lifting motor frame | 86 stepper bracket l-shaped | 1 | S38 | Crane drive motor | 57 steps of 2.3n | 2 |
| S14 | Lifting motor drive | Ma860 | 1 | S39 | Crane drive motor frame | 57 stepper brackets | 2 |
| S15 | Aluminum plate | 150 × 210 × 2 | 1 | S40 | Crane drive motor driver | Dm542s | 2 |
| S16 | Trolley driving wheel | Rubber wheel | 2 | S41 | Crane runner | Grooved aluminum 1600 × 1 | 2 |
| S17 | Trolley follower wheel | Rubber wheel | 2 | S42 | Bracket | 100 × 100 × 1300 | 4 |
| S18 | Trolley driving wheel axle | 70 × 8 | 2 | S43 | Tension sensor | Jlbs-1; 0–50 kg | 1 |
| S19 | Trolley follower wheel axle | 70 × 8 | 2 | S44 | Laser distance sensor | Gjd-01 | 3 |
| S20 | Trolley driving wheel diamond seat | Kfl08 | 4 | S45 | Tool type surface strain gauge | Ybm-78a | 2 |
| S21 | Trolley follower wheel diamond seat | Kfl08 | 4 | S46 | Photoelectric rotary incremental encoder | E6b2-cwz6c | 1 |
| S22 | Trolley drive motor coupling | 20 × 25 × 3-10 | 2 | S47 | Raspberry pi control board | Raspberrypi-4b | 1 |
| S23 | Trolley drive motor | 57 steps of 2.3n | 2 | S48 | Arduino control board | Arduinomega2560 | 1 |
| S24 | Trolley drive motor frame | 57 stepper bracket | 2 | S49 | Limit stop | 3D print | 8 |
| S25 | Trolley drive motor driver | Dm542s | 2 | S50 | Battery pack | 24v lithium battery | 3 |
| G | Lifting cargo | Random load | 1 | — | — | — | — |

Figure A2.
Load characterization of bridge cranes under service conditions.
Figure A2.
Load characterization of bridge cranes under service conditions.

Table A3.
Load and dynamic load effect coefficients.
Table A3.
Load and dynamic load effect coefficients.
| Dynamic Load Coefficient | Symbol | Instruction |
|---|---|---|
| Lifting impact coefficient | φ1 | The dynamic response of the crane to sudden changes in tension on the steel wire rope when lifting cargo off the ground or when suspending cargo in the air and braking during descent |
| Lifting dynamic load coefficient | φ2 | The inertia force of the cargo during the lifting process will increase the dynamic load and cause the whole structure of crane to vibrate elastically. |
| Abrupt unloading coefficient | φ3 | Cranes need to suddenly remove part of the mass in the air during normal operation, and the structure vibrates due to sudden load reduction. |
| Running impact coefficient | φ4 | Crane with load or no load in the track running, its vertical direction will produce impact power effects. |
| Coefficient of dynamic effect caused by variable speed movements | φ5 | Acceleration and deceleration of the drive mechanism can produce a dynamic effect on the crane. |
Table A4.
Related application software programs and versions.
Table A4.
Related application software programs and versions.
| Software Name | Function | Performance | Critical Match Relationship | Version Used |
|---|---|---|---|---|
| SolidWorks | Build a 3D model of the crane, export it in lightweight obj format, and ensure a balance between model detail and file size. | Supports native export of formats such as obj, model lightweighting and file compatibility, and supports model precision settings. | Compatible with Three.js r130+, SolidWorks 2020+ exported obj files are correctly parsed by OBJLoader in Three.js. | 2022 |
| VS-code | Develop JS motion control scripts, Python communication protocols, and front-end interfaces, supporting serial port communication debugging (video stream integration). | Plugin compatibility (Three.js, Python, JS-related plugins), multi-language development experience, debugging support. | No mandatory version dependencies, supports JS/HTML/Python syntax highlighting and debugging tools. | v1.98 |
| Python | Develop TCP/IP/Socket communication protocols to connect MySQL, Matlab, and front-end system interfaces. | Compatibility with libraries such as PyMySQL and Pyserial, data processing performance matches that of Matlab versions. | MATLAB Engine compatible with Matlab R2022a+, supports MySQL 8.0 encryption methods. | 3.10 |
| Three.js | Load obj model rendering scenes, high-performance rendering stress/displacement point cloud maps, generate virtual-real interactive visualization interface. | Model format (obj) parsing efficiency, large point cloud (tens of thousands of points) rendering performance, and compatibility with JS modular syntax. | Compatible with SolidWorks export formats and point cloud data formats for Python preprocessing. | r155 |
| Ansys-APDL | Perform structural mechanics simulation of the crane and export stress/displacement point cloud data. | CSV point cloud data export format structured, compatibility with SolidWorks models, simulation accuracy algorithm. | The exported point cloud data is preprocessed by Python 3.8+ into a format that can be parsed by Three.js. | 2024 R1 |
| MySQL | Store physical status, simulation results, and evaluation data, and support multi-end data reading and writing. | Encryption method compatibility, data type (floating point, JSON) compatibility. | Accessed by Python, Matlab, and JS scripts (mysql2 library). | 8.0.34 |
| Matlab | Perform Fatigue Life Assessment/Prediction, Load Adaptive Matching, and Send Results Back to Database. | Support for toolboxes such as Fatigue Toolbox and Database Toolbox, interaction with Python/MySQL, computational performance | Compatible with Python 3.8-3.10 through MATLAB Engine, and supports MySQL 8.0 data read/write. | R2022a |
References
- Zhang, Y.; Yang, F.; Yuan, H.; Zhang, S. 3D reconstruction of coal pile based on visual scanning of bridge crane. Measurement 2025, 242, 116146. [Google Scholar] [CrossRef]
- ISO 4301-1:2016; Cranes—Classification—Part 1: General. International Organization for Standardization: Geneva, Switzerland, 2016.
- GB/T 20863.1-2021; Cranes—Classification—Part 1: General. State Administration for Market Regulation: Beijing, China, 2021.
- Dong, Q.; Nan, F.; Xu, G.; Hu, S.; Qi, Q. Closed-loop optimization design method for crane structures based on digital twins. Comput. Integr. Manuf. Syst. 2025, 31, 2293–2309. [Google Scholar]
- Wei, G.; Xu, H.; Zhao, Y.; Dang, Z.; Lu, Z. 25 years field test history and fatigue damage analysis for a scrapped ladle crane. Eng. Fail. Anal. 2025, 167, 109043. [Google Scholar] [CrossRef]
- Moi, T.; Cibicik, A.; Rølvåg, T. Digital twin based condition monitoring of a knuckle boom crane: An experimental study. Eng. Fail. Anal. 2020, 112, 104517. [Google Scholar] [CrossRef]
- Szpytko, J.; Duarte, Y.S. Measuring dependencies in degradation data: Digital platform for coordinating maintenance activities on cranes. IFAC-PapersOnLine 2022, 55, 31–36. [Google Scholar] [CrossRef]
- Huang, Z.; Wen, M.; Li, W. Wind coefficient prediction and structural optimization design of crane girder section. J. Harbin Inst. Technol. 2023, 55, 123–133. [Google Scholar]
- Palanisamy, S.K.; Krishnaswamy, M. Optimization and forecasting of reinforced wireropes for tower crane by using hybrid HHO-PSO and ANN-HHO algorithms. Int. J. Fatigue 2025, 190, 108663. [Google Scholar] [CrossRef]
- Zhou, Q.; Wu, Q.; Xiong, X.; Zhao, J. Periodic topology optimization design of tower crane boom. J. Tongji Univ. (Nat. Sci.) 2017, 45, 1498–1505. [Google Scholar]
- Jiang, J.; Liao, H. Stiffness modeling and structure optimization of heavy-duty intelligent stacking equipment. J. Zhejiang Univ. 2021, 55, 1948–1959. [Google Scholar]
- Tang, K.; Zhang, Y.; Yang, C.; He, L.; Zhang, C.; Zhou, W. Optimization for multi-resource integrated scheduling in the automated container terminal with a parallel layout considering energy-saving. Adv. Eng. Inform. 2024, 62, 102660. [Google Scholar] [CrossRef]
- Alasali, F.; Haben, S.; Holderbaum, W. Stochastic optimal energy management system for RTG cranes network using genetic algorithm and ensemble forecasts. J. Energy Storage 2019, 24, 100759. [Google Scholar] [CrossRef]
- Tao, F.; Sun, Q.; Sun, H. Aero-engine digital twin engineering: Connotation and key technologies. Chin. J. Aeronaut. 2024, 45, 7–31+2. [Google Scholar]
- Liu, Y.; Pan, S.; Ballot, E. Unveiling the potential of digital twins in logistics and supply chain management: Services, capabilities, and research opportunities. Digit. Eng. 2024, 3, 100025. [Google Scholar] [CrossRef]
- Hussain, M.; Ye, Z.; Chi, H.-L.; Hsu, S.-C. Predicting degraded lifting capacity of aging tower cranes: A digital twin-driven approach. Adv. Eng. Inform. 2023, 59, 102310. [Google Scholar] [CrossRef]
- Zhu, Z.; Zhu, W.; Huang, J.; He, B. An intelligent monitoring system for robotic milling process based on transfer learning and digital twin. J. Manuf. Syst. 2025, 78, 433–443. [Google Scholar] [CrossRef]
- Hoskere, V.; Hassanlou, D.; Rahman, A.U.; Bazrgary, R.; Ali, M.T. Unified framework for digital twins of bridges. Autom. Constr. 2025, 175, 106214. [Google Scholar] [CrossRef]
- Wang, J.; Liu, J.; Zou, Y.; Zhu, J.; Liu, J.; Lv, P.; Li, H. Digital twin system for real-time response prediction and hazard warning of a flexible hose in deep-sea mining. Ocean. Eng. 2025, 324, 120676. [Google Scholar] [CrossRef]
- Lin, X.; Guo, Z.; Jin, X.; Guo, H. Digital twin-enabled safety monitoring system for seamless worker-robot collaboration in construction. Autom. Constr. 2025, 174, 106147. [Google Scholar] [CrossRef]
- Shao, C.; Zheng, S.; Xu, Y.; Gu, H.; Qin, X.; Hu, Y. A visualization system for dam safety monitoring with application of digital twin platform. Expert Syst. Appl. 2025, 271, 126740. [Google Scholar] [CrossRef]
- Tao, F.; Liu, W.; Zhang, M.; Hu, T.; Qi, Q.; Zhang, H.; Sui, Y.; Wang, T.; Xu, H.; Huang, Z. Digital twin five-dimensional model and application in ten fields. Comput. Integr. Manuf. Syst. 2019, 25, 1–18. [Google Scholar]
- Zhang, X.; Zhang, X.; Liu, Q.; Xie, W.; Tang, S.; Wang, Z. TBM big data preprocessing method in machine learning and its application to tunneling. J. Rock Mech. Geotech. Eng. 2024, 17, 4762–4783. [Google Scholar] [CrossRef]
- GB/T 30024-2020; Crane Metal Structure Proficiency Verification. National Technical Committee for Standardization of Crane: Beijing, China, 2020.
- Zheng, H. Research and Application of Multidimensional Health Monitoring System for Metallurgical Cranes. Master’s Thesis, Beijing University of Chemical Technology, Beijing, China, 2022. [Google Scholar]
- Golubiatnikov, K.; Wald, F.; Vild, M.; Holomek, J. Optimisation of fatigue solution for welded T-stub joints by grading of FAT classes and correction of mean stress effect. Structures 2023, 58, 105582. [Google Scholar] [CrossRef]
- Yang, Z.; Zhao, C.; Xue, J.; He, M. Fatigue reliability study of welded frame-type bogie frames. J/OL. Southwest Jiaotong Univ. 2025, 1–9. Available online: https://link.cnki.net/urlid/51.1277.u.20241204.1838.015 (accessed on 9 June 2025).
- Zhang, J.; Lv, C.; Van der Heijden, G.; Guo, W. A probabilistic fatigue assessment model based on the Pairs formula with independent material parameters. Shipbuild. China 2020, 61, 95–104. [Google Scholar]
- GB/T 41510-2020; Safety Assessment Specification for Lifting Appliances General Requirements. National Technical Committee for Standardization of Crane: Beijing, China, 2020.
- GB/T 25196-2018; Cranes—Monitoring of Design Duty Cycles. National Technical Committee for Standardization of Crane: Beijing, China, 2018.
- Liu, Y.; Li, Y.; Li, L.; Xie, Y.; Zhang, D. A fast prediction model of blade flutter in turbomachinery based on graph convolutional neural network. Aerosp. Sci. Technol. 2024, 148, 109119. [Google Scholar] [CrossRef]
- Soares, R.C.; Silva, J.C.; de Lucena Junior, J.A.; Lima Filho, A.C.; de Souza Ramos, J.G.; Brito, A.V. Integration of Bayesian optimization into hyperpa-rameter tuning of the particle swarm optimization algorithm to enhance neural networks in bearing failure classification. Measurement 2025, 242, 115829. [Google Scholar] [CrossRef]
- Li, K.; Bao, G.; Xu, R.; Liu, Y. Research on cost control of distribution network engineering based on SGDM optimization IWOA-CNN. J. Guangxi Univ. (Nat. Sci. Ed.) 2023, 48, 692–702. [Google Scholar]
- Chen, J. Robust nonparametric regression based on deep ReLU neural networks. J. Stat. Plan. Inference 2024, 233, 106182. [Google Scholar] [CrossRef]
- Ma, X.; Deveci, M.; Yan, J.; Liu, Y. Optimal capacity configuration of wind-photovoltaic-storage hybrid system: A study based on multi-objective optimization and sparrow search algorithm. J. Energy Storage 2024, 85, 110983. [Google Scholar] [CrossRef]
- Qiu, J.; Luo, H.; Zhang, Y.; Xiao, D.; Zhao, G.; Ma, M. Fault diagnosis of complex system based on interpretive structural modeling. J. Jilin Univ. (Eng. Technol. Ed.) 2024, 54, 3168–3174. [Google Scholar]
- Wang, Y. Matlab/Simulink Analysis of Dynamic Modeling and Control Simulation Examples; China Machine Press: Beijing, China, 2022. [Google Scholar]
- ISO 8686-2:2018; Cranes—Design Principles for Loads and Load Combinations—Part 2: Mobile Cranes. International Organization for Standardization: Geneva, Switzerland, 2018.


Disclaimer/Publisher’s Note: The statements, opinions and data contained in all publications are solely those of the individual author(s) and contributor(s) and not of MDPI and/or the editor(s). MDPI and/or the editor(s) disclaim responsibility for any injury to people or property resulting from any ideas, methods, instructions or products referred to in the content. |
© 2025 by the authors. Licensee MDPI, Basel, Switzerland. This article is an open access article distributed under the terms and conditions of the Creative Commons Attribution (CC BY) license (https://creativecommons.org/licenses/by/4.0/).