1. Introduction
Paper and tissue printing machines based on roll-to-roll presses are commonly used in the food and beverage or packing industries. Successful printing relies on different parameters, such as cylinder alignment, pressure between rotating cylinders and cylinder rotating speed. All these parameters are tuned during the machine fine calibration before its final installation in the production plant. Among all the checks performed before the integration of the cylinders in flexographic printing machines, the cylinders’ surface finishing is assessed. This step is of primary importance for the good quality of the prints, since any defect on the surface of the tested item (the anvil cylinder used in the direct printing process) would result in defective final prints. The general procedure for the acceptance of any cylinder which is lapped before assembling is based on the surface roughness verification. The arithmetic average roughness Ra must be less than 0.2 μm, the condition to be assured by the quality department on each item prior integration on the machine line. In the studied application, the surface roughness testing, based on the stylus probe measurement method, was demonstrated to not be sufficient to assure acceptable printing. This happens when the cylinder surface evidences longitudinal striations (directed along the cylinder axis) which affect the final prints but which are not evidenced by the roughness measurement (performed with mechanical stylus equipment) during the acceptance performed by the quality department of the company. The explanation for the roughness measurement failure is that in defective cylinders there are “stripes” with a roughness that is ever better than that of good cylinders, alternated with rougher stripes. Thus, the measured Ra averages the two conditions and is not sensitive to the presence of the defects on the cylinder surface. This result allows for an understanding of why, beside the acceptance based on roughness measurements, the evaluation of the compliance of the tested cylinders is demanded to trained operators who judge the risk of failure in final prints based on their experience even though they cannot quantify the defect.
A possible solution to this problem comes from the well-established literature about optical technology for surface roughness measurement [
1], allowing for the overcoming of the main issues related to stylus probe measurement methods (finite size of the stylus tip, stylus kinematics, loading effect of the stylus itself). Thus, a non-contact technique appears to be well suited for use for the intended objective. For instance, the authors in [
2] describe the design and testing of an optical probe based on the laser scattering working principle for in situ surface measurement during workpiece machining. The system requires a laser diode, a position sensitive detector and an optical system to convey scattered light on the analyzed surface. The system was demonstrated as being effective for the intended purpose and provided results in agreement with measurements performed with mechanical stylus equipment (taken as reference). A similar technology is used by the authors in [
3], exploiting laser profilometry to evaluate the surface roughness dependence on the wiper inserts in conventional carbon steel turning.
Imaging technology has also been used and developed for surface roughness measurement: the authors in [
4,
5,
6] demonstrated the validity of using vision-acquired data to obtain a good estimate of the surface roughness. Imaging technique is also found in patent [
7], where a method and related system for automatically detecting defects in a printing cylinder for gravure press during its fabrication are described. The authors designed a measurement system based on an imaging sensor which scans a rotating cylinder (the specimen to be tested), providing fast checking of the cylinder, and scanning a large area of the tested item.
It must be noted that any image-based measurement method is in general sensitive to lightness modification, the exposure time of the camera and/or optical surface characteristics; this is a well-known problem, as evidenced more recently by the authors in [
8], who developed an image based measurement method for surface roughness measurement, addressing two main problems related to the imaging technique, i.e., the complexity of the calculation and the dependence of the obtained results on a light source.
Thus, we decided to develop a measurement method to perform a quality check of the printing cylinders using a displacement contactless sensor based on the eddy current working principle. It has to be clear that the proposed method is not aiming to measure the surface roughness, a task already achieved by means of well-established contact and contactless methods [
1], which nevertheless have proven ineffective in detecting the defects in the case of stylus probe equipment. The new method aims to provide a robust and cost-effective alternative, in agreement with the Internet of Things (IoT) paradigm [
9], to the visual inspection performed by trained operators in detecting defects prior to cylinder assembly. The IoT approach has a great relevance in modern industrial quality control; low-cost sensors can be used to greatly improve product quality in different fields [
10]. Furthermore, signal processing plays an important role in the extraction of information from production systems, and techniques such as sensor fusion and data fusion are nowadays widely used to reduce the measurement uncertainty [
11]. The main objectives of the intended method are the simplification and standardization of the quality check performed in the company, providing a quantitative parameter for the cylinder-screening phase before integration.
Section 1 describes the proposed measurement method and the designed testing setup. The results of the method validation and performed experimental activity on batches of cylinders are presented and discussed in
Section 2, while the paper is eventually concluded in
Section 3.
2. Materials and Methods
2.1. Proposed Measurement Method
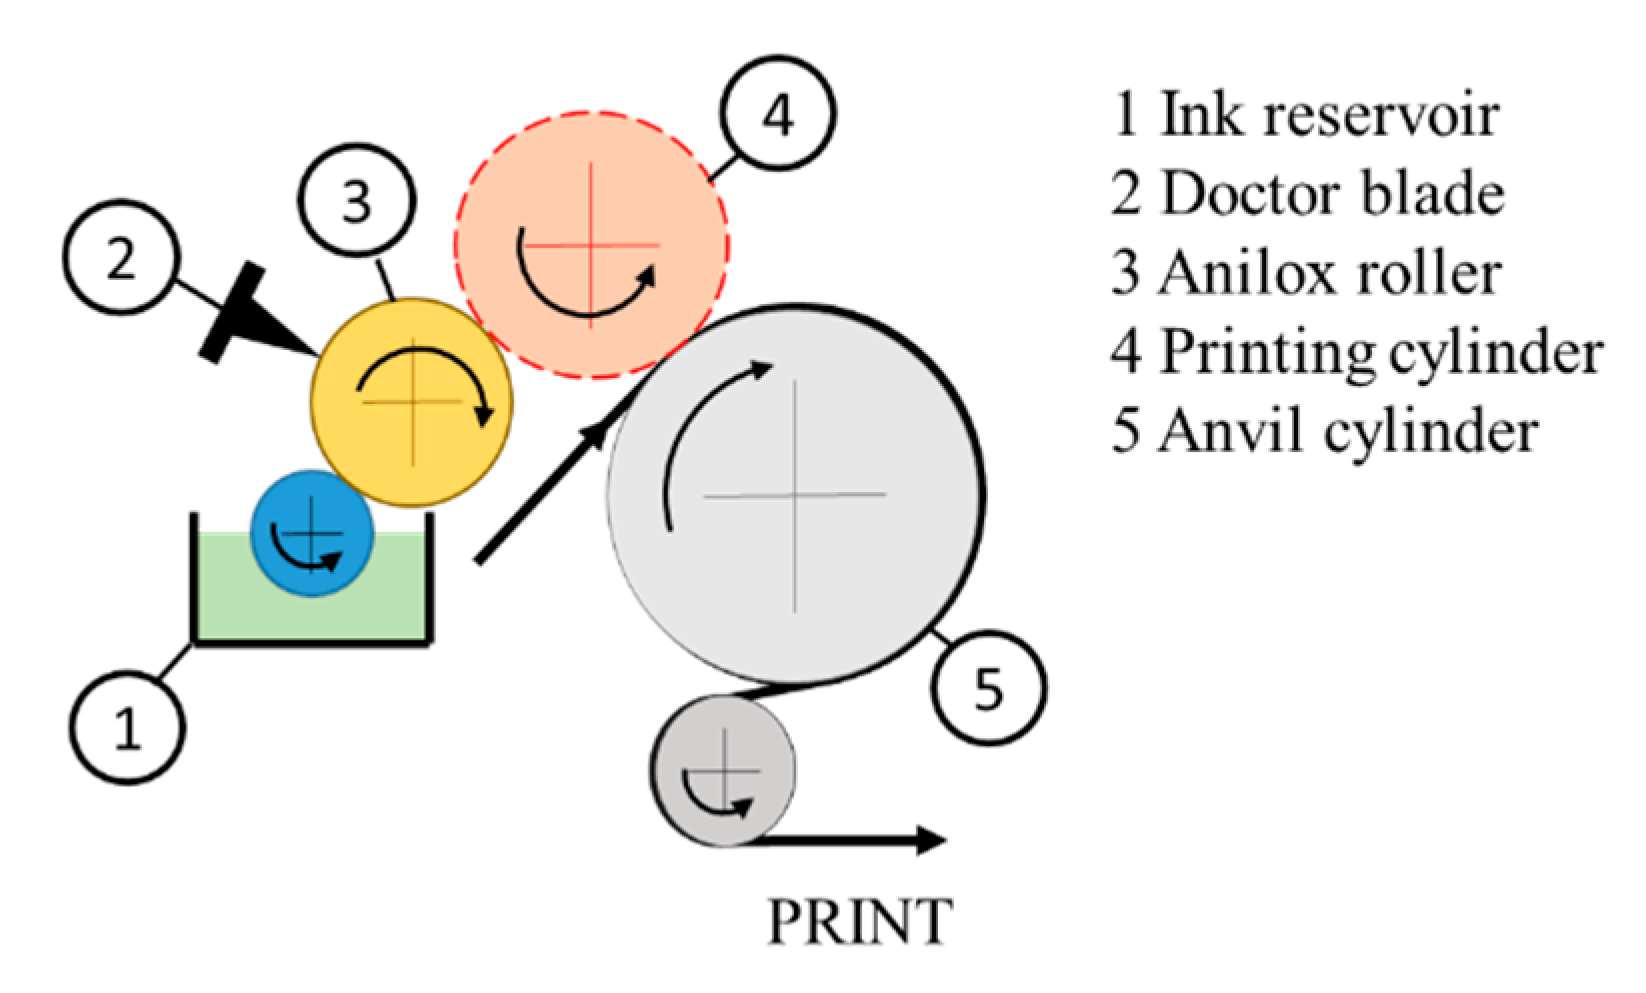
The quality check of the anvil cylinders’ roughness for flexographic printing machines is a mandatory task to assure the good quality of the final prints. A scheme of the printing process is shown in
Figure 1.
The printed material is dragged by the anvil cylinder, which is in contact with the printing cliché. The latter holds the ink that is taken from a reservoir by means of an anilox roller and doctor-bladed system. One of the main steps of the process is the contact between the anvil cylinder and the cliché one, since any defect on the anvil cylinder surface would provide an unacceptable print.
Examples of defective and non-defective cylinders and an unacceptable print are shown in
Figure 2.
A comparison between the defective and non-defective cylinders (provided in
Figure 2a,b) clearly shows the presence of the defects. This is testified by looking at the print of the defective cylinder, where it can be noticed that the longitudinal defects are regularly spaced. This is not seen on the non-defective cylinder (shown in
Figure 2b). In fact, the resulting striations develop along the cylinder axis at a nearly constant angular distance. In the case of the defective print shown in
Figure 2c, the defect on the cylinder led to parallel stripes of different grey levels, in this case with a pitch of about 3.4 mm.
The defect being regular along the cylinder circumference, the root cause is most likely a mechanical vibration of the cylinder (or of the machine) during lapping; therefore, the idea behind the proposed method is that if longitudinal striations are present, they can be sensed as local variations of the cylinder circumference by means of contactless displacement sensors, providing an oscillating signal with a frequency that depends on the pitch of the defect and the rotational speed of the cylinder. Thus, knowing the rotational speed of the cylinder
ωc, the pitch of the defect
pd and the diameter of the cylinder
D (190 mm for the tested cylinders), the expected frequency
fd of the defect would be given by:
It is clear that the frequency
fd is not expected to be strictly constant because of the variability of the defects in terms of pitch and depth. The working principle of the proposed measurement method is shown in
Figure 3.
Thus, the root means square (RMS) of the radius variation (filtered in the frequency band of interest derived from the expected defect pitch interval, defect shape and rotational speed) was identified as the best estimator of the defect severity. Moreover, it is expected that, given that during the test the cylinder is mounted on rotating supports, introducing some eccentricity, a filtering must be applied to remove low frequency content (same period of the rotation) due to the mounting error. Cut-off filters are applied as digital filters after the signal acquisition.
It has to be noted that any disturbances coming from bearings’ tolerance or external mechanical and acoustic vibrations may cause an unwanted measured signal in the bandwidth of interest. Even if some filtering techniques can be used to mitigate the issue with data post-processing, the unwanted disturbances may lead to false detections or, on the other hand, prevent the measurement system from identifying the defects on the tested cylinders. In order to identify the limitation of the proposed method, the threshold value of detectability can be computed from the standard deviation of the measured RMS of the radius variation. If n multiple measurements of the measured RMS are taken, the sample standard deviation
sRMS can be computed as:
Under the hypothesis of a normal distribution, a confidence level of 99.7% provides the maximum of the confidence interval set to
and minimum to
:
Given the quadratic combination of RMS for the uncorrelated signal, one can predict that a defect generating a normalized
RMSdef equal to the quadratic difference between
RMSmax and
RMSmin would generate an increase in the measured RMS still within the range of variability due to the set-up:
Thus, RMSdef can be identified as the detectability threshold for the proposed method.
2.2. Test Bench Design and Verification
In order to verify the feasibility of the proposed method, a setup was designed. A sketch of the conceived design is shown in
Figure 4. The setup comprises an (1) aluminum bench plate, (2) MR 742 45 1/144 DC motor with encoder, (3) elastic joint ECCN 020 R, (4) supporting bearings, (5) eddy current sensor eddy NCDT 3100–EPU05 @MICRO-EPSILON MESSTECHNIK GmbH & Co. KG and (6) elastomeric dampers 3025VD23–45Sh. The eddy current sensor has been selected on the basis of its characteristics, i.e., a measurement range of 0.5 mm, sensing head diameter of 2 mm, resolution of 50 nm and uncertainty due to nonlinearity of about 1.25 μm.
The setup has been designed in view of the following requirements:
the positioning system of the eddy current sensor (by means of a mechanical slide), ensuring the movement of the sensor along the entire component; this would allow for the scanning of different areas along the cylinder axis (in particular, the areas of interests, named A, B and C in
Figure 4, are near the supporting bearings and in the central part of the cylinder); and
the first mode of vibration of the bench above 100 Hz, to avoid mechanical disturbances induced by the modes of the supporting structure on the RMS displacement measurement; and
the reduction of the sensitivity of the bench to the vibrations transmitted by the supporting surface and the motor; this objective has been achieved by using dampers installed on the bottom of the bench plate and by mounting the motor by means of an elastomeric tape.
The design of the bench has been carried out numerically by means of the Finite Element (FE) approach [
12,
13,
14,
15]. A 3D FE model of the bench has been developed, accounting for mass components and equivalent damper properties. The developed model is shown in
Figure 5.
Figure 6 shows the computed modes of vibration with details of the optical bench plate only.
It has to be noted that the first six modes involve an almost rigid motion of the bench plate on the dampers, with the first cut-off frequency located at about 5.3 Hz. The first mode involving a significant bench plate deformation is at about 114.3 Hz, corresponding to a bending of the plate. The latter would be a disturbance for the measurement, but the dynamic design requirement is fulfilled as the frequency is significantly far from the measurement frequency band. The designed bench was manufactured and assembled to verify the feasibility of the defect characterization of the printing cylinders.
Figure 7 shows a view of the manufactured test bench.
The bench was tested in order to validate the design phase. The frequency response function of the structure was measured using a dynamometric hammer (PCB Piezotronics Depew, NY, USA model 086C02) and three piezoelectric accelerometers (Bruel&Kiaer, model 4508-B). The accelerometers were placed along the bench plate in different positions (see
Figure 7). The bench was excited with ten impulses (measured by a dynamometric hammer). The acquired time histories were triggered and the average Frequency Response Functions (FRFs) were computed. The resulting FRFs for the 1st, 2nd and 7th modes are shown in
Figure 8.
The mechanical filtering capabilities of the used dampers were confirmed, first providing a measured cutoff frequency of 6.4 Hz, a value close to the 5.3 predicted by the numerical analysis, the difference being justified by the non-linear stiffness of the dampers combined with the static load due to the weight of the system. The validation of the modeling was achieved by exploiting the mode of vibration of the bench plate. The first measured resonance was found to be 112.6 Hz, about 2% less than the one predicted by the analysis, in line with the intrinsic uncertainty of the FEM discretization.
3. Experimental Activity
3.1. Test Procedure
In order to verify the effectiveness of the proposed method for the problem of interest, two different cylinders were tested. These had been identified by experienced quality experts as defective and non-defective cylinders. As a reference for the geometry measurement, the Laser Doppler Vibrometer (LDV), OFV-505 with displacement decoder DD-200 by Polytech, was used. The LDV allows for the measurement of the displacement and velocity of a target object without contact and with a resolution as low as 2 nm [
16,
17]. For each cylinder, the following testing procedure was adopted:
An eddy current (EC) displacement sensor has been positioned at the region to be investigated along the cylinder axis (as shown in
Figure 3); before starting each measurement session, the head of the sensor has been placed at 0.1 mm distance from the cylinder by means of a thickness-calibrated spacer in order to provide the repeatable mounting of the sensing head; and
the cylinder rotation has been set at 0.785 rad/s (rotation period of 8 s), and upon stabilization the signals of the vibrometer and eddy current sensors have been acquired; and
the acquired time histories have been pass band-filtered (Butterworth, 3rd order) with cut-off frequencies at 15 and 55 Hz; these values correspond to defect pitches of about 4.4 and 1.4 mm.
For each time history, three cycles were selected (named below as cycles #1,#2 and #3) in order to have a raw assessment of the method repeatability, and the RMS displacement was computed; below, we will refer to the RMS of the LDV and of the EC as RMSLDV and RMSEC, respectively. The measured spectra were compared for the tested cylinders by means of the LDV and of the eddy current displacement sensor only during the validation phase. If defects were present, a spectral feature was expected at the frequency of the defect. The acquisition system also comprised a NI acquisition board 9234 with a sampling frequency of 2048 Hz, equipped with an antialiasing filter. Moreover, a piezoelectric accelerometer (Bruel&Kjaer model 4370) was mounted on the measurement bench to monitor vibrations from unwanted external disturbances that would prevent the system from correctly measuring the defect. During quality testing, the bench vibration (quantified by the acceleration RMS value) was measured and compared with a threshold value identified in a laboratory environment. If the measured bench vibration overcame the identified threshold, the general inspection of the bench was performed until the RMS came back within the acceptable range, and the measurement was repeated.
3.2. Method Validation and Cylinders Testing
Below, the measured time histories and spectra of the LDV and eddy current sensor are provided. Before testing, the eddy current sensor was calibrated on the cylinder material using the LDV as reference. Static calibration is mandatory because the sensitivity of these kinds of transducers strongly depends on the target type of material and also on its microstructure. The calibration provided 17.33 V/mm sensitivity (the nominal value is 20 V/mm from the sensor datasheet with an AISI 440 target), with a standard uncertainty of 0.73% on the measured sensitivity. In order to ease the comparison between the defective and reference cylinders, we normalized the quantities
RMSLDV and
RMSEC with respect to the average measured RMS of the radius variation for the reference cylinder without the defects measured by the LDV
RMSRef,LDV:
Thus, for the LDV measurements with the cylinder without defects, the average of RLDV was expected to be 1.
3.2.1. Testing of the Cylinder without Defects
Figure 9 and
Figure 10 show, for the LDV and eddy current sensor respectively, the measured time histories and corresponding spectra of the reference cylinder.
Table 1 summarizes the normalized measured displacement RMS in the three areas of interest for the cylinder.
3.2.2. Testing of the Cylinder with Defect
In
Figure 11 and
Figure 12, the measured time histories and related spectra for the defective cylinder measured by the LDV and the eddy current sensor are provided.
Table 2 summarizes the measured RMS values in the selected areas.
In order to assess the repeatability of the proposed measurement method, additional measurements were performed on the defective cylinder. The normalized RMS values were computed on eight time-histories, and the variability was computed as a sample standard deviation. The latter expresses the method repeatability and is the lower limit of the measurement method uncertainty. The results are summarized in
Table 3.
3.3. Discussion
In order to identify the limitation of the proposed method, the threshold value of detectability was computed from the standard deviation of the measured
REC in
Table 1 (measurements of the non-defective cylinder by the eddy current probe). The average
REC is 1.436, with a standard deviation of 0.035, providing a maximum of the confidence interval set to 1.541 and a minimum to 1.331 (like for Equations (3) and (4)). The measured values provide the detectability threshold of the proposed method at 0.78.
Spectra in
Figure 9 and
Figure 10 evidence peaks that are not repeatable in terms of the amplitude and frequency content for each analyzed cycle of the measured time histories. This is coherent with a surface of the tested item that does not present defects. Instead, looking to the measured spectra in
Figure 11 and
Figure 12, the amplitudes of the peaks and related frequency content appear to be repeatable for both used sensors. Peaks had a larger magnitude than that measured for the non-defective cylinder by a factor ranging between four and ten for the eddy current sensor and the LDV, respectively. This result evidences the presence of defects, with quite a repeatable shape, on the examined cylinder.
When further comparing the obtained results, it can be seen that the
REC and
RLDV values for the defective cylinder are different between the used sensors. This is somehow expected, and the cause lies in the spatial resolution of the sensors. In fact, the LDV measurement spot is in the order of tens of millimeters, whereas the eddy current sensor is at least one order of magnitude larger. This causes an averaging of the peak-valley difference, resulting in lower estimated amplitudes. In any case, this is not a limiting factor for the proposed method since, as already mentioned, the main objective is to find a parameter for the identification of the defective condition. In order to have an estimation of the defect pitch, the computed maxima of the spectra in
Figure 11 and
Figure 12 have been taken. The obtained result (frequency varying between 21.63 and 22.27 Hz) agrees with what was derived by prints, i.e., a pitch of the defect ranging between 3.45 and 3.35 mm. This validates the proposed method, confirming the capability to identify surface defects relevant to the intended application. As shown in
Table 3, the method repeatability is about 2% of the average value of the measured
REC; this becomes the uncertainty in the threshold identification during the quality check during cylinder testing.
3.4. Batches Testing
After the encouraging results of the above tests, the test bench was used to inspect different batches of incoming cylinders. Two different batches were tested, 17 cylinders in total. The objective of this test campaign was the identification of a threshold value for the RMS to be used for the quality control. Among the tested cylinders, as expected, there were not only “good” and “bad” specimens like in the previous test but defects of variable gravities.
Figure 13 summarizes the measured results.
It can be noted that the batch testing evidences a variability of the normalized RMS between 2.55 and 0.85 in view of all the analyzed areas. All the cylinders (preliminarily screened by the quality control department) were integrated in the machine lines. All the tested items showed acceptable results, without noticeable defects in the resulting prints. Thus, in accordance with the quality department of the company, the threshold value for the acceptance was set at 2.55, the maximum value registered during the testing of the batches.
Comparing the latter value with the threshold value related to the detectability of the method, it can be noted that the risk of considering defective good cylinders as only being a consequence of the randomness of the bearings’ noise or of the measurement chain lies well below a meaningful probability. This result proves the robustness of the proposed method for the intended case.
4. Conclusions
In this work, a measuring system based on an eddy current displacement sensor was developed for the quality check of the surface of cylinders used in flexographic roll-to-roll printing machines. The method was demonstrated as being effective for the intended application, i.e., providing a screening method for quality control. The main advantages are related to a rapid scan of the tested item, providing the possibility of analyzing different areas of the cylinder, and rapid post-processing, mainly based on the acquisition and evaluation of the RMS displacement of the tested item.
The test bench was designed and successfully validated by a dynamic characterization. The validity of the proposed system was checked on previously classified items, i.e., defective and non-defective cylinders. The testing activity on different batches of printing cylinders allowed the identification of the threshold value of the measured RMS to be used in order to assess the acceptance during quality control.

 ,
, 


