Article

Real-Time Hybrid Deep Learning-Based Train Running Safety Prediction Framework of Railway Vehicle

1
School of Industrial Engineering, Kumoh National Institute of Technology, Gumi 39177, Korea
2
Urban Transit Research Group, Advanced Railroad Vehicle Division, Korea Railroad Research Institute, Uiwan-si 16105, Korea
*
Author to whom correspondence should be addressed.
Machines 2021, 9(7), 130; https://doi.org/10.3390/machines9070130
Submission received: 17 May 2021 / Revised: 23 June 2021 / Accepted: 26 June 2021 / Published: 29 June 2021

Abstract

:
Train running safety is considered one of the key criteria for advanced highway trains and bogies. While a number of existing research studies have focused on its measurement and monitoring, this study proposes a new and effective train running a safety prediction framework. The wheel derail coefficient, wheel rate of load reduction, and wheel lateral pressure are considered the decision variables for the safety framework. Data for actual measured rail conditions and vibration-based signals are used as the input data. However, advanced trains and bogies are influenced more by their inertial structures and mechanisms than by railway conditions and external environments. In order to reflect their inertial influences, past data of output variables are used as recurrent data. The proposed framework shares advantages of a general deep neural network and a recurrent neural network. To prove the effectiveness of the proposed hybrid deep-learning framework, numerical analyses using an actual measured train-railway model and transit simulation are conducted and compared with the existing deep learning architectures.

1. Introduction

The running safety of railway trains and bogies has been considered an important criterion for rail transportation. As advanced high-speed trains have witnessed rapid advancements and widespread adoption, their running safety has received considerable attention. Running safety influences the transportation of passengers as well as the safe delivery of cargo. Several railway related organizations [1,2,3,4] have their own definitions, measuring rules, standards, and devices for determining running safety. For instance, KRTS-VE-Part21-2015(R1) [5] defines the measurement of the running safety of a railway with forces between train wheels and rail. The detail mechanism is provided in Section 2. European standard EN 14363:2016 [6] introduced a multiple regress technique and removes the two-rail inclination testing method. UIC 518 OR [7] explained a simplified method using running vibrations as well as a normal method considering interactions between wheel and rail.
There have been a number of studies on the running safety of a train. However, most existing research studies have focused on measurements and monitoring of trains’ running safety. In addition, existing research studies have considered limited measuring environments (e.g., bridge passing of a train, movements in a tunnel, or driving of a curved railway) for comparatively simple monitoring. Moreover, the prediction framework for running safety has been comparatively less examined. This study focuses on an effective prediction framework for train running safety in a real-time manner.
Another challenge in running safety is the existence of various conditions and environments in which the train is running. Train running safety is influenced by the number of environments surrounding a train vehicle. For instance, a train’s mechanical structure, railway structures, and conditions must be considered simultaneously to ensure safety in real time.
This research study is motivated by the following questions: (1) relationships among train structure, railway environments, and running safety; (2) existence of a running safety prediction framework; (3) possibility of real-time running safety measurement; and (4) effectiveness of machine learning frameworks for running safety prediction. Considering that there is an effective machine learning framework for real-time running safety in a train, it is possible to control trains to achieve better running safety. An investigation of a real-time running safety prediction framework can facilitate active control for better train driving by maximizing passenger comport and ensuring safe delivery of cargo. Although several advanced rail technologies have been proposed, the proposed framework is expected to play a fundamental role in the active control of trains. Moreover, the technology can contribute to the prevention of train derailment and the loss of lives of boarding passengers.
Therefore, this study applies and tests several machine learning techniques using real-time train driving data. Moreover, the relationship between running safety and surrounding factors is discussed. Based on the acquired results, real-time train running safety control and prediction are performed.
To propose an effective prediction framework for train running safety, the following section provides the relevant background and a review of the existing research studies. Section 3 explains the training and test data for the prediction of train learning safety. Section 4 summarizes the real-time data-driven prediction framework. In Section 5, the effectiveness of the proposed framework is proven through case studies and comparisons with existing methods.

2. Background and Literature Review

As mentioned in the previous section, each railway institution has its own running safety definition and rules. In general, train running safety is related to the measurement of forces in a running train. These forces are detected as vibrations in the train structures. Numerous studies have calculated the derailment coefficient (DC) to determine the running safety of trains. Figure 1 shows the simplified forces between running train wheels and rails as KRTS-VE-Part51-2017(R1) [8].
Nomenclature for Figure 1 is provided in Table 1.
(1) and (2) denote the relationships between L and V,
L = N sin α T Y cos α
where, T Y μ N
V = N cos α + T Y sin α
DC is calculated with L / V as shown in (3).
DC = tan α μ 1 ± μ tan α
Similarly, the dynamic vertical power (DV) is calculated using Δ V V . In general, these are key criteria for determining the dynamic running safety of trains. Figure 2a,b show the allowable running safety per DC and DV as per the Korean railway standard (KRTS-VE-Part21-2014(R1)) [4], respectively.
As shown in Figure 2, the Y-axis represents the probability of maximum DC ( max L V ) and a probability of minimum axle load ( min P ), respectively. Each probability is compared with DC or DV measured in real time, and the running safety of a train is determined. Besides the dynamical criteria, each railway operation institute has different static criteria for running safety. Table 2 lists the static criteria for running safety in South Korea.
As mentioned in the previous section, the measurements and determination of running safety vary with the applied standards, the train’s specifications, and running environments. However, these approaches are oversimplified analyses of the system of forces between the wheel and rail and fails to explain the essence of the train running safety.
In addition, it is difficult to dynamically measure the running safety considering the overall train structure and surrounding environments. Therefore, several existing studies have considered limited measuring environments. Table 3 summarizes the characteristics of existing safety-related research studies.
As summarized in Table 3, most relevant studies have focused on the monitoring of vibrations for determining running safety under limited environments. Moreover, the analysis frameworks depend mostly on comparatively simple nonlinear regression models.
Several studies have overcome this limitation by introducing machine learning techniques. In contrast to regression models, data from either measuring devices, simulation models, or in combination, have been used as input for machine learning methods. Alawad et al. [17] applied a convolutional neural network (CNN) to detect railway risks. Similarly, Yang et al. [18] applied the ResNet model [19] to determine rail defects. Lee et al. [20] applied a generative adversarial network (GAN) approach to estimate the remaining life of train components to detect faults in trains. However, these studies have applied deep learning methodologies to image-based risk detection or train data analyses. There have been few research studies and applications for train running safety using deep learning methods.
Therefore, this study proposes a deep learning-based framework to determine the running safety of a train in real time. Moreover, the proposed framework predicts future running safety by considering a train structure and railway conditions. The following section provides the detailed measurement conditions and framework.

3. Results Train Running Safety Data and Measurement Framework

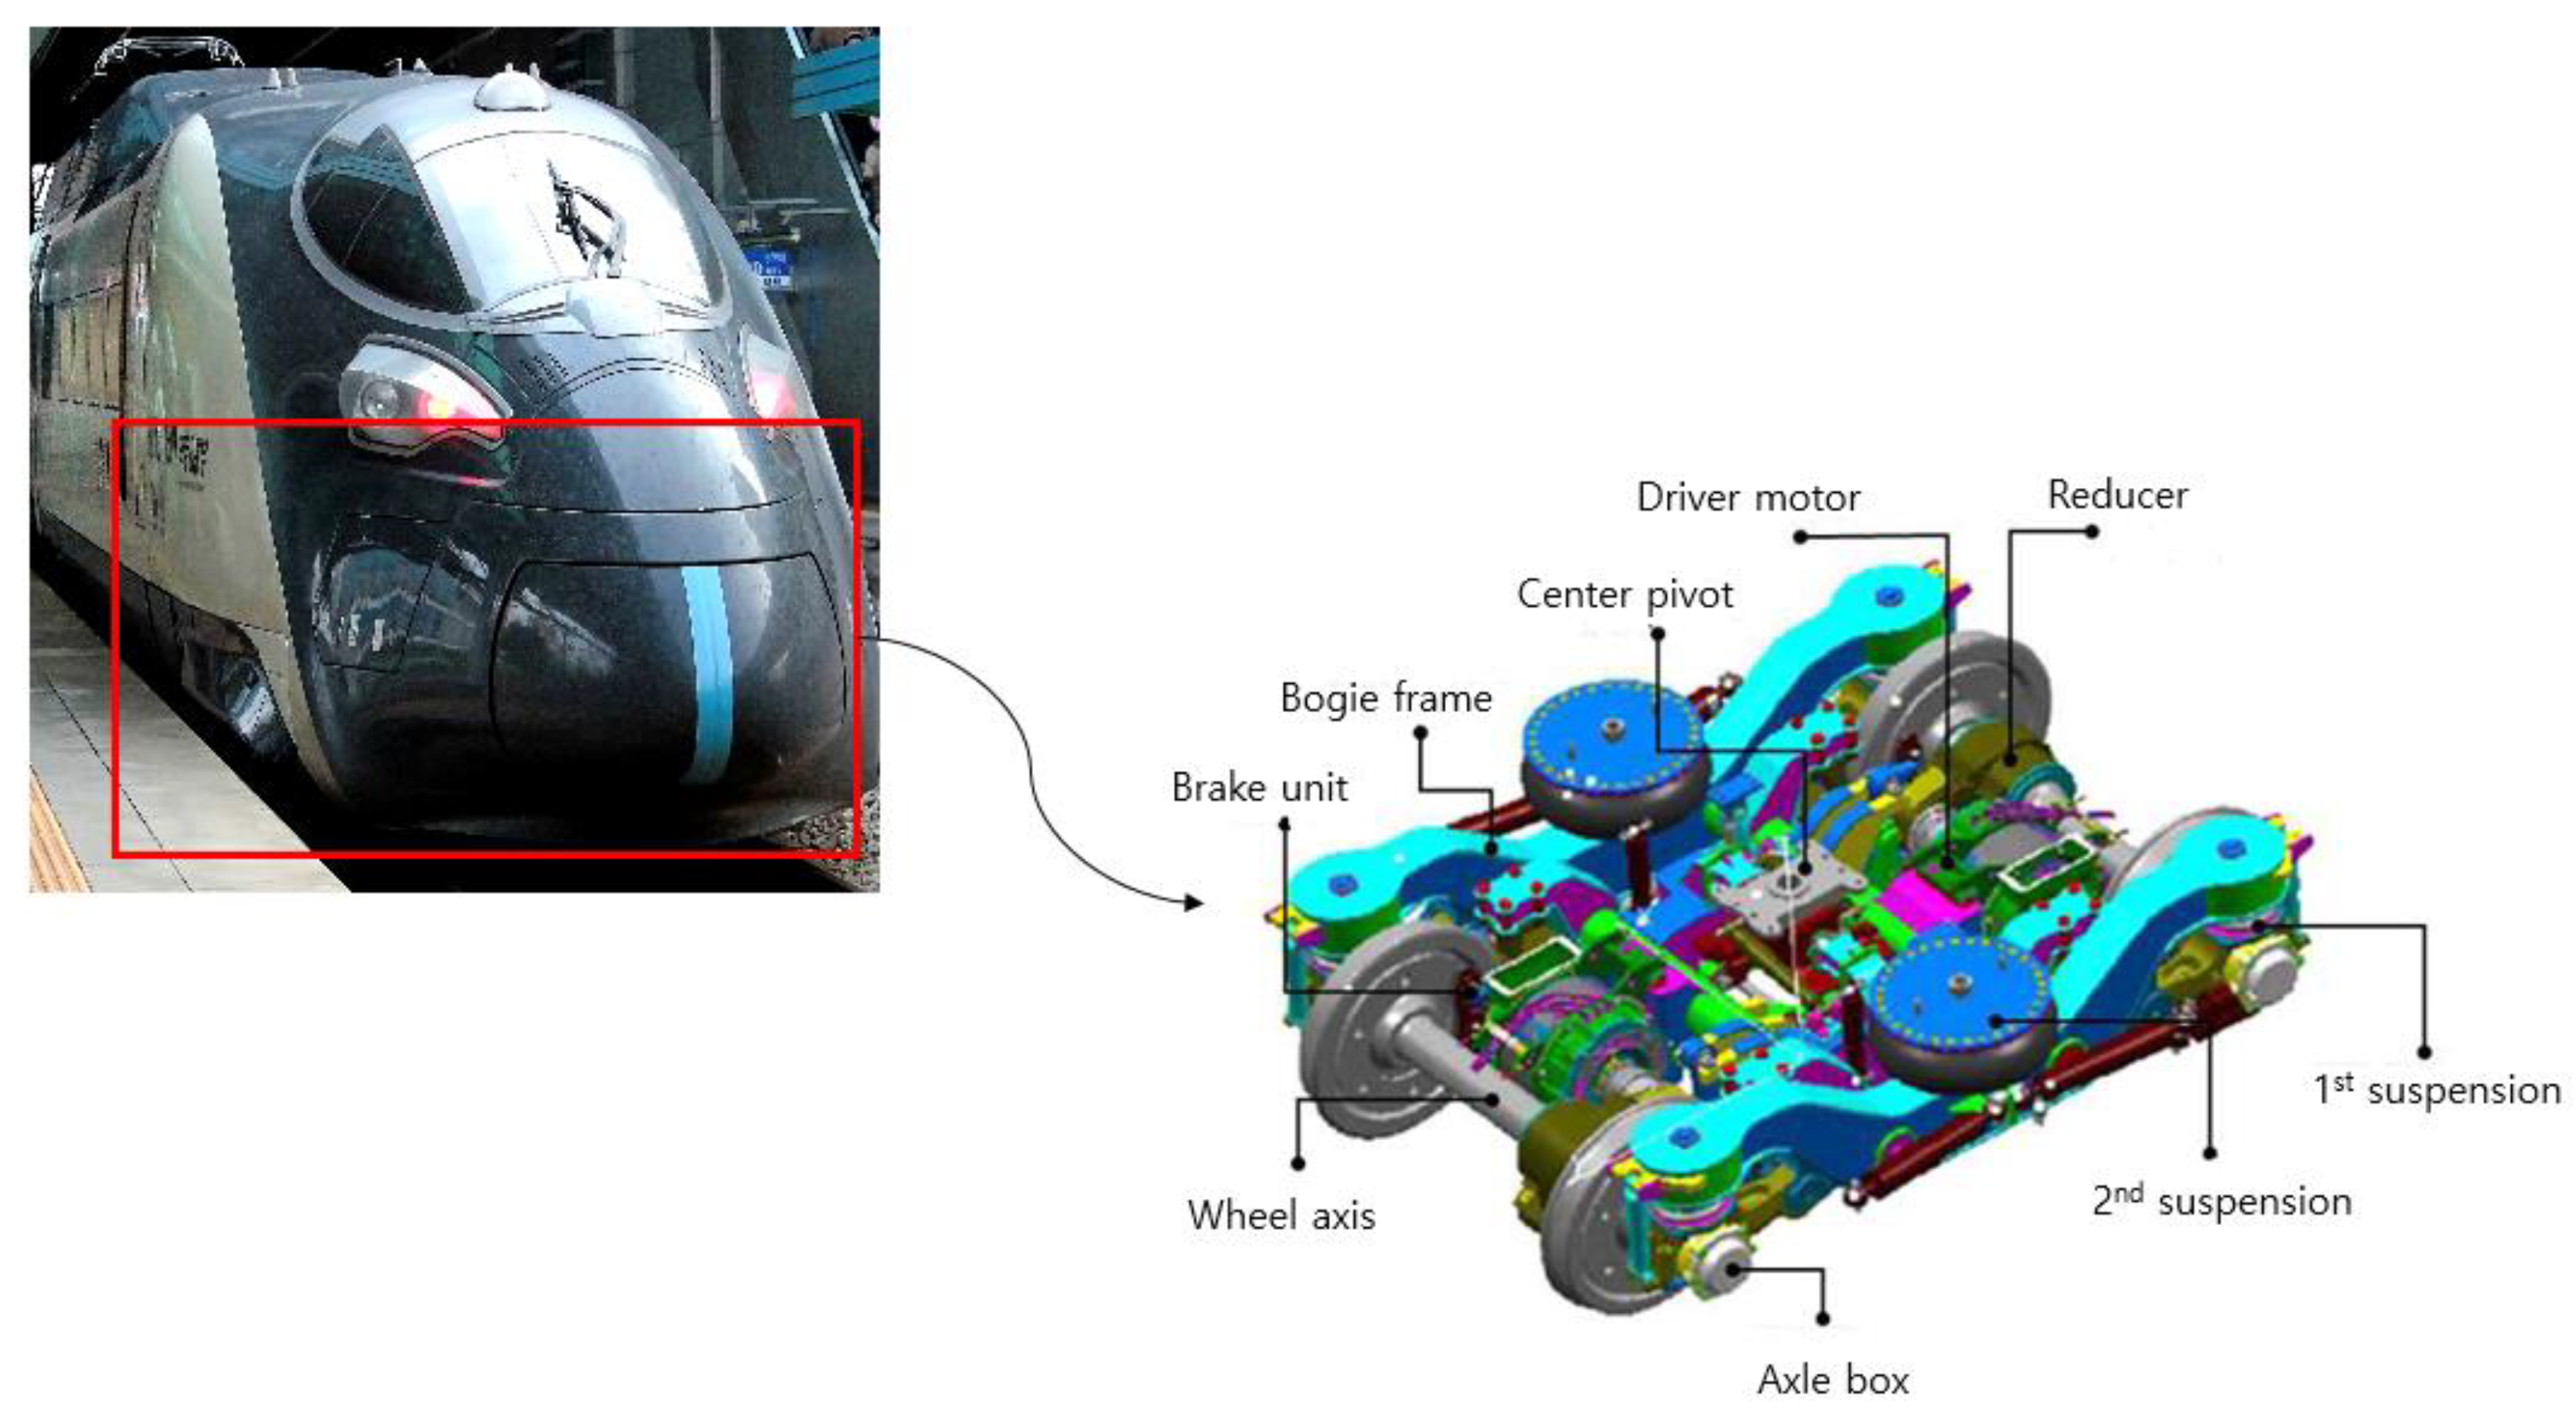
The key objective of this study is to predict the running safety factors considering the train mechanism and railway conditions in real time. As a target train model, we considered a developing high speed train model—high speed electric multiple unit 430 km/h experiment (HEMU-430X). HEMU-430X was developed by the Korean Rail Research Institute (KRRI), a state-run railway research institute by the Korean government, with a maximum speed of 430 km/h. In South Korea, most running express trains have been built based on the HEMU-430X. Figure 3 shows an HEMU-430X and its electromechanical structure, which this study considers as a train model.
This study uses its electromechanical structure to simulate running under real railway conditions. Accelerometers were installed to measure vibrations on an HEMU-430X bogie model. Figure 4 shows the detection points for vibrations, their displacements, and the axes for vibration.
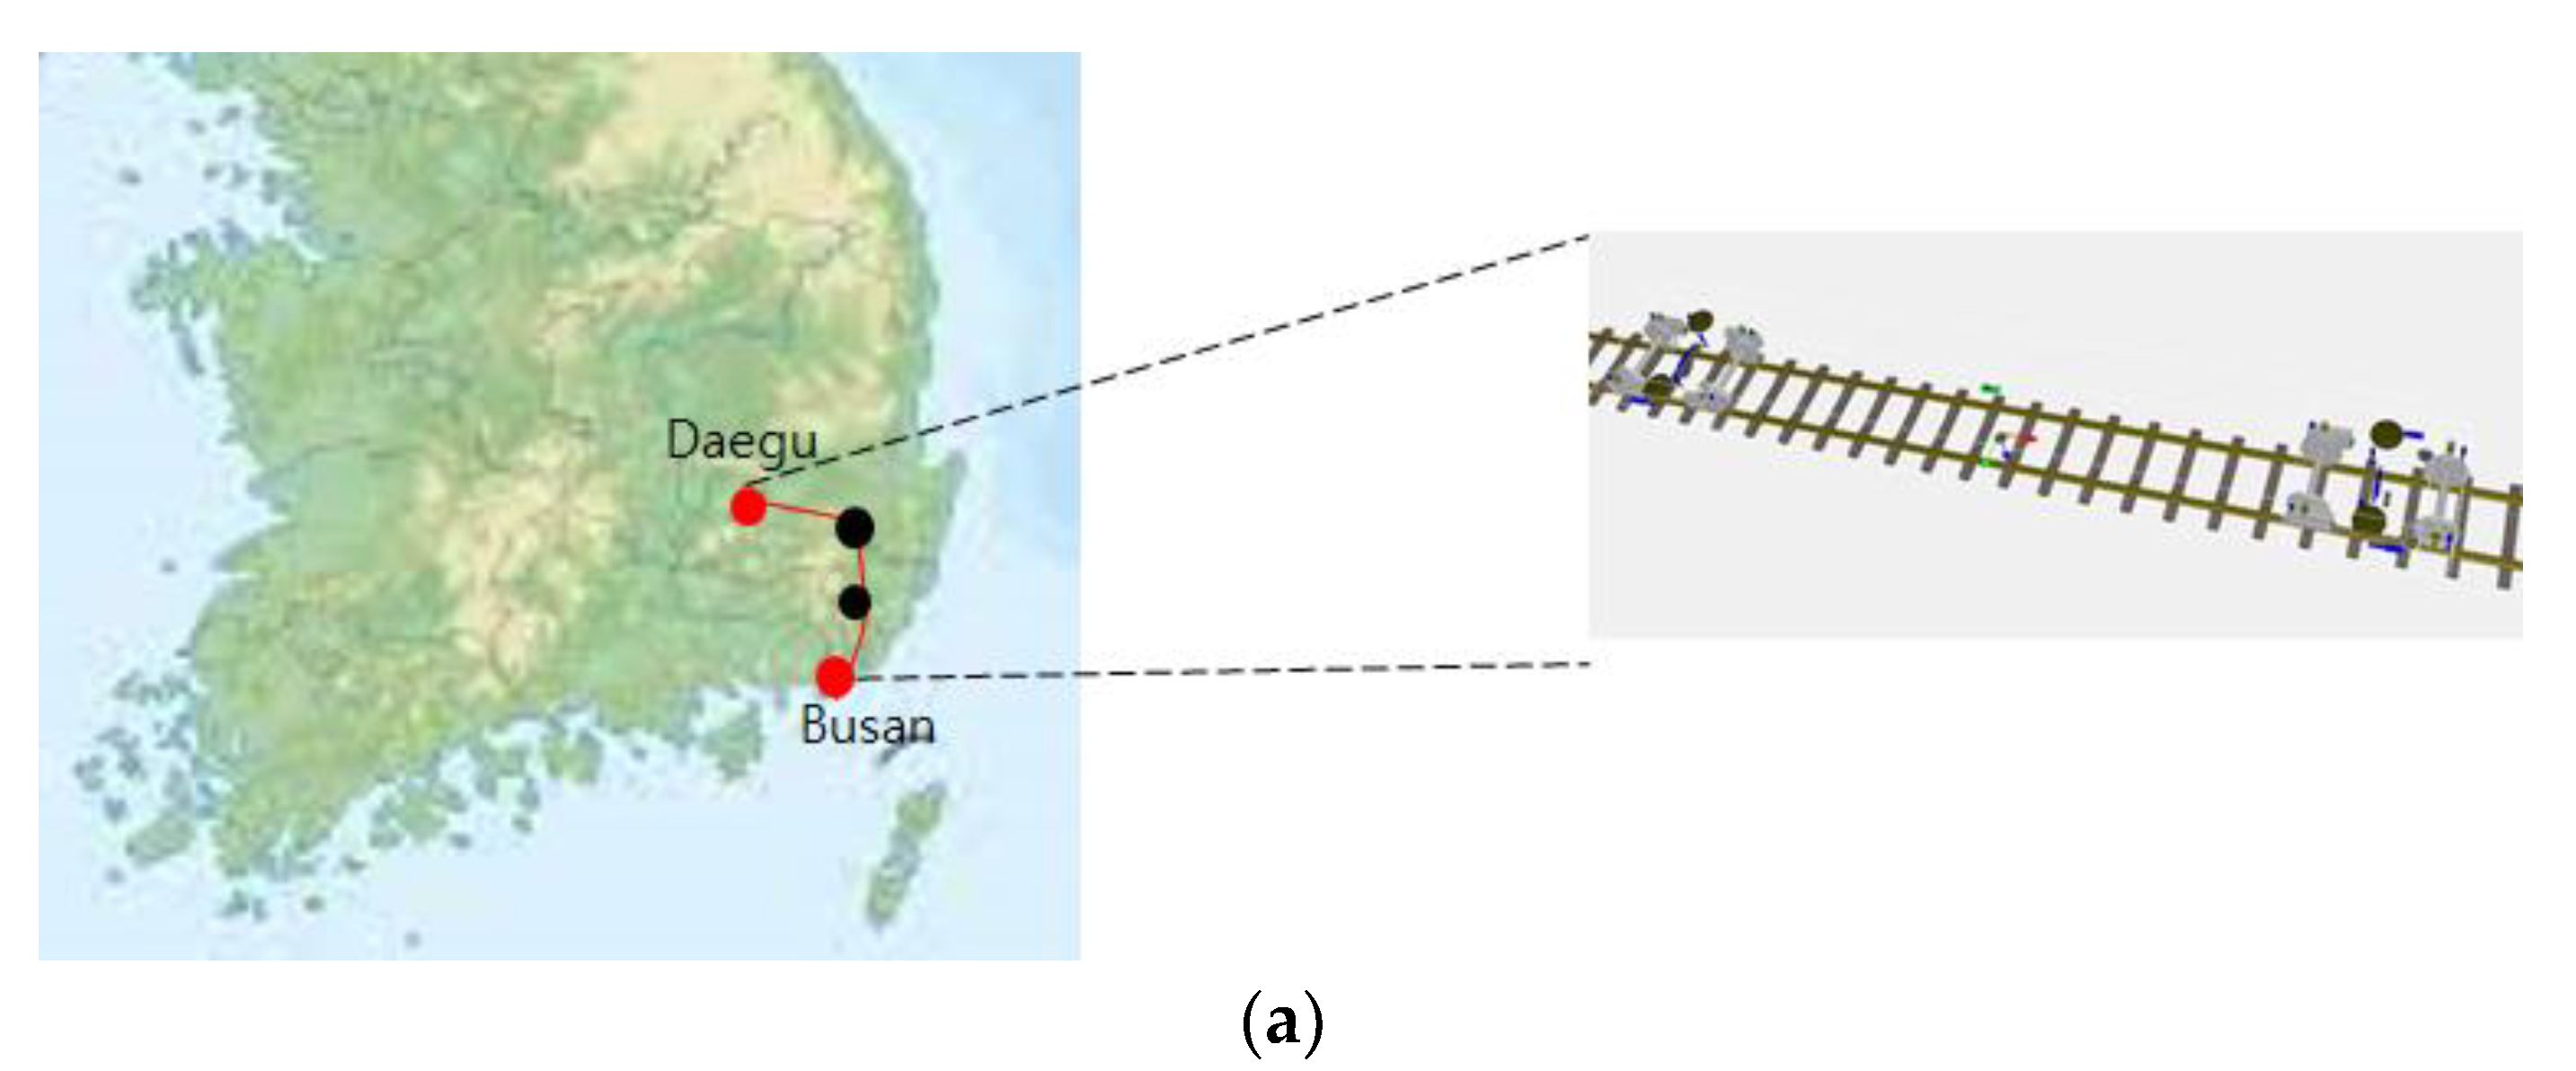
A 3 km real railway is modeled. The modeled railway was based on actual measured data (measuring unit: 25 cm) from Busan to Daegu, South Korea. Figure 5a shows the real railway and its model.
The rail model is parameterized with distance (unit: mm), cross level irregularity (unit: mm), curvature irregularity (unit: 1/km), lateral irregularity (unit: mm), vertical irregularity (unit: mm), and gauge variation (unit: mm), which are obtained from the actual measured railway data. Among these parameters, cross level irregularity is called a “cant”. The cant is related to the rail’s curvature and the running speed of a train. The rail model was programmed using a rail vehicle track interaction simulation software, Vampire Pro software [21]. Figure 5b shows a part of the track distance plot that represents the modeled rail.
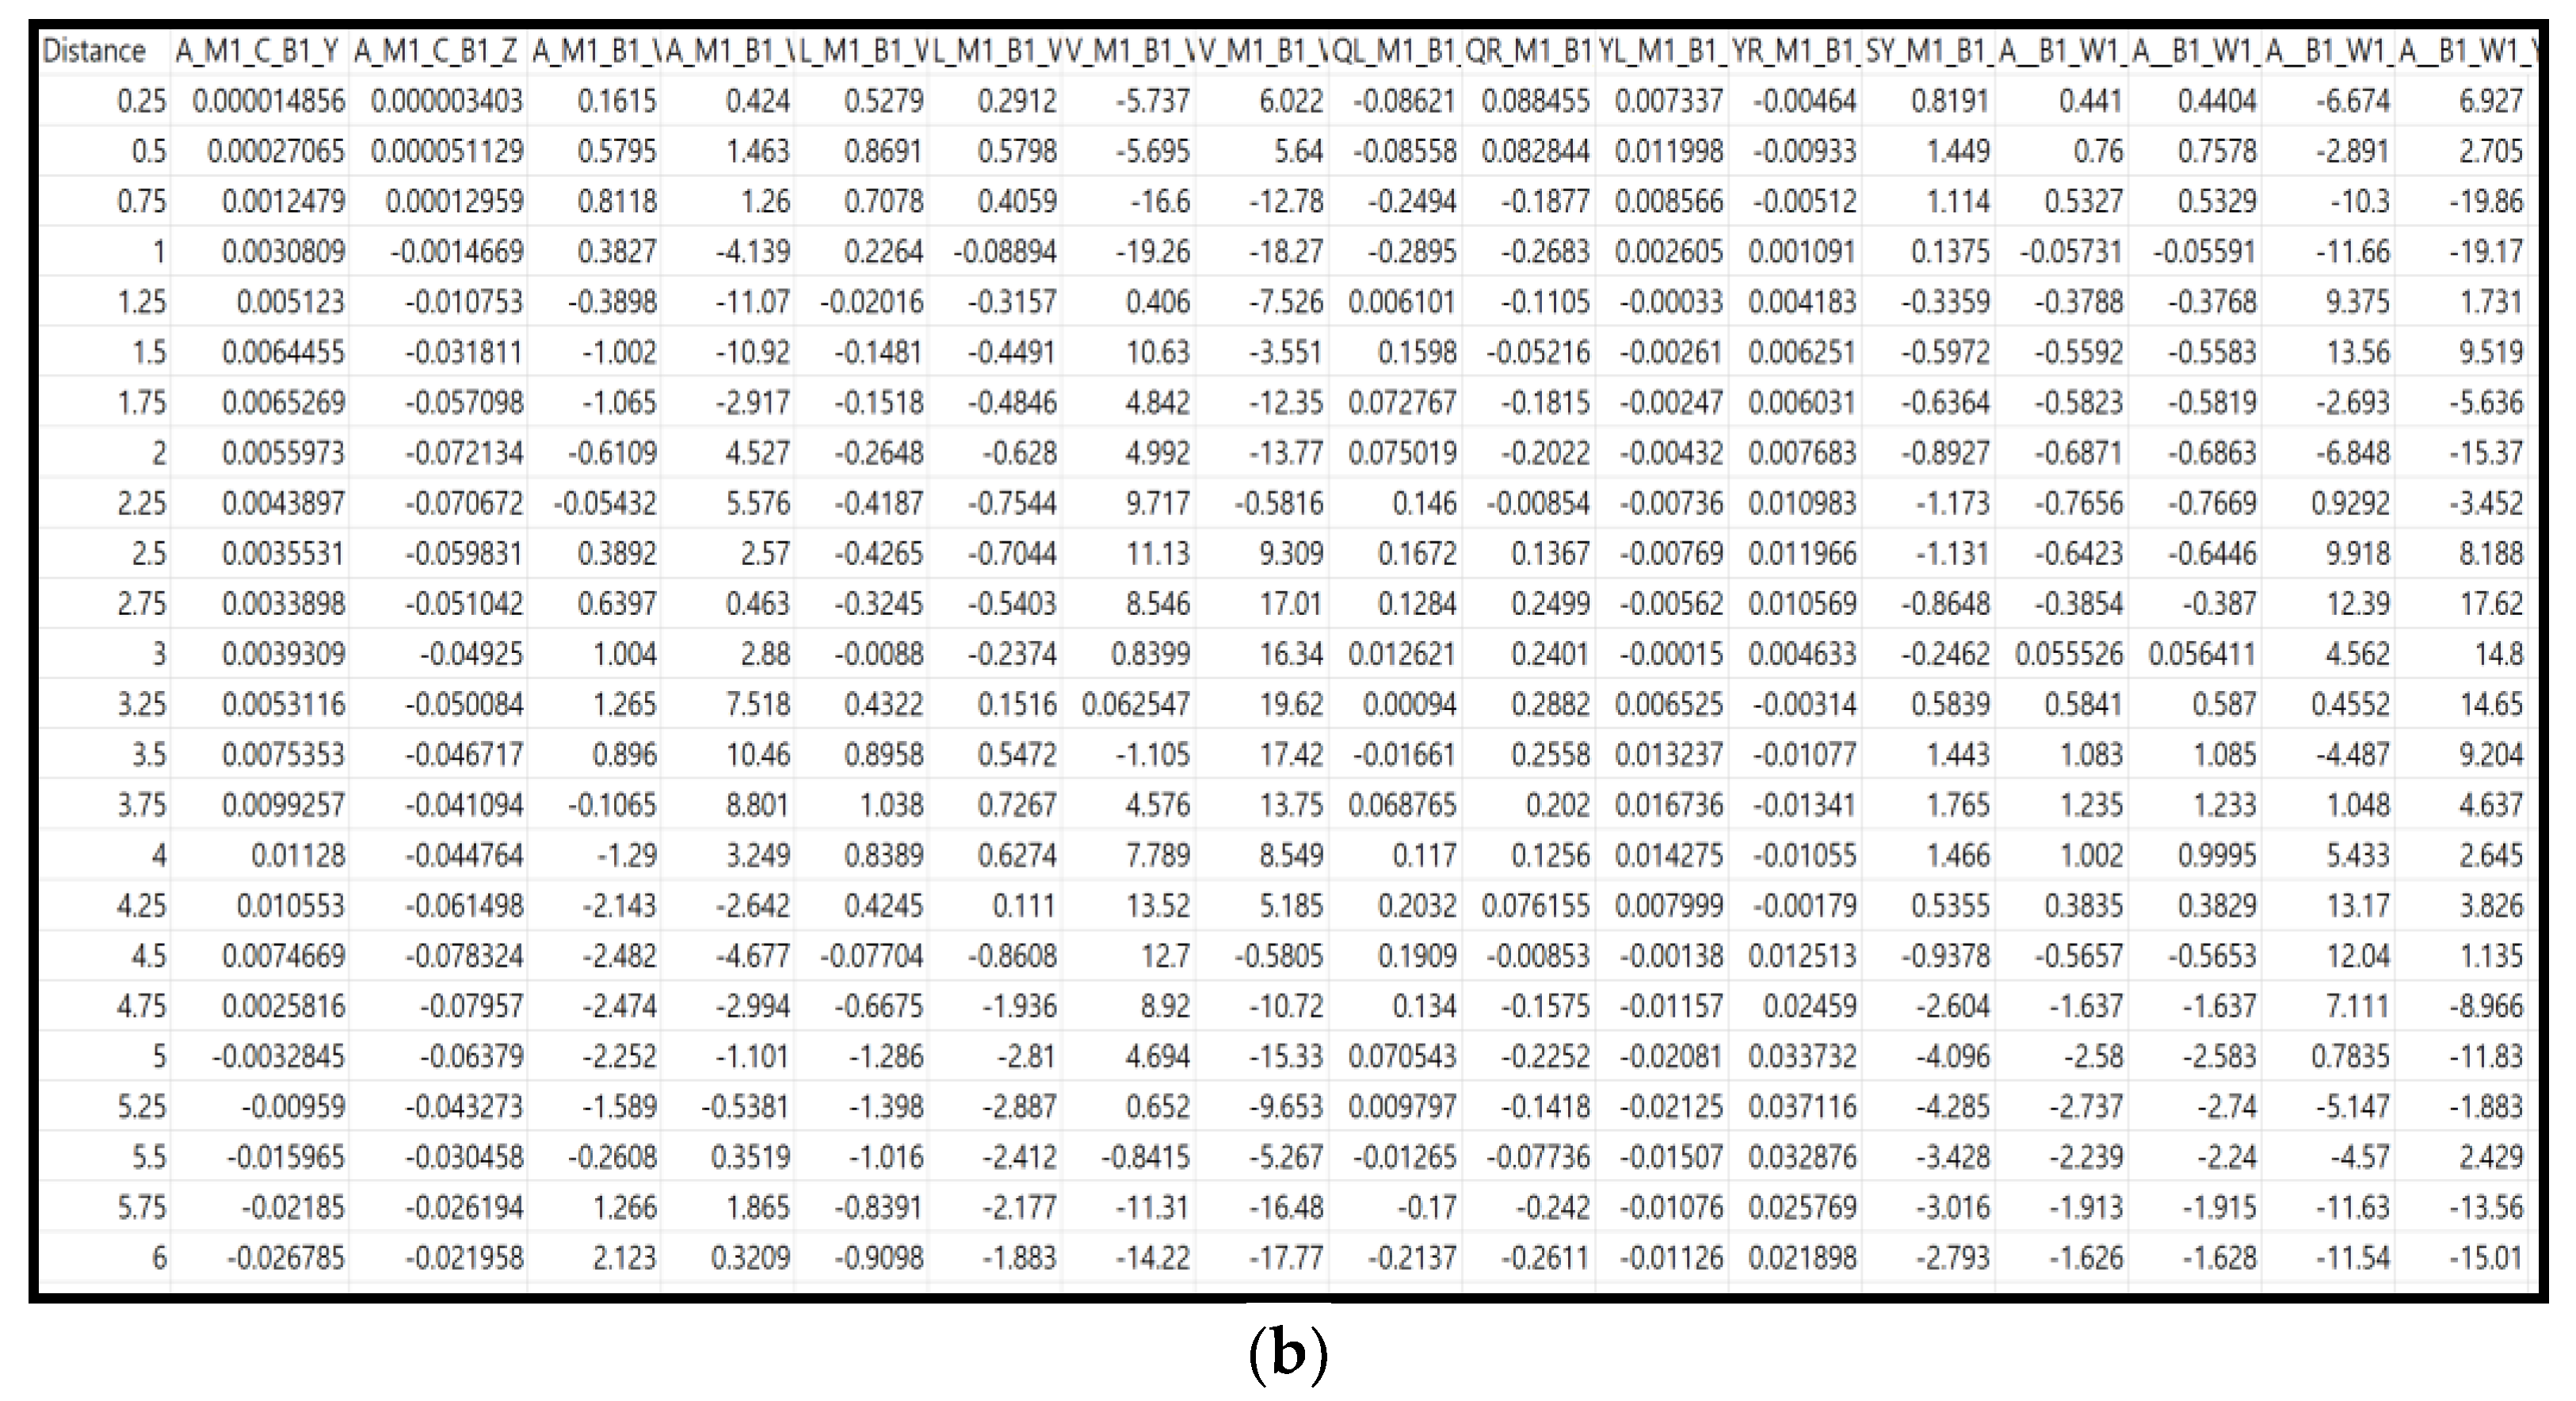
Then, transient analyses were conducted using the modeled HEMU-430X and the rail model. As the output of the analyses, vibrations on the displacements are shown in Figure 4, among other results. Figure 6a shows the vibration signals obtained from the transient analysis. The analysis was conducted using the Vampire Pro software.
As shown in Figure 6b, the model and output data were extracted from the integrated data. These data were used for the diagnosis of a train running safety. The data consisted of 23 attributes, as listed in Table 4.
To check the dependency between each attribute, a statistical correlation test was conducted. As shown in Figure 7a, the red circle indicates a positive relationship between the two attributes, while the blue circle indicates a negative relationship. The circle radius indicates the strength of the relationship.
For instance, Figure 7b shows that there is little correlation (r < 0.01) between the distance (from the starting point to the destination as shown in Figure 5a) and the right wheel derail coefficient (DC). This implies that train running safety is influenced more by a train’s structure and electro-mechanism than by rail conditions.
Table 5 summarizes correlation-relationship of railway model parameters with the other factors.
As summarized in Table 5, there is a very weak relationship between vibrations and railway conditions. However, several factors must be considered in the dynamic analysis of train running safety.
This study applies a deep learning method to analyze and predict train running safety. The following section elaborates on this topic in detail.

4. Real-Time Deep-Learning-Based Train Running Safety Prediction Framework

As mentioned in the previous section, it is inferred that train running safety is influenced more by train mechanisms than by rail conditions. As the development of train-relevant technologies has made it possible to minimize railway impacts on running safety, railway-conditions-based analyses have contributed less to investigations of train running safety.
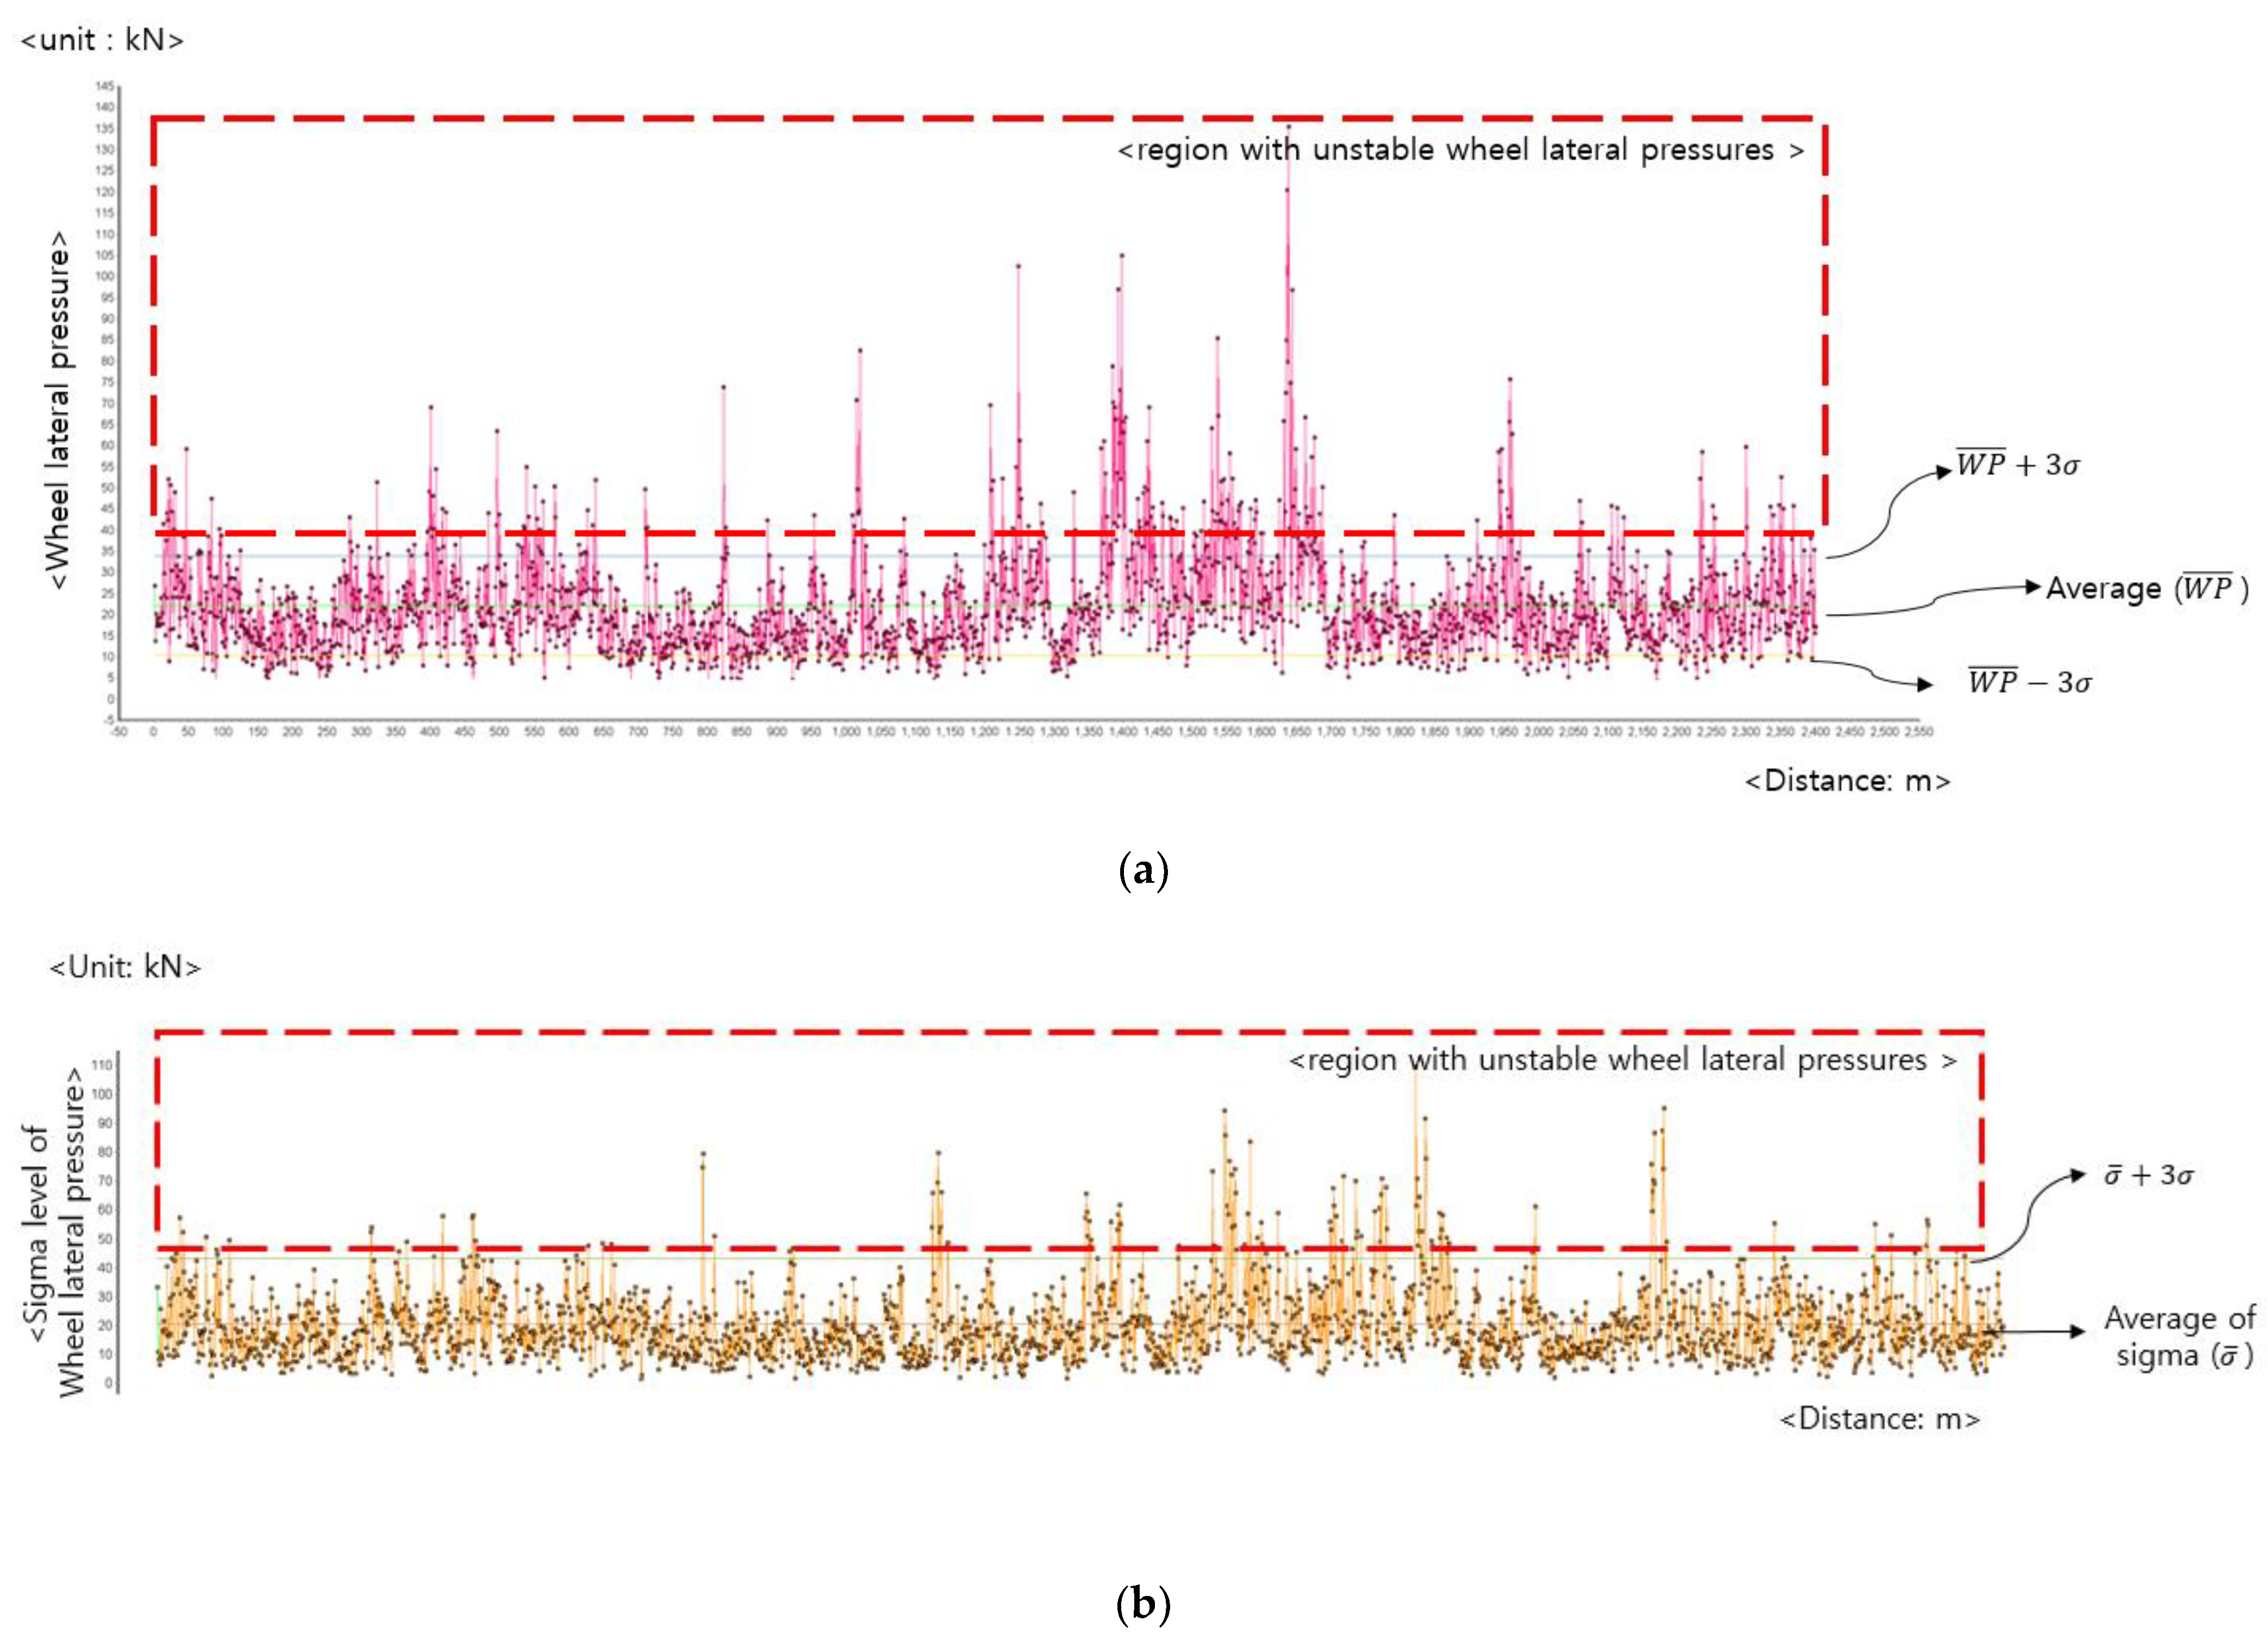
To overcome this issue, this study applied deep learning techniques for the prediction of real-time running safety. As output variables for understanding train running safety, most variables related to the running safety are selected among the 23 attributes: two derail coefficients (left wheel DC and right wheel DC), two-wheel rate of load reduction (left wheel DV and right wheel DV) and wheel lateral pressure. A number of research studies [22,23,24] have pointed out five factors to explain train running safety. For instance, several research studies [24,25,26] considered “Wheel lateral pressure” as one of the key attributes in a train running safety. Figure 8a shows a data plot of the “Wheel lateral pressure” in this transit analysis.
As shown in Figure 8a, several points lie over W P ¯ + 3 σ , where W P ¯ is the average and σ is the standard deviation of wheel lateral pressure. Similarly, Figure 8b shows that some of its deviation is beyond σ ¯ + 3 σ , where σ ¯ is the average deviation. Even though the HEMU-480X model has an advanced architecture, its wheel lateral pressure varies with railway conditions and its mechanism. This indicates that the prediction of wheel lateral pressure can improve its running safety and contribute to the prevention of derailment risks.
This study considers five factors as the output of the applied deep learning framework. Figure 9a shows a general deep neural network architecture with three hidden layers for train running safety.
Equation (4) denotes a general deep learning formula for Figure 9a.
( Y 1 ^ , Y 2 ^ , Y 3 ^ , Y 4 ^ , Y 5 ^ ) = ϕ 1 ( w 1 ϕ 2 ( w 2 ϕ 3 ( ϕ i n p u t l a y e r ( i = 1 18 w i X i ) ) ) )
where w i is a weight vector in the ith layer, and ϕ i is the activation function in the ith layer.
As denoted in (1), Y ^ i , i { 1 , 2 , 3 , 4 , 5 } indicates the train running safety-related output (estimator): Left/right wheel derail coefficients (DCs), left/right wheel rate of load reductions (DVs), and wheel lateral pressure. As input data, X i , i { 1 , 2 , 3 , 4 , 5 , 6 } is the data for railway models, and the other input data are for measured vibrations using transit simulations. While the architecture shown in Figure 9 is a general deep learning architecture, it lacks the reflection of stationary characteristics in train running safety. Figure 9b shows the ARIMA [27] test result of “Right Wheel DC”. Based on the ARIMA (2,1,3) model, a running safety output factor—right wheel DC is proven exemplary as data with stationary characteristics. It is inferred that a well-designed electromechanical transport—a train or a bogie—has inertia. Zhang et al. [28] and Bae et al. [29] considered the inertial forces on train collisions and derailments. This indicates that the estimation of train running safety must consider recurrent data as input. Thus, this study proposes an integrated hybrid framework between a general deep neural network architecture and a recurrent deep learning structure. A hybrid deep learning architecture is an integrated framework with a deep learning framework and other inference/prediction models. This can be another deep learning framework or analytical model. Rahmadani and Lee [30] proposed a hybrid deep learning model with a long short-term memory (LSTM) model and ordinary differential equations (ODE). In this study, a deep neural network (DNN) and a recurrent neural network (RNN) are integrated. Figure 10 shows the proposed hybrid deep learning network for the prediction of train safety. As shown in Figure 10, X i . i N [ 1 , 6 ] ( t ) is the data at time t, and X i , i N [ 7 , 18 ] ( t Δ t ) is the data at time t Δ t . Although Y i , i N [ 1 , 5 ] ( t ) is calculated directly from X i , i N [ 7 , 18 ] ( t ) , the usage of X i , i N [ 7 , 18 ] ( t ) is prohibited from its prediction. For this reason, X i , i N [ 7 , 18 ] ( t Δ t ) is used to estimate Y i , i N [ 1 , 5 ] ( t ) .
Equation (4) is converted into (5) using the proposed hybrid deep learning architecture.
Y i ^ ( t ) i N [ 1 , 5 ] = f ( X i ( t ) i N [ 1 , 18 ] ,   Y i ^ ( t Δ t ) i N [ 1 , 5 ] , Y i ^ ( t k Δ t ) i N [ 1 , 5 ] )  
where N is the set of natural numbers, and k = predefined constant
As denoted in (5), a nonlinear function, f , is a general deep learning architecture, and the relationship between Y i ^ ( t ) i N [ 1 , 5 ] and ,   Y i ^ ( t Δ t ) i N [ 1 , 5 ] is derived using a recurrent deep learning architecture. The proposed hybrid deep learning architecture has two different types of weights: instant weight ( W i , j , t ) and transitional weight ( W t , t Δ t ). W i , j , t is the instant weight in the DNN architecture at time t, from the ith layer to the jth layer. A transitional weight, W t , t Δ t is the weight of Y i ^ ( t Δ t ) i N [ 1 , 5 ] at time t Δ t . To update both the weights, the energy function (E) is defined in (6).
E = 1 2 i = 1 5 ( Y i Y i ^ ) 2
where Y i is the ith transit analysis result.
A new instant weight ( W i , j , t ) is updated using (7).
W i , j , t = W i , j , t + η 1 E W i , j , t    
where η 1 is a learning rate for an instant weight.
As denoted in (8), E W i , j , t is calculated using a backpropagation method.
E W i , j , t = E v k , t ϕ ( v j , t ) w j , k , t I i , t  
v k , t is the sum of the weight and input at the jth layer at time t, and I i , t is the input vector at the ith layer. Transitional weight is updated using (9).
W t , t Δ t = W t , t Δ + η 2 E W m , n , t Δ t   ϕ ( v m , t Δ t ) w m , t Δ t I n , t Δ t
where,   w m , t Δ t is the weight in the output layer at time t Δ t .
The proposed architecture considers the modeling input of the railway model and the measured vibrations. Moreover, the inertial characteristics of a train structure were embedded in a hybrid deep learning network. The following section shows the effectiveness of the proposed hybrid deep-learning network using transit simulations and numerical analyses.

5. Verification and Analysis of Hybrid Deep-Learning Prediction Framework for Train Running Safety

This section shows the performance of the proposed hybrid deep learning prediction framework for the indices of train running safety. To prove the effectiveness of the proposed framework, a comparison with general deep learning without recurrent data is provided. Table 6 summarizes both learning architectures for predicting a train’s running safety. The layer architecture and learning parameters are chosen with experimental analyses and tests.
The overall dataset is divided into two types: a training set and a test set with an 8:2 ratio. As this is a prediction framework, the comparisons are analyzed with both criteria: the root mean squared error (RMSE) and loss.
RMSE ( Y i ) = j = 1 n ( Y i , j Y i , j ^ ) 2 n
where n = size of test set.
Loss is calculated using (6). Figure 11a,b show the RMSE and loss of the general deep learning, respectively.
As shown in Figure 11a,b, the DNN architecture that only considers X i , i N [ 1 , 6 ] ( t ) and X i , i N [ 7 , 18 ] ( t Δ t ) has improved less as the learning progresses. This indicates that the prediction of the train running safety requires the use of recurrent data. Figure 11c,d shows that the proposed hybrid deep learning network has a better learning performance. While the deep learning framework has an RMSE of 2.0772, the proposed hybrid deep learning has an RMSE of 0.42165.
Figure 12a shows the prediction result between the “actual wheel lateral pressure” and “estimated values using the DNN” using a selected test set.
Figure 12b shows the prediction results between the actual pressure ( Y 5 ) and predicted estimation ( Y 5 ^ ) using the hybrid deep learning framework. As shown in Figure 11, the proposed framework has more accurate prediction than a DNN without the use of recurrent data.
To investigate the performance of the proposed framework, a number of existing frameworks were tested with the proposed framework. Table 7 lists the architectures of the existing architectures and the proposed framework.
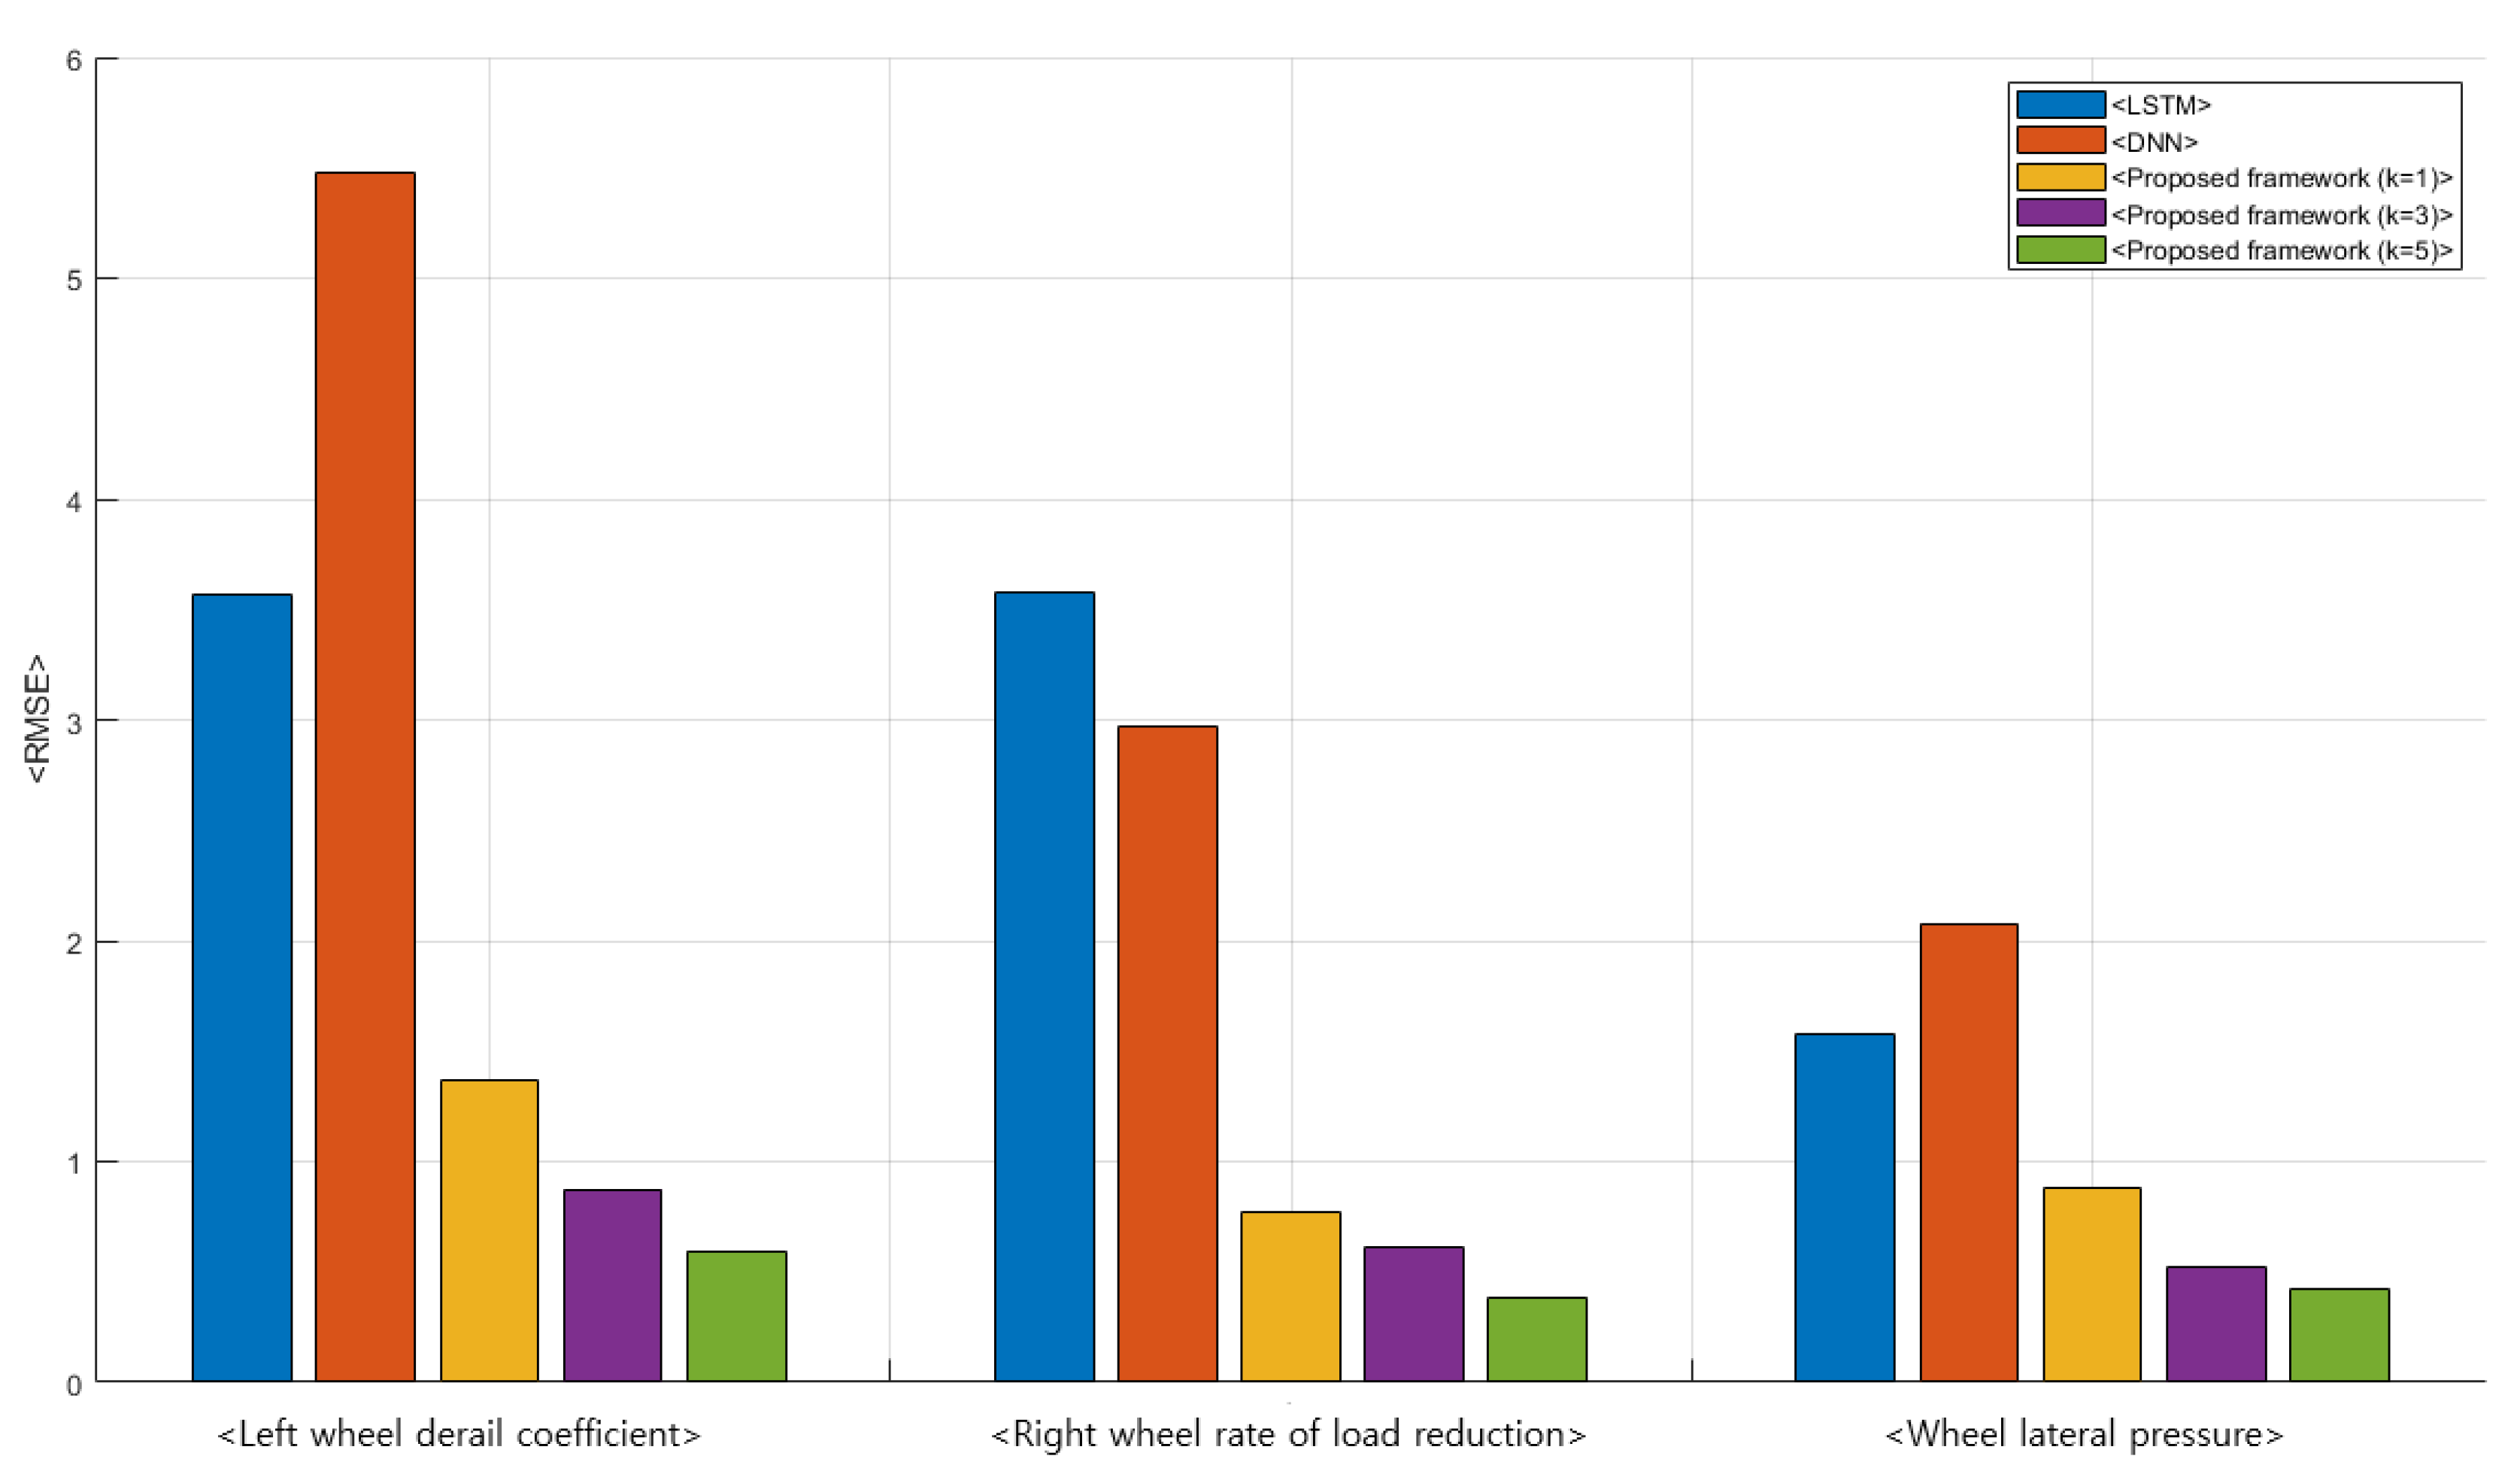
The proposed framework was tested using different recurrent periods ( k = 1 , 3 , 5 ) with other existing methods. Figure 12 shows the comparisons of the testing results of “Left wheel derail coefficient (DC, Y 1 )”, “right wheel rate of load reduction (DV, Y 4 )”, and “Wheel lateral framework ( Y 5 )”.
As shown in Figure 13, the proposed framework shows the best performance compared to a DNN without recurrent data and a recurrent neural network (LSTM). Moreover, it has been proven that the recurrent data period (k) is an important factor for the prediction of train running safety.
This section describes the effectiveness of the proposed hybrid deep learning framework for train running safety. These analyses explain that recurrent data are related to the inertial mechanism of a train and these have to be considered for its prediction.

6. Conclusions and Further Study

Train running safety is one of the key criteria for evaluating advanced high-speed trains and bogies. While several existing relevant research studies and applications have focused on its measurement and monitoring, its prediction has received comparatively lesser attention. This study proposes a new and effective train running safety prediction framework using a deep learning technique.
As several deep learning architectures have been proposed, a hybrid deep learning architecture using recurrent data is proposed in this study. As output factors to determine train safety, five decision variables are considered: Left/right wheel derail coefficients, left/right wheel rate of load reduction, and wheel lateral pressure. These five factors are deeply related to a train’s running safety. To predict its running safety, six railway conditions and twelve measured vibration-based signals are considered. However, these input variables lack a well-defined mechanism for advanced train running safety. It is inferred from the examinations that advanced trains and bogies are influenced by their inertial structures as well as by rail conditions and outer environments.
Therefore, the proposed framework considers the recurrent data of output factors as additional inputs. Then, past data of the output decision variables are added to the input vectors for the proposed hybrid deep learning network. As the proposed architecture shares the characteristics of a general DNN and a RNN, it is classified as a hybrid deep learning framework to predict real-time train running safety. To prove the effectiveness of the proposed framework, we conducted numerical analyses using the transit simulation and the actual train-railway model. These analyses prove that the proposed hybrid deep learning framework has better prediction performance than LSTM and DNN architectures.
In future studies, the proposed framework can be applied to advanced train control to decrease the trains’ derailing risks. As train derailments may cause tremendous hazards to passengers and cargo, the advanced risk prediction of trains and bogies can prevent possible traffic accidents. For this purpose, the proposed framework can be integrated with real-time train control. In addition, another recurrent deep learning mechanism can be considered for a better prediction ability. This study proposes a new and effective hybrid deep learning framework to predict train running safety. The consideration of railway conditions, vibration signals, and usages of recurrent data helps in better prediction of train running safety.

Author Contributions

H.L. (Hyunsoo Lee) and S.-Y.H. conceptualized the framework and developed the methodologies; H.L. (Hyunsoo Lee) implemented the framework; K.P., H.L. (Hoyoung Lee) and T.K. supported the data and validated the framework and the implementation; H.L. (Hyunsoo Lee) supervised the overall research processes and wrote the manuscript; S.-Y.H. reviewed and edited the manuscript. All authors have read and agreed to the published version of the manuscript.

Funding

This research was supported by The Basic Science Research Program through the National Research Foundation of Korea (NRF) funded by the Ministry of Education, S. Korea (grant number: NRF-2021R1A2C1008647) and by a research grant from the R&D Program of the Korea Railroad Research Institute (KRRI), Republic of Korea.

Institutional Review Board Statement

Not applicable.

Informed Consent Statement

Not applicable.

Data Availability Statement

Data sharing is not applicable to this article.

Conflicts of Interest

The authors declare no conflict of interest.

References

  1. UIC. Testing and Approval of Railway Vehicles from the Point of View of Their Dynamic Behaviour-Safety-Track Fatigue-Ride Quality, 4th ed.; International Union of Railways: Paris, France, 2009. [Google Scholar]
  2. BSI. BS EN 14067-1, Railway Applications- Aerodynamics-Part1: Symbols and Units, 3rd ed.; British Standard Institution: London, UK, 2011. [Google Scholar]
  3. BSI. BS EN 14067-6:2018-TC Railway Applications-Aerodynamics: Requirements and Test Procedures for Cross Wind Assessment, 1st ed.; British Standard Institution: London, UK, 2020. [Google Scholar]
  4. KRRI. KRTS-VE-Part31-2014(R1) Technical Specifications for High Speed Railway Vehicles, 1st ed.; Korea Railroad Research Institute: Uiwang, Korea, 2014. [Google Scholar]
  5. KRRI. KRTS-VE-Part21-2015(R1) Technical Specifications for High Speed Railway Vehicles, 1st ed.; Korea Railroad Research Institute: Uiwang, Korea, 2015. [Google Scholar]
  6. BSI. EN 14363:2016 Railway Applications—Testing and Simulation for the Acceptance of Running Characteristics of Railway Vehicles-Running Behavior and Stationary Tests, 1st ed.; British Standard Institution: London, UK, 2016. [Google Scholar]
  7. UIC. UIC Code 518 OR Testing and Approval of Railway Vehicles from the Point of View of Their Dynamic Behavior-Safety-Track Fatigue-Ride Quality, 1st ed.; Worldwide Railway Organisation: Paris, France, 2003. [Google Scholar]
  8. KRRI. KRTS-VE-Part51-2017(R1) Technical Specifications for High Speed Railway Vehicles, 1st ed.; Korea Railroad Research Institute: Uiwang, Korea, 2017. [Google Scholar]
  9. Arvidsson, T.; Andersson, C.; Karoumi, R. Train running safety on non-ballasted bridges. Int. J. Rail Transp. 2018, 7, 1–22. [Google Scholar] [CrossRef] [Green Version]
  10. Diang, Y.; Sun, P.; Wang, G.; Song, Y.; Wu, L.; Yue, Q.; Li, A. Early-warning method of train running safety of a high-speed railway bridge based on transverse vibration monitoring. Shock Vib. 2015, 2015, 1–9. [Google Scholar] [CrossRef] [Green Version]
  11. Choi, J.; Kim, J.; Chung, J.; Lee, S. Evaluation of Training running safety for direct fixation concrete track on light rapid transit. J. Korean Soc. Saf. 2017, 32, 41–46. [Google Scholar]
  12. Jang, S.; Yang, S. Assessment of train running safety, ride comfort and track serviceability at transition between floating slab track and conventional concrete track. J. Korean Soc. Railw. 2012, 15, 48–61. [Google Scholar] [CrossRef] [Green Version]
  13. Kim, M.K.; Eom, B.G.; Lee, H.S. Running Safety Analysis of Railway Vehicle Passing through Curve Depending on Rail Inclination Change. Korean Soc. Noise Vib. Eng. 2013, 23, 199–208. [Google Scholar] [CrossRef] [Green Version]
  14. Oh, J.T.; Kwon, T.S. A Study on the Assessment of Derailment Factor for the Enhancement of Train Running Safety. In Proceedings of the Spring Conference & Annual Meeting of the Korean Society for Railway, Changwon, Korea, 6 October 2000; Volume 2000, pp. 210–217. [Google Scholar]
  15. Seo, S.; Park, J.H.; Min, S.H. Studies on Safety Criteria for Trains Running on Floating Railway Bridges. Advances in Structural Engineering. Available online: https://journals.sagepub.com/doi/abs/10.1177/1369433220980524 (accessed on 30 March 2021).
  16. Zhang, X.; Zhou, S.; Di, H.; He, C. A semi-analytical model of the train-floating slab track-tunnel-soil system considering the non-nonlinear wheel/rail contact. J. Rail Rapid Transit 2018, 232, 2063–2078. [Google Scholar] [CrossRef]
  17. Alawad, H.; Kaewunruen, S.; An, M. A deep learning approach towards railway safety risk assessment. IEEE Access 2020, 8, 102811–102832. [Google Scholar] [CrossRef]
  18. Yang, C.; Sun, Y.; Ladubec, C.; Liu, Y. Developing machine learning-based models for railway inspection. Appl. Sci. 2021, 11, 1–15. [Google Scholar]
  19. He, K.; Zhang, X.; Ren, S.; Sun, J. Deep residual learning for image recognition. In Proceedings of the 2016 IEEE Conference on Computer Vision and Pattern Recognition, Las Vegas, NV, USA, 27–30 June 2016; pp. 1063–6919. [Google Scholar]
  20. Lee, H.; Han, S.; Park, K. Generative adversarial network-based missing data handling and remaining useful life estimation for smart train control and monitoring systems. J. Adv. Transp. 2020, 2020, 1–15. [Google Scholar]
  21. Vampire Pro. Available online: https://www.ensco.com/rail/vampire (accessed on 10 January 2021).
  22. Cherchas, D.B. Determination of railway wheel climb probability based on the derailment coefficient. J. Frankl. Inst. 1981, 312, 31–40. [Google Scholar] [CrossRef]
  23. Wang, P.; Wang, J.; Ma, X.; Ma, D.; Xu, J.; Q, Y. Theoretical 3D model for Quasistatic critical derailment coefficient of railway vehicles and a simplified formula. Math. Probl. Eng. 2017, 2018, 1–14. [Google Scholar] [CrossRef] [Green Version]
  24. Wang, K.; Huang, C.; Zhai, W.; Liu, P.; Wang, S. Progress on wheel-rail dynamic performance of railway curve negotiation. J. Traffic Transp. Eng. 2014, 1, 209–220. [Google Scholar] [CrossRef] [Green Version]
  25. Vollebregt, E. Detailed wheel/rail geometry processing with the conformal contact approach. Multibody Syst. Dyn. 2020, 2020, 1–33. [Google Scholar] [CrossRef]
  26. Zhou, L.; Brunskill, H.; Pletz, M.; Daves, W.; Scheriau, S.; Lewis, R. Real-time measurement of dynamic wheel-rail contacts using ultrasonic reflectometry. J. Tribol. 2019, 141, 1–9. [Google Scholar] [CrossRef]
  27. Jo, Y.; Lee, H. Electricity demand forecasting framework using modified attention-based LSTM. J. Korean Inst. Intell. Syst. 2020, 30, 242–250. [Google Scholar] [CrossRef]
  28. Zhang, Q.; Zhuang, Y.; Wei, Y.; Jiang, H.; Yang, H. Railway safety risk assessment and control optimization method based on FTA-FPN: A case study of Chinese high-speed railway station. J. Adv. Transp. 2020, 2020, 1–11. [Google Scholar] [CrossRef]
  29. Bae, H.; Yun, K.; Moon, J.; Lim, N. Impact force evaluation of the derailment containment wall for high-speed train through a collision simulation. Adv. Civ. Eng. 2018, 2018, 1–14. [Google Scholar] [CrossRef] [Green Version]
  30. Rahmadani, F.; Lee, H. Hybrid deep learning-based epidemic prediction framework of COVID-19: South Korea case. Appl. Sci. 2020, 10, 8539. [Google Scholar] [CrossRef]
Figure 1. Forces between train wheels and rail.
Machines 09 00130 g001
Figure 2. Allowance of dynamic running safety: (a) Allowance per derailment coefficient (DC); (b) allowance of running safety per dynamic vertical power (DV).
Machines 09 00130 g002
Figure 3. HEMU-430X as a train model for running safety measurements.
Machines 09 00130 g003
Figure 4. Displacement of vibrations in HEMU-430X and the vibration axis.
Machines 09 00130 g004
Figure 5. The target railway and its rail model: (a) The target real railway; (b) track distance plot of the modelled railway.
Machines 09 00130 g005aMachines 09 00130 g005b
Figure 6. Vibrations from the transient analysis using the modeled railway and HEMU-430X: (a) Vibration plot; (b) model data and output data using the transient analysis.
Machines 09 00130 g006aMachines 09 00130 g006b
Figure 7. Statistical correlation test among 28 attributes. (a) Correlation test between attributes. (b) Correlation between “Railway point” and “Right wheel derail coefficient (DC)”.
Machines 09 00130 g007aMachines 09 00130 g007b
Figure 8. Data plot of the “Wheel lateral pressure” from a transient analysis: (a) Data plot of wheel lateral pressure; (b) standard deviation plot of wheel lateral pressure.
Machines 09 00130 g008
Figure 9. A general deep neural network architecture and stationary characteristics of output variables. (a) A general deep neural network architecture. (b) Stationary characteristics of output variables in train running safety.
Machines 09 00130 g009
Figure 10. The proposed hybrid deep learning framework for the prediction of train running safety.
Machines 09 00130 g010
Figure 11. Comparisons between both frameworks: (a) RMSE using the DNN model; (b) loss using the DNN model; (c) RMSE using the proposed hybrid deep learning framework; (d) loss using the proposed hybrid deep learning framework.
Machines 09 00130 g011
Figure 12. Prediction results using the test set: (a) Prediction results using the DNN model; (b) prediction results using the DNN model.
Machines 09 00130 g012aMachines 09 00130 g012b
Figure 13. Test results and comparisons including the proposed framework.
Machines 09 00130 g013
Table 1. Nomenclature for a train running safety.
SymbolTermsUnit
LLateral forcekN
VVertical forcekN
NNormal forcekN
α Contact angle
(Flange contact angle)
°
T Y Tangential forcekN
YLateral force per a wheel axiskN
PAxle loadkN
μ Friction coefficient μ R (R is real number)
Δ V Gap between consecutive vertical forceskN
Table 2. Static criteria for running safety in South Korea.
ClassificationMeasurementsUnitCriteria
Train running safetyRate of wheel load reduction
(DV)
R [ 0 , 1 ] ,
R is a real number
DV 0.13
Derailment coefficient
(DC)
R DC 0.8
Lateral displacement of rail head
(LD)
mm LD 4
Table 3. Running safety-related existing research studies and applications.
Existing Research StudiesCharacteristicsUsed MethodsIssues
Arvidsson et al.
[9]
- Running safety simulation under non-ballasted bridge environments
- Simulation analysis of running safety and passenger comport
- Simulation using 2D train-track-bridge model- Predefined model-based simulation studies
Ding, et al. [10]- Early warning framework with vibrations of an express train- Nonlinear equation-based regress model- Monitoring-based early warning framework
Choi, et al.
[11]
- Light rail (LRT)-based vibration measurement on real running environment- Real measurement- Limited in small distance-measurement
Jang and Yang
[12]
- Numerical simulation—Consideration on transition between floating slab track and concrete track- DIASTARS-based CAE simulation- Limited experimental condition
Kim, et al.
[13]
- CAE-based simulation studies- Input of “real railway models and conditions”- CAE-based analysis
Oh and Kwon
[14]
- Measure on real train
- Exemplary proof of DV’s importance on running safety
- Vibration measurement on trains with different weights- Single factor (weight)-based experiment
Seo, et al.
[15]
- Simulation study- Relationship between train wheels and floating railway bridges- Modeling of floating railway bridges
- Nonlinear equation-based wheel motion model
- Nonlinear equation-based simulation model
Zhang, et al. [16]- 3D simulation model of train-induced vibration of a floating slab- Train/environment model-based simulation- Model-based simulation study
Table 4. Train safety simulation data and attributes.
ClassificationAttributeUnitData Source
Modeling Input Form Real MeasurementGeneration Using Transient Analysis
Railway model dataRailway point (distance)mmO-
Cross level irregularity (cant)mmO-
Curvature irregularity1/kmO-
Lateral irregularitymmO-
Vertical irregularitymmO-
Gauge variationmmO-
Train structure/
simulation data
Bogie upper frame lateral vibration m / s 2 -O
Bogie upper frame vertical vibration m / s 2 -O
Bogie upper body lateral vibration m / s 2 -O
Bogie upper body vertical vibration m / s 2 -O
Left wheel lateral weightkg-O
Right wheel lateral weightkg-O
Left wheel vertical weightkg-O
Right wheel vertical weightkg-O
Left wheel derail coefficient (DC)Real number-O
Right wheel derail coefficient (DC)Real number-O
Left wheel rate of load reduction (DV)Real number-O
Right wheel rate of load reduction (DV)Real number-O
Body frame lateral pressure
(body frame lateral forces)
kN-O
Left axle box lateral vibration m / s 2 -O
Right axle box lateral vibration m / s 2 -O
Left axle box vertical vibration m / s 2 -O
Right axle box vertical vibration m / s 2 -O
Wheel lateral pressure
wheel lateral forces)
kN-O
Table 5. Correlation-relationship of several attributes with the other factors.
Attribute
(Railway Model Parameters)
Relationships with Train Structure and Mechanism
Railway point (distance)- Little relationship (r* < 0.01)
Cant- Weak relationship: Left axle box vertical vibration
- little relationship with the other factors
Curvature irregularity- Little relationship (r* < 0.01)
Lateral irregularity- Strong relationship: Bogie upper frame lateral vibration
- Weak relationship: Right wheel lateral weight,
Right wheel DV, wheel lateral pressure
- little relationship with the other factors
Vertical irregularity- Strong relationship: Bogie upper frame vertical vibration
- Weak relationship: Left/right wheel vertical weight,
Left/right wheel DC,
Left/right axle box vertical vibration
- little relationship with the other factors
Gauge variation- Weak relationship: Wheel lateral pressure
- little relationship with the other factors
r*: Correlation Coefficient.
Table 6. Learning architectures for train running safety prediction.
ClassificationA DNN
without Recurrent Data
The Proposed Hybrid Network
Input X i , i N [ 1 , 6 ] ( t ) ,
X i , i N [ 7 , 18 ] ( t )
X i , i N [ 1 , 18 ] ( t ) ,
X i , i N [ 7 , 18 ] ( t )
Y ^ j   ( t k Δ t ) j N [ 1 , 5 ] , k N [ 1 , 5 ]
Output Y ^ j   ( t ) j N [ 1 , 5 ]
Layer architecture4 hidden layers
Number of hidden nodes in each hidden layer
= {40,30,15,5}
4 hidden layers
Number of hidden nodes in each hidden layer = {50,30,15,5}
Activation functionsSigmoid/ReLU
Sigmoid: 1 1 + e x
RelU: max(0,x)
Learning parametersEpoch = 5000/optimization method = ADAM ()
Learning   rate   ( η )   = 0.001
Dropout rate = 0.2
Δ t : one unit time (distance between t and Δ t = 25 cm).
Table 7. Testing architectures of several prediction frameworks.
ClassificationLSTMDNN
Using
The Proposed Framework
Input Y ^ j   ( t k Δ t ) j N [ 1 , 5 ] , k N [ 1 , 5 ]
Refer Table 5Refer Table 5
Output Y ^ j   ( t ) j N [ 1 , 5 ]
ParametersNumber of hidden dimensions = 20
State activation function = sigmoid
Gate activation function = tanh
Learning rate ( η ) = 0.001
Publisher’s Note: MDPI stays neutral with regard to jurisdictional claims in published maps and institutional affiliations.