Biomarker Development for Metastatic Renal Cell Carcinoma: Omics, Antigens, T-cells, and Beyond


Abstract
:
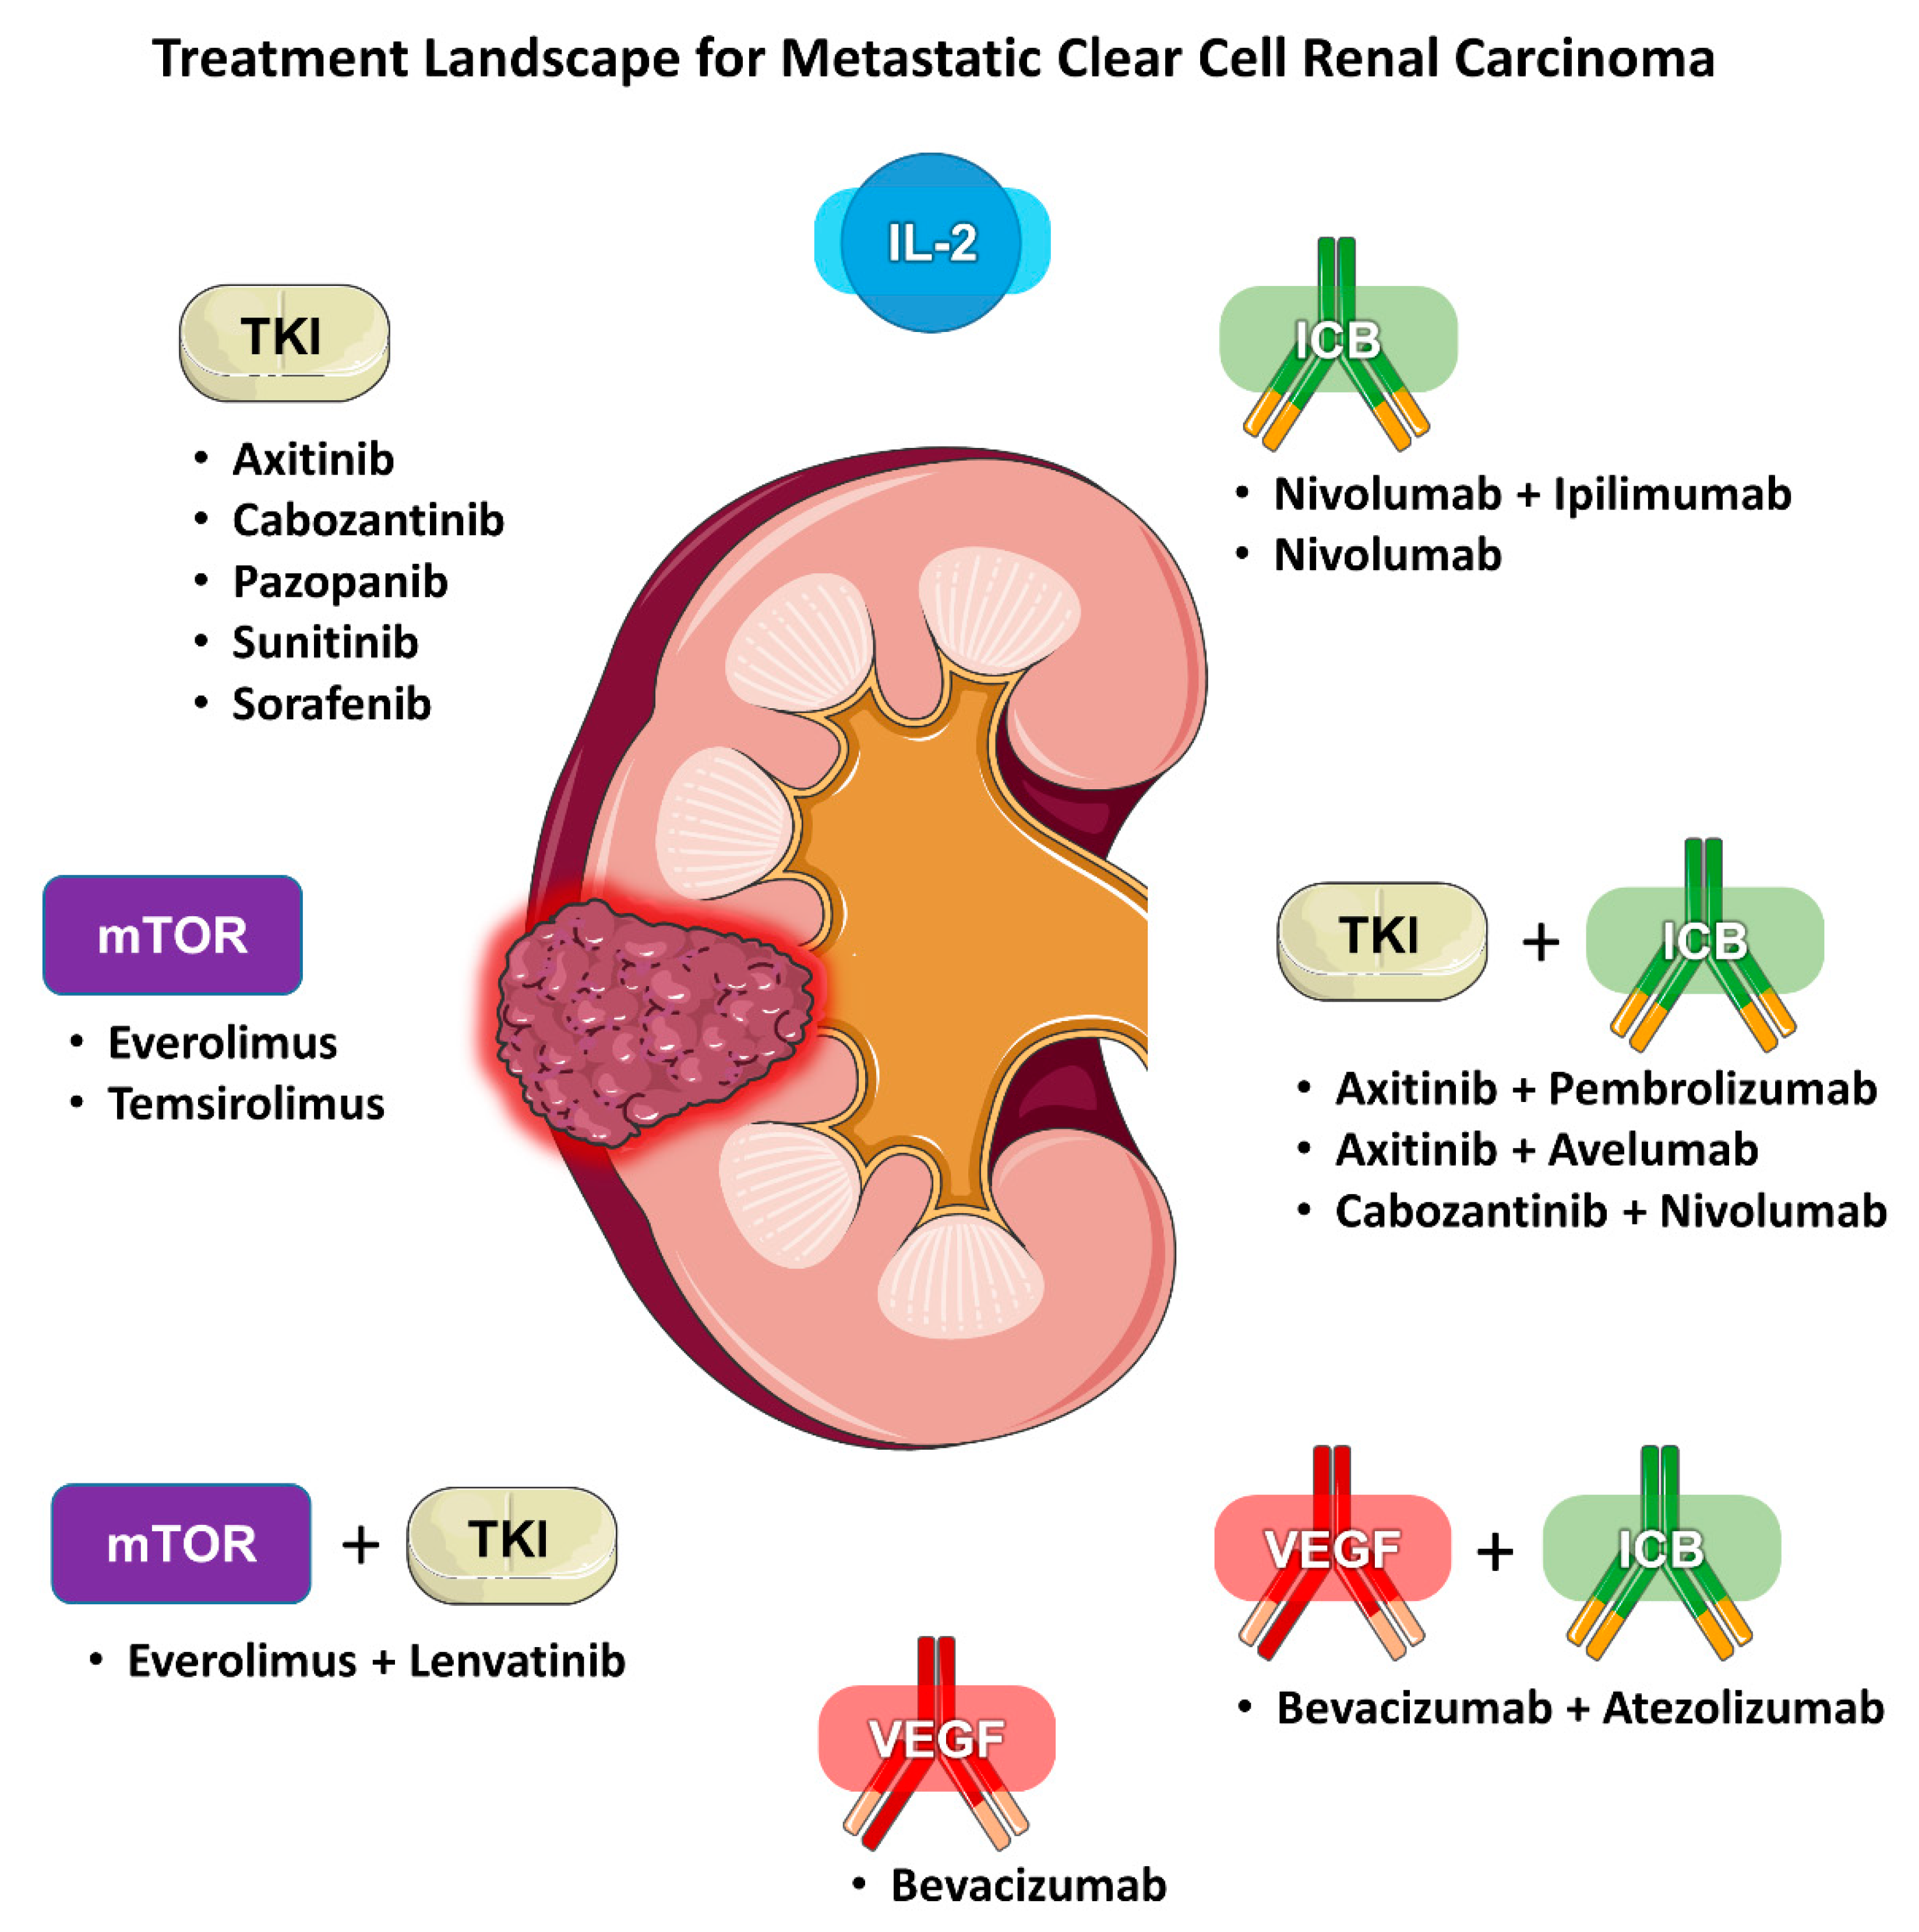
1. Introduction
2. Biomarkers for Angiogenesis Inhibitors
2.1. International Metastatic Renal Cell Carcinoma Database Consortium Score
2.2. Genomic Alterations
2.3. Targets of Tumor-Driven Angiogenesis
2.4. Gene Expression Signatures
2.5. Association of Angiogenesis Signatures with Traditional Biomarkers
2.6. Pure VEGF Antagonism vs. Combination Anti-VEGF/ICB Therapy
2.7. Predictive Value of Trends in Angiogenesis-Related Biomarkers during Treatment
3. Biomarkers for Immunotherapy
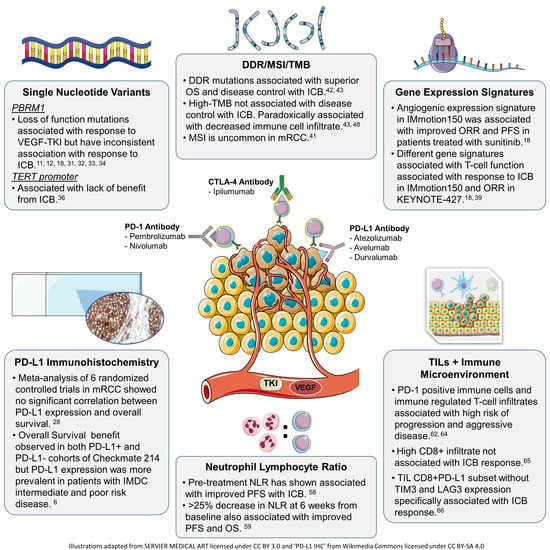
3.1. PD-L1 Expression
3.2. Genomic Markers
3.2.1. PBRM1 Mutations
3.2.2. TERT Promoter Mutations
3.2.3. Multi-gene Expression Signatures
3.2.4. DNA Damage Repair Mutations, Microsatellite Instability, and Tumor Mutational Burden
3.3. Analysis of Immune Cells
3.3.1. Neutrophil Lymphocyte Ratio
3.3.2. Tumor Infiltrating Lymphocytes and Immune Microenvironment
4. Conclusions
Author Contributions
Funding
Conflicts of Interest
References
- Heng, D.Y.C.; Xie, W.; Regan, M.M.; Warren, M.A.; Golshayan, A.R.; Sahi, C.; Eigl, B.J.; Ruether, J.D.; Cheng, T.; North, S.; et al. Prognostic factors for overall survival in patients with metastatic renal cell carcinoma treated with vascular endothelial growth factor-targeted agents: Results from a large, multicenter study. J. Clin. Oncol. 2009, 27, 5794–5799. [Google Scholar] [CrossRef]
- Heng, D.Y.C.; Xie, W.; Regan, M.M.; Harshman, L.C.; Bjarnason, G.A.; Vaishampayan, U.N.; Mackenzie, M.; Wood, L.; Donskov, F.; Tan, M.H.; et al. External validation and comparison with other models of the International Metastatic Renal-Cell Carcinoma Database Consortium prognostic model: A population-based study. Lancet Oncol. 2013, 14, 141–148. [Google Scholar] [CrossRef] [Green Version]
- Ko, J.J.; Xie, W.; Kroeger, N.; Lee, J.; Rini, B.I.; Knox, J.J.; Bjarnason, G.A.; Srinivas, S.; Pal, S.K.; Yuasa, T.; et al. The International Metastatic Renal Cell Carcinoma Database Consortium model as a prognostic tool in patients with metastatic renal cell carcinoma previously treated with first-line targeted therapy: A population-based study. Lancet Oncol. 2015, 16, 293–300. [Google Scholar] [CrossRef]
- Dudani, S.; Gan, C.L.; Wells, C.; Bakouny, Z.; Dizman, N.; Pal, S.K.; Wood, L.; Kollmannsberger, C.K.; Szabados, B.; Powles, T.; et al. Application of IMDC criteria across first-line (1L) and second-line (2L) therapies in metastatic renal-cell carcinoma (mRCC): New and updated benchmarks of clinical outcomes. J. Clin. Oncol. 2020, 38, 5063. [Google Scholar] [CrossRef]
- Plimack, E.R.; Rini, B.I.; Stus, V.; Gafanov, R.; Waddell, T.; Nosov, D.; Pouliot, F.; Soulieres, D.; Melichar, B.; Vynnychenko, I.; et al. Pembrolizumab plus axitinib versus sunitinib as first-line therapy for advanced renal cell carcinoma (RCC): Updated analysis of KEYNOTE-426. J. Clin. Oncol. 2020, 38, 5001. [Google Scholar] [CrossRef]
- Motzer, R.J.; Tannir, N.M.; McDermott, D.F.; Arén Frontera, O.; Melichar, B.; Choueiri, T.K.; Plimack, E.R.; Barthélémy, P.; Porta, C.; George, S.; et al. Nivolumab plus Ipilimumab versus Sunitinib in advanced renal-cell carcinoma. N. Engl. J. Med. 2018, 378, 1277–1290. [Google Scholar] [CrossRef]
- Kondo, K.; Yao, M.; Yoshida, M.; Kishida, T.; Shuin, T.; Miura, T.; Moriyama, M.; Kobayashi, K.; Sakai, N.; Kaneko, S.; et al. Comprehensive mutational analysis of the VHL gene in sporadic renal cell carcinoma: Relationship to clinicopathological parameters. Genes Chromosom. Cancer 2002, 34, 58–68. [Google Scholar] [CrossRef]
- Kim, B.J.; Kim, J.H.; Kim, H.S.; Zang, D.Y. Prognostic and predictive value of VHL gene alteration in renal cell carcinoma: A meta-analysis and review. Oncotarget 2017, 8, 13979–13985. [Google Scholar] [CrossRef] [Green Version]
- Ricketts, C.J.; De Cubas, A.A.; Fan, H.; Smith, C.C.; Lang, M.; Reznik, E.; Bowlby, R.; Gibb, E.A.; Akbani, R.; Beroukhim, R.; et al. The Cancer Genome Atlas Comprehensive Molecular Characterization of Renal Cell Carcinoma. Cell Rep. 2018, 23, 313–326. [Google Scholar] [CrossRef] [Green Version]
- Hakimi, A.A.; Chen, Y.B.; Wren, J.; Gonen, M.; Abdel-Wahab, O.; Heguy, A.; Liu, H.; Takeda, S.; Tickoo, S.K.; Reuter, V.E.; et al. Clinical and pathologic impact of select chromatin-modulating tumor suppressors in clear cell renal cell carcinoma. Eur. Urol. 2013, 63, 848–854. [Google Scholar] [CrossRef] [Green Version]
- Ho, T.H.; Choueiri, T.K.; Wang, K.; Karam, J.A.; Chalmers, Z.; Frampton, G.; Elvin, J.A.; Johnson, A.; Liu, X.; Lin, Y.; et al. Correlation between Molecular Subclassifications of Clear Cell Renal Cell Carcinoma and Targeted Therapy Response. Eur. Urol. Focus 2016, 2, 204–209. [Google Scholar] [CrossRef]
- Fay, A.P.; De Velasco, G.; Ho, T.H.; Van Allen, M.; Murray, B.; Albiges, L.; Signoretti, S.; Hakimi, A.A.; Stanton, M.L.; Bellmunt, J.; et al. Whole-exome sequencing in two extreme phenotypes of response to VEGF-targeted therapies in patients with metastatic clear cell renal cell carcinoma. J. Natl. Compr. Cancer Netw. 2016, 14, 820–824. [Google Scholar] [CrossRef] [Green Version]
- Voss, M.H.; Reising, A.; Cheng, Y.; Patel, P.; Marker, M.; Kuo, F.; Chan, T.A.; Choueiri, T.K.; Hsieh, J.J.; Hakimi, A.A.; et al. Genomically annotated risk model for advanced renal-cell carcinoma: A retrospective cohort study. Lancet Oncol. 2018, 19, 1688–1698. [Google Scholar] [CrossRef]
- Minardi, D.; Lucarini, G.; Santoni, M.; Mazzucchelli, R.; Burattini, L.; Pistelli, M.; Bianconi, M.; Di Primio, R.; Scartozzi, M.; Montironi, R.; et al. VEGF expression and response to sunitinib in patients with metastatic clear cell renal cell carcinoma. Anticancer Res. 2013, 33, 5017–5022. [Google Scholar] [PubMed]
- Porta, C.; Paglino, C.; De Amici, M.; Quaglini, S.; Sacchi, L.; Imarisio, I.; Canipari, C. Predictive value of baseline serum vascular endothelial growth factor and neutrophil gelatinase-associated lipocalin in advanced kidney cancer patients receiving sunitinib. Kidney Int. 2010, 77, 809–815. [Google Scholar] [CrossRef] [PubMed] [Green Version]
- Paule, B.; Bastien, L.; Deslandes, E.; Cussenot, O.; Podgorniak, M.P.; Allory, Y.; Naïmi, B.; Porcher, R.; de la Taille, A.; Menashi, S.; et al. Soluble isoforms of vascular endothelial growth factor are predictors of response to sunitinib in metastatic renal cell carcinomas. PLoS ONE 2010, 5, e10715. [Google Scholar] [CrossRef] [PubMed] [Green Version]
- Brauer, M.J.; Zhuang, G.; Schmidt, M.; Yao, J.; Wu, X.; Kaminker, J.S.; Jurinka, S.S.; Kolumam, G.; Chung, A.S.; Jubb, A.; et al. Identification and analysis of in vivo VEGF downstream markers link VEGF pathway activity with efficacy of anti-VEGF therapies. Clin. Cancer Res. 2013, 19, 3681–3692. [Google Scholar] [CrossRef] [PubMed] [Green Version]
- McDermott, D.F.; Huseni, M.A.; Atkins, M.B.; Motzer, R.J.; Rini, B.I.; Escudier, B.; Fong, L.; Joseph, R.W.; Pal, S.K.; Reeves, J.A.; et al. Clinical activity and molecular correlates of response to atezolizumab alone or in combination with bevacizumab versus sunitinib in renal cell carcinoma. Nat. Med. 2018, 24, 749–757. [Google Scholar] [CrossRef]
- Hakimi, A.A.; Voss, M.H.; Kuo, F.; Sanchez, A.; Liu, M.; Nixon, B.G.; Vuong, L.; Ostrovnaya, I.; Chen, Y.B.; Reuter, V.; et al. Transcriptomic profiling of the tumor microenvironment reveals distinct subgroups of clear cell renal cell cancer: Data from a randomized phase III trial. Cancer Discov. 2019, 9, 510–525. [Google Scholar] [CrossRef] [PubMed] [Green Version]
- Choueiri, T.K.; Albiges, L.; Haanen, J.B.A.G.; Larkin, J.M.G.; Uemura, M.; Pal, S.K.; Gravis, G.; Campbell, M.T.; Penkov, K.; Lee, J.-L.; et al. Biomarker analyses from JAVELIN Renal 101: Avelumab + axitinib (A+Ax) versus sunitinib (S) in advanced renal cell carcinoma (aRCC). J. Clin. Oncol. 2019, 37, 101. [Google Scholar] [CrossRef]
- Martini, J.-F.; Plimack, E.R.; Choueiri, T.K.; McDermott, D.F.; Puzanov, I.; Fishman, M.N.; Cho, D.C.; Vaishampayan, U.; Rosbrook, B.; Fernandez, K.C.; et al. Angiogenic and immune-related biomarkers and outcomes following axitinib/pembrolizumab treatment in patients with advanced renal cell carcinoma. Clin. Cancer Res. 2020, 26, 5598–5608. [Google Scholar] [CrossRef] [PubMed]
- Brindle, N.P.J.; Saharinen, P.; Alitalo, K. Signaling and functions of angiopoietin-1 in vascular protection. Circ. Res. 2006, 98, 1014–1023. [Google Scholar] [CrossRef]
- Attig, S.; Hennenlotter, J.; Pawelec, G.; Klein, G.; Koch, S.D.; Pircher, H.; Feyerabend, S.; Wernet, D.; Stenzl, A.; Rammensee, H.G.; et al. Simultaneous infiltration of polyfunctional effector and suppressor T cells into renal cell carcinomas. Cancer Res. 2009, 69, 8412–8419. [Google Scholar] [CrossRef] [PubMed] [Green Version]
- McDermott, D.F.; Regan, M.M.; Clark, J.I.; Flaherty, L.E.; Weiss, G.R.; Logan, T.F.; Kirkwood, J.M.; Gordon, M.S.; Sosman, J.A.; Ernstoff, M.S.; et al. Randomized phase III trial of high-dose interleukin-2 versus subcutaneous interleukin-2 and interferon in patients with metastatic renal cell carcinoma. J. Clin. Oncol. Off. J. Am. Soc. Clin. Oncol. 2005, 23, 133–141. [Google Scholar] [CrossRef] [PubMed] [Green Version]
- Fyfe, G.; Fisher, R.I.; Rosenberg, S.A.; Sznol, M.; Parkinson, D.R.; Louie, A.C. Results of treatment of 255 patients with metastatic renal cell carcinoma who received high-dose recombinant interleukin-2 therapy. J. Clin. Oncol. Off. J. Am. Soc. Clin. Oncol. 1995, 13, 688–696. [Google Scholar] [CrossRef]
- Negrier, S.; Escudier, B.; Lasset, C.; Douillard, J.Y.; Savary, J.; Chevreau, C.; Ravaud, A.; Mercatello, A.; Peny, J.; Mousseau, M.; et al. Recombinant human interleukin-2, recombinant human interferon alfa-2a, or both in metastatic renal-cell carcinoma. N. Engl. J. Med. 1998, 338, 1272–1278. [Google Scholar] [CrossRef]
- Motzer, R.J.; Escudier, B.; McDermott, D.F.; George, S.; Hammers, H.J.; Srinivas, S.; Tykodi, S.S.; Sosman, J.A.; Procopio, G.; Plimack, E.R.; et al. Nivolumab versus Everolimus in Advanced Renal-Cell Carcinoma. N. Engl. J. Med. 2015, 373, 1803–1813. [Google Scholar] [CrossRef]
- Carretero-González, A.; Lora, D.; Martín Sobrino, I.; Sáez Sanz, I.; Bourlon, M.T.; Anido Herranz, U.; Martínez Chanzá, N.; Castellano, D.; de Velasco, G. The Value of PD-L1 Expression as Predictive Biomarker in Metastatic Renal Cell Carcinoma Patients: A Meta-Analysis of Randomized Clinical Trials. Cancers (Basel) 2020, 12, 1945. [Google Scholar] [CrossRef]
- National Comprehensive Cancer Network Kidney Cancer (Version 2.2020). Available online: https://www.nccn.org/professionals/physician_gls/pdf/kidney.pdf (accessed on 10 October 2020).
- Nunes-Xavier, C.E.; Angulo, J.C.; Pulido, R.; López, J.I. A Critical Insight into the Clinical Translation of PD-1/PD-L1 Blockade Therapy in Clear Cell Renal Cell Carcinoma. Curr. Urol. Rep. 2019, 20, 1. [Google Scholar] [CrossRef]
- López, J.I.; Pulido, R.; Cortés, J.M.; Angulo, J.C.; Lawrie, C.H. Potential impact of PD-L1 (SP-142) immunohistochemical heterogeneity in clear cell renal cell carcinoma immunotherapy. Pathol. Res. Pract. 2018, 214, 1110–1114. [Google Scholar] [CrossRef]
- Thompson, R.H.; Kuntz, S.M.; Leibovich, B.C.; Dong, H.; Lohse, C.M.; Webster, W.S.; Sengupta, S.; Frank, I.; Parker, A.S.; Zincke, H.; et al. Tumor B7-H1 is associated with poor prognosis in renal cell carcinoma patients with long-term follow-up. Cancer Res. 2006, 66, 3381–3385. [Google Scholar] [CrossRef] [PubMed] [Green Version]
- Miao, D.; Margolis, C.A.; Gao, W.; Voss, M.H.; Li, W.; Martini, D.J.; Norton, C.; Bossé, D.; Wankowicz, S.M.; Cullen, D.; et al. Genomic correlates of response to immune checkpoint therapies in clear cell renal cell carcinoma. Science (80-) 2018, 359, 801–806. [Google Scholar] [CrossRef] [PubMed] [Green Version]
- Braun, D.A.; Ishii, Y.; Walsh, A.M.; Van Allen, E.M.; Wu, C.J.; Shukla, S.A.; Choueiri, T.K. Clinical Validation of PBRM1 Alterations as a Marker of Immune Checkpoint Inhibitor Response in Renal Cell Carcinoma. JAMA Oncol. 2019, 5, 1631. [Google Scholar] [CrossRef] [PubMed]
- Hakimi, A.A.; Attalla, K.; DiNatale, R.G.; Ostrovnaya, I.; Flynn, J.; Blum, K.A.; Ged, Y.; Hoen, D.; Kendall, S.M.; Reznik, E.; et al. A pan-cancer analysis of PBAF complex mutations and their association with immunotherapy response. Nat. Commun. 2020, 11, 4168. [Google Scholar] [CrossRef]
- Mizuno, R.; Oya, M. Biomarkers Towards New Era of Therapeutics for Metastatic Renal Cell Carcinoma. Kidney Cancer 2020, 4, 61–69. [Google Scholar] [CrossRef]
- Skoulidis, F.; Goldberg, M.E.; Greenawalt, D.M.; Hellmann, M.D.; Awad, M.M.; Gainor, J.F.; Schrock, A.B.; Hartmaier, R.J.; Trabucco, S.E.; Gay, L.; et al. STK11/LKB1 mutations and PD-1 inhibitor resistance in KRAS-mutant lung adenocarcinoma. Cancer Discov. 2018, 8, 822–835. [Google Scholar] [CrossRef] [Green Version]
- Cerami, E.; Gao, J.; Dogrusoz, U.; Gross, B.E.; Sumer, S.O.; Aksoy, B.A.; Jacobsen, A.; Byrne, C.J.; Heuer, M.L.; Larsson, E.; et al. The cBio Cancer Genomics Portal: An open platform for exploring multidimensional cancer genomics data. Cancer Discov. 2012, 2, 401–404. [Google Scholar] [CrossRef] [Green Version]
- Salgia, N.; Dizman, N.; Lyou, Y.; Bergerot, P.G.; Hsu, J.; Byron, S.A.; Trent, J.M.; Pal, S.K. Genomic and transcriptomic correlates of clinical benefit from immunotherapy and targeted therapy among patients with metastatic renal cell carcinoma (mRCC). J. Clin. Oncol. 2020, 38, 5076. [Google Scholar] [CrossRef]
- D’Costa, N.M.; Cina, D.; Shrestha, R.; Bell, R.H.; Lin, Y.Y.; Asghari, H.; Monjaras-Avila, C.U.; Kollmannsberger, C.; Hach, F.; Chavez-Munoz, C.I.; et al. Identification of gene signature for treatment response to guide precision oncology in clear-cell renal cell carcinoma. Sci. Rep. 2020, 10, 2026. [Google Scholar] [CrossRef] [Green Version]
- McDermott, D.F.; Lee, J.-L.; Donskov, F.; Tykodi, S.S.; Bjarnason, G.A.; Larkin, J.M.G.; Gafanov, R.; Kochenderfer, M.D.; Malik, J.; Poprach, A.; et al. Association of gene expression with clinical outcomes in patients with renal cell carcinoma treated with pembrolizumab in KEYNOTE-427. J. Clin. Oncol. 2020, 38, 5024. [Google Scholar] [CrossRef]
- Brahmer, J.R.; Tykodi, S.S.; Chow, L.Q.M.; Hwu, W.J.; Topalian, S.L.; Hwu, P.; Drake, C.G.; Camacho, L.H.; Kauh, J.; Odunsi, K.; et al. Safety and activity of anti-PD-L1 antibody in patients with advanced cancer. N. Engl. J. Med. 2012, 366, 2455–2465. [Google Scholar] [CrossRef] [PubMed] [Green Version]
- Bonneville, R.; Krook, M.A.; Kautto, E.A.; Miya, J.; Wing, M.R.; Chen, H.-Z.; Reeser, J.W.; Yu, L.; Roychowdhury, S. Landscape of Microsatellite Instability Across 39 Cancer Types. JCO Precis. Oncol. 2017, 1, 1–15. [Google Scholar] [CrossRef] [PubMed]
- Ged, Y.; Chaim, J.L.; DInatale, R.G.; Knezevic, A.; Kotecha, R.R.; Carlo, M.I.; Lee, C.H.; Foster, A.; Feldman, D.R.; Teo, M.Y.; et al. DNA damage repair pathway alterations in metastatic clear cell renal cell carcinoma and implications on systemic therapy. J. Immunother. Cancer 2020, 8, e000230. [Google Scholar] [CrossRef] [PubMed]
- Labriola, M.K.; Zhu, J.; Gupta, R.; McCall, S.; Jackson, J.; Kong, E.F.; White, J.R.; Cerqueira, G.; Gerding, K.; Simmons, J.K.; et al. Characterization of tumor mutation burden, PD-L1 and DNA repair genes to assess relationship to immune checkpoint inhibitors response in metastatic renal cell carcinoma. J. Immunother. Cancer 2020, 8, 1–10. [Google Scholar] [CrossRef] [PubMed] [Green Version]
- Chen, L.; Flies, D.B. Molecular mechanisms of T cell co-stimulation and co-inhibition. Nat. Rev. Immunol. 2013, 13, 227–242. [Google Scholar] [CrossRef]
- Gubin, M.M.; Artyomov, M.N.; Mardis, E.R.; Schreiber, R.D. Tumor neoantigens: Building a framework for personalized cancer immunotherapy. J. Clin. Investig. 2015, 125, 3413–3421. [Google Scholar] [CrossRef]
- Goodman, A.M.; Kato, S.; Bazhenova, L.; Patel, S.P.; Frampton, G.M.; Miller, V.; Stephens, P.J.; Daniels, G.A.; Kurzrock, R. Tumor mutational burden as an independent predictor of response to immunotherapy in diverse cancers. Mol. Cancer Ther. 2017, 16, 2598–2608. [Google Scholar] [CrossRef] [Green Version]
- Marabelle, A.; Fakih, M.G.; Lopez, J.; Shah, M.; Shapira-Frommer, R.; Nakagawa, K.; Chung, H.C.; Kindler, H.L.; Lopez-Martin, J.A.; Miller, W.; et al. Association of tumour mutational burden with outcomes in patients with select advanced solid tumours treated with pembrolizumab in KEYNOTE-158. Ann. Oncol. 2019, 30, v477–v478. [Google Scholar] [CrossRef]
- Zhang, C.; Li, Z.; Qi, F.; Hu, X.; Luo, J. Exploration of the relationships between tumor mutation burden with immune infiltrates in clear cell renal cell carcinoma. Ann. Transl. Med. 2019, 7, 648. [Google Scholar] [CrossRef]
- Havel, J.J.; Chowell, D.; Chan, T.A. The evolving landscape of biomarkers for checkpoint inhibitor immunotherapy. Nat. Rev. Cancer 2019, 19, 133–150. [Google Scholar] [CrossRef]
- McGrail, D.J.; Federico, L.; Li, Y.; Dai, H.; Lu, Y.; Mills, G.B.; Yi, S.; Lin, S.Y.; Sahni, N. Multi-omics analysis reveals neoantigen-independent immune cell infiltration in copy-number driven cancers. Nat. Commun. 2018, 9, 1–13. [Google Scholar] [CrossRef] [Green Version]
- Turajlic, S.; Litchfield, K.; Xu, H.; Rosenthal, R.; McGranahan, N.; Reading, J.L.; Wong, Y.N.S.; Rowan, A.; Kanu, N.; Al Bakir, M.; et al. Insertion-and-deletion-derived tumour-specific neoantigens and the immunogenic phenotype: A pan-cancer analysis. Lancet Oncol. 2017, 18, 1009–1021. [Google Scholar] [CrossRef] [PubMed] [Green Version]
- Shim, J.H.; Kim, H.S.; Cha, H.; Kim, S.; Kim, T.M.; Anagnostou, V.; Choi, Y.L.; Jung, H.A.; Sun, J.M.; Ahn, J.S.; et al. HLA-corrected tumor mutation burden and homologous recombination deficiency for the prediction of response to PD-(L)1 blockade in advanced non-small-cell lung cancer patients. Ann. Oncol. 2020, 31, 902–911. [Google Scholar] [CrossRef] [PubMed]
- Hu, K.; Lou, L.; Ye, J.; Zhang, S. Prognostic role of the neutrophil-lymphocyte ratio in renal cell carcinoma: A meta-analysis. BMJ Open 2015, 5, e006404. [Google Scholar] [CrossRef]
- Baum, Y.S.; Patil, D.; Huang, J.H.; Spetka, S.; Torlak, M.; Nieh, P.T.; Alemozaffar, M.; Ogan, K.; Master, V.A. Elevated preoperative neutrophil-tolymphocyte ratio may be associated with decreased overall survival in patients with metastatic clear cell renal cell carcinoma undergoing cytoreductive nephrectomy. Asian J. Urol. 2016, 3, 20–25. [Google Scholar] [CrossRef] [Green Version]
- Pichler, M.; Hutterer, G.C.; Stoeckigt, C.; Chromecki, T.F.; Stojakovic, T.; Golbeck, S.; Eberhard, K.; Gerger, A.; Mannweiler, S.; Pummer, K.; et al. Validation of the pre-treatment neutrophil-lymphocyte ratio as a prognostic factor in a large European cohort of renal cell carcinoma patients. Br. J. Cancer 2013, 108, 901–907. [Google Scholar] [CrossRef] [Green Version]
- Park, Y.H.; Ku, J.H.; Kwak, C.; Kim, H.H. Post-treatment neutrophil-to-lymphocyte ratio in predicting prognosis in patients with metastatic clear cell renal cell carcinoma receiving sunitinib as first line therapy. Springerplus 2014, 3, 1–6. [Google Scholar] [CrossRef] [Green Version]
- Keizman, D.; Ish-Shalom, M.; Huang, P.; Eisenberger, M.A.; Pili, R.; Hammers, H.; Carducci, M.A. The association of pre-treatment neutrophil to lymphocyte ratio with response rate, progression free survival and overall survival of patients treated with sunitinib for metastatic renal cell carcinoma. Eur. J. Cancer 2012, 48, 202–208. [Google Scholar] [CrossRef] [Green Version]
- Jeyakumar, G.; Kim, S.; Bumma, N.; Landry, C.; Silski, C.; Suisham, S.; Dickow, B.; Heath, E.; Fontana, J.; Vaishampayan, U. Neutrophil lymphocyte ratio and duration of prior anti-angiogenic therapy as biomarkers in metastatic RCC receiving immune checkpoint inhibitor therapy. J. Immunother. Cancer 2017, 5, 1–8. [Google Scholar] [CrossRef] [Green Version]
- Lalani, A.K.A.; Xie, W.; Martini, D.J.; Steinharter, J.A.; Norton, C.K.; Krajewski, K.M.; Duquette, A.; Bossé, D.; Bellmunt, J.; Van Allen, E.M.; et al. Change in Neutrophil-to-lymphocyte ratio (NLR) in response to immune checkpoint blockade for metastatic renal cell carcinoma. J. Immunother. Cancer 2018, 6, 1–9. [Google Scholar] [CrossRef]
- Lanzavecchla, A. Licence to kill. Nature 1998, 393, 413–414. [Google Scholar] [CrossRef]
- Balch, C.M.; Riley, L.B.; Bae, Y.J.; Salmeron, M.A.; Platsoucas, C.D.; Von Eschenbach, A.; Itoh, K. Patterns of Human Tumor-Infiltrating Lymphocytes in 120 Human Cancers. Arch. Surg. 1990, 125, 200–205. [Google Scholar] [CrossRef] [PubMed]
- Thompson, R.H.; Dong, H.; Lohse, C.M.; Leibovich, B.C.; Blute, M.L.; Cheville, J.C.; Kwon, E.D. PD-1 is expressed by tumor-infiltrating immune cells and is associated with poor outcome for patients with renal cell carcinoma. Clin. Cancer Res. 2007, 13, 1757–1761. [Google Scholar] [CrossRef] [PubMed] [Green Version]
- MacFarlane, A.W.; Jillab, M.; Plimack, E.R.; Hudes, G.R.; Uzzo, R.G.; Litwin, S.; Dulaimi, E.; Al-Saleem, T.; Campbell, K.S. PD-1 expression on peripheral blood cells increases with stage in renal cell carcinoma patients and is rapidly reduced after surgical tumor resection. Cancer Immunol. Res. 2014, 2, 320–331. [Google Scholar] [CrossRef] [PubMed] [Green Version]
- Giraldo, N.A.; Becht, E.; Vano, Y.; Petitprez, F.; Lacroix, L.; Validire, P.; Sanchez-Salas, R.; Ingels, A.; Oudard, S.; Moatti, A.; et al. Tumor-infiltrating and peripheral blood T-cell immunophenotypes predict early relapse in localized clear cell renal cell carcinoma. Clin. Cancer Res. 2017, 23, 4416–4428. [Google Scholar] [CrossRef] [PubMed] [Green Version]
- Braun, D.A.; Hou, Y.; Bakouny, Z.; Ficial, M.; Sant’ Angelo, M.; Forman, J.; Ross-Macdonald, P.; Berger, A.C.; Jegede, O.A.; Elagina, L.; et al. Interplay of somatic alterations and immune infiltration modulates response to PD-1 blockade in advanced clear cell renal cell carcinoma. Nat. Med. 2020, 26. [Google Scholar] [CrossRef] [PubMed]
- Ficial, M.; Jegede, O.; Sant’Angelo, M.; Moreno, S.; Braun, D.A.; Wind-Rotolo, M.; Pignon, J.-C.; Catalano, P.J.; Sun, M.; Van Allen, E.M.; et al. Evaluation of predictive biomarkers for nivolumab in patients (pts) with metastatic clear cell renal cell carcinoma (mccRCC) from the CheckMate-025 (CM-025) trial. J. Clin. Oncol. 2020, 38, 5023. [Google Scholar] [CrossRef]
- Kraman, M.; Faroudi, M.; Allen, N.L.; Kmiecik, K.; Gliddon, D.; Seal, C.; Koers, A.; Wydro, M.M.; Batey, S.; Winnewisser, J.; et al. FS118, a Bispecific Antibody Targeting LAG-3 and PD-L1, Enhances T-Cell Activation Resulting in Potent Antitumor Activity. Clin. Cancer Res. 2020, 26, 3333–3344. [Google Scholar] [CrossRef] [Green Version]
- Long, L.; Zhang, X.; Chen, F.; Pan, Q.; Phiphatwatchara, P.; Zeng, Y.; Chen, H. The promising immune checkpoint LAG-3: From tumor microenvironment to cancer immunotherapy. Genes Cancer 2018, 9, 176–189. [Google Scholar] [CrossRef] [Green Version]
- Errarte, P.; Larrinaga, G.; López, J.I. The role of cancer-associated fibroblasts in renal cell carcinoma. An example of tumor modulation through tumor/non-tumor cell interactions. J. Adv. Res. 2020, 21, 103–108. [Google Scholar] [CrossRef]
- Errarte, P.; Guarch, R.; Pulido, R.; Blanco, L.; Nunes-Xavier, C.E.; Beitia, M.; Gil, J.; Angulo, J.C.; Lopez, J.I.; Larrinaga, G. The expression of fibroblast activation protein in clear cell renal cell carcinomas is associated with synchronous lymph node metastases. PLoS ONE 2016, 11, e169105. [Google Scholar] [CrossRef] [PubMed]
- Inoue, C.; Miki, Y.; Saito, R.; Hata, S.; Abe, J.; Sato, I.; Okada, Y.; Sasano, H. PD-L1 induction by cancer-associated fibroblast-derived factors in lung adenocarcinoma cells. Cancers (Basel) 2019, 11, 1257. [Google Scholar] [CrossRef] [PubMed] [Green Version]
- Turajlic, S.; Xu, H.; Litchfield, K.; Rowan, A.; Horswell, S.; Chambers, T.; O’Brien, T.; Lopez, J.I.; Watkins, T.B.K.; Nicol, D.; et al. Deterministic Evolutionary Trajectories Influence Primary Tumor Growth: TRACERx Renal. Cell 2018, 173, 595–610. [Google Scholar] [CrossRef] [PubMed] [Green Version]


| Biomarker | Key Findings as a Predictive or Prognostic Biomarker |
|---|---|
| von Hippel-Lindau (VHL) [7] |
|
| Polybromo-1 (PBRM1) [11,12] |
|
| SET domain containing 2, histone lysine methyltransferase (SETD2) [13] |
|
| BRCA1 Associated Protein 1 (BAP1) [19] |
|
| Vascular Endothelial Growth Factor (VEGF) [14,15,16,21] |
|
| Angiopoietins (Ang-1, Ang-2) [21] |
|
| Angio gene signature (VEGFA, KDR, ESM1, PECAM1, ANGPTL4, and CD34) [18,19,20] |
|
| Gene Signature | Dataset | Genes | Key Findings | |
|---|---|---|---|---|
| IMmotion150 Signature [18] | Sample size: 263 patients Study Type: Randomized phase 2 study of atezolizumab alone or combined with bevacizumab (anti-VEGF) versus sunitinib | Angiogenesis (Angio) |
| |
|
| |||
| Myeloid Inflammation | ||||
|
| |||
| T-effector (Teff) | ||||
|
| |||
| 66 Gene Signature [40] | Sample Size: Training cohort 469 patients Validation cohort 64 patients Study Type: Retrospective analysis of ccRCC patients from The Cancer Genome Atlas (TCGA) | Angiogenesis |
| |
|
| |||
| T-effector | ||||
|
| |||
| Ca2+-flux | ||||
|
| |||
| Invasion | ||||
|
| |||
| T-cell Inflamed GEP [41] | Sample Size: 78 patients Study Type: Open-label, single-arm phase 2 study of first-line pembrolizumab | T-cell Inflamed |
| |
|
| |||
Publisher’s Note: MDPI stays neutral with regard to jurisdictional claims in published maps and institutional affiliations. |
© 2020 by the authors. Licensee MDPI, Basel, Switzerland. This article is an open access article distributed under the terms and conditions of the Creative Commons Attribution (CC BY) license (http://creativecommons.org/licenses/by/4.0/).
Share and Cite
Miron, B.; Xu, D.; Zibelman, M. Biomarker Development for Metastatic Renal Cell Carcinoma: Omics, Antigens, T-cells, and Beyond. J. Pers. Med. 2020, 10, 225. https://doi.org/10.3390/jpm10040225
Miron B, Xu D, Zibelman M. Biomarker Development for Metastatic Renal Cell Carcinoma: Omics, Antigens, T-cells, and Beyond. Journal of Personalized Medicine. 2020; 10(4):225. https://doi.org/10.3390/jpm10040225
Chicago/Turabian StyleMiron, Benjamin, David Xu, and Matthew Zibelman. 2020. "Biomarker Development for Metastatic Renal Cell Carcinoma: Omics, Antigens, T-cells, and Beyond" Journal of Personalized Medicine 10, no. 4: 225. https://doi.org/10.3390/jpm10040225