Graphical Trajectory Comparison to Identify Errors in Data of COVID-19: A Cross-Country Analysis
Abstract
:1. Introduction
2. Materials and Methods
2.1. Data Collection in the Early Stage of the Pandemic
2.2. Peak Day of Cases and Deaths
2.3. Data Analyses before and after the Peak Day
2.4. The Time Lag between Peaks of Cases and Deaths
3. Results
3.1. Basic Information
3.2. Case and Death Patterns in Hubei Province
3.3. Case and Death Patterns in Three Countries with Less Disease Severity
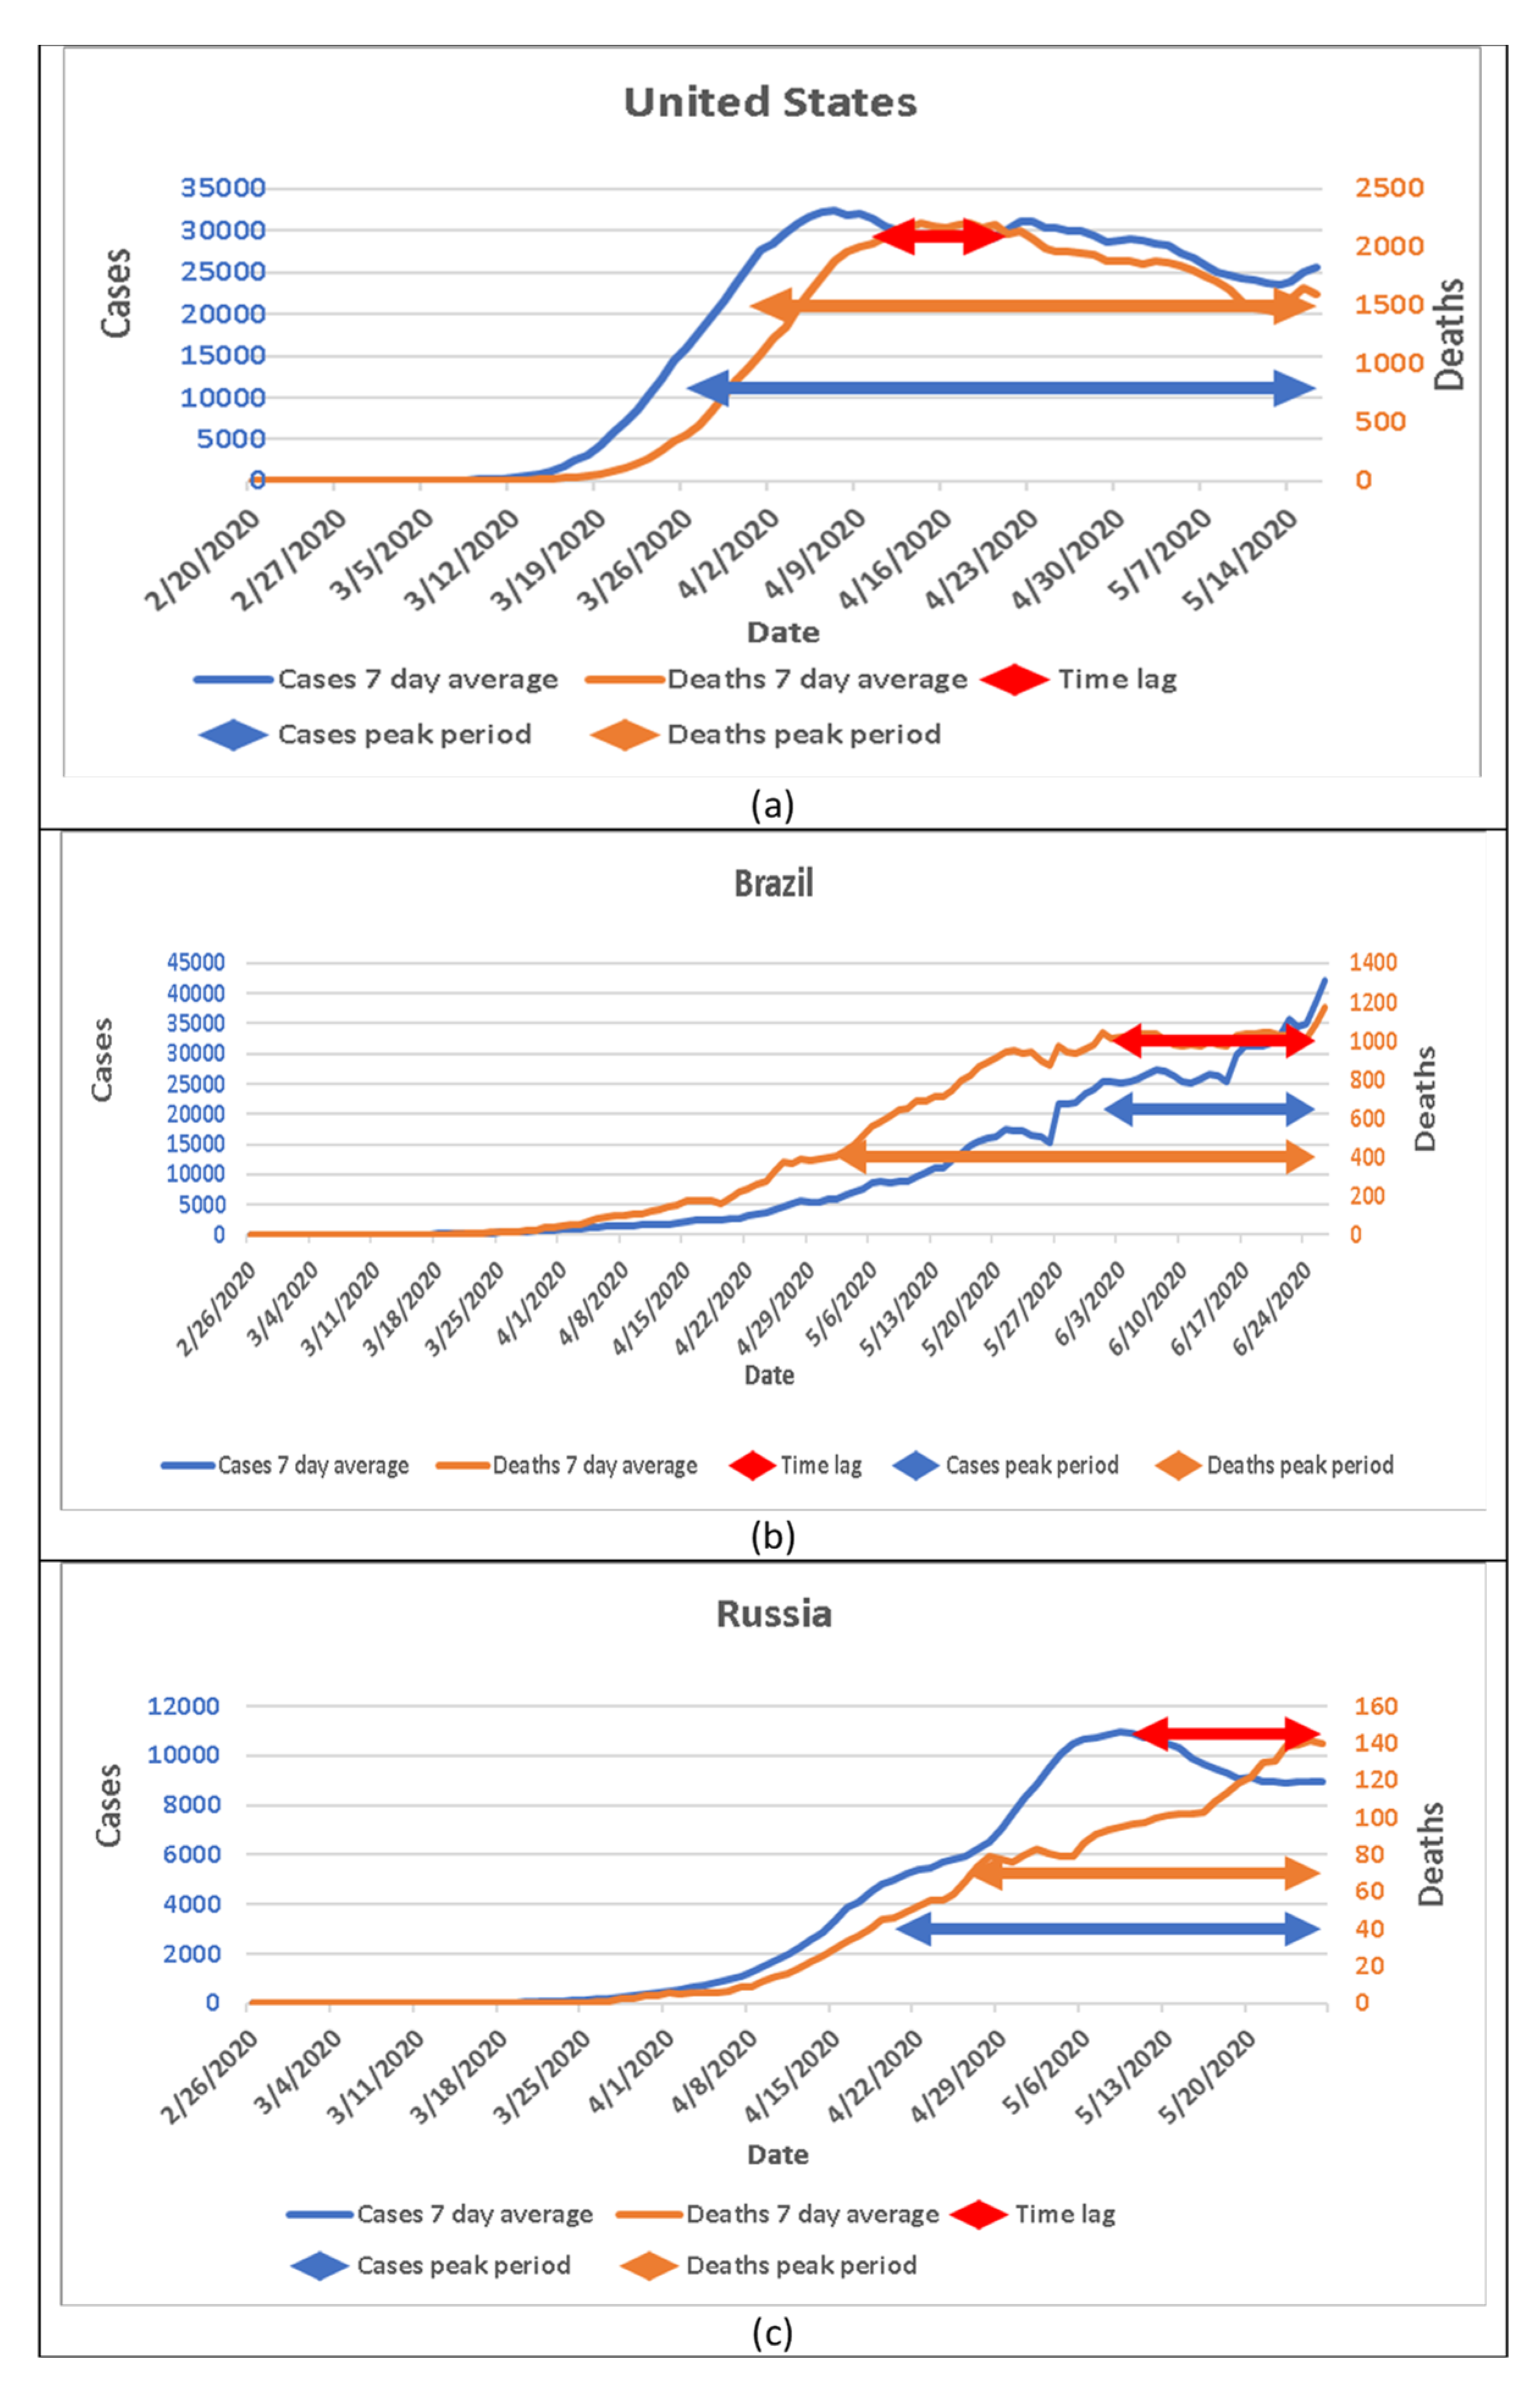
3.4. Case and Death Patterns in Three Countries with Large Pandemics
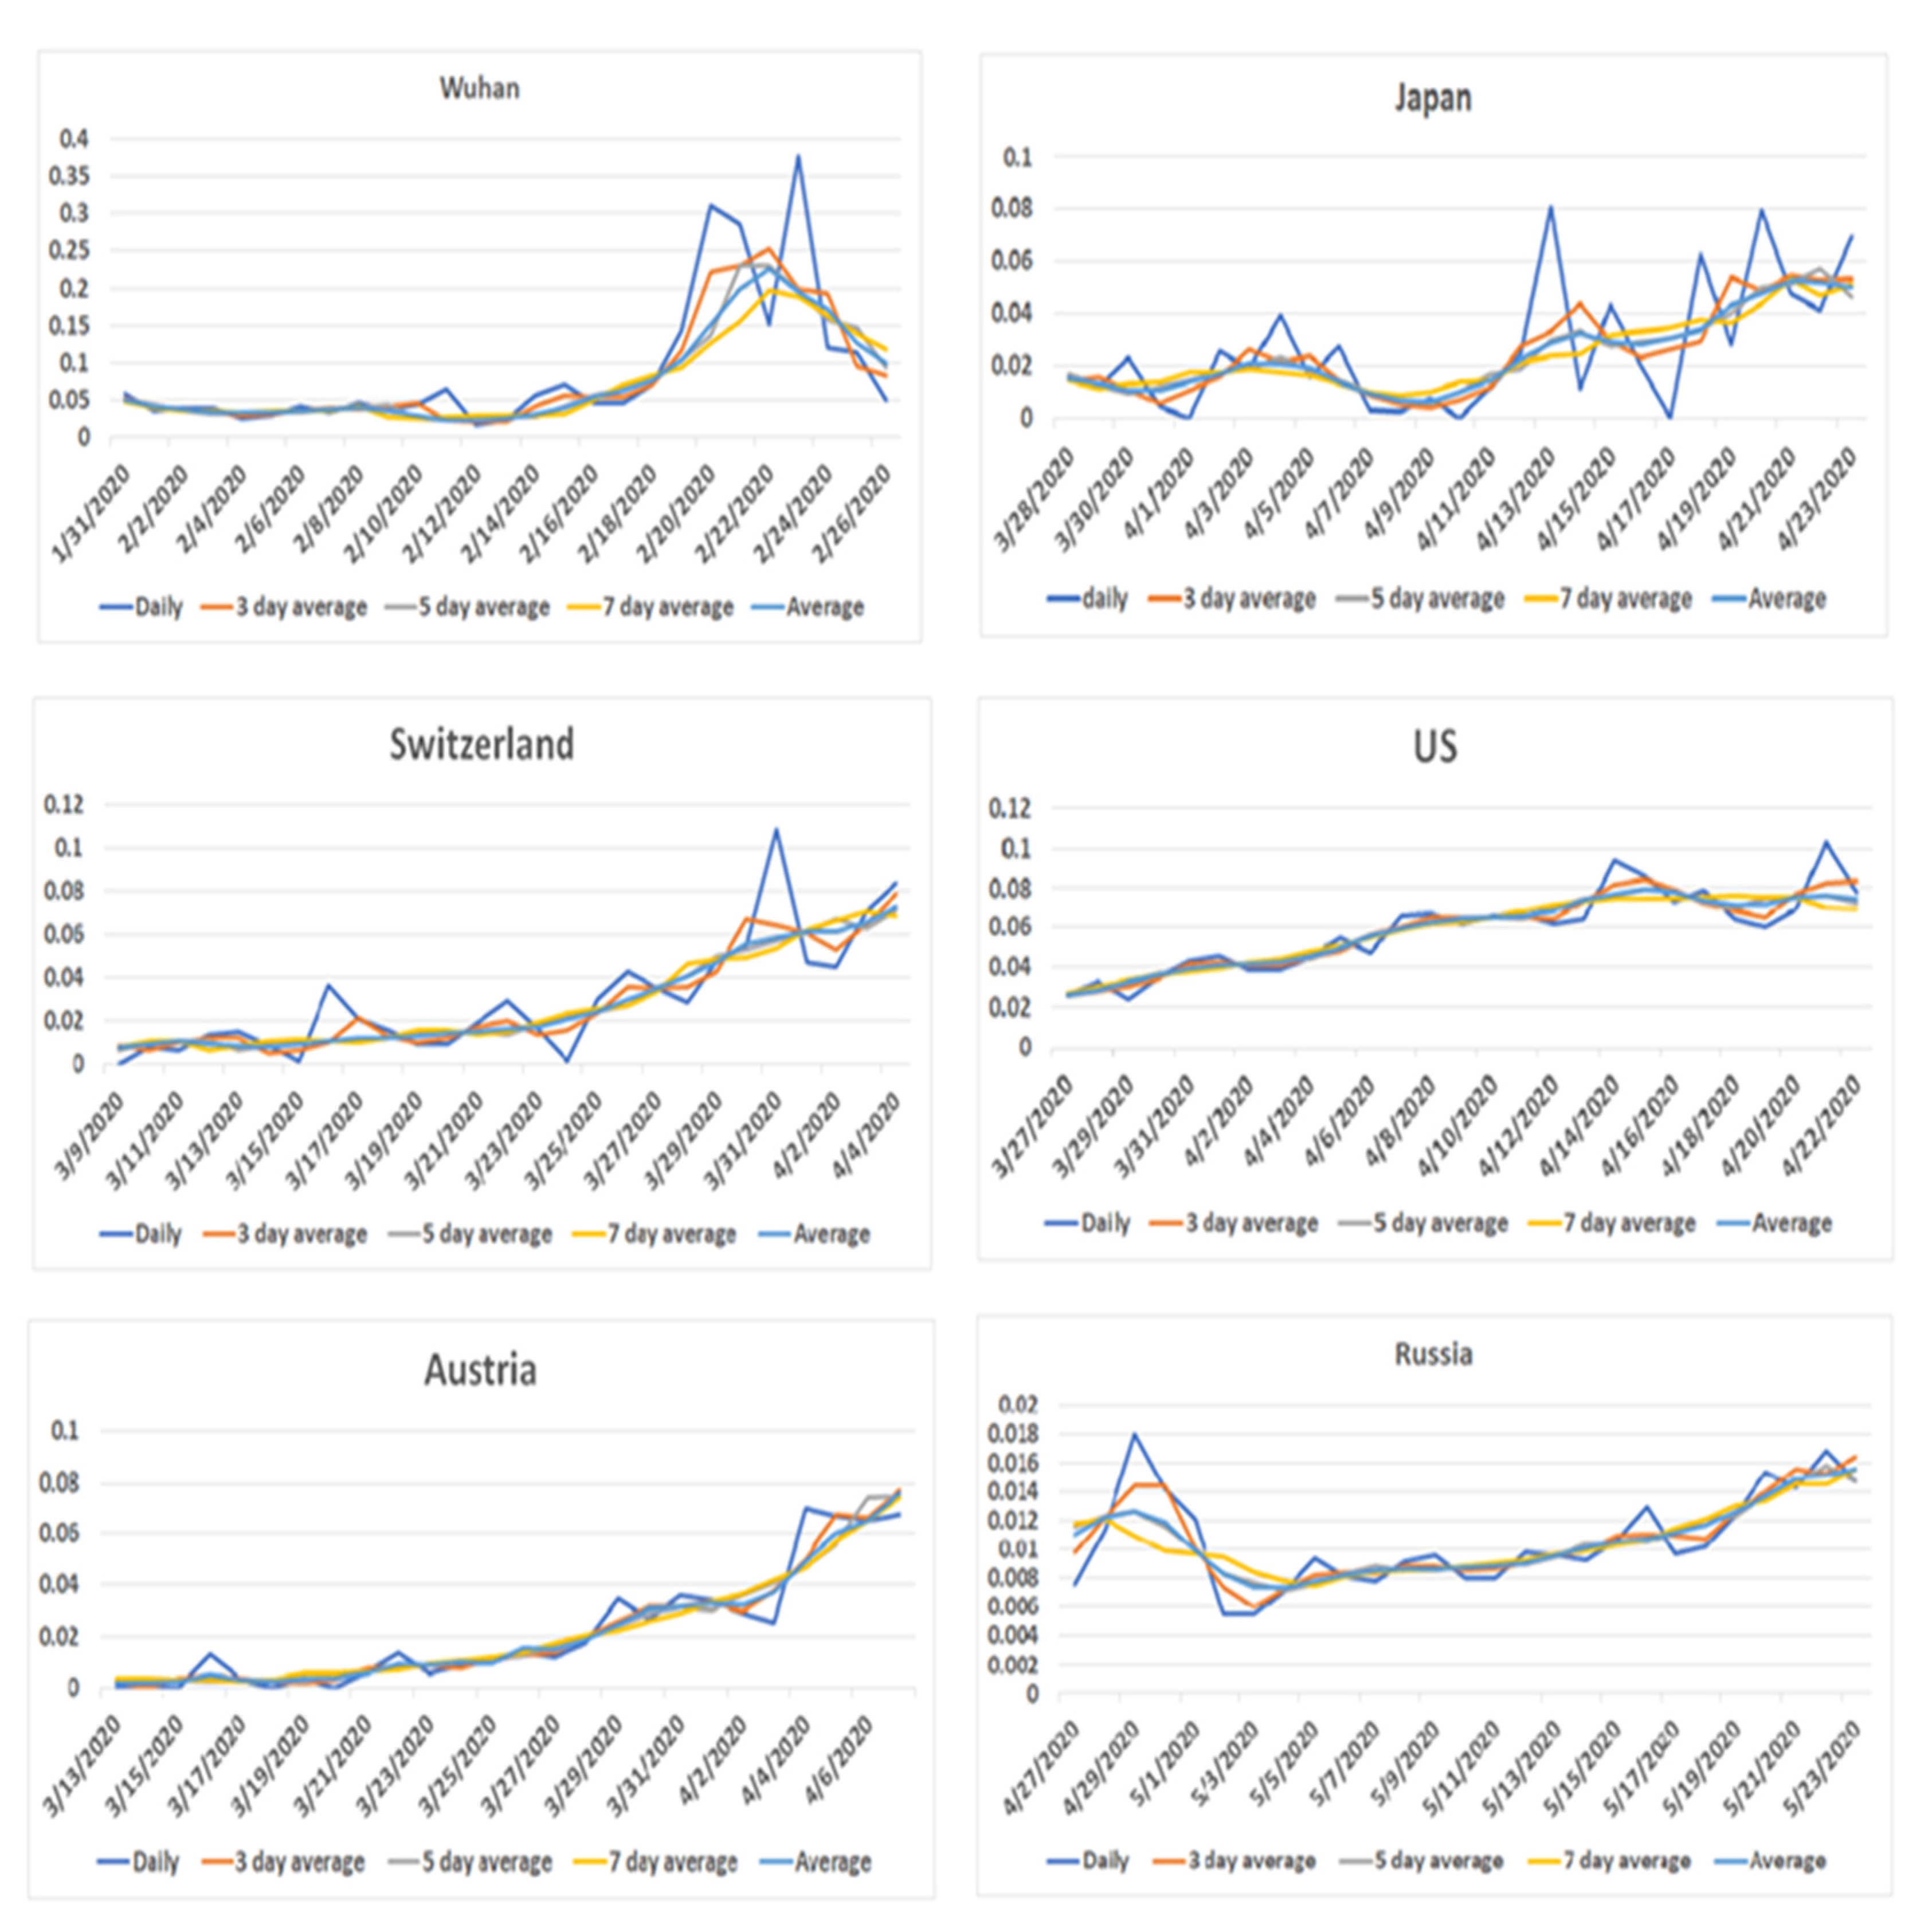
3.5. Patterns of Death Rate around the Peak of Disease Onset
3.6. Estimated Peak Day and Cases in Wuhan
3.7. Potential Data Collection Errors in Brazil
4. Discussion
5. Conclusions
Author Contributions
Funding
Institutional Review Board Statement
Informed Consent Statement
Data Availability Statement
Conflicts of Interest
References
- Gu, T.; Lan, Y.; Meng, X.; Graff, J.C.; Thomason, D.; Li, J.; Dong, W.; Jiao, Y.; Aleya, L.; Maida, M. A cost-effective plan for global testing-an infection rate stratified, algorithmic guided, multiple-level, continuously pooled testing strategy. Sci. Total Environ. 2020, 765, 144251. [Google Scholar] [CrossRef] [PubMed]
- Chen, S.X.; Lam, B.C.P.; Liu, J.H.; Choi, H.-S.; Kashima, E.; Bernardo, A.B.I. Effects of containment and closure policies on controlling the Covid-19 pandemic in East Asia. Asian J. Soc. Psychol. 2021, 1, 42–47. [Google Scholar] [CrossRef] [PubMed]
- Wang, L.; Li, J.; Guo, S.; Xie, N.; Yao, L.; Cao, Y.; Day, S.W.; Howard, S.C.; Graff, J.C.; Gu, T. Real-time estimation and prediction of mortality caused by Covid-19 with patient information based algorithm. Sci. Total Environ. 2020, 727, 138394. [Google Scholar] [CrossRef] [PubMed]
- López, L.; Rodo, X. A modified seir model to predict the Covid-19 outbreak in Spain and Italy: Simulating control scenarios and multi-scale epidemics. Res. Phys. 2021, 21, 103746. [Google Scholar] [CrossRef]
- Heliang, Y.; Sun, T.; Yao, L.; Jiao, Y.; Ma, L.; Lin, L.; Graff, J.C.; Aleya, L.; Postlethwaite, A.; Gu, W. Association between population density and infection rate suggests the importance of social distancing and travel restriction in reducing the Covid-19 pandemic. Environ. Sci. Pollut. Res. 2021, 28, 40424–40430. [Google Scholar]
- Mazin, B.; Althabit, N.; Akkielah, L.; AlMohaya, A.; Alotaibi, M.; Alhasani, S.; Aldrees, A.; AlRajhi, A.; AlHiji, A.; Almajid, F. Clinical characteristics and outcomes of hospitalized Covid-19 patients in a mers-cov referral hospital during the peak of the pandemic. Int. J. Infect. Dis. 2021, 106, 43–51. [Google Scholar]
- Chen, W.; Horby, P.W.; Hayden, F.G.; Gao, G.F. A novel coronavirus outbreak of global health concern. Lancet 2020, 395, 470–473. [Google Scholar]
- Shrikant, P.; Stanam, A.; Chaudhari, M.; Rayudu, D. Effects of temperature on Covid-19 transmission. Medrxiv 2020. [Google Scholar] [CrossRef]
- Surkova, E.; Nikolayevskyy, V.; Drobniewski, F. False-positive Covid-19 results: Hidden problems and costs. Lancet Respir. Med. 2020, 8, 1167–1168. [Google Scholar] [CrossRef]
- West, C.P.; Montori, V.M.; Sampathkumar, P. Covid-19 testing: The threat of false-negative results. Mayo Clin. Proc. 2020, 95, 1127–1129. [Google Scholar] [CrossRef] [PubMed]
- Wynants, L.; Calster, B.V.; Collins, G.S.; Riley, R.D.; Heinze, G.; Schuit, E.; Bonten, M.M.J.; Dahly, D.L.; Damen, J.A.A.; Debray, T.P.A. Prediction models for diagnosis and prognosis of Covid-19: Systematic review and critical appraisal. BMJ 2020, 369, m1328. [Google Scholar] [CrossRef] [PubMed] [Green Version]
- Carvajal, G.; Roser, D.J.; Sisson, S.A.; Keegan, A.; Khan, S.J. Modelling pathogen Log10 reduction values achieved by activated sludge treatment using naïve and semi naïve bayes network models. Water Res. 2015, 85, 304–315. [Google Scholar] [CrossRef] [PubMed]
- Ho, T.T.; Park, J.; Kim, T.; Park, B.; Lee, J.; Kim, J.Y.; Kim, K.B.; Choi, S.; Kim, Y.H.; Lim, J.-K. Deep learning models for predicting severe progression in Covid-19-infected patients: Retrospective study. JMIR Med. Inform. 2021, 9, e24973. [Google Scholar] [CrossRef] [PubMed]
- Tang, B.; Shojaei, M.; Wang, Y.; Nalos, M.; Mclean, A.; Afrasiabi, A.; Kwan, T.N.; Kuan, W.S.; Zerbib, Y.; Herwanto, V. Prospective validation study of prognostic biomarkers to predict adverse outcomes in patients with Covid-19: A study protocol. BMJ Open 2021, 11, e044497. [Google Scholar] [CrossRef] [PubMed]
- Huang, C.; Wang, Y.; Li, X.; Ren, L.; Zhao, J.; Hu, Y.; Zhang, L.; Fan, G.; Xu, J.; Gu, X. Clinical features of patients infected with 2019 novel coronavirus in Wuhan, China. Lancet 2020, 395, 497–506. [Google Scholar] [CrossRef] [Green Version]


| Indicators | Xiaogan | Huanggang | Wuhan | Switzerland | Japan | Austria | United States | Brazil | Russia |
|---|---|---|---|---|---|---|---|---|---|
| Time lag | 13 | 12 | 0 | 15 | 22 | 16 | 7 | −23 | 16 |
| Cases in peak day | 424 | 244 | 3910 | 1100 | 615 | 796 | 32,901 | 42,941 | 11,028 |
| Deaths in peak day | 7 | 6 | 88 | 57 | 24 | 25 | 2332 | 1165 | 140 |
| Cases in peak period | 1846 | 2578 | 25,393 | 22,890 | 11,065 | 10,449 | 1461,040 | 903,395 | 330,374 |
| Deaths in peak period | 64 | 110 | 1880 | 1594 | 617 | 491 | 86,251 | 48,766 | 3252 |
| Cases in time lag | 1846 | 1815 | 0 | 14,794 | 8330 | 7659 | 241,640 | 723,396 | 154,751 |
| Deaths in time lag | 64 | 54 | 0 | 643 | 428 | 245 | 17,263 | 24,831 | 1806 |
| Cases after peak day | 1533 | 1638 | 32,994 | 23,098 | 10,232 | 10,613 | 1,039,256 | 0 | 152,654 |
| Total cases | 3419 | 2884 | 50,860 | 30,572 | 16,237 | 16,201 | 1,516,575 | 1,280,063 | 362,380 |
| Deaths after peak day | 58 | 56 | 1036 | 1114 | 238 | 356 | 55,330 | 23,562 | 174 |
| Total deaths | 128 | 125 | 2606 | 1879 | 725 | 629 | 90,324 | 56,109 | 3807 |
| Cases peak period | 11 | 17 | 7 | 27 | 25 | 18 | 53 | 32 | 39 |
| Deaths peak period | 22 | 31 | 22 | 36 | 35 | 29 | 47 | 53 | 33 |
| Peak cases/total cases | 0.124 | 0.894 | 0.499 | 0.749 | 0.681 | 0.645 | 0.963 | 0.706 | 0.912 |
| Peak deaths/total deaths | 0.055 | 0.880 | 0.721 | 0.848 | 0.851 | 0.781 | 0.955 | 0.869 | 0.854 |
| Cases after peak/total cases | 0.448 | 0.568 | 0.649 | 0.756 | 0.630 | 0.655 | 0.685 | 0.000 | 0.421 |
| Deaths after peak/total deaths | 0.453 | 0.448 | 0.398 | 0.593 | 0.328 | 0.566 | 0.613 | 0.420 | 0.046 |
| Cases in time lag/total cases | 0.540 | 0.629 | 0.000 | 0.484 | 0.513 | 0.473 | 0.159 | 0.565 | 0.427 |
| Deaths in time lag/total deaths | 0.500 | 0.432 | 0.000 | 0.342 | 0.590 | 0.390 | 0.191 | 0.443 | 0.474 |
Publisher’s Note: MDPI stays neutral with regard to jurisdictional claims in published maps and institutional affiliations. |
© 2021 by the authors. Licensee MDPI, Basel, Switzerland. This article is an open access article distributed under the terms and conditions of the Creative Commons Attribution (CC BY) license (https://creativecommons.org/licenses/by/4.0/).
Share and Cite
Yao, L.; Dong, W.; Wan, J.Y.; Howard, S.C.; Li, M.; Graff, J.C. Graphical Trajectory Comparison to Identify Errors in Data of COVID-19: A Cross-Country Analysis. J. Pers. Med. 2021, 11, 955. https://doi.org/10.3390/jpm11100955
Yao L, Dong W, Wan JY, Howard SC, Li M, Graff JC. Graphical Trajectory Comparison to Identify Errors in Data of COVID-19: A Cross-Country Analysis. Journal of Personalized Medicine. 2021; 11(10):955. https://doi.org/10.3390/jpm11100955
Chicago/Turabian StyleYao, Lan, Wei Dong, Jim Y. Wan, Scott C. Howard, Minghui Li, and Joyce Carolyn Graff. 2021. "Graphical Trajectory Comparison to Identify Errors in Data of COVID-19: A Cross-Country Analysis" Journal of Personalized Medicine 11, no. 10: 955. https://doi.org/10.3390/jpm11100955
APA StyleYao, L., Dong, W., Wan, J. Y., Howard, S. C., Li, M., & Graff, J. C. (2021). Graphical Trajectory Comparison to Identify Errors in Data of COVID-19: A Cross-Country Analysis. Journal of Personalized Medicine, 11(10), 955. https://doi.org/10.3390/jpm11100955


