
An Effective and Robust Approach Based on R-CNN+LSTM Model and NCAR Feature Selection for Ophthalmological Disease Detection from Fundus Images


Abstract
:
1. Introduction
- With the proposed R-CNN+LSTM, R-CNN and LSTM structures were trained together. Thus, the residual layer information of the R-CNN model and the LSTM model’s ability to keep important data in memory was utilized.
- The residual strategy and LSTM structure of the proposed R-CNN+LSTM boosted the classification achievement.
- The NCAR feature selection algorithm based on the calculation of feature importance and weights improved the classification performance. Besides, the NCAR algorithm, which benefited from the NCA and ReliefF algorithms, outperformed both algorithms that were popular in the selection based on feature importance and weights.
- The proposed R-CNN+LSTM model contains too many learnable parameters. Therefore, powerful hardware is required for fast prediction results.
2. Related Works
3. Methodology, Material, and Techniques
3.1. Proposed Methodology
3.2. Dataset
3.3. Deep Learning Techniques
3.4. Multilevel Feature Selection
| Algorithm 1. Pseudocode of the NCAR algorithm |
| Input: feature vector from CovEncoNet model (fea), size of feature vector (N) average of fea(avg), standard deviation of fea (std), threshold (thr) Output: reduced feture vector (fea_out) 1:. feature_reducion(fea,std,avg,thr) 2:. begin 2:. fea_out = fea 3:. for i = 1 to N do 4:. decision1 = std/fea_out[i] 5:. decision2 = avg/fea_out[i] 6:. if decision1 > thr and decision2 > thr 7:. fea_out[i] = [] 8:. end if 9:. end for i 10:. end |
4. Experimental Studies
5. Discussion
6. Conclusions
Author Contributions
Funding
Institutional Review Board Statement
Informed Consent Statement
Data Availability Statement
Conflicts of Interest
References
- Gagnon, L.; Lalonde, M.; Beaulieu, M.; Boucher, M.-C. Procedure to detect anatomical structures in optical fundus images. In Proceedings of the Medical Imaging 2001: Image Processing; International Society for Optics and Photonics, San Diego, CA, USA, 3 July 2001; Volume 4322, pp. 1218–1225. [Google Scholar]
- Yannuzzi, L.A.; Ober, M.D.; Slakter, J.S.; Spaide, R.F.; Fisher, Y.L.; Flower, R.W.; Rosen, R. Ophthalmic fundus imaging: Today and beyond. Am. J. Ophthalmol. 2004, 137, 511–524. [Google Scholar] [CrossRef]
- Abramoff, M.D.; Garvin, M.K.; Sonka, M. Retinal imaging and image analysis. IEEE Rev. Biomed. Eng. 2010, 3, 169–208. [Google Scholar] [CrossRef] [Green Version]
- Kanski, J.J.; Bowling, B. Clinical Ophthalmology: A Systematic Approach; Elsevier Health Sciences: London, UK, 2011; ISBN 070204511X. [Google Scholar]
- Almazroa, A.; Burman, R.; Raahemifar, K.; Lakshminarayanan, V. Optic disc and optic cup segmentation methodologies for glaucoma image detection: A survey. J. Ophthalmol. 2015, 2015, 180972. [Google Scholar] [CrossRef] [PubMed] [Green Version]
- Reza, A.W.; Eswaran, C. A decision support system for automatic screening of non-proliferative diabetic retinopathy. J. Med. Syst. 2011, 35, 17–24. [Google Scholar] [CrossRef] [PubMed]
- Ashraf, M.N.; Habib, Z.; Hussain, M. Texture feature analysis of digital fundus images for early detection of diabetic retinopathy. In Proceedings of the 2014 11th International Conference on Computer Graphics, Imaging and Visualization, Singapore, 6–8 August 2014; pp. 57–62. [Google Scholar]
- Krizhevsky, A.; Sutskever, I.; Hinton, G.E. Imagenet classification with deep convolutional neural networks. Commun. ACM 2017, 60, 84–90. [Google Scholar] [CrossRef]
- Demir, F.; Sobahi, N.; Siuly, S.; Sengur, A. Exploring Deep Learning Features For Automatic Classification Of Human Emotion Using EEG Rhythms. IEEE Sens. J. 2021, 21, 14923–14930. [Google Scholar] [CrossRef]
- Deepak, S.; Ameer, P.M. Brain tumor classification using deep CNN features via transfer learning. Comput. Biol. Med. 2019, 111, 103345. [Google Scholar] [CrossRef]
- Khare, S.K.; Bajaj, V.; Acharya, U.R. Spwvd-cnn for automated detection of schizophrenia patients using eeg signals. IEEE Trans. Instrum. Meas. 2021, 70, 2507409. [Google Scholar] [CrossRef]
- Gour, M.; Jain, S. Stacked Convolutional Neural Network for Diagnosis of COVID-19 Disease from X-ray Images. arXiv 2020, arXiv:2006.13817. [Google Scholar]
- Ismael, A.M.; Şengür, A. Deep learning approaches for COVID-19 detection based on chest X-ray images. Expert Syst. Appl. 2021, 164, 114054. [Google Scholar] [CrossRef]
- Toğaçar, M.; Ergen, B.; Cömert, Z. COVID-19 detection using deep learning models to exploit Social Mimic Optimization and structured chest X-ray images using fuzzy color and stacking approaches. Comput. Biol. Med. 2020, 121, 103805. [Google Scholar] [CrossRef]
- Kaur, T.; Gandhi, T.K. Deep convolutional neural networks with transfer learning for automated brain image classification. Mach. Vis. Appl. 2020, 31, 20. [Google Scholar] [CrossRef]
- Orfao, J.; van der Haar, D. A Comparison of Computer Vision Methods for the Combined Detection of Glaucoma, Diabetic Retinopathy and Cataracts. In Proceedings of the Annual Conference on Medical Image Understanding and Analysis, Oxford, UK, 12–14 July 2021; pp. 30–42. [Google Scholar]
- Elloumi, Y. Mobile Aided System of Deep-Learning Based Cataract Grading from Fundus Images. In Proceedings of the International Conference on Artificial Intelligence in Medicine, Porto, Portugal, 16–19 June 2021; pp. 355–360. [Google Scholar]
- Khan, I.A.; Sajeeb, A.; Fattah, S.A. An Automatic Ocular Disease Detection Scheme from Enhanced Fundus Images Based on Ensembling Deep CNN Networks. In Proceedings of the 2020 11th International Conference on Electrical and Computer Engineering (ICECE), Dhaka, Bangladesh, 17–19 December 2020. [Google Scholar]
- Khan, M.S.M.; Ahmed, M.; Rasel, R.Z.; Khan, M.M. Cataract Detection Using Convolutional Neural Network with VGG-19 Model. In Proceedings of the 2021 IEEE World AI IoT Congress (AIIoT), Seattle, WA, USA, 10–13 May 2021; pp. 209–212. [Google Scholar]
- Sun, T.; Oruc, I. TeleAEye: Low-Cost Automated Eye Disease Diagnosis Using a Novel Smartphone Fundus Camera With AI. Available online: https://abstracts.societyforscience.org/Home/PrintPdf/21255, (accessed on 1 October 2021).
- Li, F.; Chen, H.; Liu, Z.; Zhang, X.; Wu, Z. Fully automated detection of retinal disorders by image-based deep learning. Graefe’s Arch. Clin. Exp. Ophthalmol. 2019, 257, 495–505. [Google Scholar] [CrossRef]
- Raghavendra, U.; Fujita, H.; Bhandary, S.V.; Gudigar, A.; Tan, J.H.; Acharya, U.R. Deep convolution neural network for accurate diagnosis of glaucoma using digital fundus images. Inf. Sci. 2018, 441, 41–49. [Google Scholar] [CrossRef]
- Singh, T.M.; Bharali, P.; Bhuyan, C. Automated detection of diabetic retinopathy. In Proceedings of the 2019 Second International Conference on Advanced Computational and Communication Paradigms (ICACCP), Gangtok, India, 25–28 February 2019; pp. 1–6. [Google Scholar]
- Chai, Y.; Liu, H.; Xu, J. Glaucoma diagnosis based on both hidden features and domain knowledge through deep learning models. Knowl.-Based Syst. 2018, 161, 147–156. [Google Scholar] [CrossRef]
- International Competition on Ocular Disease Intelligent Recognition. Available online: https://odir2019.grand-challenge.org/dataset/ (accessed on 18 November 2021).
- Simonyan, K.; Zisserman, A. Very deep convolutional networks for large-scale image recognition. arXiv 2014, arXiv:1409.1556. [Google Scholar]
- Santurkar, S.; Tsipras, D.; Ilyas, A.; Mądry, A. How does batch normalization help optimization? In Proceedings of the 32nd International Conference on Neural Information Processing Systems, Montréal, QC, Canada, 3–8 December2018; pp. 2488–2498. [Google Scholar]
- Ioffe, S.; Szegedy, C. Batch normalization: Accelerating deep network training by reducing internal covariate shift. In Proceedings of the International Conference on Machine Learning, PMLR, Lille, France, 7–9 July 2015; pp. 448–456. [Google Scholar]
- Hochreiter, S.; Schmidhuber, J. Long short-term memory. Neural Comput. 1997, 9, 1735–1780. [Google Scholar] [CrossRef]
- Buduma, N.; Locascio, N. Fundamentals of Deep Learning: Designing Next-Generation Machine Intelligence Algorithms; O’Reilly Media, Inc.: Sebastopol, CA, USA, 2017; ISBN 1491925582. [Google Scholar]
- Agarap, A.F. Deep learning using rectified linear units (relu). arXiv 2018, arXiv:1803.08375. [Google Scholar]
- Weng, L.; Zhang, H.; Chen, H.; Song, Z.; Hsieh, C.-J.; Daniel, L.; Boning, D.; Dhillon, I. Towards fast computation of certified robustness for relu networks. In Proceedings of the International Conference on Machine Learning, PMLR, Stockholm, Sweden, 10–15 July 2018; pp. 5276–5285. [Google Scholar]
- Jin, J.; Dundar, A.; Culurciello, E. Flattened convolutional neural networks for feedforward acceleration. arXiv 2014, arXiv:1412.5474. [Google Scholar]
- Srivastava, N.; Hinton, G.; Krizhevsky, A.; Sutskever, I.; Salakhutdinov, R. Dropout: A simple way to prevent neural networks from overfitting. J. Mach. Learn. Res. 2014, 15, 1929–1958. [Google Scholar]
- Baygin, M.; Yaman, O.; Tuncer, T.; Dogan, S.; Barua, P.D.; Acharya, U.R. Automated accurate schizophrenia detection system using Collatz pattern technique with EEG signals. Biomed. Signal Process. Control 2021, 70, 102936. [Google Scholar] [CrossRef]
- Tuncer, T.; Dogan, S.; Subasi, A. EEG-based driving fatigue detection using multilevel feature extraction and iterative hybrid feature selection. Biomed. Signal Process. Control 2021, 68, 102591. [Google Scholar] [CrossRef]
- Turkoglu, M. COVIDetectioNet: COVID-19 diagnosis system based on X-ray images using features selected from pre-learned deep features ensemble. Appl. Intell. 2021, 51, 1213–1226. [Google Scholar] [CrossRef]
- Yang, W.; Wang, K.; Zuo, W. Neighborhood component feature selection for high-dimensional data. J. Comput. 2012, 7, 161–168. [Google Scholar] [CrossRef]
- Robnik-Šikonja, M.; Kononenko, I. Theoretical and empirical analysis of ReliefF and RReliefF. Mach. Learn. 2003, 53, 23–69. [Google Scholar] [CrossRef] [Green Version]
- Islam, M.T.; Imran, S.A.; Arefeen, A.; Hasan, M.; Shahnaz, C. Source and Camera Independent Ophthalmic Disease Recognition from Fundus Image Using Neural Network. In Proceedings of the 2019 IEEE International Conference on Signal Processing, Information, Communication and Systems, SPICSCON 2019, Dhaka, Bangladesh, 28–30 November 2019; pp. 59–63. [Google Scholar]
- Jordi, C.C.; Joan Manuel, N.D.R.; Carles, V.R. Ocular Disease Intelligent Recognition through Deep Learning Architectures; Universitat Oberta de Catalunya: Barcelona, Spain, 2019. [Google Scholar]
- Li, N.; Li, T.; Hu, C.; Wang, K.; Kang, H. A Benchmark of Ocular Disease Intelligent Recognition: One Shot for Multi-disease Detection. In Benchmarking, Measuring, and Optimizing, Proceedings of the Third BenchCouncil International Symposium, Bench 2020, Virtual Event, 15–16 November 2020; Springer International Publishing: Cham, Switzerland, 2021; pp. 177–193. [Google Scholar]
- He, J.; Li, C.; Ye, J.; Qiao, Y.; Gu, L. Self-speculation of clinical features based on knowledge distillation for accurate ocular disease classification. Biomed. Signal Process. Control 2021, 67, 102491. [Google Scholar] [CrossRef]
- Wang, J.; Yang, L.; Huo, Z.; He, W.; Luo, J. Multi-Label Classification of Fundus Images With EfficientNet. IEEE Access 2020, 8, 212499–212508. [Google Scholar] [CrossRef]
- Gour, N.; Khanna, P. Multi-class multi-label ophthalmological disease detection using transfer learning based convolutional neural network. Biomed. Signal Process. Control 2021, 66, 102329. [Google Scholar] [CrossRef]


| Classifier | Accuracy (%) | ||
|---|---|---|---|
| NCA | ReliefF | NCAR | |
| DT | 80.15 | 81.28 | 81.95 |
| LD | 78.76 | 79.87 | 80.35 |
| NB | 75.85 | 76.34 | 76.94 |
| SVM | 89.28 | 89.35 | 89.54 |
| KNN | 88.56 | 88.94 | 89.34 |
| Class | Sensitivity | Specificity | Precision | F-Score |
|---|---|---|---|---|
| AMD | 0.8020 | 0.9996 | 0.9916 | 0.8868 |
| Cataract | 0.8264 | 0.9991 | 0.9777 | 0.8957 |
| Diabetes | 0.8285 | 0.9846 | 0.9417 | 0.8815 |
| Glaucoma | 0.7946 | 1.0000 | 1.0000 | 0.8856 |
| Hypertension | 0.9239 | 0.9991 | 0.9444 | 0.9341 |
| Normal | 0.9777 | 0.8275 | 0.8421 | 0.9049 |
| Other Disease | 0.7977 | 0.9965 | 0.9723 | 0.8764 |
| PM | 0.8802 | 0.9996 | 0.9907 | 0.9322 |
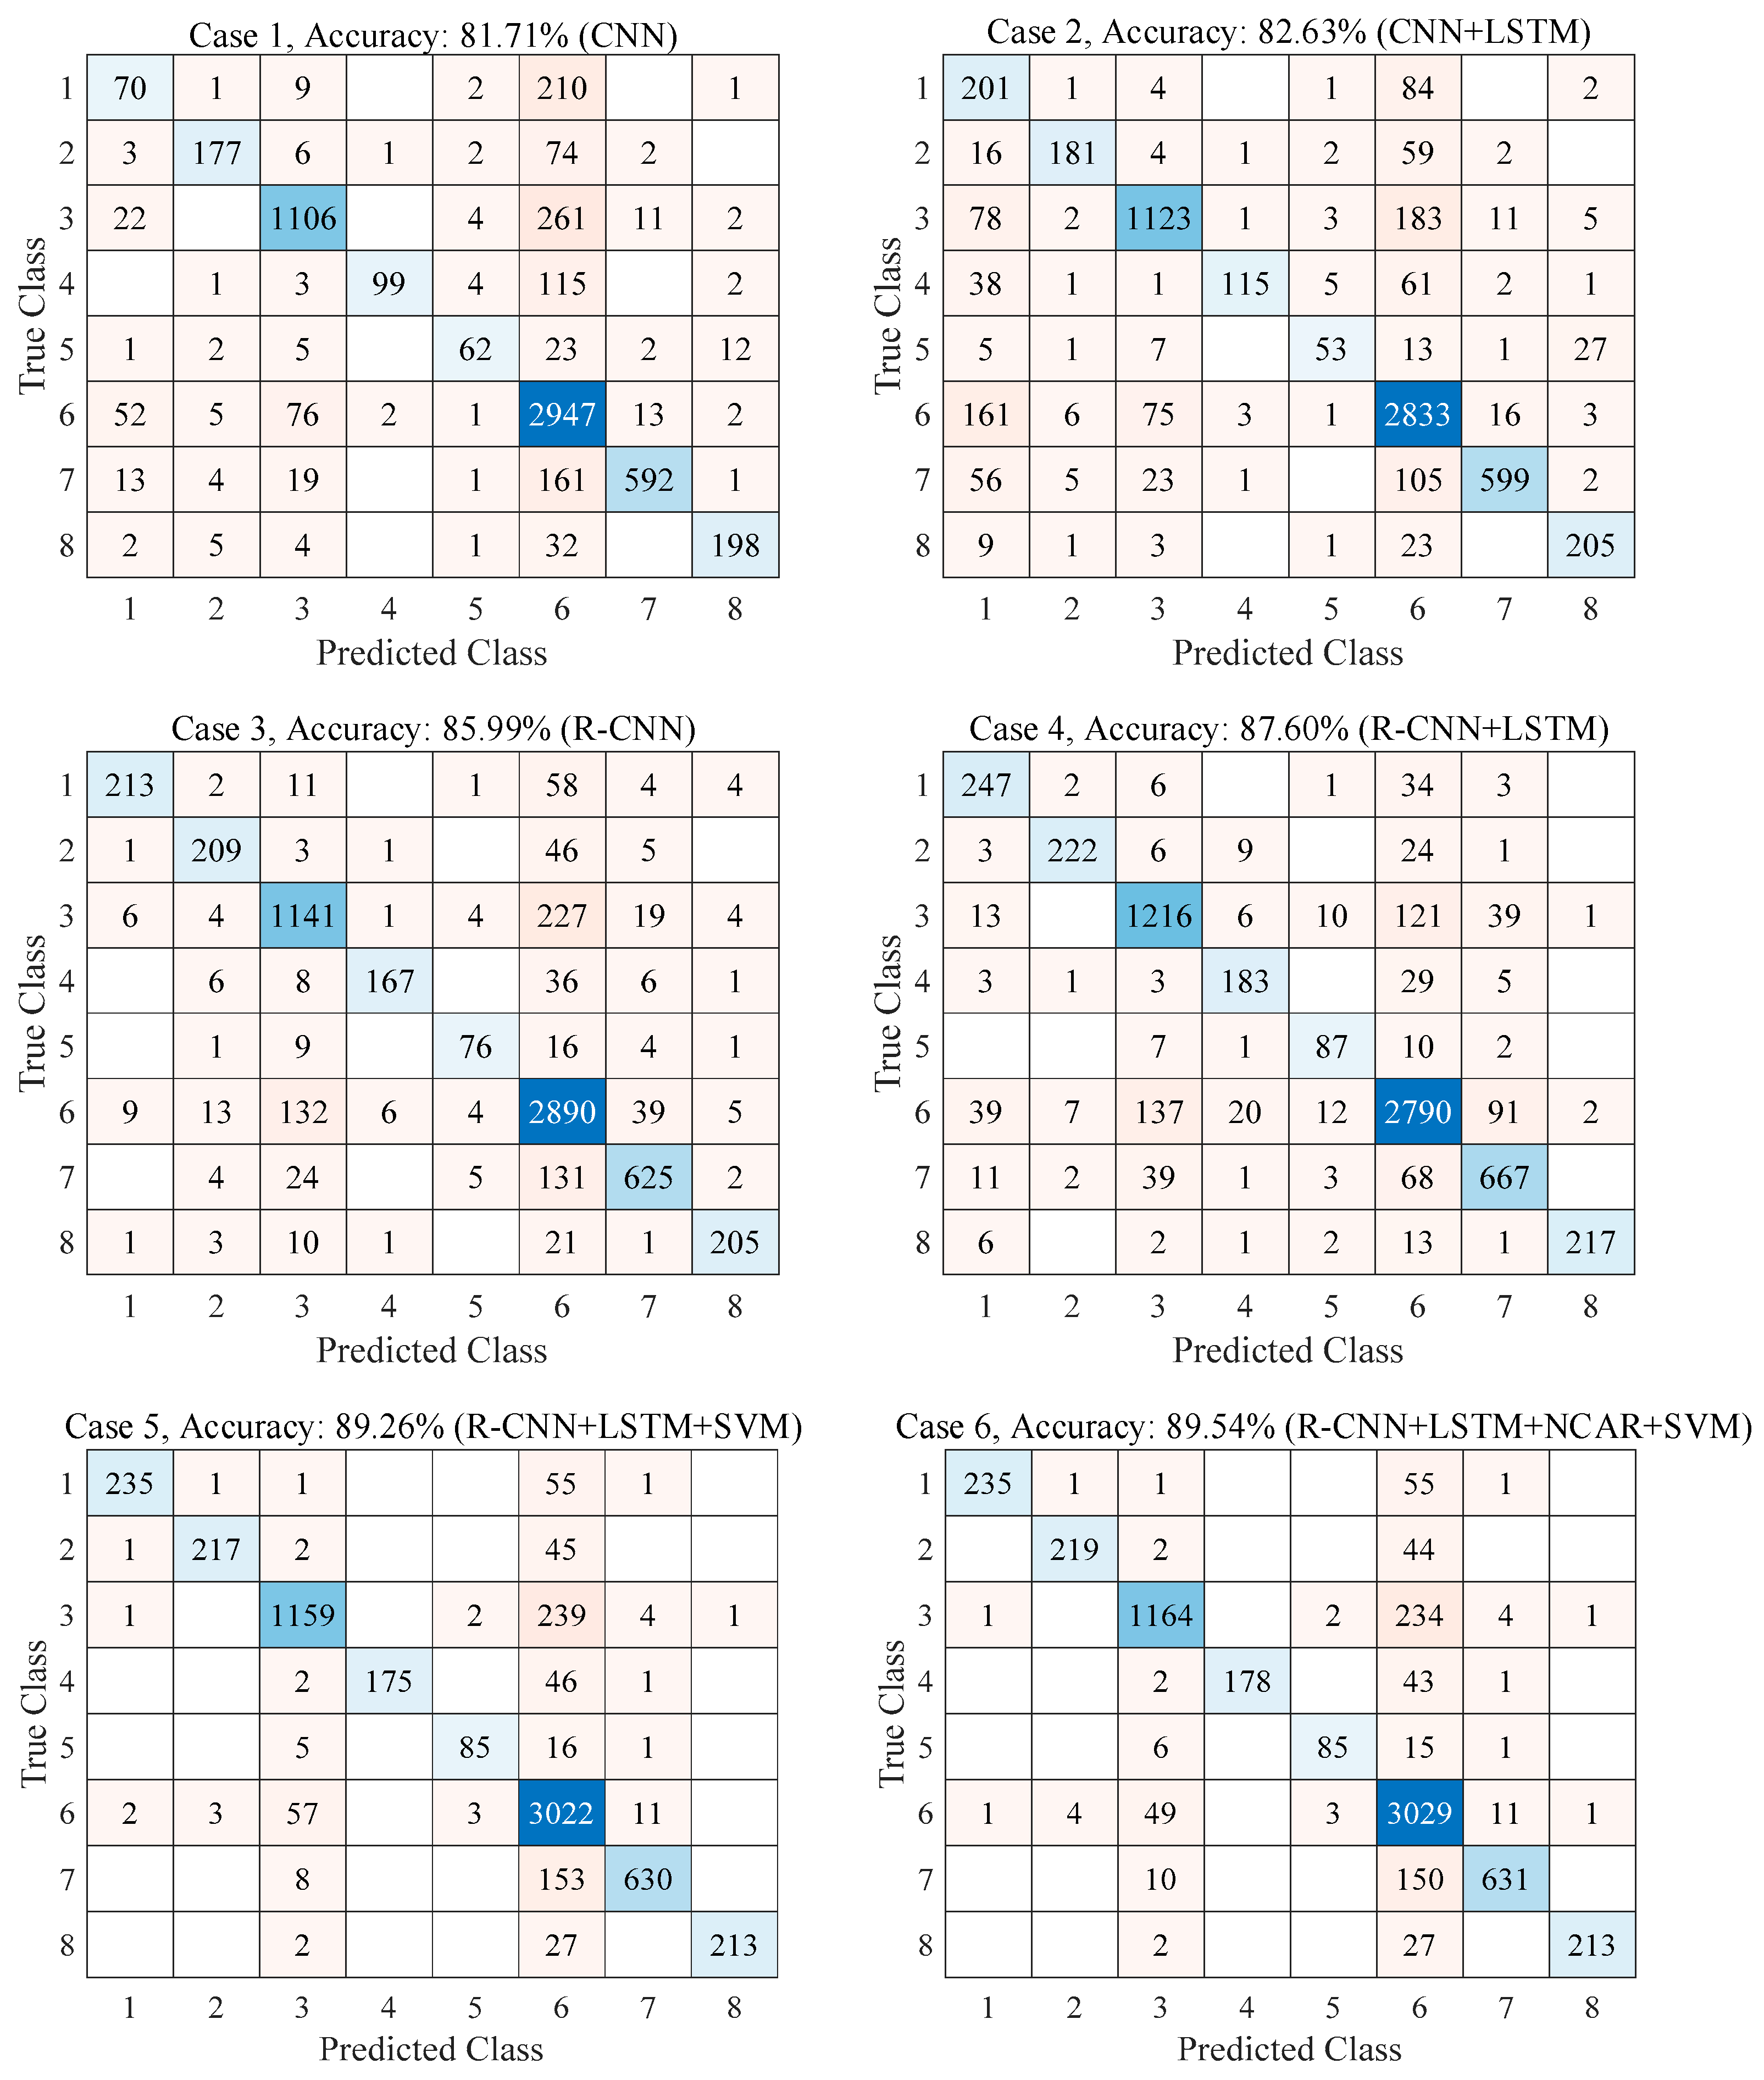
| Class | No Feature Selection | NCAR Feature Selection |
|---|---|---|
| CNN | 0.8171 | 0.8225 |
| CNN+LSTM | 0.8263 | 0.8375 |
| R-CNN | 0.8599 | 0.8725 |
| R-CNN+LSTM | 0.8760 | 0.8890 |
| R-CNN+LSTM+SVM | 0.8926 | 0.8954 |
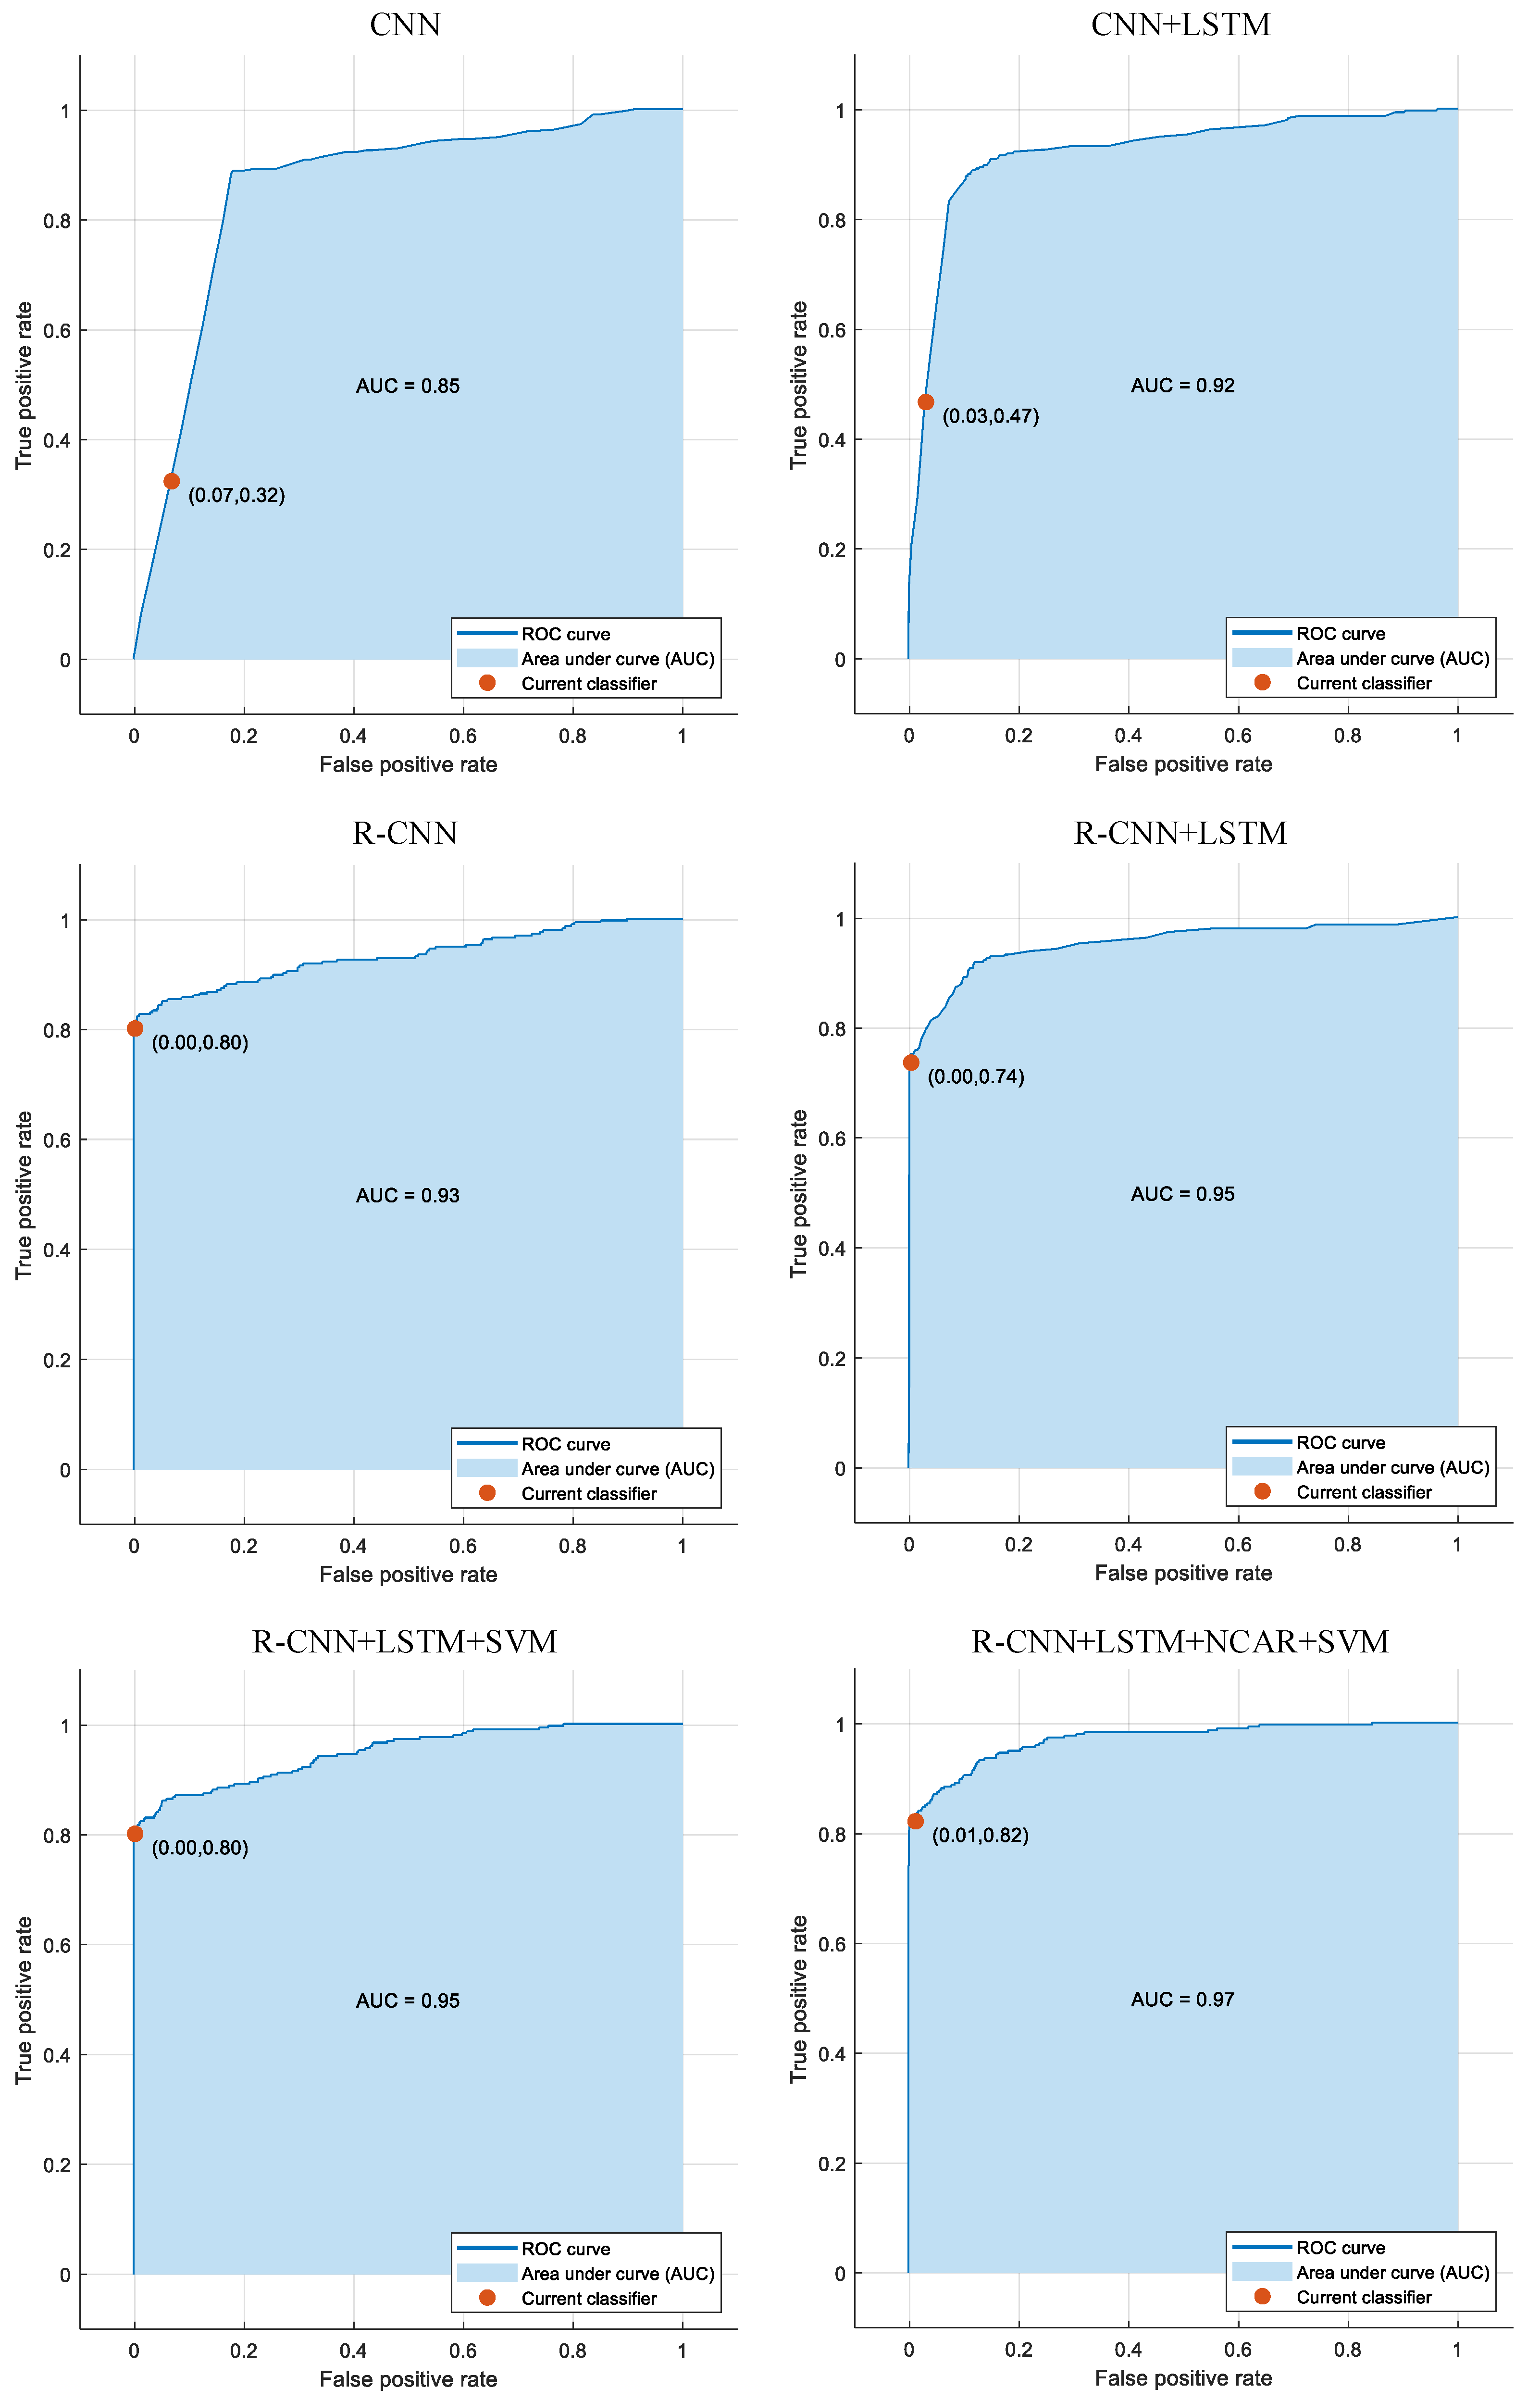
| Author | Method | AUC (%) | F-Score (%) |
|---|---|---|---|
| Islam et al. [40] | CNN | 80.50 | 85.00 |
| Jordi et al. [41] | VGG16 | 88.71 | 81.76 |
| Li et al. [42] | ResNet101 | 93.00 | 91.30 |
| Wang et al. [44] | EffifinetB3 | 73.00 | 89.00 |
| He et al. [43] | ResNet models | 92.70 | 90.70 |
| Gour and Khanna [45] | Two I/P VGG16 | 84.93 | 85.57 |
| Proposed Approach | (R-CNN+LSTM)+NCAR+SVM | 97.00 | 89.97 |
| Model | Accuracy (%) | AUC (%) | F-Score (%) |
|---|---|---|---|
| ResNet [45] | 85.52 | 71.96 | 84.15 |
| InceptionV3 [45] | 83.98 | 77.16 | 85.47 |
| MobileNet [45] | 85.81 | 71.42 | 85.50 |
| EfficentB3 [44] | 89.00 | 73.00 | 89.00 |
| VGG16 [45] | 89.06 | 84.93 | 85.57 |
| Proposed Approach | 89.54 | 97.00 | 89.97 |
| Class↓/Metrics→ | Sensitivity | Specificity | ||
|---|---|---|---|---|
| Gour and Khanna [45] | Proposed Approach | Gour and Khanna [45] | Proposed Approach | |
| AMD | 0.94 | 0.8020 | 0.93 | 0.99 |
| Cataract | 0.96 | 0.8264 | 1.00 | 0.99 |
| Diabetes | 0.93 | 0.8285 | 0.94 | 0.98 |
| Glaucoma | 0.67 | 0.7946 | 0.60 | 1.00 |
| Hypertension | 0.95 | 0.9239 | 0.99 | 0.99 |
| Normal | 0.66 | 0.9777 | 0.21 | 0.82 |
| Other Disease | 0.73 | 0.7977 | 0.32 | 0.99 |
| Myopia | 0.94 | 0.8802 | 0.94 | 0.99 |
Publisher’s Note: MDPI stays neutral with regard to jurisdictional claims in published maps and institutional affiliations. |
© 2021 by the authors. Licensee MDPI, Basel, Switzerland. This article is an open access article distributed under the terms and conditions of the Creative Commons Attribution (CC BY) license (https://creativecommons.org/licenses/by/4.0/).
Share and Cite
Demir, F.; Taşcı, B. An Effective and Robust Approach Based on R-CNN+LSTM Model and NCAR Feature Selection for Ophthalmological Disease Detection from Fundus Images. J. Pers. Med. 2021, 11, 1276. https://doi.org/10.3390/jpm11121276
Demir F, Taşcı B. An Effective and Robust Approach Based on R-CNN+LSTM Model and NCAR Feature Selection for Ophthalmological Disease Detection from Fundus Images. Journal of Personalized Medicine. 2021; 11(12):1276. https://doi.org/10.3390/jpm11121276
Chicago/Turabian StyleDemir, Fatih, and Burak Taşcı. 2021. "An Effective and Robust Approach Based on R-CNN+LSTM Model and NCAR Feature Selection for Ophthalmological Disease Detection from Fundus Images" Journal of Personalized Medicine 11, no. 12: 1276. https://doi.org/10.3390/jpm11121276
APA StyleDemir, F., & Taşcı, B. (2021). An Effective and Robust Approach Based on R-CNN+LSTM Model and NCAR Feature Selection for Ophthalmological Disease Detection from Fundus Images. Journal of Personalized Medicine, 11(12), 1276. https://doi.org/10.3390/jpm11121276