
The Herbal Formula CWBSD Improves Sleep Quality Dependent on Oral Microbial Type and Tongue Diagnostic Features in Insomnia

 , , and
Abstract
:1. Introduction
2. Materials and Methods
2.1. Study Design
2.2. Medication
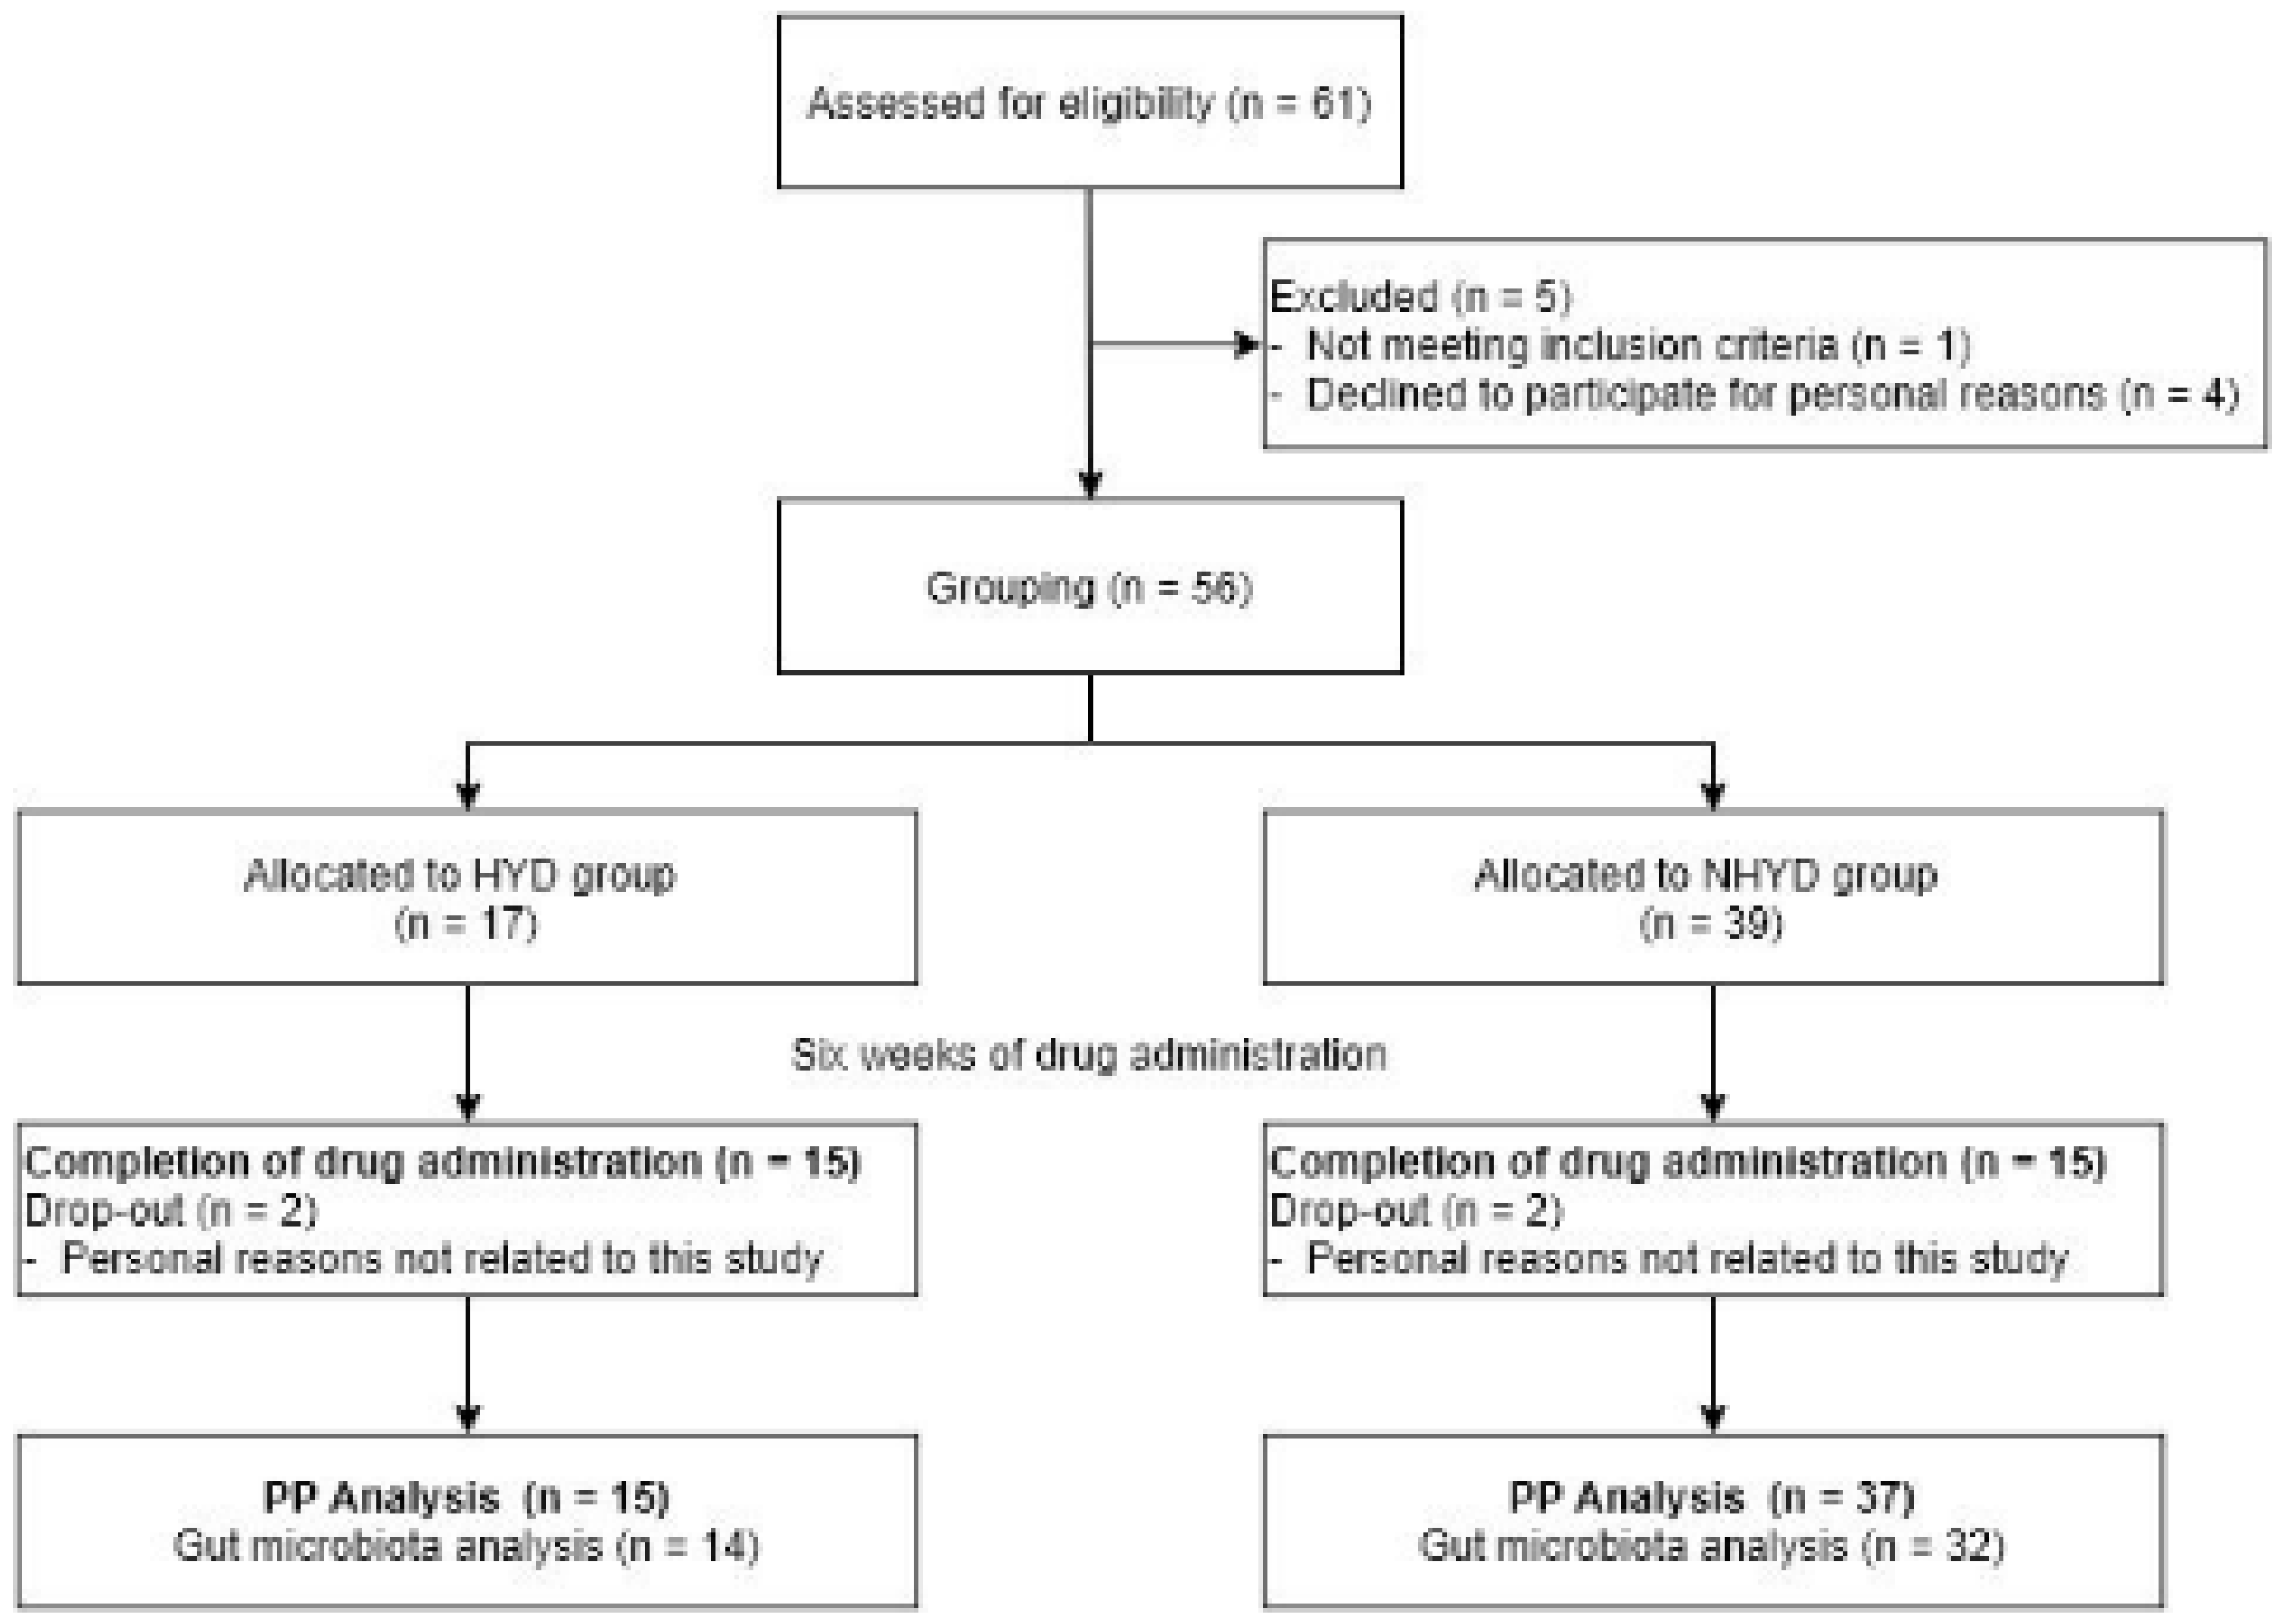
2.3. Subjects
2.4. Identification of the TKM Pattern
2.5. Analysis of Sleep Patterns
2.6. Analyses of Cardiac Function and Autonomic Nerve Function
2.7. Analysis of Tongue Features
2.8. Oral Microbial Analysis
2.9. Analyses of Blood Parameters
2.10. Statistical Analysis
3. Results
3.1. Baseline Characteristics of the Subjects and Adverse Events
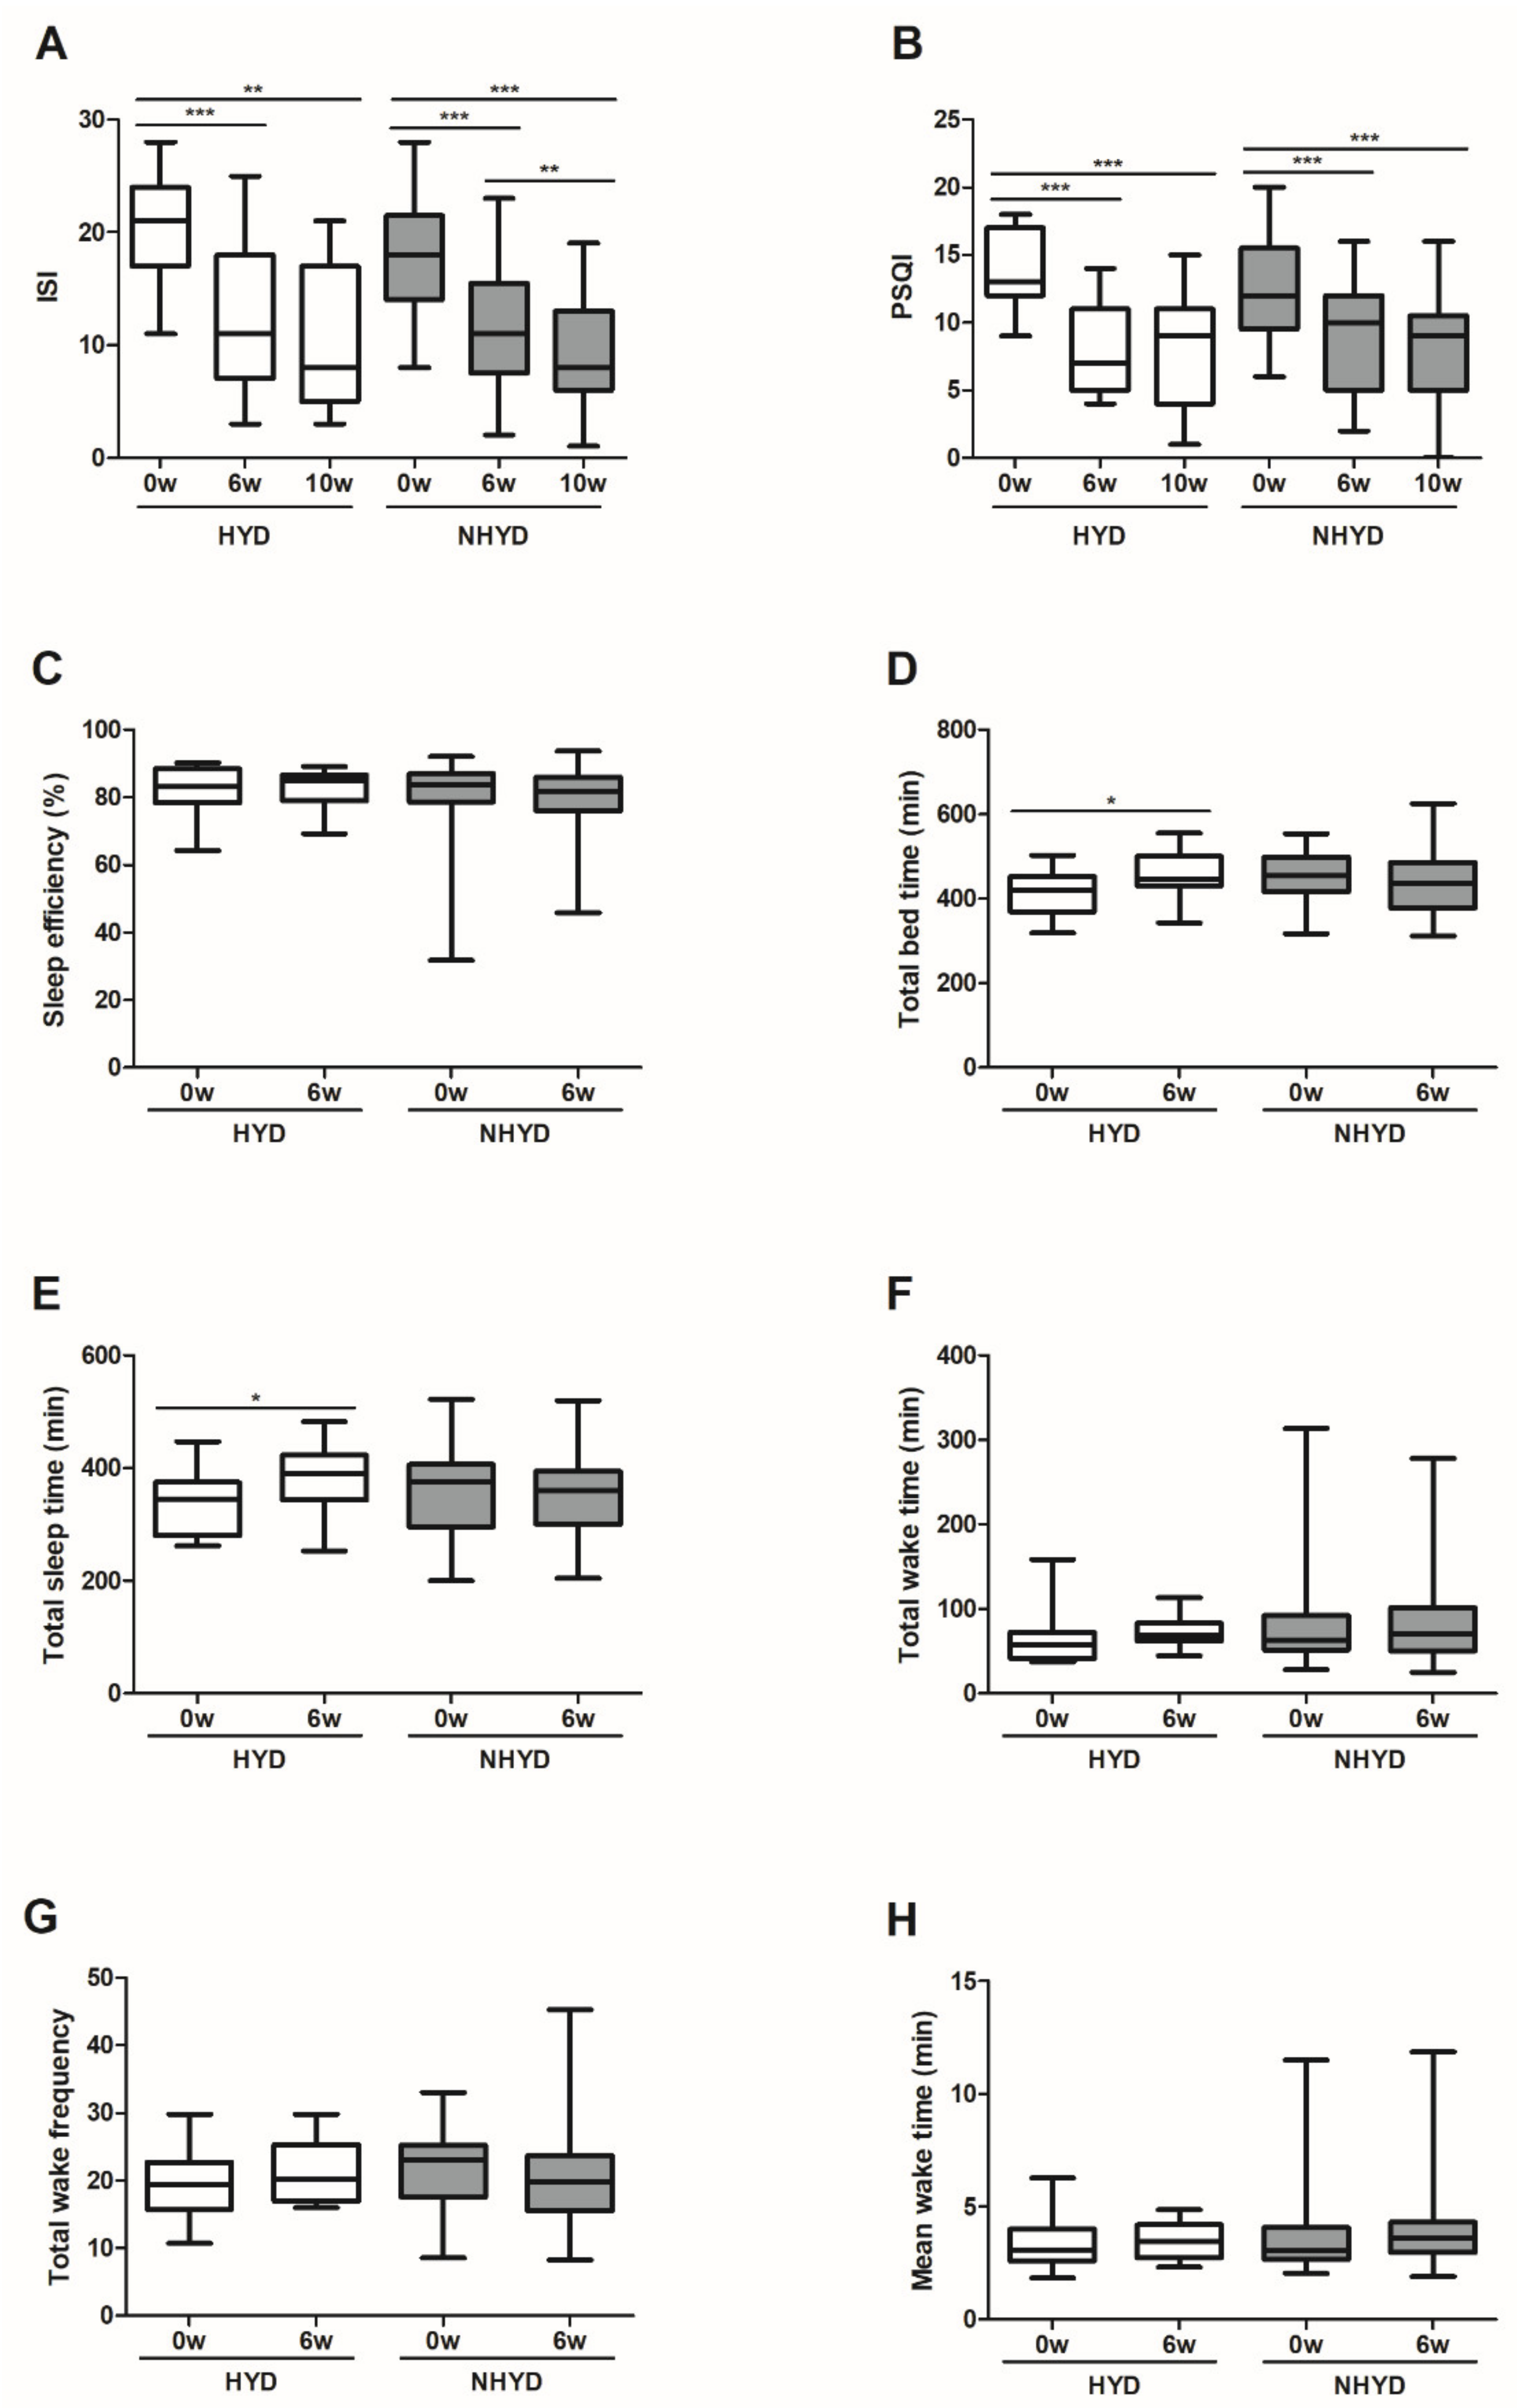
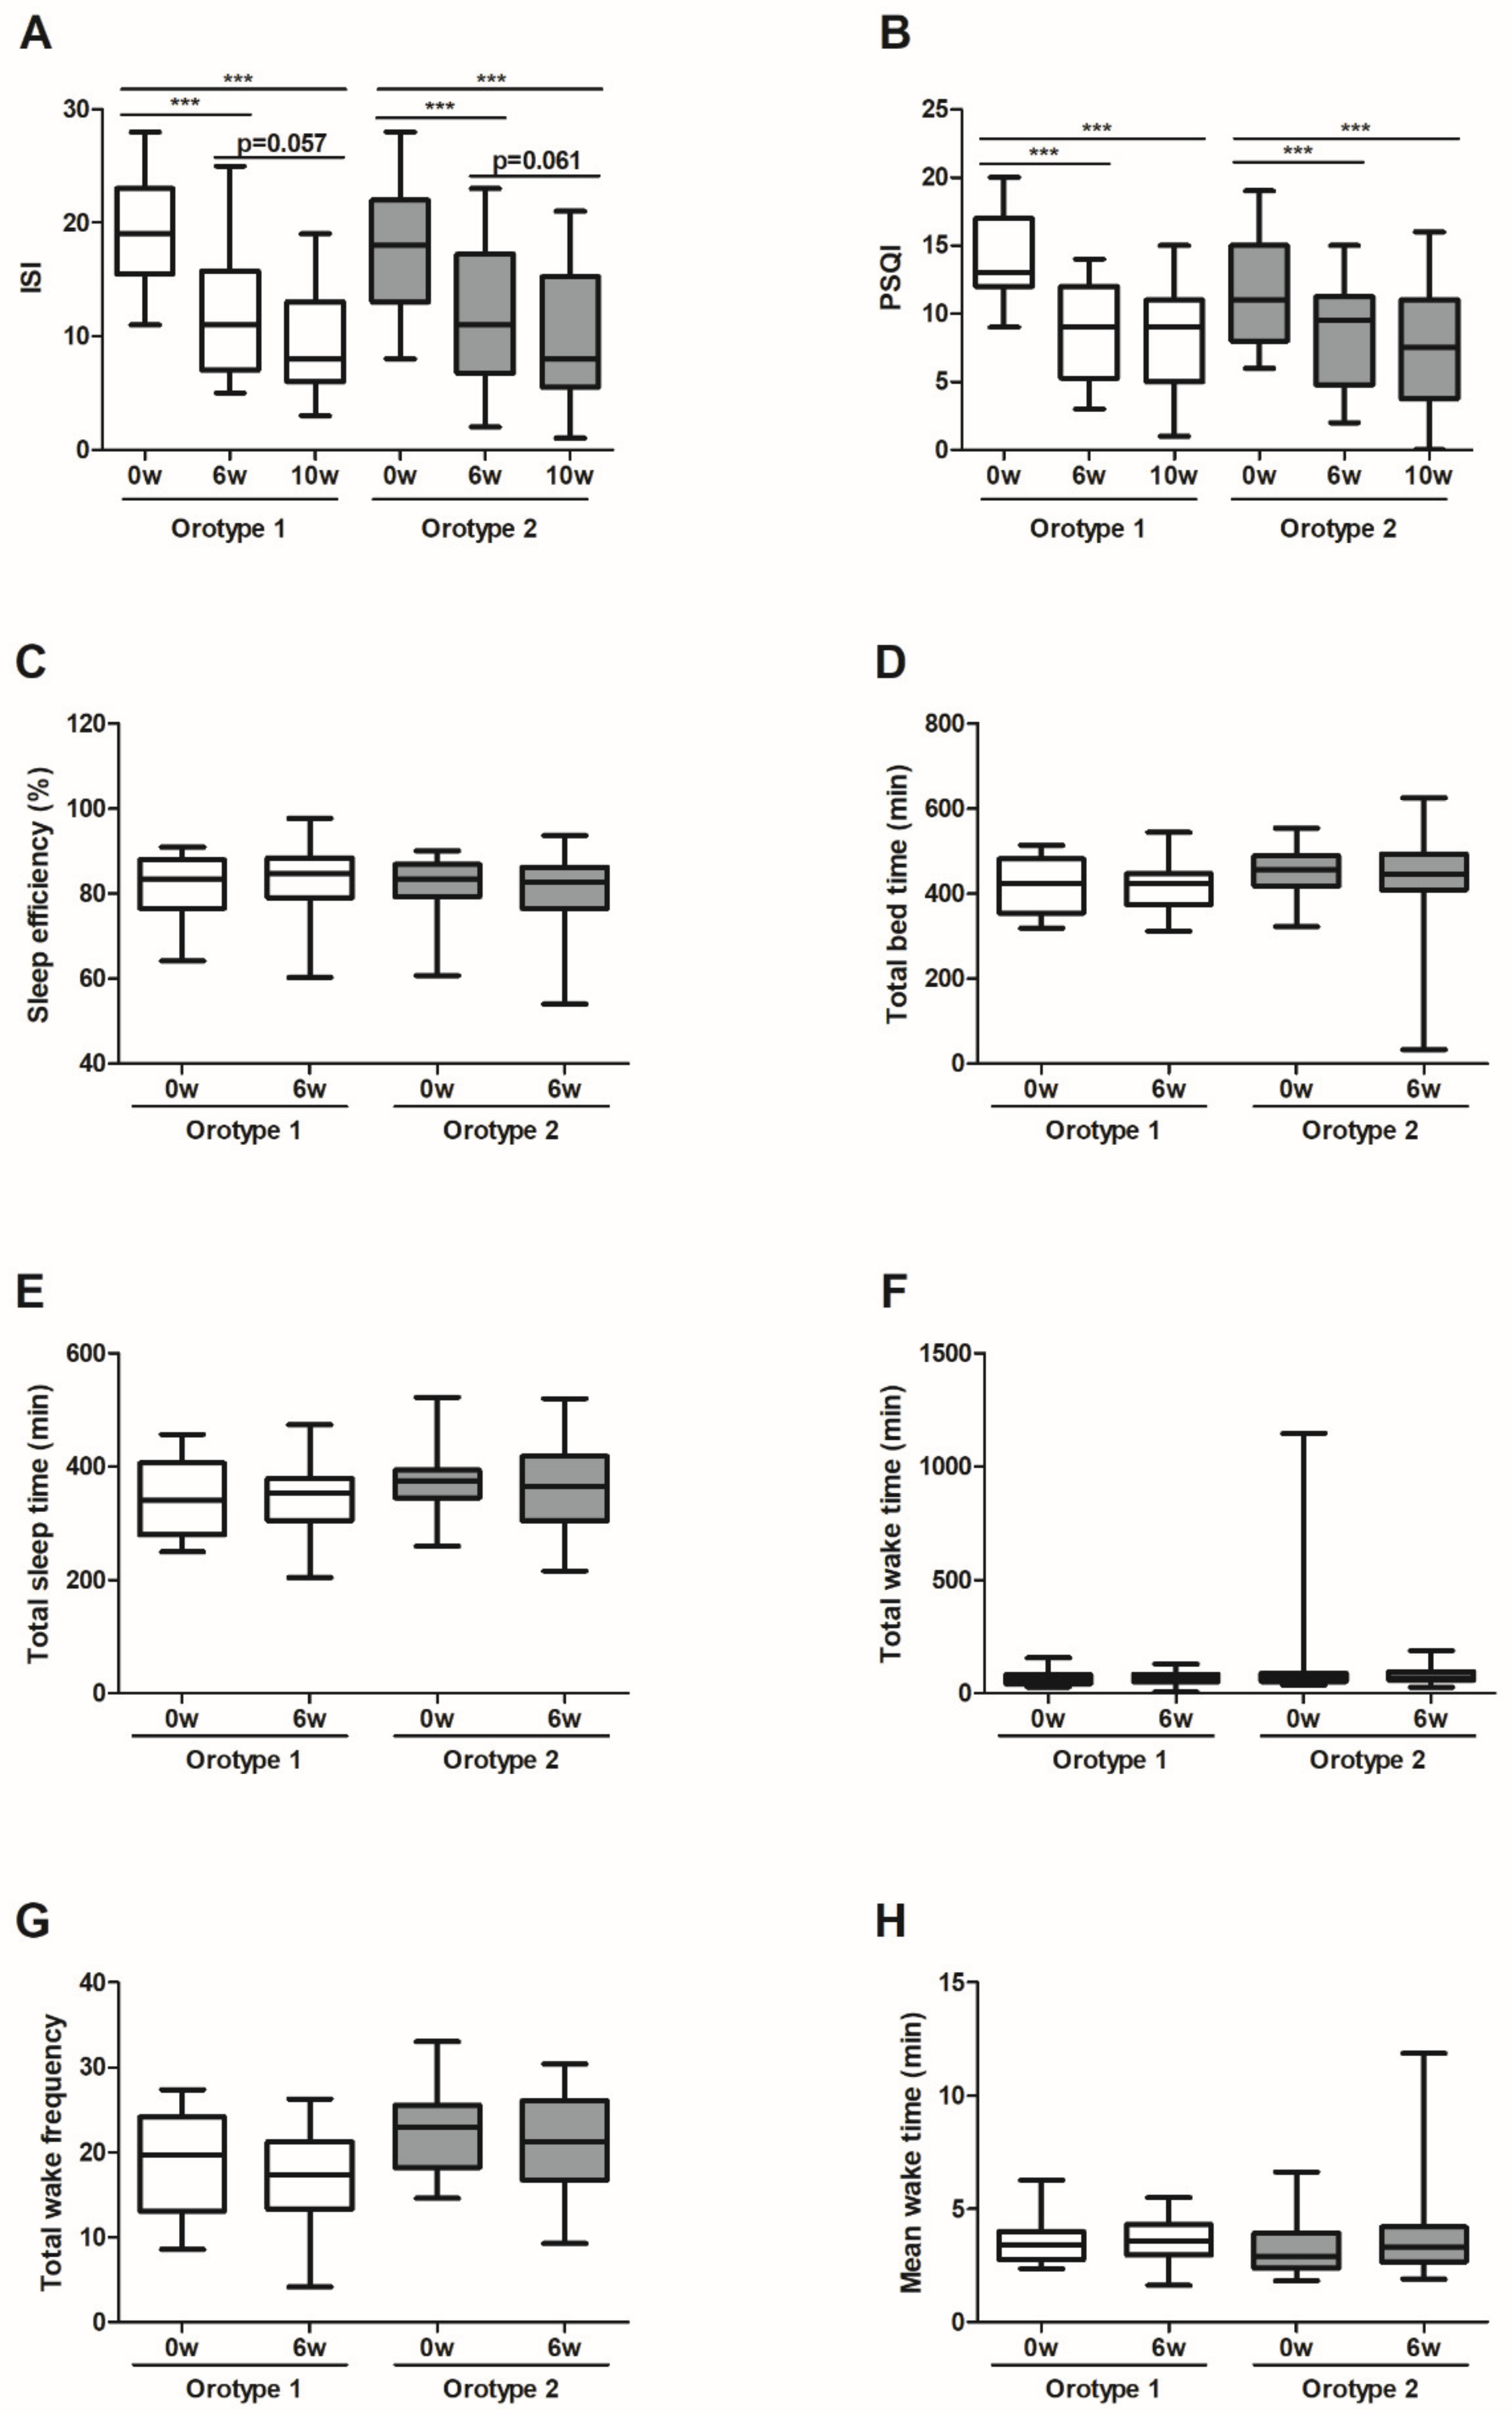
3.2. CWBSD Treatment Improved Sleep Quality Objectively and Subjectively
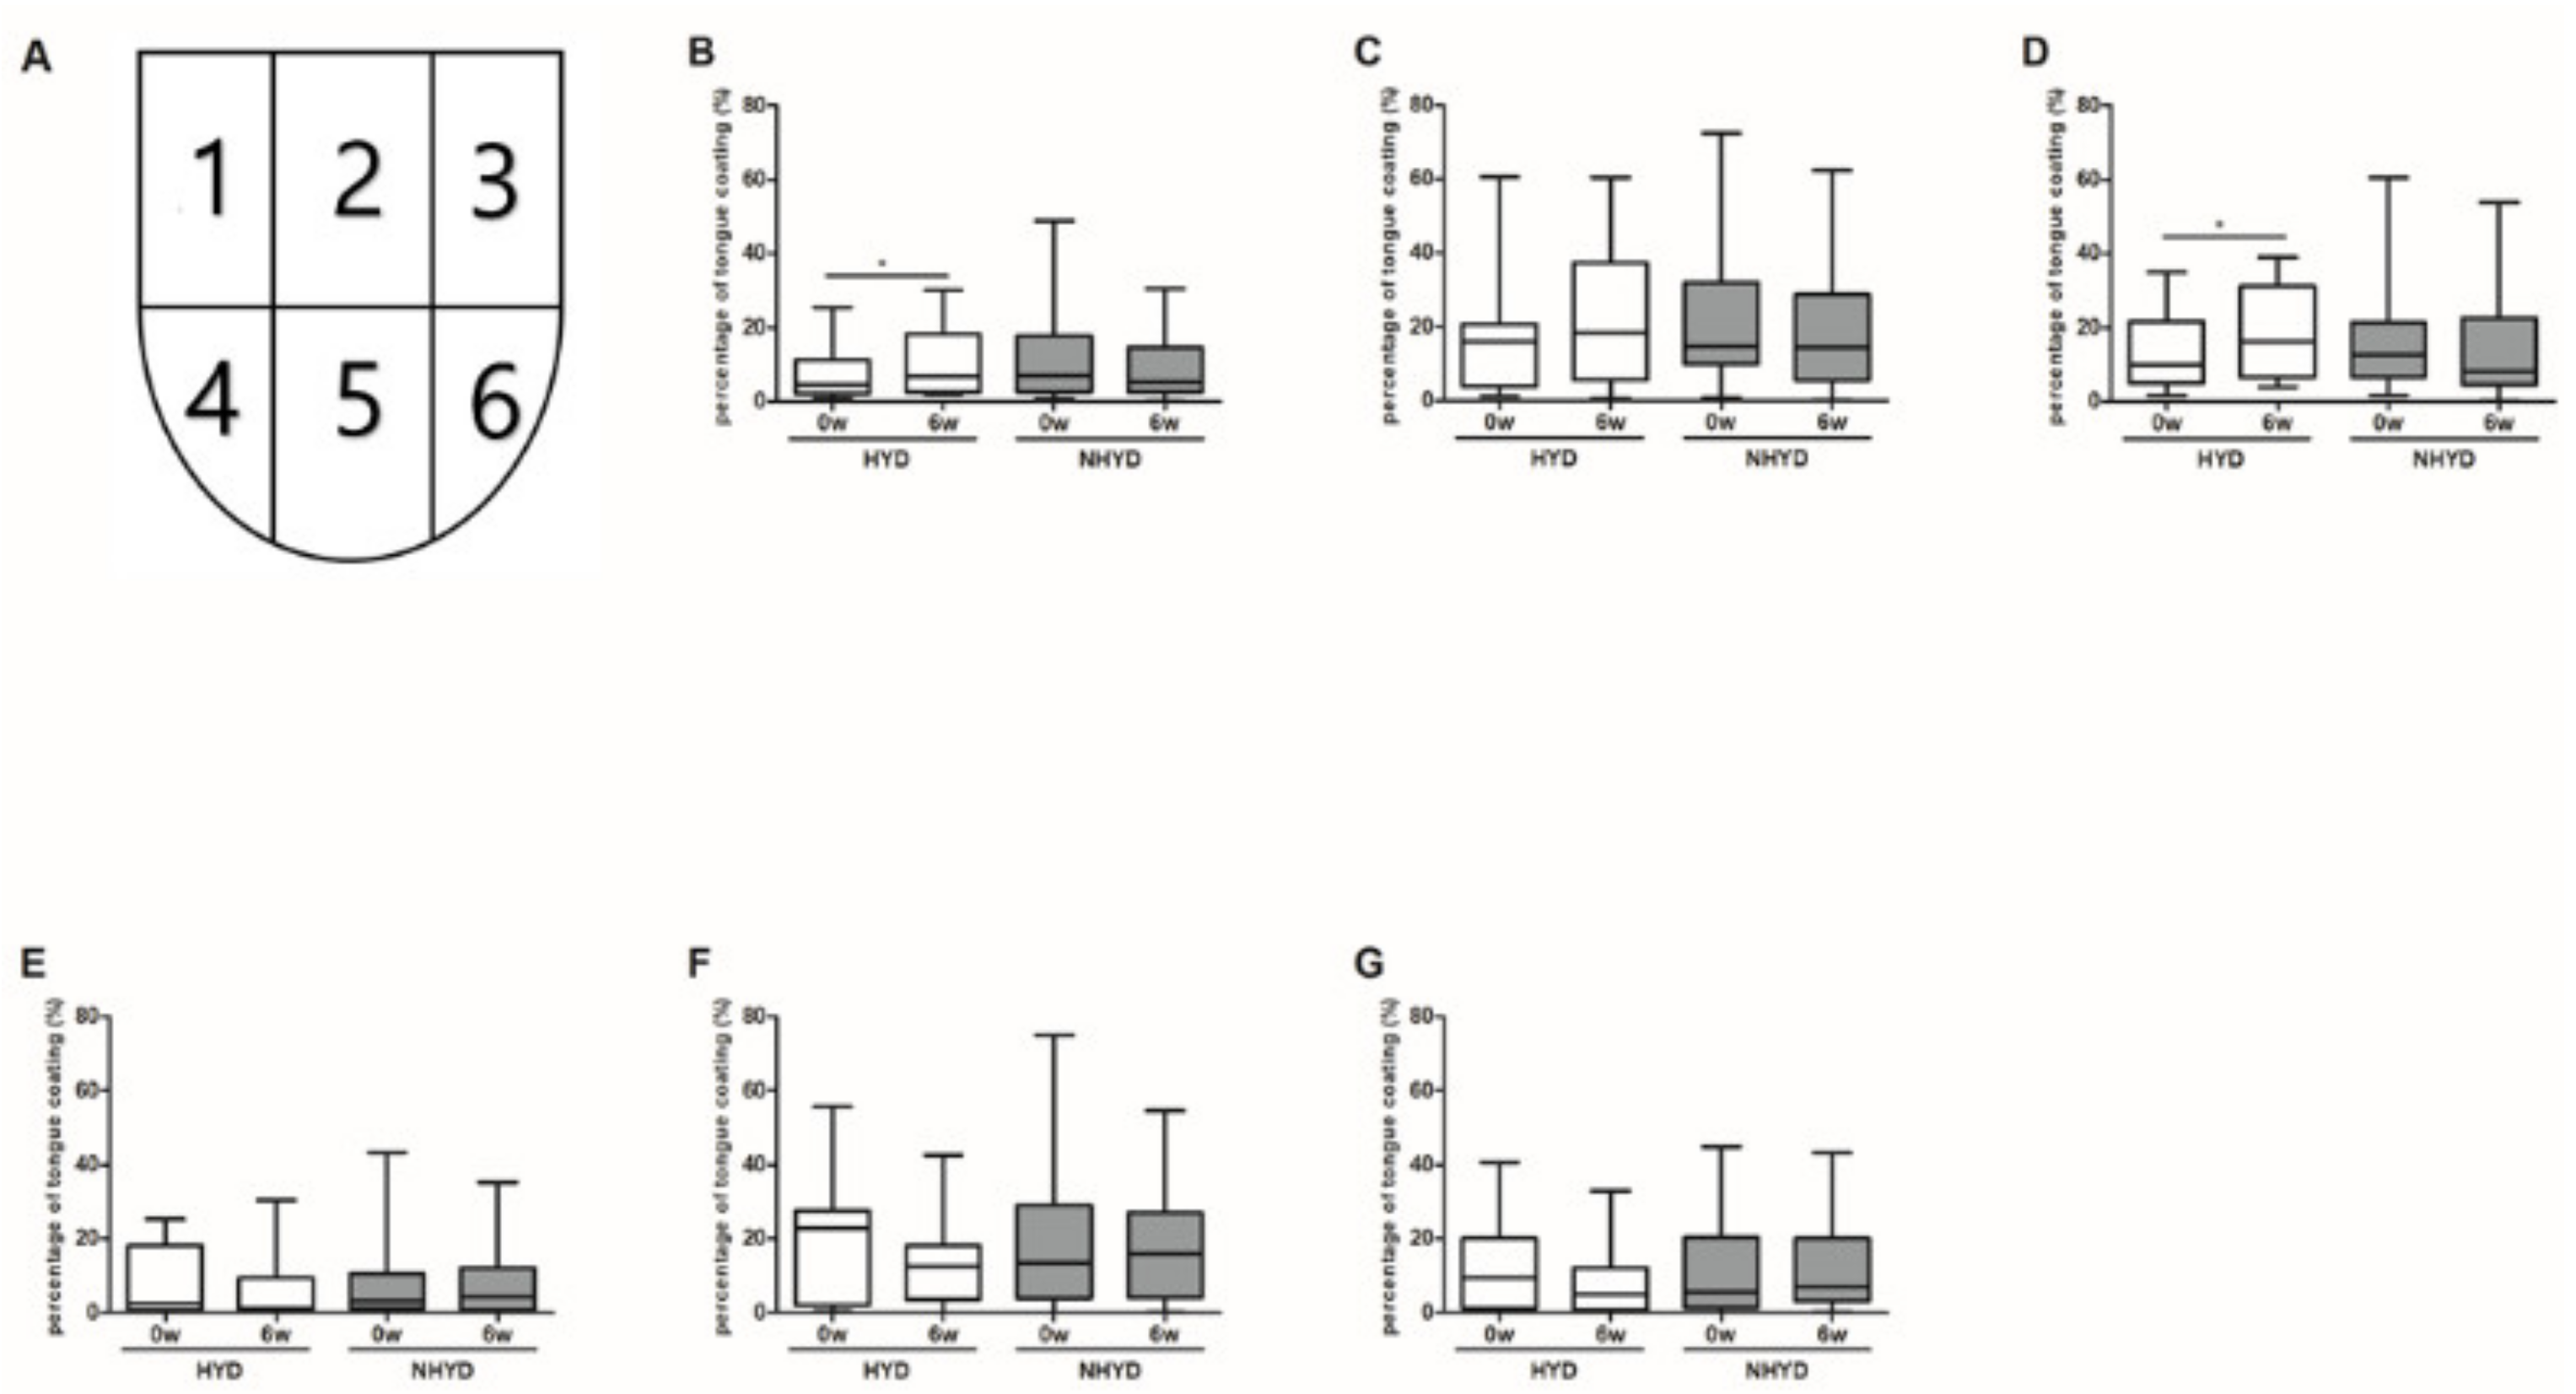
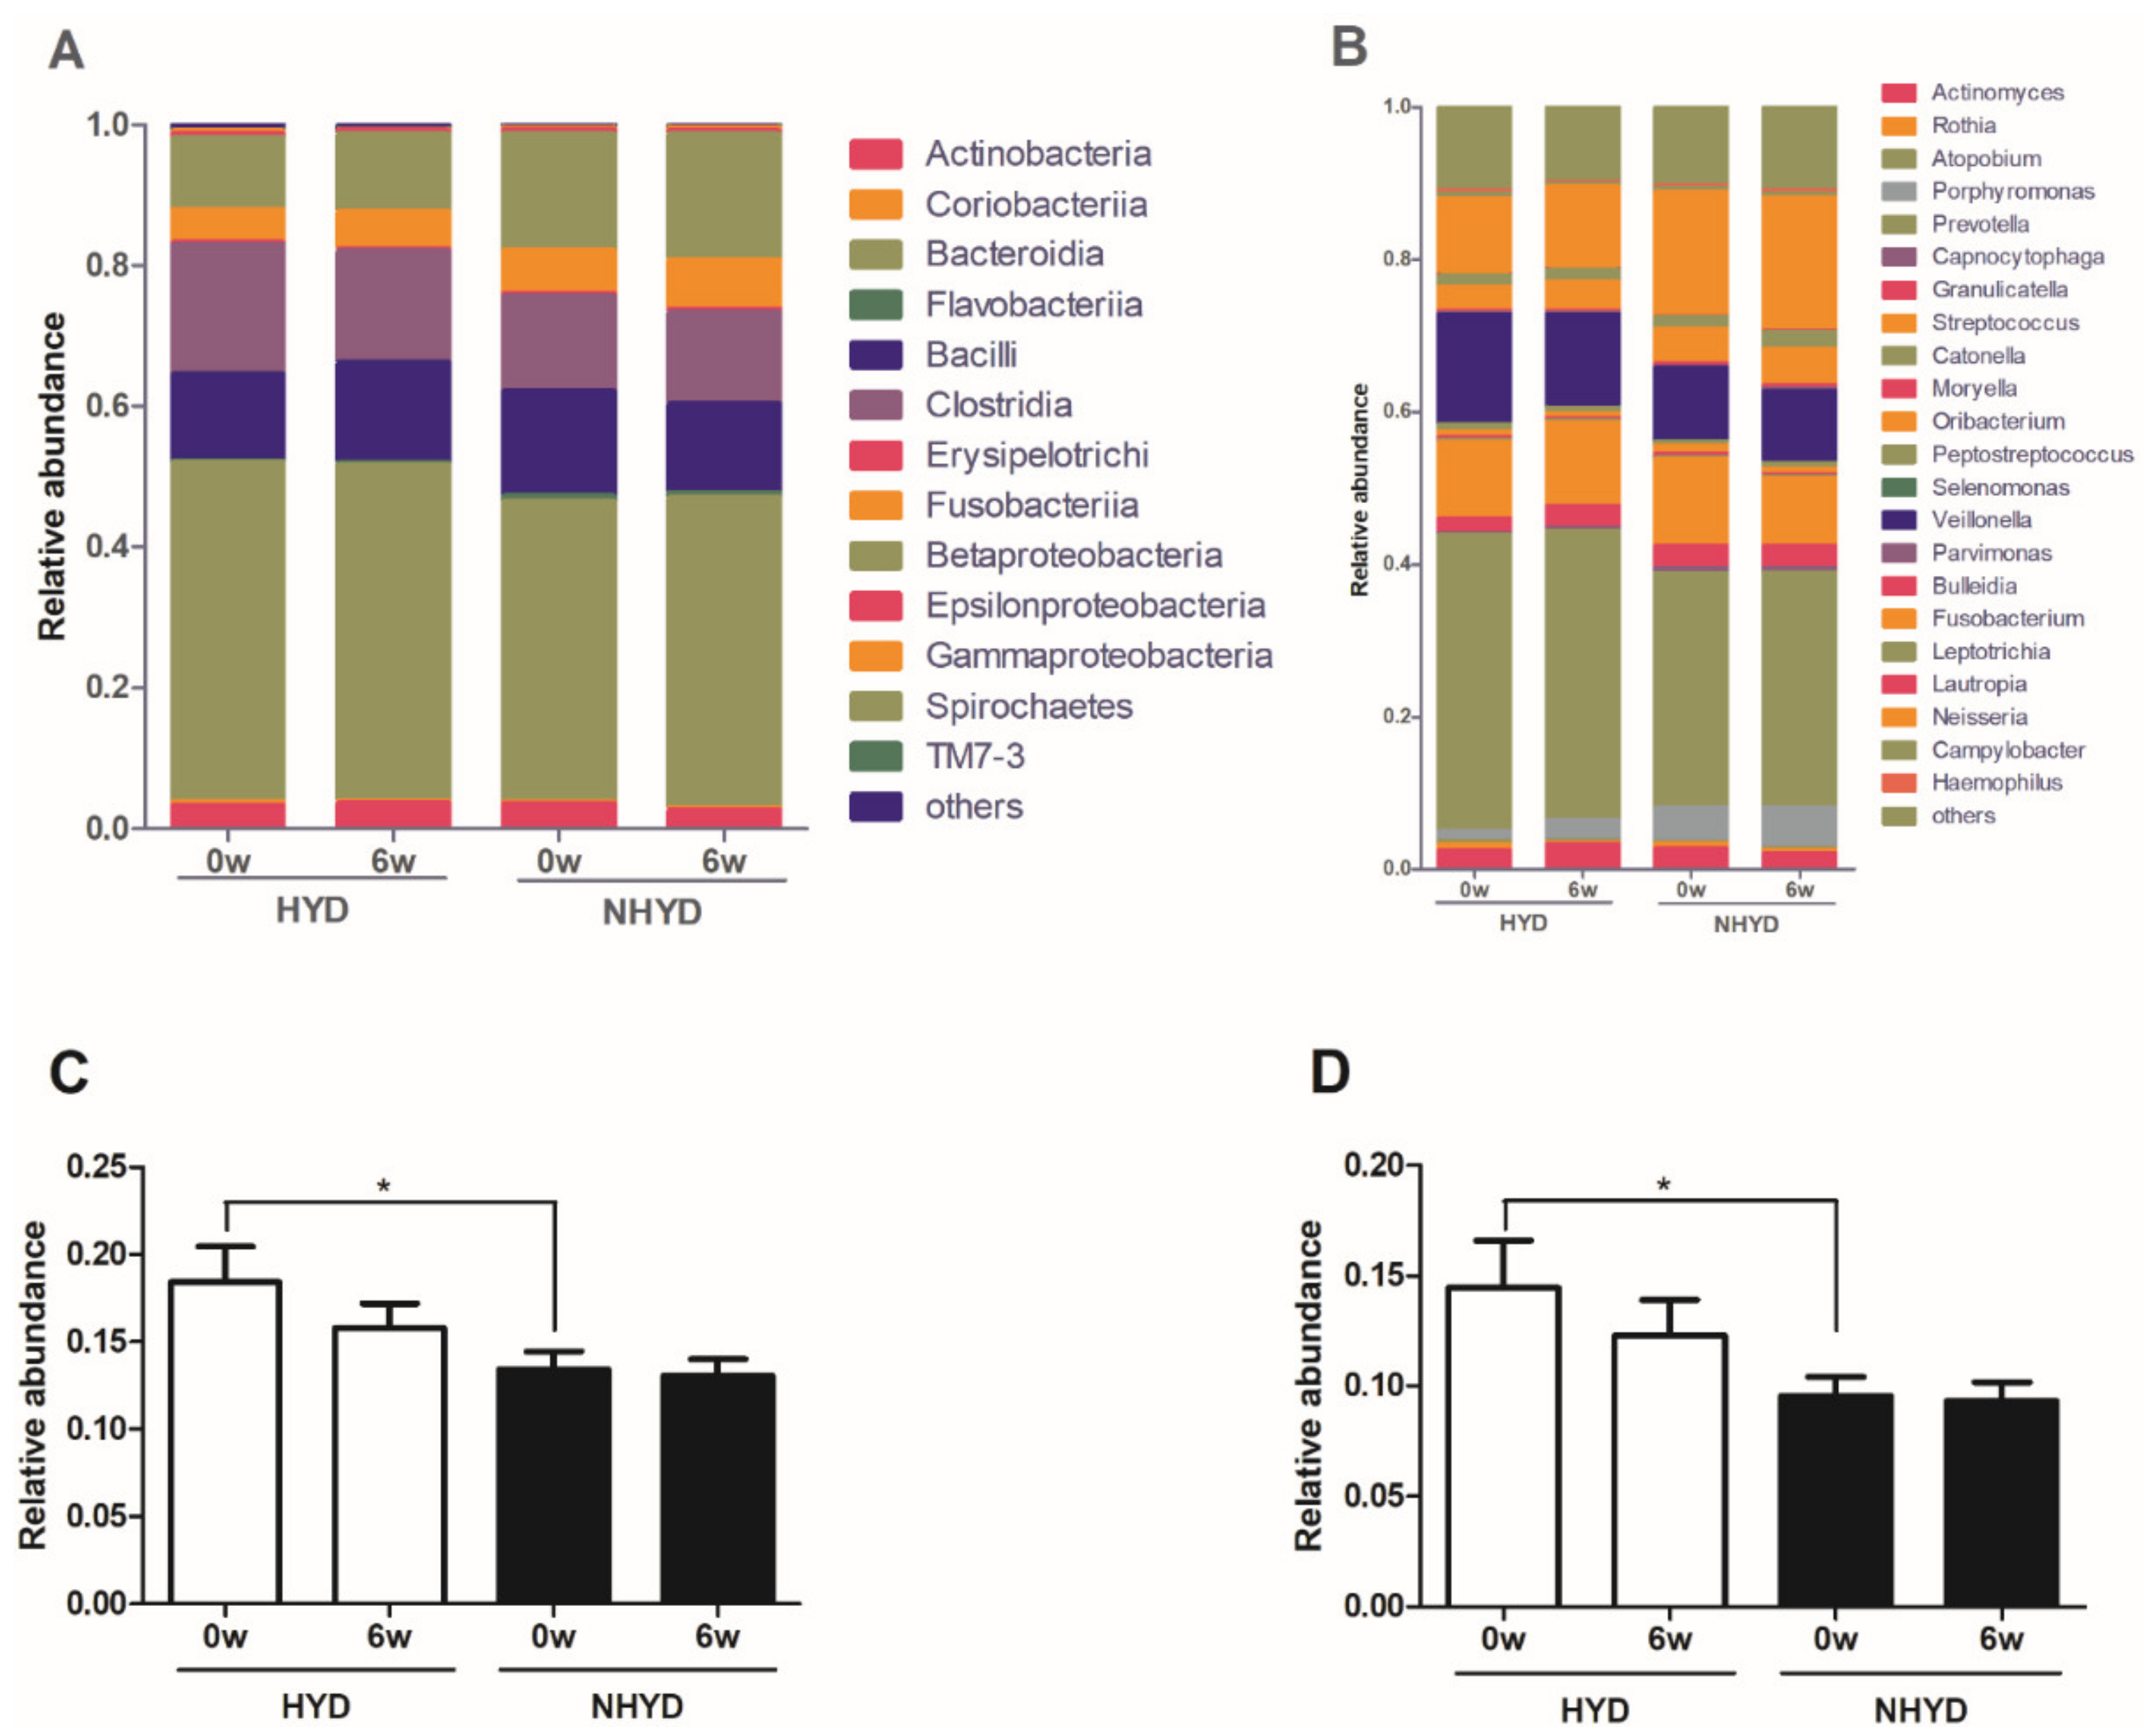
3.3. CWBSD Treatment Changed Tongue Coating Distribution, Especially in the HYD Group
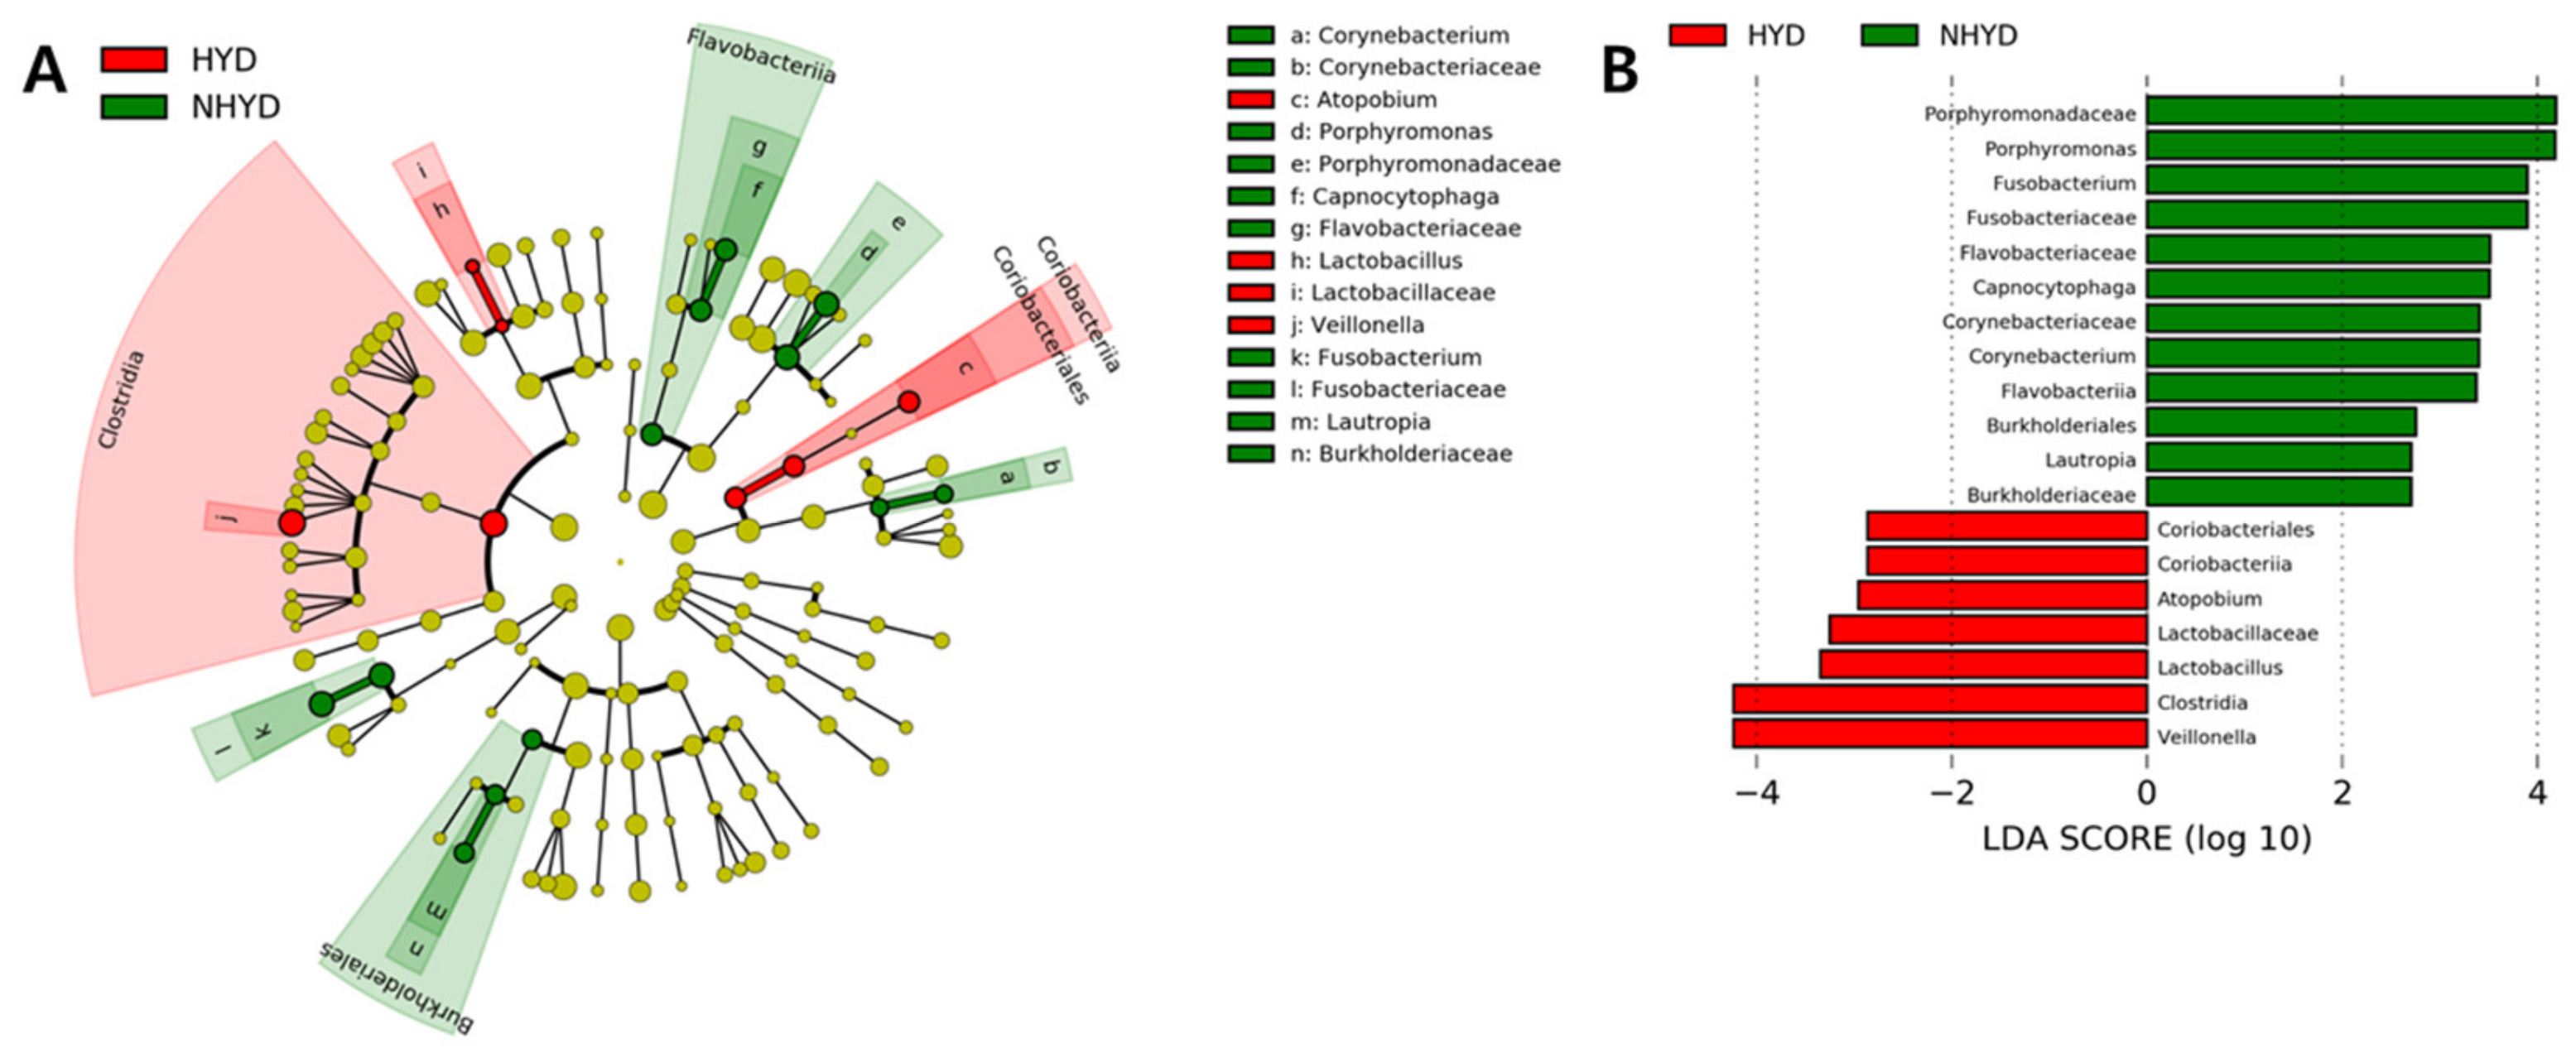
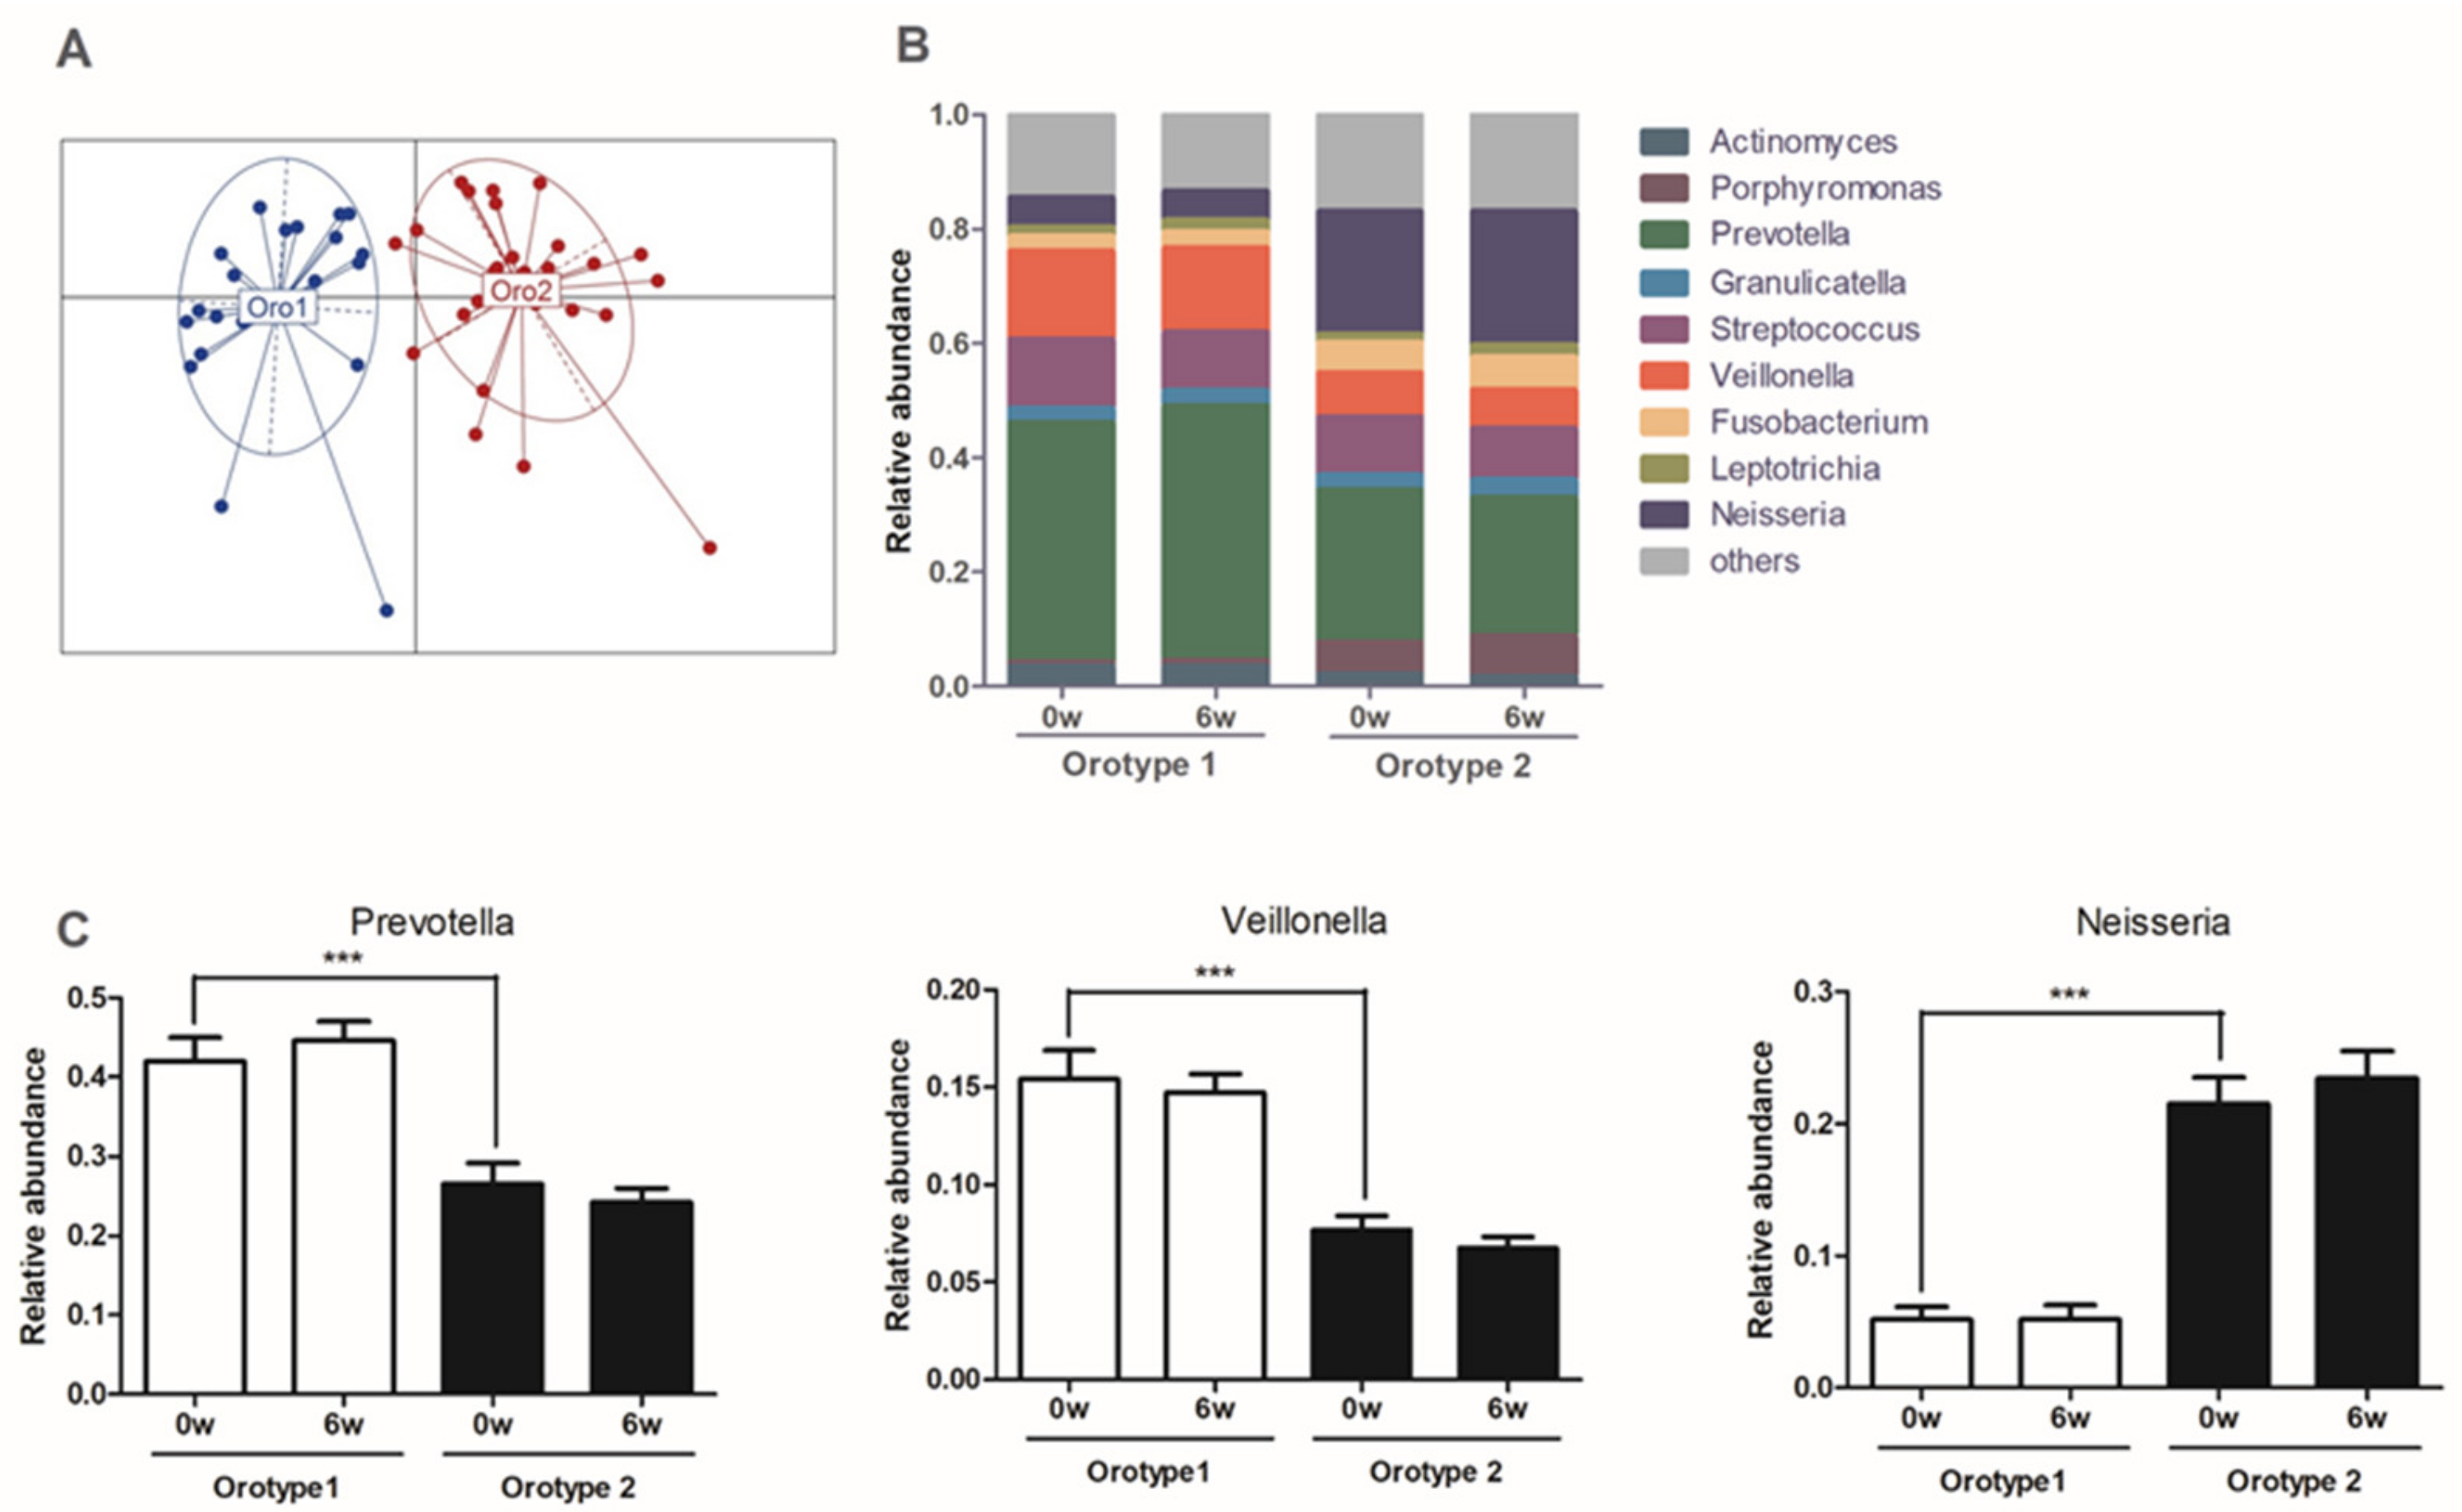
3.4. Oral Microbiota Patterns at Baseline and Changes in Oral Microbial Compositions after CWBSD Administration
3.5. Correlation between Clinical Parameters and Oral Microbiota Distributions
3.6. CWBSD Did Not Affect Cardiac Function, Autonomic Nerve Function, or Blood Parameters
3.7. Sleep Quality at Baseline, CWBSD Responsiveness, and Microbial Compositions of Orotypes
3.8. Equation Predicting CWBSD Response
4. Discussion
5. Conclusions
Supplementary Materials
Author Contributions
Funding
Institutional Review Board Statement
Informed Consent Statement
Data Availability Statement
Conflicts of Interest
Abbreviations
References
- Do, L. American Psychiatric Association diagnostic and statistical manual of mental disorders (DSM-IV). In Encyclopedia of Child Behavior and Development; Springer: Boston, MA, USA, 2011; pp. 84–85. [Google Scholar]
- American Psychiatric Association. Diagnostic and Statistical Manual of Mental Disorders: DSM-5; American Psychiatric Association: Washington, DC, USA, 2013. [Google Scholar]
- Cho, Y.W.; Shin, W.C.; Yun, C.H.; Hong, S.B.; Kim, J.; Earley, C.J. Epidemiology of insomnia in Korean adults: Prevalence and associated factors. J. Clin. Neurol. 2009, 5, 20–23. [Google Scholar] [CrossRef] [Green Version]
- Cao, X.-L.; Wang, S.-B.; Zhong, B.-L.; Zhang, L.; Ungvari, G.S.; Ng, C.H.; Li, L.; Chiu, H.F.; Lok, G.K.; Lu, J.-P. The prevalence of insomnia in the general population in China: A meta-analysis. PLoS ONE 2017, 12, e0170772. [Google Scholar] [CrossRef]
- Roth, T.; Coulouvrat, C.; Hajak, G.; Lakoma, M.D.; Sampson, N.A.; Shahly, V.; Shillington, A.C.; Stephenson, J.J.; Walsh, J.K.; Kessler, R.C. Prevalence and perceived health associated with insomnia based on DSM-IV-TR; international statistical classification of diseases and related health problems, tenth revision; and research diagnostic criteria/international classification of sleep disorders, criteria: Results from the America insomnia survey. Biol. Psychiatry 2011, 69, 592–600. [Google Scholar]
- Ahn, D.H. Insomnia: Causes and diagnosis. Hanyang Med. Rev. 2013, 33, 203–209. [Google Scholar] [CrossRef]
- Bonnet, M.H. Evidence for the pathophysiology of insomnia. Sleep 2009, 32, 441. [Google Scholar] [CrossRef] [Green Version]
- Johnson, E.O.; Kamilaris, T.C.; Chrousos, G.P.; Gold, P.W. Mechanisms of stress: A dynamic overview of hormonal and behavioral homeostasis. Neurosci. Biobehav. Rev. 1992, 16, 115–130. [Google Scholar] [CrossRef]
- La Rovere, M.T.; Christensen, J.H. The autonomic nervous system and cardiovascular disease: Role of n-3 PUFAs. Vasc. Pharmacol. 2015, 71, 1–10. [Google Scholar] [CrossRef] [PubMed]
- The Textbook Compilation Committee of Neuropsychiatry of Oriental Medical Schools in Nation, the Neuropsychiatry of Oriental Medicine; Jipmoondang Pub. Co.: Seoul, Korea, 2012; p. 390. ISBN 978893031714693510.
- Aarabi, G.; Schnabel, R.B.; Heydecke, G.; Seedorf, U. Potential impact of oral inflammations on cardiac functions and atrial fibrillation. Biomolecules 2018, 8, 66. [Google Scholar] [CrossRef] [PubMed] [Green Version]
- Lockhart, P.B.; Brennan, M.T.; Sasser, H.C.; Fox, P.C.; Paster, B.J.; Bahrani-Mougeot, F.K. Bacteremia associated with tooth brushing and dental extraction. Circulation 2008, 117, 3118. [Google Scholar] [CrossRef] [Green Version]
- Kapil, V.; Haydar, S.M.; Pearl, V.; Lundberg, J.O.; Weitzberg, E.; Ahluwalia, A. Physiological role for nitrate-reducing oral bacteria in blood pressure control. Free Radic. Biol. Med. 2013, 55, 93–100. [Google Scholar] [CrossRef] [Green Version]
- Maher, A.R.; Milsom, A.B.; Gunaruwan, P.; Abozguia, K.; Ahmed, I.; Weaver, R.A.; Thomas, P.; Ashrafian, H.; Born, G.V.; James, P.E. Hypoxic modulation of exogenous nitrite-induced vasodilation in humans. Circulation 2008, 117, 670–677. [Google Scholar] [CrossRef] [Green Version]
- Chhibber-Goel, J.; Singhal, V.; Bhowmik, D.; Vivek, R.; Parakh, N.; Bhargava, B.; Sharma, A. Linkages between oral commensal bacteria and atherosclerotic plaques in coronary artery disease patients. NPJ Biofilms Microbiomes 2016, 2, 1–13. [Google Scholar] [CrossRef]
- Kim, J.; Son, J.; Jang, S.; Nam, D.-H.; Han, G.; Yeo, I.; Ko, S.-J.; Park, J.-W.; Ryu, B.; Kim, J. Availability of tongue diagnosis system for assessing tongue coating thickness in patients with functional dyspepsia. Evid.-Based Complementary Altern. Med. 2013, 2013, 348272. [Google Scholar] [CrossRef]
- Hong, Y.-S. Smart Tongue Electronic Chart System. J. Inst. Internetbroadcasting Commun. 2012, 12, 243–249. [Google Scholar] [CrossRef]
- Kim, J.; Han, G.; Ko, S.-J.; Nam, D.-H.; Park, J.-W.; Ryu, B.; Kim, J. Tongue diagnosis system for quantitative assessment of tongue coating in patients with functional dyspepsia: A clinical trial. J. Ethnopharmacol. 2014, 155, 709–713. [Google Scholar] [CrossRef]
- Kim, S.-R.; Choi, W.; Yeo, I.; Nam, D.-H. Comparative analysis of tongue indices between patients with and without a self-reported yin deficiency: A cross-sectional study. Evid.-Based Complementary Altern. Med. 2017, 2017, 1279052. [Google Scholar] [CrossRef]
- Jiang, B.; Liang, X.; Chen, Y.; Ma, T.; Liu, L.; Li, J.; Jiang, R.; Chen, T.; Zhang, X.; Li, S. Integrating next-generation sequencing and traditional tongue diagnosis to determine tongue coating microbiome. Sci. Rep. 2012, 2, 936. [Google Scholar] [CrossRef] [PubMed] [Green Version]
- Ye, J.; Cai, X.; Yang, J.; Sun, X.; Hu, C.; Xia, J.; Shen, J.; Su, K.; Yan, H.; Xu, Y. Bacillus as a potential diagnostic marker for yellow tongue coating. Sci. Rep. 2016, 6, 32496. [Google Scholar] [CrossRef] [PubMed] [Green Version]
- Yang, X.-Q.; Liu, L.; Ming, S.-P.; Fang, J.; Wu, D.-N. Tian Wang Bu Xin Dan for Insomnia: A Systematic Review of Efficacy and Safety. Evid.-Based Complementary Altern. Med. 2019, 2019, 4260801. [Google Scholar] [CrossRef] [PubMed] [Green Version]
- Xu, Y.-R.; Li, M.-X.; Gao, J.-G. Dietary supplements and insomnia. Curr. Top. Nutraceuticals Res. 2014, 12, 51–55. [Google Scholar]
- Cho, Y.-S.; Kim, B.-K. Effects of Tianwangbuxin-dan, Wendan-tang, Guipi-tang on the expression of MT 1 and MT 2 melatonin receptors in C6 glial cells. J. Orient. Neuropsychiatry 2010, 21, 103–123. [Google Scholar]
- World Medical Association. World Medical Association Declaration of Helsinki: Ethical principles for medical research involving human subjects. J. Am. Coll. Dent. 2014, 81, 14. [Google Scholar]
- Lee, H.-S.; Kim, H.; Yun, Y.-G.; Lee, S.; Jeon, J.-H.; Kim, B.-K.; Lee, E.J.; Jung, I.C. Preliminary Study to Develop the Instrument on Pattern Identifications for Insomnia. J. Orient. Neuropsychiatry 2016, 27, 223–234. [Google Scholar] [CrossRef]
- Jeong, J.-H.; Lee, J.-Y.; Kim, J.-Y.; Kim, S.-Y.; Kang, W.-C.; Lim, J.H.; Kim, B.K.; Jung, I.C. A Pilot Study of Evaluating the Reliability and Validity of Pattern Identification Tool for Insomnia and Analyzing Correlation with Psychological Tests. J. Orient. Neuropsychiatry 2020, 31, 1–12. [Google Scholar]
- Morin, C.M.; Belleville, G.; Belanger, L.; Ivers, H. The Insomnia Severity Index: Psychometric indicators to detect insomnia cases and evaluate treatment response. Sleep 2011, 34, 601–608. [Google Scholar] [CrossRef] [PubMed] [Green Version]
- Lundgren, T.; Mobilia, A.; Hallstrom, H.; Egelberg, J. Evaluation of tongue coating indices. Oral. Dis. 2007, 13, 177–180. [Google Scholar] [CrossRef]
- Kaufman, L.; Rousseeuw, P.J. Clustering by means of medoids. In Statistical Data Analysis Based on the L1 Norm; Dodge, Y., Ed.; 1987; pp. 405–416. [Google Scholar]
- Caliński, T.; Harabasz, J. A dendrite method for cluster analysis. Commun. Stat. Theory Methods 1974, 3, 1–27. [Google Scholar] [CrossRef]
- Lee, D.-W.; Kim, B.-K. Study on the association of DSOM pathogenic factor in the insomnia patients. J. Orient. Neuropsychiatry 2010, 21, 89–108. [Google Scholar]
- Lin, S.-C.; Huang, M.-L.; Liu, S.-J.; Huang, Y.-F.; Chiang, S.-C.; Chen, M.-F. Severity of Yin deficiency syndrome and autonomic nervous system function in cancer patients. J. Altern. Complementary Med. 2009, 15, 87–91. [Google Scholar] [CrossRef]
- Liu, S.J.; ZM, W.C.; Gu, Y.; Sun, K.M. Clinical Observation of Treating Insomnia of Yin-deficiency and Fire-hyperactivity Syndrome by Tianwang Buxin Tablets. J. Laioning Univ. TCM 2017, 19, 21–24. [Google Scholar]
- Dewhirst, F.E.; Chen, T.; Izard, J.; Paster, B.J.; Tanner, A.C.; Yu, W.-H.; Lakshmanan, A.; Wade, W.G. The human oral microbiome. J. Bacteriol. 2010, 192, 5002–5017. [Google Scholar] [CrossRef] [Green Version]
- Segata, N.; Haake, S.K.; Mannon, P.; Lemon, K.P.; Waldron, L.; Gevers, D.; Huttenhower, C.; Izard, J. Composition of the adult digestive tract bacterial microbiome based on seven mouth surfaces, tonsils, throat and stool samples. Genome Biol. 2012, 13, R42. [Google Scholar] [CrossRef] [PubMed] [Green Version]
- Lu, H.; Ren, Z.; Li, A.; Zhang, H.; Jiang, J.; Xu, S.; Luo, Q.; Zhou, K.; Sun, X.; Zheng, S. Deep sequencing reveals microbiota dysbiosis of tongue coat in patients with liver carcinoma. Sci. Rep. 2016, 6, 33142. [Google Scholar] [CrossRef] [Green Version]
- Han, S.; Yang, X.; Qi, Q.; Pan, Y.; Chen, Y.; Shen, J.; Liao, H.; Ji, Z. Potential screening and early diagnosis method for cancer: Tongue diagnosis. Int. J. Oncol. 2016, 48, 2257–2264. [Google Scholar] [CrossRef] [Green Version]
- Cui, J.; Cui, H.; Yang, M.; Du, S.; Li, J.; Li, Y.; Liu, L.; Zhang, X.; Li, S. Tongue coating microbiome as a potential biomarker for gastritis including precancerous cascade. Protein Cell 2019, 10, 496–509. [Google Scholar] [CrossRef] [Green Version]
- Liu, M.; Wang, X.; Wu, F.; Dai, N.; Chen, M.; Yu, J.; Guan, J.; Li, F. Variations of Oral Microbiome in Chronic Insomnia Patients with Different Tongue Features. Am. J. Chin. Med. 2020, 48, 923–944. [Google Scholar] [CrossRef] [PubMed]
- Wu, B.G.; Sulaiman, I.; Wang, J.; Shen, N.; Clemente, J.C.; Li, Y.; Laumbach, R.J.; Lu, S.-E.; Udasin, I.; Le-Hoang, O. Severe obstructive sleep apnea is associated with alterations in the nasal microbiome and an increase in inflammation. Am. J. Respir. Crit. Care Med. 2019, 199, 99–109. [Google Scholar] [CrossRef] [PubMed]
- Ren, W.; Xun, Z.; Wang, Z.; Zhang, Q.; Liu, X.; Zheng, H.; Zhang, Q.; Zhang, Y.; Zhang, L.; Wu, C. Tongue coating and the salivary microbial communities vary in children with halitosis. Sci. Rep. 2016, 6, 24481. [Google Scholar] [CrossRef] [Green Version]
- Yamamoto, T.; Kajiura, S.; Hirai, Y.; Watanabe, T. Capnocytophaga haemolytica sp. nov. and Capnocytophaga granulosa sp. nov., from human dental plaque. Int. J. Syst. Evol. Microbiol. 1994, 44, 324–329. [Google Scholar] [CrossRef]
- Lombardo Bedran, T.B.; Marcantonio, R.A.C.; Spin Neto, R.; Alves Mayer, M.P.; Grenier, D.; Spolidorio, L.C.; Spolidorio, D.P. Porphyromonas endodontalis in chronic periodontitis: A clinical and microbiological cross-sectional study. J. Oral Microbiol. 2012, 4, 10123. [Google Scholar] [CrossRef] [Green Version]
- Signat, B.; Roques, C.; Poulet, P.; Duffaut, D. Role of Fusobacterium nucleatum in periodontal health and disease. Curr. Issues Mol. Biol. 2011, 13, 25–36. [Google Scholar] [PubMed]
- Tsuzukibashi, O.; Uchibori, S.; Shinozaki-Kuwahara, N.; Kobayashi, T.; Takada, K.; Hirasawa, M. A selective medium for the isolation of Corynebacterium species in oral cavities. J. Microbiol. Methods 2014, 104, 67–71. [Google Scholar] [CrossRef]
- Gutierrez-Martin, M.A.; Araji, O.A.; Barquero, J.M.; Velázquez, C.; García-Borbolla, M.; Gallego, P.; Infantes, C.A. Aortic valve endocarditis by Capnocytophaga haemolytica. Ann. Thorac. Surg. 2007, 84, 1008–1010. [Google Scholar] [CrossRef] [PubMed]
- Periasamy, S.; Kolenbrander, P.E. Central role of the early colonizer Veillonella sp. in establishing multispecies biofilm communities with initial, middle, and late colonizers of enamel. J. Bacteriol. 2010, 192, 2965–2972. [Google Scholar] [CrossRef] [PubMed] [Green Version]
- Tanner, A.; Kressirer, C.; Faller, L. Understanding Caries from the Oral Microbiome Perspective. J. Calif. Dent. Assoc. 2016, 44, 437–446. [Google Scholar]
- Khalyfa, A.; Poroyko, V.A.; Qiao, Z.; Gileles-Hillel, A.; Khalyfa, A.A.; Akbarpour, M.; Almendros, I.; Farré, R.; Gozal, D. Exosomes and metabolic function in mice exposed to alternating dark-light cycles mimicking night shift work schedules. Front. Physiol. 2017, 8, 882. [Google Scholar] [CrossRef] [PubMed]
- Moreno-Indias, I.; Torres, M.; Montserrat, J.M.; Sanchez-Alcoholado, L.; Cardona, F.; Tinahones, F.J.; Gozal, D.; Poroyko, V.A.; Navajas, D.; Queipo-Ortuño, M.I. Intermittent hypoxia alters gut microbiota diversity in a mouse model of sleep apnoea. Eur. Respir. J. 2015, 45, 1055–1065. [Google Scholar] [CrossRef] [PubMed] [Green Version]
- Grosicki, G.J.; Riemann, B.L.; Flatt, A.A.; Valentino, T.; Lustgarten, M.S. Self-Reported Sleep Quality Is Associated With Gut Microbiome Composition in Young, Healthy Individuals: A Pilot Study. Sleep Med. 2020, 73, 76–81. [Google Scholar] [CrossRef]
- Yamashita, Y.; Takeshita, T. The oral microbiome and human health. J. Oral Sci. 2017, 59, 201–206. [Google Scholar] [CrossRef] [Green Version]
- Gomez-Arango, L.F.; Barrett, H.L.; McIntyre, H.D.; Callaway, L.K.; Morrison, M.; Nitert, M.D. Contributions of the maternal oral and gut microbiome to placental microbial colonization in overweight and obese pregnant women. Sci. Rep. 2017, 7, 1–10. [Google Scholar]
- Dewhirst, F.E.; Paster, B.J.; Bright, P.L. Chromobacterium, Eikenella, Kingella, Neisseria, Simonsiella, and Vitreoscilla species comprise a major branch of the beta group Proteobacteria by 16S ribosomal ribonucleic acid sequence comparison: Transfer of Eikenella and Simonsiella to the family Neisseriaceae (emend.). Int. J. Syst. Evol. Microbiol. 1989, 39, 258–266. [Google Scholar]
- Hauan, M.; Strand, L.B.; Laugsand, L.E. Associations of insomnia symptoms with blood pressure and resting heart rate: The HUNT study in Norway. Behav. Sleep Med. 2018, 16, 504–522. [Google Scholar] [CrossRef] [PubMed]
- Horsley, K.J.; Rouleau, C.R.; Garland, S.N.; Samuels, C.; Aggarwal, S.G.; Stone, J.A.; Arena, R.; Campbell, T.S. Insomnia symptoms and heart rate recovery among patients in cardiac rehabilitation. J. Behav. Med. 2016, 39, 642–651. [Google Scholar] [CrossRef] [PubMed]
- Task Force of the European Society of Cardiology the North American Society of Pacing Electrophysiology. Heart rate variability: Standards of measurement, physiological interpretation, and clinical use. Circulation 1996, 93, 1043–1065. [Google Scholar] [CrossRef] [Green Version]
- Kim, W.; Woo, J.-M.; Chae, J.-H. Heart rate variability in psychiatry. J. Korean Neuropsychiatr. Assoc. 2005, 44, 176–184. [Google Scholar]
- Verma, D.; Garg, P.K.; Dubey, A.K. Insights into the human oral microbiome. Arch. Microbiol. 2018, 200, 525–540. [Google Scholar] [CrossRef] [PubMed]
- Seerangaiyan, K.; van Winkelhoff, A.J.; Harmsen, H.J.; Rossen, J.W.; Winkel, E.G. The tongue microbiome in healthy subjects and patients with intra-oral halitosis. J. Breath Res. 2017, 11, 036010. [Google Scholar] [CrossRef]
- Chen, H.; Jiang, W. Application of high-throughput sequencing in understanding human oral microbiome related with health and disease. Front. Microbiol. 2014, 5, 508. [Google Scholar] [CrossRef] [PubMed] [Green Version]
- Wlodarska, M.; Luo, C.; Kolde, R.; d’Hennezel, E.; Annand, J.W.; Heim, C.E.; Krastel, P.; Schmitt, E.K.; Omar, A.S.; Creasey, E.A. Indoleacrylic acid produced by commensal peptostreptococcus species suppresses inflammation. Cell Host Microbe 2017, 22, 25–37.e6. [Google Scholar] [CrossRef] [Green Version]
- Van Stralen, K.J.; Stel, V.S.; Reitsma, J.B.; Dekker, F.W.; Zoccali, C.; Jager, K.J. Diagnostic methods I: Sensitivity, specificity, and other measures of accuracy. Kidney Int. 2009, 75, 1257–1263. [Google Scholar] [CrossRef] [PubMed] [Green Version]
- Schünemann, H.J.; Oxman, A.D.; Brozek, J.; Glasziou, P.; Jaeschke, R.; Vist, G.E.; Williams, J.W., Jr.; Kunz, R.; Craig, J.; Montori, V.M. Rating Quality of Evidence and Strength of Recommendations: GRADE: Grading quality of evidence and strength of recommendations for diagnostic tests and strategies. BMJ Br. Med. J. 2008, 336, 1106. [Google Scholar] [CrossRef] [PubMed] [Green Version]
- Jia, G.; Zhi, A.; Lai, P.; Wang, G.; Xia, Y.; Xiong, Z.; Zhang, H.; Che, N.; Ai, L. The oral microbiota—A mechanistic role for systemic diseases. Br. Dent. J. 2018, 224, 447–455. [Google Scholar] [CrossRef] [PubMed]


| Botanical Name | Amount (mg) |
|---|---|
| Rehmanniae radix | 500 |
| Coptidis rhizoma | 250 |
| Angelicae gigantis radix | 125 |
| Asparagi radix | 125 |
| Schisandrae fructus | 125 |
| Biotae semen | 125 |
| Ziziphi spinosae semen | 125 |
| Liriopis tuber | 125 |
| Ginseng radix | 62.5 |
| Hoelen | 62.5 |
| Platycodi radix | 62.5 |
| Polygalae radix | 62.5 |
| Scrophulariae radix | 62.5 |
| Salviae miltiorrhizae radix | 62.5 |
| Variables | HYD (n = 17) | NHYD (n = 39) | p Value * |
|---|---|---|---|
| Gender, No. (male/female) | 2/15 | 7/32 | 0.707 † |
| Drinking, No. (yes/no) | 5/12 | 16/23 | 0.409 †† |
| Smoking, No. (yes/no) | 2/15 | 2/37 | 0.577 † |
| Caffeine, No. (yes/no) | 10/7 | 22/17 | 0.867 †† |
| Age (years) | 48.41 ± 9.49 | 51.38 ± 9.14 | 0.391 |
| BMI (kg/m2) | 23.22 ± 2.59 | 22.47 ± 2.60 | 0.325 |
| BDI | 15.65 ± 6.12 | 10.72 ± 5.80 | 0.007 |
| ISI | 20.94 ± 4.78 | 17.82 ± 5.00 | 0.034 |
| PSQI | 14.35 ± 2.94 | 12.56 ± 3.77 | 0.088 |
| Systolic BP (mmHg) | 121.41 ± 15.80 | 122.97 ± 12.73 | 0.696 |
| Diastolic BP (mmHg) | 71.94 ± 11.32 | 73.69 ± 8.45 | 0.524 |
| Pulse rate (/min) | 79.71 ± 11.08 | 74.82 ± 9.23 | 0.092 |
| Characteristics | Orotype 1 (n = 20) | Orotype 2 (n = 26) | Between Group p Value * |
|---|---|---|---|
| Gender, No. (male/female) | 3/17 | 4/22 | 1.000 † |
| Drinking, No. (yes/no) | 8/12 | 8/18 | 0.515 †† |
| Smoking, No. (yes/no) | 3/17 | 0/26 | 0.075 † |
| Caffeine, No. (yes/no) | 13/7 | 15/11 | 0.615 †† |
| Age (years) | 48.50 ± 11.95 | 51.08 ± 7.56 | 0.406 |
| BMI (kg/m2) | 22.92 ± 2.64 | 22.97 ± 2.07 | 0.945 |
| BDI | 14.10 ± 7.35 | 11.65 ± 5.71 | 0.227 |
| ISI | 19.55 ± 5.12 | 18.12 ± 5.71 | 0.382 |
| PSQI | 14.30 ± 3.26 | 11.69 ± 3.77 | 0.018 * |
| Systolic BP (mmHg) | 122.40 ± 15.00 | 116.19 ± 12.62 | 0.135 |
| Diastolic BP (mmHg) | 74.60 ± 11.74 | 69.50 ± 8.33 | 0.092 |
| Pulse rate (/min) | 77.50 ± 6.75 | 72.23 ± 9.77 | 0.036 * |
Publisher’s Note: MDPI stays neutral with regard to jurisdictional claims in published maps and institutional affiliations. |
© 2021 by the authors. Licensee MDPI, Basel, Switzerland. This article is an open access article distributed under the terms and conditions of the Creative Commons Attribution (CC BY) license (https://creativecommons.org/licenses/by/4.0/).
Share and Cite
Kim, M.-J.; Bose, S.; Shin, N.-R.; Park, S.; Kwon, O.; Song, E.-J.; Nam, Y.-D.; Koo, B.-S.; Nam, D.-H.; Lee, J.-H.; et al. The Herbal Formula CWBSD Improves Sleep Quality Dependent on Oral Microbial Type and Tongue Diagnostic Features in Insomnia. J. Pers. Med. 2021, 11, 325. https://doi.org/10.3390/jpm11050325
Kim M-J, Bose S, Shin N-R, Park S, Kwon O, Song E-J, Nam Y-D, Koo B-S, Nam D-H, Lee J-H, et al. The Herbal Formula CWBSD Improves Sleep Quality Dependent on Oral Microbial Type and Tongue Diagnostic Features in Insomnia. Journal of Personalized Medicine. 2021; 11(5):325. https://doi.org/10.3390/jpm11050325
Chicago/Turabian StyleKim, Min-Jee, Shambhunath Bose, Na-Rae Shin, Seohyun Park, Ojin Kwon, Eun-Ji Song, Young-Do Nam, Byung-Soo Koo, Dong-Hyun Nam, Jun-Hwan Lee, and et al. 2021. "The Herbal Formula CWBSD Improves Sleep Quality Dependent on Oral Microbial Type and Tongue Diagnostic Features in Insomnia" Journal of Personalized Medicine 11, no. 5: 325. https://doi.org/10.3390/jpm11050325